measurement of dynamic properties of stiff specimens … · de moins de 1 % apre`s que les mesures...
TRANSCRIPT

Measurement of dynamic properties of stiffspecimens using ultrasonic waves
Zahid Khan, Giovanni Cascante, and M. Hesham El Naggar
Abstract: The measurement of low-strain properties (wave velocity and damping ratio) of geomaterials is affected byequipment-generated delays, coupling of transducers, and wave reflections. This study presents a new technique to measureultrasonic properties of stiff specimens accurately. Compressional-wave velocities in cylindrical rods of different lengthsand materials were measured using different ultrasonic equipment. The error induced by different equipment was below1% after the measurements were corrected by the equipment time delay. Shear-wave velocities of different materials weremeasured using ultrasonic transducers (frequency < 1 MHz) and a resonant column device (frequency < 200 Hz). The dif-ference in shear-wave velocities was less than 4%, and the measured values are in agreement with published results for alltested materials. A new methodology based on the first two reflections of the main pulse has been developed to measurethe damping ratio of stiff specimens using ultrasonic equipment. The ultrasonic measurements of the damping ratio com-pare well with resonant column results. A more reliable determination of the dynamic Poisson’s ratio of a cemented sandwas achieved using corrected ultrasonic-wave velocities.
Key words: wave velocity, material damping ratio, cemented sands, resonant column, ultrasonic testing, dynamic Poisson’sratio.
Resume : La mesure des proprietes en faible deformation des geomateriaux (vitesse des ondes et rapport d’amortissement)est affectee par les delais generes par les equipements de mesure, le couplage des capteurs et par les reflexions des ondes.Cette etude presente une nouvelle technique pour mesurer precisement les proprietes ultrasoniques d’echantillons rigides.Differents equipements ultrasoniques ont ete utilises pour mesurer les vitesses des ondes de compression dans des barrescylindriques de differentes longueurs et faites de materiaux differents. L’erreur induite par les differents equipements etaitde moins de 1 % apres que les mesures aient ete corrigees pour le delai des equipements. Les vitesses des ondes de cisail-lement de materiaux differents ont ete mesurees a l’aide de capteurs ultrasoniques (frequence de < 1 MHz) et d’une co-lonne de resonance (frequence de < 200 Hz). La difference entre les vitesses des ondes de cisaillement etait de moins de4 %, et les valeurs mesurees correspondent bien avec les resultats publies pour tous les materiaux testes. Une nouvelle me-thodologie basee sur les deux premieres reflexions de l’impulsion principale est developpee dans le but de mesurer le rap-port d’amortissement d’echantillons rigides a partir d’un appareil ultrasonique. Les mesures du rapport d’amortissementfaites a l’aide de la facon ultrasonique se comparent bien aux mesures obtenues avec des colonnes de resonance. Le ratiodynamique de Poisson d’un sable cimente a pu etre determine de facon plus fiable a l’aide des vitesses corrigees des ondesultrasoniques.
Mots-cles : vitesse des ondes, rapport d’amortissement des materiaux, sables cimentes, colonne de resonance, essais ultra-soniques, ratio dynamique de Poisson.
[Traduit par la Redaction]
IntroductionDynamic properties (wave velocity and damping ratio) of
stiff specimens such as cemented sands are difficult to meas-ure using a resonant column (RC) device. Conversely, ultra-
sonic measurements of compressional and shear-wavevelocities are simple, but the evaluation of the materialdamping ratio is cumbersome. Ultrasonic testing is widelyused for the measurement of elastic properties of materials,assessment of concrete quality, and indirect measurement ofstrength (Naik and Malhotra 1991; Popovics and Rose 1994;ASTM 2002a). In ultrasonic testing, a transmitter generateshigh-frequency pulses (frequency, f > 20 kHz) that travelthrough the material and are detected by a receiver. Thetravel time of the first wave arrival is precisely measuredwith electronic equipment and wave velocity is simply com-puted as distance over time. However, many sources of erroraffect ultrasonic measurements.
In short specimens, variations in arrival time producemagnified changes in wave velocity. These errors resultfrom subjective selection of the arrival time, resolution ofelectronic equipment, and the inherent time delay of the ul-trasonic system (ASTM 1997; Leong et al. 2004). Subtract-
Received 8 April 2010. Accepted 26 April 2010. Published onthe NRC Research Press Web site at cgj.nrc.ca on 23 November2010.
Z. Khan. Department of Civil Engineering, AmericanUniversity of Sharjah, Sharjah, UAE.G. Cascante.1 Department of Civil Engineering, University ofWaterloo, 200 University Avenue West, Waterloo, ON N2L3G1, Canada.M.H. El Naggar. Department of Civil and EnvironmentalEngineering, The University of Western Ontario, London, ONN6A 5B9, Canada.
1Corresponding author (e-mail: [email protected]).
1
Can. Geotech. J. 48: 1–15 (2011) doi:10.1139/T10-040 Published by NRC Research Press
Can
. Geo
tech
. J. D
ownl
oade
d fr
om w
ww
.nrc
rese
arch
pres
s.co
m b
y U
nive
rsity
of
Wes
tern
Ont
ario
on
02/2
8/13
For
pers
onal
use
onl
y.

ing this time delay from measurements does not guaranteean accurate velocity measurement, as the accuracy of themeasurements also depends on the transducer–specimencoupling.
The shear-wave velocity and damping ratio can be meas-ured at low frequencies ( f < 200 Hz) using an RC device(ASTM 2000). For an elastic material (e.g., wave velocityindependent of frequency), results from ultrasonic and RCtests should match because of the small shear strains in-volved in both tests (shear strain, g < 10–6).
The spectral ratio method has been proposed for measur-ing material damping of geomaterials using ultrasonic tests(Toksoz et al. 1979; Campanella et al. 1994). However,these measurements are affected by wave reflections, char-acteristics of the transducers, and the selected time window.In RC testing, material damping is measured directly fromthe resonant curve of the specimen; however, it is overesti-mated for stiff specimens (e.g., cemented soils and stiffclays) because of the equipment-generated damping and thelack of fixidity at the base of the RC device (Khan et al.2008).
The focus of this study is to present simple procedures forreliable evaluation of the wave velocity and damping ratioof stiff soils using ultrasonic testing. The dynamic Poisson’sratio is also evaluated from the compressional and shear-wave velocities. The sources of error in ultrasonic testingare identified and correction procedures are provided. Anew methodology is proposed for the evaluation of materialdamping ratio in stiff soils using the first and second echoesof an ultrasonic pulse.
Theoretical background
Wave velocityPulse velocity measurements depend not only on the pre-
cision of the equipment, but also on its electronic and me-chanical characteristics (e.g., response time and transferfunction). Thus, different values of wave velocity are ob-tained if different combinations of transducers and electronicequipment are used. The time delay produced by the re-sponse time of electronic equipment (system delay) is com-monly measured by the face-to-face (F-t-F) calibrationprocedure or by the measurement of arrival times for differ-ent lengths of specimens (Leong et al. 2004). The linear-re-gression intercept of the plot of arrival times versusspecimen lengths gives the system delay. Once the systemdelay is evaluated, the measured arrival times for any speci-men must be corrected by subtracting the system delay.
The longitudinal wave velocity (VP) approaches the barvelocity (VL) when the frequency of the plane wave travel-ing in the cylindrical bar is low (Bancroft 1941). The barvelocity is related to Young’s modulus, E, and the massdensity, r, of the medium (i.e., VL ¼
ffiffiffiffiffiffiffiE=r
p) and can be re-
liably measured when the ratio of the bar radius to thewavelength is smaller than 0.12. However, ultrasonic trans-ducers excite the specimen as a point source and the firstwave arrival corresponds to the arrival of compressional orp-waves (Mason 1958; Zemanek 1962). For homogeneousand elastic materials, VP (related to constraint modulus, M;VP ¼
ffiffiffiffiffiffiffiffiffiM=r
p) and VS (related to the shear modulus, G;
VS ¼ffiffiffiffiffiffiffiffiG=r
p) are frequency independent (Kolsky 1963).
Shear-wave velocity measurements can be significantlyaffected by direct and (or) reflected p-waves. The detectionof s-waves can be improved by enhancing the transducer–specimen coupling. Shear-wave velocities can be measuredusing RC tests at frequencies smaller than 200 Hz (ASTM2000; Khan et al. 2008). Cylindrical specimens are excitedin torsion to generate shear waves. The approximate solutionfor the shear-wave velocity (VS) in RC testing using the Ra-leigh method is (Cascante and Santamarina 1997)
½1� VS ¼ffiffiffiffiffiffiffiffiffiffiffiffiffiffiffiffiffiffiffiffiffiffiffiffiffiffiffiffiffiffiffiffiffiffiffiffiffiffiffiffiffiffiffiffiffiu2
o½ð0:33I þ IoÞL�=½JPr�q
where uo is the angular resonant frequency; I and JP are themass polar moment of inertia and the area polar moment ofinertia of the specimen, respectively; L and r are the heightand mass density of the specimen, respectively; and Io is themass polar moment of inertia of the driving plate.
Dynamic Poisson’s ratioThe dynamic Poisson’s ratio can be measured using the
resonance method or by the simultaneous evaluation of atleast two types of wave velocities (Swamy 1971; Achen-bach 1973; Naik and Malhotra 1991). The resonancemethod (ASTM 2002b) requires specimens of differentsizes (i.e., different resonant frequencies). This method gen-erates different elastic moduli and Poisson’s ratios for thesame material because the excited mode of vibrationchanges with the change in specimen geometry (Kesler andHiguchi 1954; Malhotra and Sivasundaram 1991). On theother hand, the evaluation of Poisson’s ratio from compres-sional and shear-wave velocities is limited because of in-herent difficulties in the measurement of travel times whenshear waves cannot be generated with enough amplitude.The relationship between compressional, VP, and shear, VS,wave velocities as a function of Poisson’s ratio, n, is givenby
½2� VP
VS
¼ffiffiffiffiffiffiffiffiffiffiffiffiffiffiffiffiffi2ð1� nÞð1� 2nÞ
r
AttenuationIn ultrasonic testing, the transmitter touches the specimen
at different points that function as point sources. Destructiveand constructive interference occur up to a certain distance(near-field zone is denoted Nf) from the source of the com-pressional waves given by (Schmerr 1998)
½3� Nf ¼d2
T f
4VP
¼ rT
lP
� �rT
where dT and rT are the diameter and radius, respectively, ofthe transducer; f is the main frequency of the ultrasonic ex-citation; VP is the compressional wave velocity of the med-ium; and lP is the wavelength at the given frequency, f.Thus, amplitude measurements within the near field couldbe inaccurate, and signals should be recorded at distancesgreater than Nf. The intensity, Ix, of compressional waves(in W/m2) beyond the near-field zone is given by (Krautk-ramer and Krautkramer 1990)
2 Can. Geotech. J. Vol. 48, 2011
Published by NRC Research Press
Can
. Geo
tech
. J. D
ownl
oade
d fr
om w
ww
.nrc
rese
arch
pres
s.co
m b
y U
nive
rsity
of
Wes
tern
Ont
ario
on
02/2
8/13
For
pers
onal
use
onl
y.

Fig. 1. (a) Ultrasonic beam spread and (b) near-field response (adapted from Krautkramer and Krautkramer 1990).
Fig. 2. (a) Equipment setup for ultrasonic measurements; (b) schematic of main wave arrival and echoes. PC, personal computer.
Khan et al. 3
Published by NRC Research Press
Can
. Geo
tech
. J. D
ownl
oade
d fr
om w
ww
.nrc
rese
arch
pres
s.co
m b
y U
nive
rsity
of
Wes
tern
Ont
ario
on
02/2
8/13
For
pers
onal
use
onl
y.

½4� Ix ¼ IT sin 2 p
l
ffiffiffiffiffiffiffiffiffiffiffiffiffiffiffiffiffiffiðr2
T þ x2Þq
� x
� �� �
where IT is the intensity at the transducer surface, l is thewavelength, and x is the distance along the ultrasonic beam.The near-field zone and the relative intensity degradationare illustrated in Fig. 1.
The attenuation coefficient of a material can be measuredby recording a propagating pulse at different locations alonga specimen, or alternatively by recording the first arrival andfirst echo or any successive echo of a propagating pulse.The latter technique involves only one transducer; however,reflections from the sample boundaries could affect the re-corded signals. Thus, the first echo of the pulse has to beproperly isolated by time windowing (Fratta and Santamar-ina 1996; Hoppe et al. 2003).
ASTM standard 1065-99 (ASTM 2003) recommends thatthe duration of an ultrasonic pulse be defined by the cumu-lative duration of signal amplitudes larger than 20% of themaximum pulse amplitude. In the frequency domain, theuseful bandwidth corresponds to frequency componentswith spectral amplitudes larger than 50% of the peak value.The damping ratio can be calculated as a function of fre-quency, D( f ), using the Fourier transform of two pulse ech-oes, U1( f ) and U2( f ), as
½5� Dð f Þ ¼ 1
Dfln
U1ð f ÞU2ð f Þ
� �
The change in the phase angle, Df, for a constant phase ve-locity, V, is
½6� Df ¼ 2p fDx
V
Then, eq. [5] can be rewritten as
½7� lnU1ð f ÞU2ð f Þ
� �¼ 2p fDx
VDð f Þ
where Dx is the distance traveled by the second echo withrespect to the first one. For elastic materials (i.e., velocityand damping ratio are frequency independent, no disper-sion), the logarithm of the spectral ratios (left-hand side ofeq. [7]) varies linearly with frequency and the slope of theline (b = 2pDxD( f )/V) can be used to compute the dampingratio. This technique is known as the spectral ratio method(SRM) (Toksoz et al. 1979).
The acoustic impedance (Z = Vr) is a measure of the op-position of material particles to move with a wave front.The amplitudes of the transmitted and reflected waves froman interface depend on the acoustic impedance differencebetween the two media. A plane wave front traveling froma medium with acoustic impedance Z1 to a medium with im-pedance Z2 experiences a decrease in amplitude because ofthe reflected energy at the interface. The amplitude reduc-tion or reflected energy (dBR, in decibels) is given by (e.g.,Blitz and Simpson 1996)
½8� dBR ¼ 20 log 10
jZ2 � Z1jZ2 þ Z1
� �
A wave reflecting from a free boundary retains its original
amplitude because the acoustic impedance of air is negligi-ble (Z2 & 0.413 kPa�s/m) compared with other materials,for example, the impedance of aluminum (16 983 kPa�s/m).
Sato et al. (2004) measured the damping ratio of a quartzcrystal fused between two high-impedance buffer rods,which are commonly used in testing materials at high tem-peratures and to reduce near-field effects in small speci-mens. They used the main pulse signal and its first echo tocompute the material attenuation using the spectral ratiomethod. However, this method does not account for the ef-fects of reflections from the high-impedance buffer rod(platinum). In addition, good coupling between soil speci-mens and metal bars is difficult. Fratta and Santamarina(1996) studied the damping ratio of dry sand in a long cylin-drical specimen (L = 158 cm) using multiple reflections of apulse (maximum frequency, fmax < 2 kHz) that was gener-ated by the impact of a ball in free fall at one end of thespecimen. The frequency of the pulse was changed bychanging the mass and material of the falling sphere.
Experimental setup and experimentalprogram
Ultrasonic and RC tests were conducted to measure thewave velocity and wave attenuation of 21 cylindrical speci-mens of aluminum, stainless steel, polyvinyl chloride (PVC),and cemented sand (cement content, cc = 15%). The diame-ter of the specimens, d, was constant at 5 cm, whereas dif-ferent lengths were used: L = 5, 7.5, 10, 12.5, 15, and20 cm.
Experiments were initially performed to calibrate the ul-trasonic equipment, followed by ultrasonic-wave velocityand attenuation measurements. RC tests were used to con-firm the ultrasonic test results.
The instrumentation used for ultrasonic testing (Fig. 2)consisted of three different pulse generators (Pundit box, apiezo-driver box, and DISP system), digital oscilloscope(HP 54610B), digital multimeter (HP 34401 A), power sup-ply (HP 3620 A), load cell (type 50 DBB, capacity 500 N),data-acquisition system (Wavebook 516E and a general pur-pose interface bus (GPIB)), and piezoelectric transducers(TB50, 50 mm diameter, 54 kHz, p-wave and s-wave1 MHz transducers, Panametrics V102-RM and V152-RM).Table 1 summarizes the different combinations of equipmentand transducers used for the ultrasonic measurements.
Compressional-wave velocity measurementsCompressional-wave velocity was computed using the
travel time of a one-cycle sinusoidal pulse and the distancebetween transducers. A frame equipped with a load cell was
Table 1. Different combinations of ultrasonic equipment.
SystemSignalgenerator
Transmitter(kHz)
Receiver(kHz)
A Pundit 50 10–500B Pundit 50 60C Pundit 50 30D Piezo-driver 50 60E Piezo-driver 70 50F DISP 1000 1000
4 Can. Geotech. J. Vol. 48, 2011
Published by NRC Research Press
Can
. Geo
tech
. J. D
ownl
oade
d fr
om w
ww
.nrc
rese
arch
pres
s.co
m b
y U
nive
rsity
of
Wes
tern
Ont
ario
on
02/2
8/13
For
pers
onal
use
onl
y.

used to maintain constant pressure on the transducers duringall tests to improve the repeatability of the results (Fig. 2). Acontact pressure of 100 kPa was used, which is relativelysmall in comparison with the strength of the specimens(larger than 4000 kPa). The contact pressure was measuredusing a load cell (Fig. 2) and the pressure was selected bymonitoring the change in travel time with contact pressure.At 70 kPa, the measured travel times remained constantafter an additional increase in pressure; thus, a 100 kPa con-tact pressure was selected for all tests. Typical time win-dowed signals and frequency spectra for compressional-wave velocity measurements are presented in Fig. 3.
The travel time between the trigger and the first arrival
was measured with the digital oscilloscope (resolution Dt =0.2 ms, where t is time). The captured waveforms weretransferred to a computer through a GPIB interface for sig-nal processing and attenuation calculations. The waveformswere recorded using different time resolutions to capture thefirst arrival, full signal, and pulse echoes. Arrival times wereplotted versus the specimen length and the slope of the best-fit line was used to compute wave velocities (VP and VS).The wave velocity computed using this procedure is referredto as slope velocity in the following sections.
Shear-wave velocity measurementsSpecimens of all materials except cemented sand were
Fig. 3. Typical time signals and frequency spectra during p-wave velocity measurements for a 1000 kHz sinusoidal excitation, L = 20 cm(system F, Table 1). (a) cemented sand (CS): L = 18 cm, (b) PVC, (c) stainless steel, and (d ) aluminum.
Khan et al. 5
Published by NRC Research Press
Can
. Geo
tech
. J. D
ownl
oade
d fr
om w
ww
.nrc
rese
arch
pres
s.co
m b
y U
nive
rsity
of
Wes
tern
Ont
ario
on
02/2
8/13
For
pers
onal
use
onl
y.

tested at low frequency (29 Hz < f < 56 Hz) in the RC de-vice. Shear-wave velocity measurements in the RC areunderestimated with the increase in the stiffness of thespecimen and the error increases linearly with the torsionalstiffness of the specimen. The measured shear-wave veloc-ities in this study have been corrected using the calibrationratio given by Khan et al. (2008)T
able
2.Su
mm
ary
ofsp
ecim
ench
arac
teri
stic
s,ul
tras
onic
atte
nuat
ion,
and
velo
city
mea
sure
men
ts.
Spec
imen
Len
gth
ofbu
ffer
rod
(cm
)D
x(c
m)*
Dy
(cm
){
Spec
imen
leng
th,
L(c
m)
Mas
sde
nsity
(kg/
m3 )
Dia
met
er(c
m)
Puls
efr
eque
ncy
(kH
z)
Max
.w
avel
engt
h(c
m)
Nea
rfi
eld
(cm
)D
ampi
ngra
tio(%
){D
ampi
ngra
tio(%
)§V
eloc
ity(m
/s){
Vel
ocity
(m/s
)§
CS
12.5
1027
.55
—5
300
0.91
3.46
0.31
——
—0.
09.
213
.84.
616
5315
200
0.91
3.46
0.32
—21
85—
PVC
12.5
1027
.55
—5
300
1.15
3.16
0.56
——
2350
0.0
7.6
11.4
3.8
1400
1030
01.
153.
160.
390.
6822
94—
Stee
l0.
05.
07.
52.
577
9015
1100
1.24
3.60
0.07
0.04
5688
5725
Alu
min
um0.
017
.626
.48.
827
0018
1100
0.9
3.20
0.02
0.03
6290
6320
*Dis
tanc
etr
avel
led
byse
cond
echo
afte
rar
riva
lof
firs
tec
ho.
{ Dis
tanc
etr
avel
led
byth
efi
rst
echo
afte
rtr
igge
r.{ M
easu
red
valu
e:da
mpi
ng:
spec
tral
ratio
met
hod
(eq.
[7])
;ve
loci
ty:
slop
eof
trav
eltim
eve
rsus
leng
th.
§ Val
uefr
omth
elit
erat
ure
(ASN
T19
87;
Kra
utkr
amer
and
Kra
utkr
amer
1990
;K
aye
and
Lab
y19
95;
Ger
cek
2006
;da
mpi
ngra
tios
from
RC
test
sof
this
stud
y).
Fig. 4. Typical time-windowed echoes and corresponding Fourierspectra. The source was a 300 kHz single sinusoidal pulse (PVCspecimen, Dx = 3.8 cm). (a) Original signal; (b) windowed signal;(c) Fourier spectrum of windowed echoes.
Fig. 5. Scanning electron microscopic image for fine sand at 300�.
6 Can. Geotech. J. Vol. 48, 2011
Published by NRC Research Press
Can
. Geo
tech
. J. D
ownl
oade
d fr
om w
ww
.nrc
rese
arch
pres
s.co
m b
y U
nive
rsity
of
Wes
tern
Ont
ario
on
02/2
8/13
For
pers
onal
use
onl
y.
½9� VSmeasured
VSspecimen
¼ �0:62k1
k2
� �þ 1
where k1 and k2 are the torsional stiffnesses of the specimenand base of the RC device, respectively. The torsional stiff-ness of the RC base was determined experimentally usingmore than 17 calibration probes; the torsional stiffness ofthe specimen, k1, was computed from the measured resonantfrequency and the geometrical properties of the specimen
using a two-degrees-of-freedom model. The reliability ofthe stiffness correction is demonstrated by Khan et al.(2008). The RC device used in this study was calibrated upto a stiffness ratio, k1/k2, of 0.2. The stiffness ratios for thePVC, steel, and aluminum specimens are smaller than 0.02and the measured velocities were underestimated by lessthan 2%. The stiffness ratio for the cemented sand specimenis k1/k2 = 0.5, which is larger than the calibration limit.Therefore, the shear velocity of the cemented sand specimen
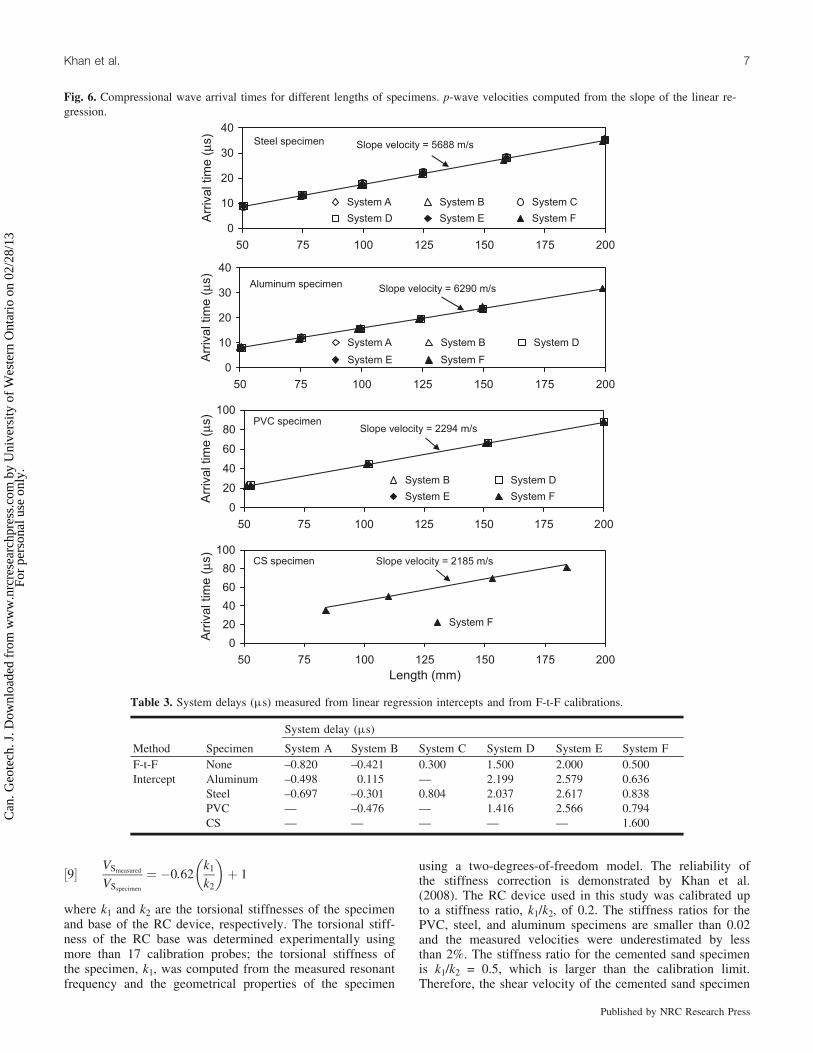
Fig. 6. Compressional wave arrival times for different lengths of specimens. p-wave velocities computed from the slope of the linear re-gression.
Table 3. System delays (ms) measured from linear regression intercepts and from F-t-F calibrations.
System delay (ms)
Method Specimen System A System B System C System D System E System FF-t-F None –0.820 –0.421 0.300 1.500 2.000 0.500Intercept Aluminum –0.498 0.115 — 2.199 2.579 0.636
Steel –0.697 –0.301 0.804 2.037 2.617 0.838PVC — –0.476 — 1.416 2.566 0.794CS — — — — — 1.600
Khan et al. 7
Published by NRC Research Press
Can
. Geo
tech
. J. D
ownl
oade
d fr
om w
ww
.nrc
rese
arch
pres
s.co
m b
y U
nive
rsity
of
Wes
tern
Ont
ario
on
02/2
8/13
For
pers
onal
use
onl
y.

was corrected assuming that the linear degradation of shearvelocity is valid and the measured shear velocity is underes-timated by 30%. All the calibration probes were connectedto the RC with screws, whereas the coupling of cementedsand specimens with RC platens was achieved by using anepoxy resin.
RC tests were performed first using a broadband (500 Hzspan) random noise excitation to determine the resonant fre-quency. A narrow band sinusoidal sweep excitation (50 to100 Hz span) was then used to obtain precise values of theresonant frequency and damping ratio from the transferfunction. A sinusoidal sweep excitation was chosen as ityields smooth transfer functions in three to four averagesand well-defined shear strain levels. The shear strain level,g, was less than 10–5 for all RC tests.
Ultrasonic shear-wave transducers (Panametrics, 1 MHz)were used to measure the specimens’ shear-wave velocities.To improve detection of shear-wave arrival, coupling oftransducers to specimens was achieved by using cyanoacry-late glue, which sets in a few seconds and produces astrong bond. Transducers were coupled to cemented sandspecimens by using a 1.5 mm layer of gypsum cement
(Plaster of Paris), which was allowed to set for 8 h beforetesting.
Dynamic Poisson’s ratio measurementsThe shear-wave velocity measured from RC and ultra-
sonic tests and the compressional-wave velocity measuredfrom ultrasonic tests were used to compute the dynamicPoisson’s ratio (eq. [2]).
Attenuation measurementsThe material damping ratio was measured using ultrasonic
pulses (1 MHz) and their reflections (echoes) (spectral ratiomethod, eq. [5]). The main characteristics of the four speci-mens tested are given in Table 2. Buffer rods were not usedfor the metallic specimens because the free-boundary condi-tion ensured negligible energy losses and high signal-to-noise ratios. Instead of using the direct arrival and firstecho, the first and second echoes were used to avoid near-field effects (Fig. 2b). A rectangular window of constantwidth was applied to the pulse echoes prior to Fourier anal-ysis. Pulse echoes were windowed to isolate them from re-flections from the lateral boundaries and other modes of
Fig. 7. Variation of measured p-wave velocities with length for steel specimens. (a) Uncorrected velocities and (b) corrected velocities fortime delay from F-t-F calibrations.
8 Can. Geotech. J. Vol. 48, 2011
Published by NRC Research Press
Can
. Geo
tech
. J. D
ownl
oade
d fr
om w
ww
.nrc
rese
arch
pres
s.co
m b
y U
nive
rsity
of
Wes
tern
Ont
ario
on
02/2
8/13
For
pers
onal
use
onl
y.

propagation. The cemented sand and the PVC specimens(Table 2; length, L = 5 cm) were also tested using an alumi-num buffer rod (diameter, d = 5 cm) for comparison pur-poses. Typical windowed pulse echoes and Fourier spectraare shown in Fig. 4, which also shows the effect of window-ing on the original spectra. The amplitudes in this figure aredifferent from Fig. 3 because of the different lengths of thespecimens. The inversion in the polarity of the signals re-sulted from a change in the pulse polarity for measurementsshown in Fig. 4.
The material damping ratio was also measured using theRC device (with shear strains, g < 10–5). RC measurementsare affected by eddy currents; this effect increases with thedecrease in the resonant frequency. Material damping ratiosare corrected for eddy current damping according to Cas-cante et al. (2003).
Sample preparation
Cylindrical specimens of aluminum, steel, and PVC werecut from solid rods of the required diameter (Table 2). Thetop and bottom faces of the specimens were squared to en-hance uniform contact with the ultrasonic transducers.Probes for RC tests were cut out from solid rods to elimi-nate mechanical joints in the specimens (Khan et al. 2008).
The sand–cement mixture was prepared by mixing finesand (average grain-size diameter, D50 = 0.1 mm) and a gyp-sum-based cement (Sheetrock 20, D50 = 0.015 mm), addingwater and mixing until a homogeneous paste was attained.The fine sand was silica sand with subrounded grains(Fig. 5) with a particle-size distribution characterized by asoil particle diameter at which 10% of the mass of the soilspecimen is finer, D10 = 0.12; coefficient of uniformity,
Fig. 8. Shear-wave arrival times for different specimens. s-wave velocities from the slope of the linear regression.
Khan et al. 9
Published by NRC Research Press
Can
. Geo
tech
. J. D
ownl
oade
d fr
om w
ww
.nrc
rese
arch
pres
s.co
m b
y U
nive
rsity
of
Wes
tern
Ont
ario
on
02/2
8/13
For
pers
onal
use
onl
y.

Cu = 1.8; and coefficient of curvature, Cc = 1.04. The fric-tion angle from direct shear tests was f = 32.58. The mini-mum and maximum void ratios (emax = 0.75 and emin = 0.53,respectively) were measured in accordance with ASTMstandards (ASTM 2002c, 2002d ). A cement content, cc, of15% by weight of sand and a water content, ww, of 12.5%(by weight of sand–cement mixture) were used. The mixturewas placed in a mould and compacted with a cylindricaltamper in four layers. Approximately the same energy wasdelivered in each blow by dropping the tamper from aheight of 10 cm with the same number of drops per layer.The mixture was allowed to cure for 28 days before testing.The dry mass density of 1653 kg/m3 remained practicallyconstant after 10 days of curing at room temperature. Massdensity of this cemented sand is well correlated with themeasured p-wave velocity (Khan et al. 2006). A cementcontent of 15% produced stiff specimens for RC testing (res-onant frequency, f = 275 Hz).
Results and discussionsFigure 6 shows the variation of arrival times as a function
of specimen length. Arrival times for different equipmentcombinations (Table 1) are similar because the data hasbeen corrected by subtracting the intercepts of the corre-sponding linear regressions. The slopes from all equipment
combinations are approximately the same (1% variation)and the computed velocity from the average slope is shownin Fig. 6. The F-t-F calibration is a common practice in ul-trasonic measurements (ASTM 2003) to measure the charac-teristic system delay. Table 3 summarizes the inherent timedelays for the different ultrasonic equipment combinationsused in this study. It is noted that the time delay betweensystems varies significantly (e.g., 500% between systems Cand E). The time delay also varies significantly in the inter-cept method when different materials are used for the samesystem (e.g., more than 150% for system F with aluminumand CS specimens). This effect is likely due to the changein coupling between the transducers and the different speci-mens. The characteristic time delay is a function of the ul-trasonic equipment used. Negative values of the time delayindicate that the ultrasonic equipment has lost its originalcalibration and the trigger signal is sent after the excitationpulse is sent. The trigger signal used to trigger the data ac-quisition system and the excitation pulse that is sent to theultrasonic transmitter are not the same signal in ultrasonicequipment because (i) the high-voltage signal used for theactual excitation pulse can damage data acquisition equip-ment and (ii) by using two different signals the inherent de-lays of the electronics can be corrected by using the sameultrasonic equipment. The variation in the acoustic impe-dance between the transducers and the specimens also af-
Fig. 9. Comparison of longitudinal wave velocities, shear-wave velocities, and Poisson’s ratio for steel, aluminum, PVC, and cemented sandspecimens. (Literature values from ASNT 1987; Krautkramer and Krautkramer 1990; Kaye and Laby 1995; Gercek 2007.)
10 Can. Geotech. J. Vol. 48, 2011
Published by NRC Research Press
Can
. Geo
tech
. J. D
ownl
oade
d fr
om w
ww
.nrc
rese
arch
pres
s.co
m b
y U
nive
rsity
of
Wes
tern
Ont
ario
on
02/2
8/13
For
pers
onal
use
onl
y.

fects the measurements. The coupling of the transducers af-fects the time delay mostly because of the attenuation ofhigh frequencies. If the coupling material is not stiff enough,the arrival time is underestimated. Other coupling materials,such as vacuum grease, glycerol, and water, were used inthe experiments. However, the cyanoacrylate glue and gyp-sum cement provided the best response in terms of fre-quency content and amplitude of the received signals. Theerror in wave velocity introduced by the thin layer of glueor gypsum cement used for the transducer–specimen cou-pling was estimated to be less than 0.5% based on the meas-ured thickness of the gypsum layer and measured wavevelocity of gypsum.
Figure 7 presents the measured p-wave velocities for steelspecimens without and with corrections for the system timedelay using the F-t-F calibration. Without the F-t-F correc-tion, the scatter about the slope velocity (VP = 5688 m/s,Fig. 6) is approximately 30%, which is reduced to approxi-mately 8% after the F-t-F correction. A variation of 8% inwave velocity can significantly affect the computation ofthe dynamic Poisson’s ratio, n (10% error in n). Figure 7bindicates that the error introduced by the F-t-F calibrationtends to increase for small specimens. On the other hand, ifthe slope velocity from different systems is used, the veloc-ity scatter is reduced to 0.9%. Similar results were obtainedfor the other materials tested. The maximum error in the
computed wave velocity (small specimens), which is intro-duced by errors in the measurements of length of the speci-men (±0.1 mm) and in travel time (±0.1 ms), is less than2%. Thus, the variation of wave velocity shown in Fig. 7bis not only due to measurement errors, but also to the uncer-tainty in the selection of the arrival times. The slope wavevelocities for aluminum and steel specimens agree wellwith published results (ASNT 1987; Krautkramer andKrautkramer 1990; Kaye and Laby 1995; Gercek 2007).
Figure 8 presents the shear-wave arrival times for differ-ent specimens and the corresponding slope velocities(system F). The shear and p-wave velocity measurementsfrom ultrasonic and RC tests are compared in Fig. 9a. Theshear-wave velocities measured from the ultrasonic testswere slightly higher than the velocities from RC tests (9%cemented sand, 7% PVC, 3% steel, and 3% aluminum speci-mens). The stiffness ratio of the cemented sand specimen (asgiven by eq. [9]) is up to 25 times larger than the stiffnessratios of the other specimens. It is likely that the observed9% difference between the RC and ultrasonic tests is due tothe extrapolation of the linear degradation of shear-wave ve-locity (eq. [9]) up to a stiffness ratio, k1/k2, of 0.5. However,this 9% difference represents a small error and the extrapo-lation of eq. [9] is justified. If a more accurate correction isrequired, the actual calibration curve can be used instead ofeq. [9] (Khan et al. 2008). In addition, the shear strain levels
Fig. 10. Spectral ratios for cemented sand specimen: (a) with an aluminum buffer rod, sinusoidal pulse f = 300 kHz; and (b) without bufferrod, f = 200 kHz.
Khan et al. 11
Published by NRC Research Press
Can
. Geo
tech
. J. D
ownl
oade
d fr
om w
ww
.nrc
rese
arch
pres
s.co
m b
y U
nive
rsity
of
Wes
tern
Ont
ario
on
02/2
8/13
For
pers
onal
use
onl
y.

in ultrasonic testing are smaller than the strain levels in-duced in RC tests (g < 10–5). The shear-wave velocitiesfrom ultrasonic and RC tests are in good agreement. How-ever, they correspond to different frequency ranges (RC testf < 200 Hz, ultrasonic tests f & 1 MHz). Thus, no materialdispersion was observed for the specimens tested.
Figure 9b shows the Poisson’s ratios computed from thep-wave and s-wave velocities from ultrasonic and RC tests(eq. [2]). The Poisson’s ratio for different materials com-pares well with results available in literature (less than 8%difference). This agreement confirms that the measuredwave velocity corresponds to the p-wave velocity (constraintmodulus) instead of the bar velocity (Young’s modulus).However, the Poisson’s ratio shows 47% variation for thecemented sand specimen (n = 0.17 ultrasonic test, n = 0.25RC test), even though the change in shear-wave velocity isonly 9%. The computed Poisson’s ratio including the correc-tion of the shear-wave velocity for stiff specimens (Khan etal. 2008), n = 0.17, is considered a more reliable value forthe cemented sand specimen as it agrees with the low Pois-son’s ratios predicted for uniform packing of spheres sub-jected to low shear strain levels and low confinements (g <10–5; isotropic confinement, s0 < 700 kPa; Petrakis andDobry 1987; Wang and Nur 1992; Cascante et al. 1998).The computed Poisson’s ratios also depend on the measuredp-wave velocity (eq. [2]) for the cemented sand specimens.The measured p-wave velocity, using the proposed proce-
dure on specimens of different lengths, has an error of lessthan 0.9%. Thus, most of the variation on the measuredPoisson’s ratio (ultrasonic and RC) is attributed to the differ-ence in the measured shear-wave velocities. If the p-wavevelocity changes by ±5% from the measured value, thischange hardly affects the difference between the predictedPoisson’s ratio values (average difference in Poisson’s ratio =0.081).
The logarithmic regression of the spectral ratios for thecemented sand specimen computed with and without a buf-fer rod are shown in Figs. 10a and 10b, respectively. Thedimensions of cemented sand specimens as well as the fre-quency of the excitation pulse are different. However, thecomputed damping ratios for both specimens differ by lessthan 3.5%. The excitation frequency was varied to evaluatethe frequency effect. The linear regression, r2, coefficient forboth specimens is greater than 0.99. The frequencies withinthe useful bandwidth are used for the regression analysis.The buffer rod and the geometry of the specimen do not sig-nificantly affect the slope as long as the echoes are properlyisolated by using a rectangular time window of equal dura-tion.
Figure 11 presents the spectral ratio results for the PVCspecimens with and without a buffer rod. The damping ratioincreases slightly when a buffer rod is used because of alarger energy loss compared with a free boundary. The am-plitude reduction (eq. [8]) due to the free boundary is only
Fig. 11. Spectral ratios for PVC specimen: (a) with an aluminum buffer rod and (b) without buffer rod. Sinusoidal pulse f = 300 kHz.
12 Can. Geotech. J. Vol. 48, 2011
Published by NRC Research Press
Can
. Geo
tech
. J. D
ownl
oade
d fr
om w
ww
.nrc
rese
arch
pres
s.co
m b
y U
nive
rsity
of
Wes
tern
Ont
ario
on
02/2
8/13
For
pers
onal
use
onl
y.

0.0023 dB, whereas it is 3.33 dB for the specimen interfacewith the aluminum buffer rod. This increase in damping wasnot observed for the cemented sand specimen, possibly be-cause of the different frequency range used for the caseswith and without the buffer rod.
Figure 12 presents the spectral ratio results for the steeland aluminum specimens. The measured slopes are approxi-mately flat and give negligible damping ratios. The resultsare in good agreement with the published values (Table 2).As the damping ratio of steel and aluminum is practicallynegligible, slight variation can be attributed to the precisionof the tests. The results are presented for a square pulse.
The damping ratios measured from ultrasonic and RCtests are compared in Table 4. Similar to wave velocities,damping ratios from RC testing and the spectral ratiosmethod using the first and second echoes of the pulse are ingood agreement for the PVC, aluminum, and steel speci-
mens (maximum difference of 8%). The damping ratio ofcemented sand is overestimated in the RC test due to theequipment-generated damping (Cascante et al. 2003) andthe lack of base fixidity in the RC device when the stiffnessratio is higher than 0.2 (Khan et al. 2008). The proposedmethodology for computing the damping ratio of stiff soils(cemented soils, rocks, stiff clays) using ultrasonic testing ismore reliable.
ConclusionsThe compressional- and shear-wave velocities and damp-
ing ratios for different materials were measured using cali-brated ultrasonic tests. For the purpose of comparison, theshear-wave velocities and damping ratios were also meas-ured using RC tests. A variation of the measured wave ve-locity, VP, due to the difference in specimen length wasobserved and is attributed to the inherent time delay of theelectronic equipment. To correct for this delay, it is shownthat wave velocity is more accurately computed by usingthe slope of the arrival time versus specimen length curvethan the standard equation of distance over time. Results ob-tained from different ultrasonic systems (different time de-lays) show that good agreement can only be achieved bymeasuring the time delay using specimens of differentlengths instead of the face-to-face calibration method, com-monly used in practice. The shear-wave velocities measured
Fig. 12. Spectral ratios for (a) steel and (b) aluminum specimens. Square pulse = 1.1 MHz.
Table 4. Damping ratios (%) from RC and ultrasonictests.
Damping ratio (%)
Material Ultrasonic RCCemented sand 0.32 0.80PVC 0.53 0.49Steel 0.09 0.10Aluminum 0.010 0.030
Khan et al. 13
Published by NRC Research Press
Can
. Geo
tech
. J. D
ownl
oade
d fr
om w
ww
.nrc
rese
arch
pres
s.co
m b
y U
nive
rsity
of
Wes
tern
Ont
ario
on
02/2
8/13
For
pers
onal
use
onl
y.

using the proposed method agreed well with the results fromthe RC tests.
The specimens were tested at different excitation frequen-cies ( f < 200 Hz for RC tests and f & 1 MHz for ultrasonictests). Wave dispersion was not observed for the materialstested. The compressional ultrasonic-wave ( p-wave) and theshear-wave velocities from ultrasonic and RC tests wereused to evaluate the dynamic Poisson’s ratio. The measureddynamic Poisson’s ratios compared well with the publishedresults for PVC, steel, and aluminum. The results showedthat a variation of 9% in the shear-wave velocity resulted inalmost 50% error in the computed Poisson’s ratio of the ce-mented sand. The shear-wave velocity of cemented sandsevaluated using the RC device is underestimated because ofthe lack of base fixidity of this equipment, which affectedthe accuracy of the computed Poisson’s ratio significantly.
A new method based on spectral ratios is proposed tocompute the material damping ratio from ultrasonic tests.The proposed spectral ratio method uses the first and secondechoes of a propagating pulse without the need of a bufferrod, thus enhancing the signal-to-noise ratio.
ReferencesAchenbach, J.D. 1973. Wave propagation in elastic solids. North-
Holland Publishing Company, Amsterdam, the Netherlands.ASNT. 1987. Acoustic emission testing. Nondestructive testing hand-
book, Vol. 5. Edited by R. Miller and P. McIntire. American So-ciety for Nondestructive Testing, Inc. (ASNT), Columbus, Ohio.p. 216.
ASTM. 1997. Laboratory determination of pulse velocities and ul-trasonic elastic constants of rock. ASTM standard D2845-95. InAnnual book of standards. American Society for Testing andMaterials, West Conshohocken, Pa. Vol. 04.08, pp. 254–259.
ASTM. 2000. Standard test methods for modulus and damping ofsoils by the resonant-column method. ASTM standard D4015-92. In Annual book of standards. American Society for Testingand Materials, West Conshohocken, Pa. Vol. 04.08, pp. 473–494.
ASTM. 2002a. Standard test method for pulse velocity throughconcrete. ASTM standard C597. In Annual book of standards.American Society for Testing and Materials, West Consho-hocken, Pa. Vol. 04.02, pp. 309–312.
ASTM. 2002b. Standard test method for fundamental transverse,longitudinal, and torsional resonant frequencies of concrete spe-cimens. ASTM standard C215. In Annual book of standards.American Society for Testing and Materials, West Consho-hocken, Pa. Vol. 04.02, pp. 135–140.
ASTM. 2002c. Standard test method for maximum index densityand unit weight of soils using vibrating table. ASTM standardD4253. In Annual book of standards. American Society forTesting and Materials, West Conshohocken, Pa. Vol. 04.08,pp. 544–557.
ASTM. 2002d. Standard test method for minimum index densityand unit weight of soils and calculation of relative density.ASTM standard D4254. In Annual book of standards. AmericanSociety for Testing and Materials, West Conshohocken, Pa.Vol. 04.08, pp. 558–566.
ASTM. 2003. Standard guide for evaluating characteristics of ultra-sonic search units. ASTM standard E1065-99. In Annual bookof standards. American Society for Testing and Materials, WestConshohocken, Pa. Vol. 03.03, pp. 325–341.
Bancroft, D. 1941. The velocity of longitudinal waves in cylindri-
cal bars. Physical Review, 59(7): 588–593. doi:10.1103/PhysRev.59.588.
Blitz, J., and Simpson, G. 1996. Ultrasonic methods of non-destruc-tive testing. Chapman & Hall, London. pp. 18–21.
Campanella, R.G., Stewart, W.P., Roy, D., and Davies, M.P. 1994.Low strain dynamic characteristics of soils with the downholeseismic peizocone penetrometer. In Dynamic geotechnical test-ing II. ASTM STP 1213. American Society for Testing and Ma-terials, Philadelphia, Pa. pp. 73–87.
Cascante, G., and Santamarina, J.C. 1997. Low strain measure-ments using random noise excitation. Geotechnical Testing Jour-nal, 20(1): 29–39. doi:10.1520/GTJ11418J.
Cascante, G., Santamarina, J.C., and Yassir, N. 1998. Flexural excita-tion in a standard torsional-resonant column device. Canadian Geo-technical Journal, 35(3): 478–490. doi:10.1139/cgj-35-3-478.
Cascante, G., Vanderkooy, J., and Chung, W. 2003. Difference be-tween current and voltage measurement in resonant-column test-ing. Canadian Geotechnical Journal, 40(4): 806–820. doi:10.1139/t03-023.
Fratta, D., and Santamarina, J.C. 1996. Wave propagation in soils:Multi-mode, wide-band testing in waveguide device. Geotechni-cal Testing Journal, 19(2): 130–140. doi:10.1520/GTJ10336J.
Gercek, H. 2007. Poisson’s ratio values for rocks. InternationalJournal of Rock Mechanics and Mining Sciences, 44(1): 1–13.doi:10.1016/j.ijrmms.2006.04.011.
Hoppe, N., Puttmer, A., and Hauptmann, P. 2003. Optimization ofbuffer rod geometry for ultrasonic sensors with reference path.IEEE Transactions on Ultrasonics, Ferroelectrics, and FrequencyControl, 50(2): 170–178.
Kaye, G.W.C., and Laby, T.H. 1995. Tables of physical and chemi-cal constants. 16th ed. Longman, Essex, UK.
Kesler, C.E., and Higuchi, Y. 1954. Problems in sonic testing ofplain concrete. In Proceedings of the RILEM International Sym-posium on Nondestructive Testing of Materials and Structures,Paris, 28 January – 2 February 1954. The Secretariat-General,RILEM, Paris. Vol. 1, pp. 45–53.
Khan, Z., Majid, A., Cascante, G., Hutchinson, D.J., and Pezeshk-pour, P. 2006. Characterization of a cemented sand with thepulse-velocity method. Canadian Geotechnical Journal, 43(3):294–309. doi:10.1139/t06-008.
Khan, Z.H., Cascante, G., and El Naggar, M.H. 2008. Evaluation ofthe first mode of vibration and base fixidity in resonant-columntesting. Geotechnical Testing Journal, 31(1): 587–606. doi:10.1520/GTJ100305.
Kolsky, H. 1963. Stress waves in solids. Dover Publications, Inc.,New York.
Krautkramer, J., and Krautkramer, H. 1990. Ultrasonic testing ofmaterials. Springer-Verlag, New York.
Leong, E., Yeo, S., and Rahardjo, H. 2004. Measurement of wavevelocity and attenuation using an ultrasonic test system. Cana-dian Geotechnical Journal, 41(5): 844–860. doi:10.1139/t04-041.
Malhotra, V.M., and Sivasundaram, V. 1991. Resonant frequencymethod. In Handbook of non-destructive testing of concrete.CRC Press Inc., Boca Raton, Fla. pp. 147–168.
Mason, W.P. 1958. Physical acoustics and the properties of solids.D. van Nostrand, Princeton, N.J.
Naik, T.R., and Malhotra, V.M. 1991. The ultrasonic pulse velocitymethod. In Handbook of non-destructive testing of concrete.CRC Press Inc., Boca Raton, Fla. pp. 169–188.
Petrakis, E., and Dobry, R. 1987. Micromechanical modeling ofgranular soil at small strain by arrays of elastic spheres. Depart-ment of Civil Engineering, Rensselaer Polytechnic Institute,Troy, N.Y. Report No. CE-87-02.
Popovics, J.S., and Rose, J.L. 1994. A survey of developments in
14 Can. Geotech. J. Vol. 48, 2011
Published by NRC Research Press
Can
. Geo
tech
. J. D
ownl
oade
d fr
om w
ww
.nrc
rese
arch
pres
s.co
m b
y U
nive
rsity
of
Wes
tern
Ont
ario
on
02/2
8/13
For
pers
onal
use
onl
y.

ultrasonic NDE of concrete. IEEE Transactions on Ultrasonics,Ferroelectrics, and Frequency Control, 41(1): 140–143. doi:10.1109/58.265832.
Sato, H., Ito, K., and Aizawa, Y. 2004. Simultaneous velocity and at-tenuation measurements applicable to various solids at high pres-sures and temperatures up to 1200 8C. Measurement Science andTechnology, 15(9): 1787–1793. doi:10.1088/0957-0233/15/9/016.
Schmerr, L.W. 1998. Fundamentals of ultrasonic non-destructiveevaluation: a modelling approach. Springer, London.
Swamy, R.N. 1971. Dynamic Poisson’s ratio of Portland cementpaste, mortar and concrete. Cement and Concrete Research,1(5): 559–583. doi:10.1016/0008-8846(71)90060-3.
Toksoz, M.N., Johnston, D.H., and Timur, A. 1979. Attenuation ofseismic waves in dry and saturated rocks: I. Laboratory mea-surements. Geophysics, 44(4): 681–690. doi:10.1190/1.1440969.
Wang, Z., and Nur, A. 1992. Elastic wave velocities in porousmedia: a theoretical recipe. In Seismic and acoustic velocities inreservoir rocks. Edited by Z. Wang and A. Nur. Society of Ex-ploration Geophysicists, Tulsa, Okla. Vol. 2, pp. 1–35.
Zemanek, J. 1962. An experimental and theoretical investigation ofelastic wave propagation in a cylinder. Department of Physics,University of California, Los Angeles, Calif. Technical reportNo. XVIII.
Khan et al. 15
Published by NRC Research Press
Can
. Geo
tech
. J. D
ownl
oade
d fr
om w
ww
.nrc
rese
arch
pres
s.co
m b
y U
nive
rsity
of
Wes
tern
Ont
ario
on
02/2
8/13
For
pers
onal
use
onl
y.