measurement of poverty: concepts & measurements 1measurement of poverty
TRANSCRIPT
Measurement of Poverty:Concepts & Measurements
1Measurement of Poverty
Measurement of Poverty“The governments are very keen on amassing statistics. They collect them, add them, raise them to the nth power and take the cubed root and prepare wonderful diagrams.
But you must never forget that every one of these figures comes in the first instance from the village watchman who just puts down whatever he damn well pleases.” - Sir Josiah Stamp 2Measurement of Poverty
Measurement of Poverty Practical Concerns
• Identification of Poverty Line• Defining the Unit of Measurement• Selecting the Indicator of Well-being
3Measurement of Poverty
Identification of Poverty Lines
• The point at which the poor are separated from the non-poor– Relative Poverty Lines– Absolute Poverty Lines
4Measurement of Poverty
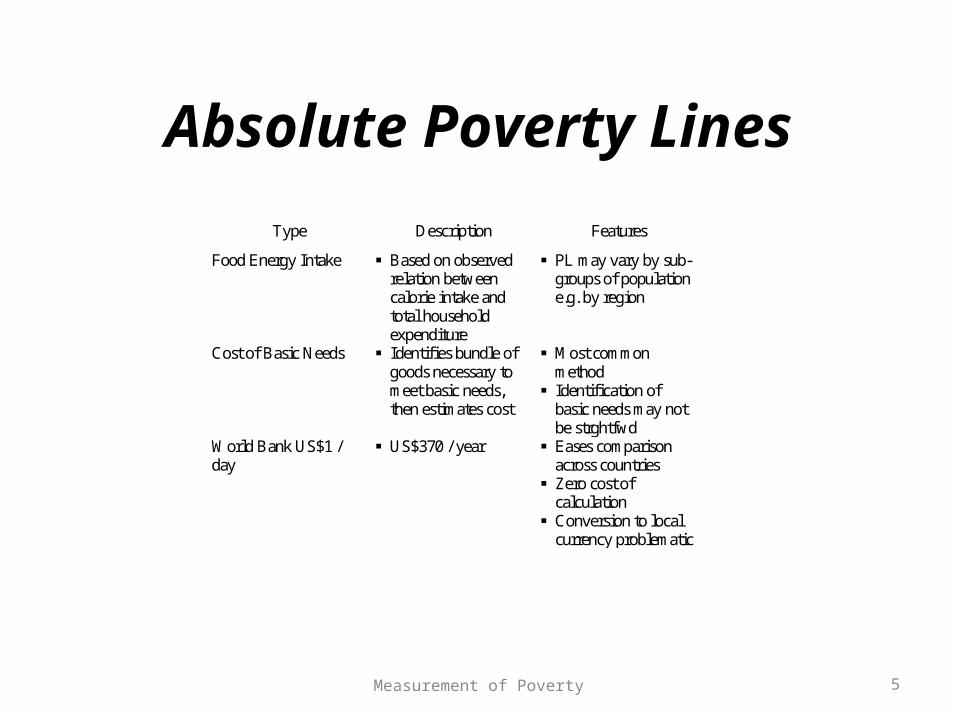
Absolute Poverty Lines
Type Description Features
Food Energy Intake Based on observed relation between calorie intake and total household expenditure
PL may vary by sub-groups of population e.g. by region
Cost of Basic Needs Identifies bundle of goods necessary to meet basic needs, then estimates cost
Most common method
Identification of basic needs may not be strghtfwd
World Bank US$1 / day
US$370 / year Eases comparison across countries
Zero cost of calculation
Conversion to local currency problematic
5Measurement of Poverty
Food Energy Intake Method
• Sets PL at the level of expenditure at which FEI is just sufficient to meet basic nutrition requirements
• STEP ONE: Establish the minimum nutrition requirements.
• STEP TWO: Examine the observed spending pattern to see at what average expenditure household just achieve minimum nutrition requirement.
6Measurement of Poverty
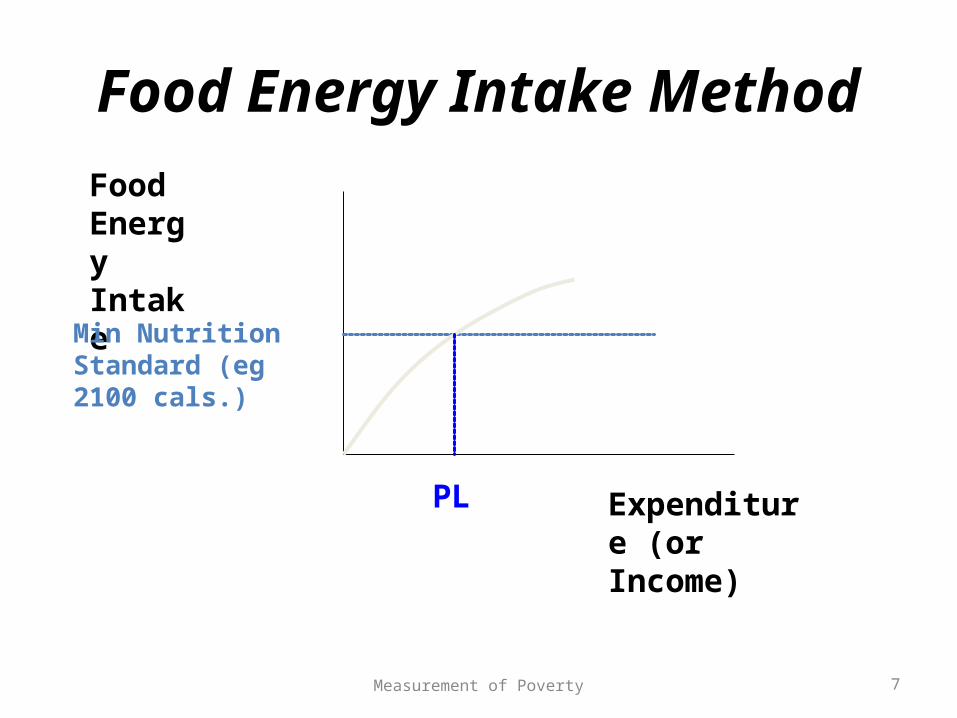
Food Energy Intake MethodFood Energy Intake
Expenditure (or Income)
Min Nutrition Standard (eg 2100 cals.)
PL
7Measurement of Poverty
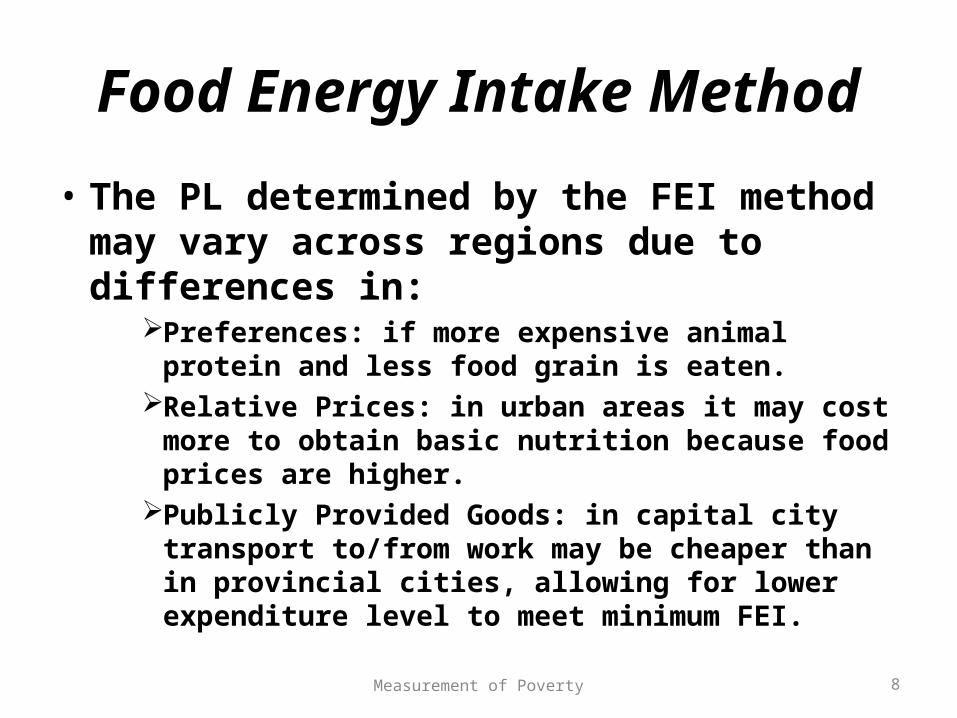
Food Energy Intake Method
• The PL determined by the FEI method may vary across regions due to differences in:
Preferences: if more expensive animal protein and less food grain is eaten.
Relative Prices: in urban areas it may cost more to obtain basic nutrition because food prices are higher.
Publicly Provided Goods: in capital city transport to/from work may be cheaper than in provincial cities, allowing for lower expenditure level to meet minimum FEI.
8Measurement of Poverty
Food Energy Intake Method
• This method does take account of non-food purchases.
9Measurement of Poverty
Cost of Basic Needs
• PL is equal to the value of a bundle of consumption goods necessary to meet basic needs May include just food (extreme poverty)But more commonly includes non-food items
10Measurement of Poverty
Cost of Basic Needs
• STEP ONE: Establish the minimum consumption bundle necessary to meet basic needs
11Measurement of Poverty
Cost of Basic Needs
• STEP TWO: Establish the cost for the items in the basic consumption bundle
12Measurement of Poverty
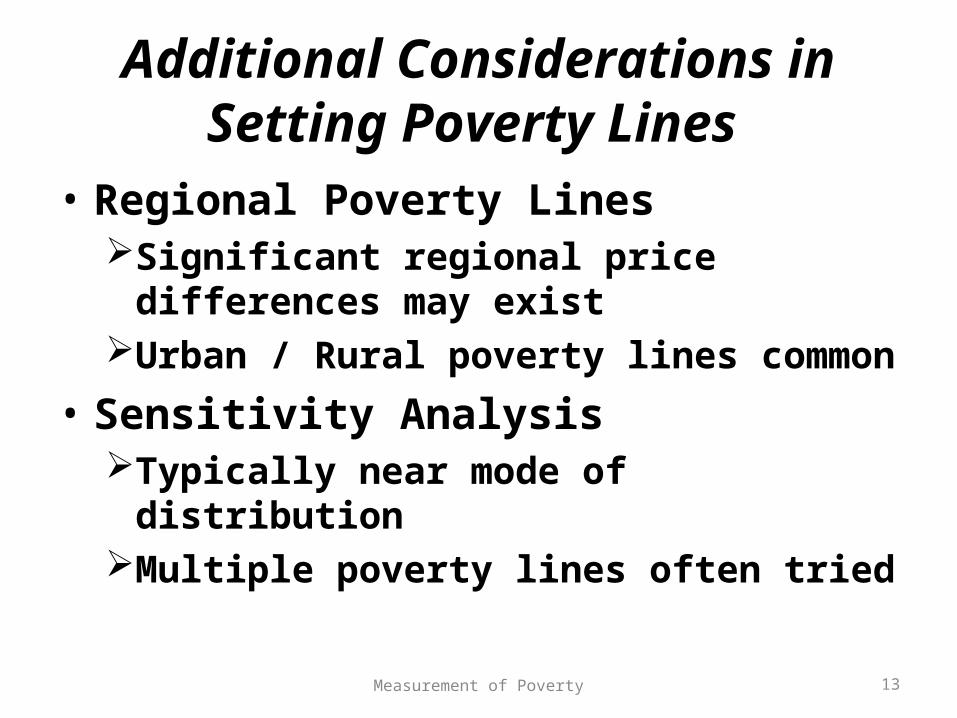
Additional Considerations in Setting Poverty Lines
• Regional Poverty LinesSignificant regional price differences may existUrban / Rural poverty lines common
• Sensitivity AnalysisTypically near mode of distributionMultiple poverty lines often tried
13Measurement of Poverty
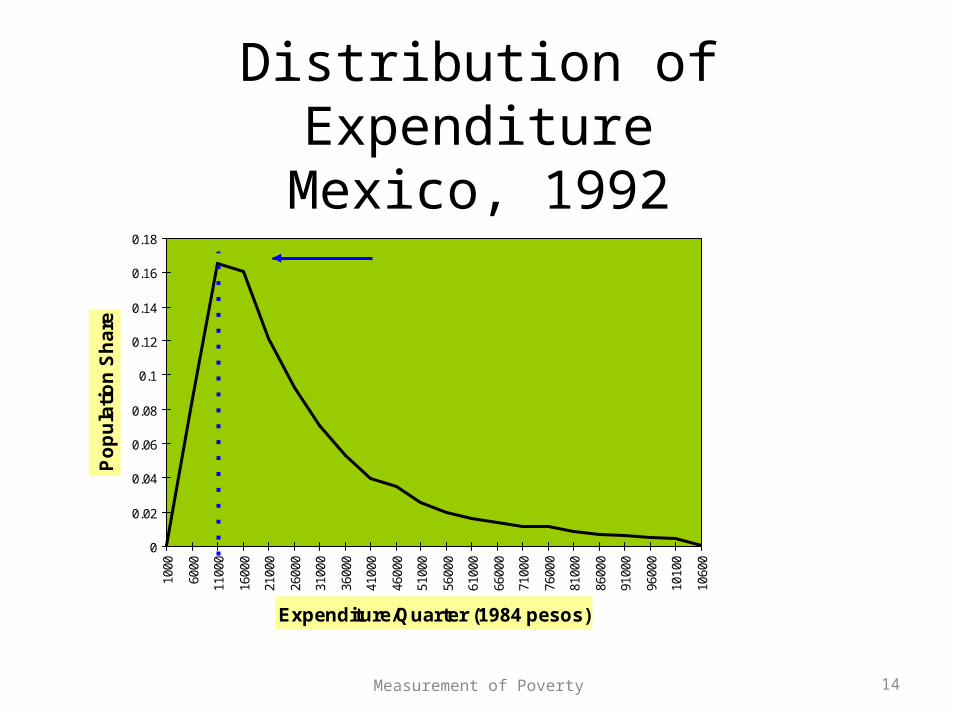
Distribution of ExpenditureMexico, 1992
0
0.02
0.04
0.06
0.08
0.1
0.12
0.14
0.16
0.18
1000
6000
1100
0
1600
0
2100
0
2600
0
3100
0
3600
0
4100
0
4600
0
5100
0
5600
0
6100
0
6600
0
7100
0
7600
0
8100
0
8600
0
9100
0
9600
0
1010
0
1060
0
Expenditure/Quarter (1984 pesos)
Po
pu
lati
on
Sh
are
Poverty Line
14Measurement of Poverty
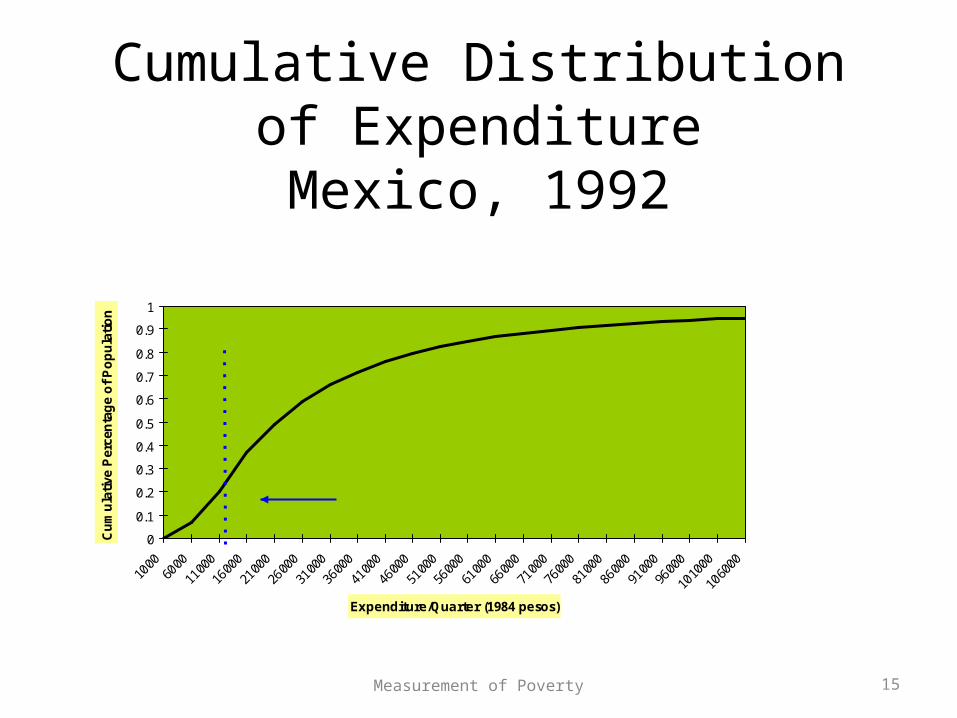
Cumulative Distribution of Expenditure
Mexico, 1992
0
0.1
0.2
0.3
0.4
0.5
0.6
0.7
0.8
0.9
1
1000
6000
1100
0
1600
0
2100
0
2600
0
3100
0
3600
0
4100
0
4600
0
5100
0
5600
0
6100
0
6600
0
7100
0
7600
0
8100
0
8600
0
9100
0
9600
0
1010
00
1060
00
Expenditure/Quarter (1984 pesos)
Cu
mu
lati
ve P
erce
nta
ge
of
Po
pu
lati
on
Poverty Line
15Measurement of Poverty
Measurement of Poverty Practical Concerns
• Identification of Poverty Line• Defining the Unit of Measurement• Selecting the Indicator of Well-being
16Measurement of Poverty
Defining the Unit of Measurement
Household vs. IndividualAdjusting for differences among HH
Adjusting for the age / gender of HH membersAdjusting for HH size
17Measurement of Poverty
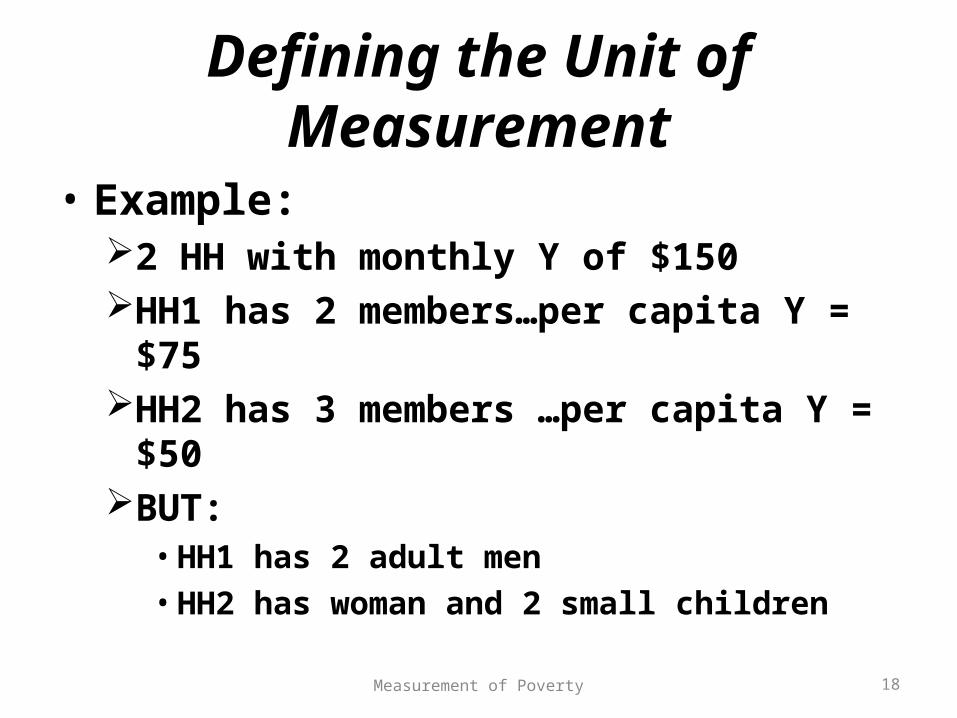
Defining the Unit of Measurement
• Example:2 HH with monthly Y of $150HH1 has 2 members…per capita Y = $75HH2 has 3 members …per capita Y = $50 BUT:
• HH1 has 2 adult men• HH2 has woman and 2 small children
18Measurement of Poverty
Equivalence Scales and Economies of Scale
• HH size is often measured in “adult equivalent” unitseach member of the HH counts as some fraction
of an adult maleEconomies of scales can then be accounted for
by scaling the adult equivalent units
19Measurement of Poverty
Equivalence Scales and Economies of Scale
• Many different methodologies are followed within two basic approachesFixed ScalesEstimated Scales
20Measurement of Poverty
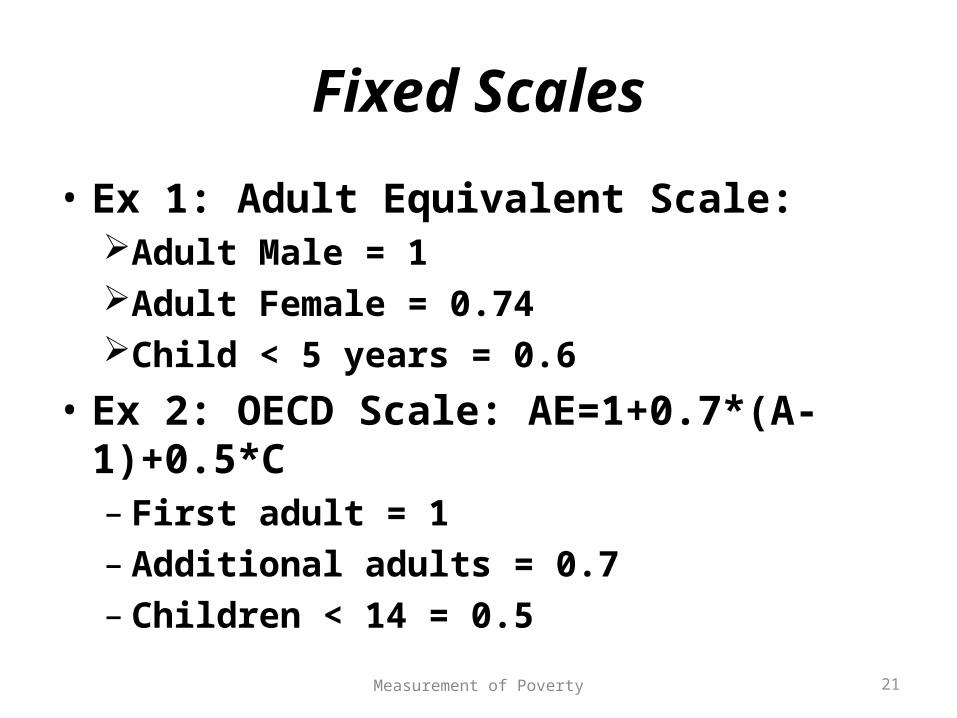
Fixed Scales
• Ex 1: Adult Equivalent Scale:Adult Male = 1Adult Female = 0.74Child < 5 years = 0.6
• Ex 2: OECD Scale: AE=1+0.7*(A-1)+0.5*C– First adult = 1– Additional adults = 0.7– Children < 14 = 0.5
21Measurement of Poverty
Estimating AE Scales
• Based on examining HH data to see how consumption varies with gender/age and sizeFood share of expenditure is regressed on HH
size, HH composition
22Measurement of Poverty
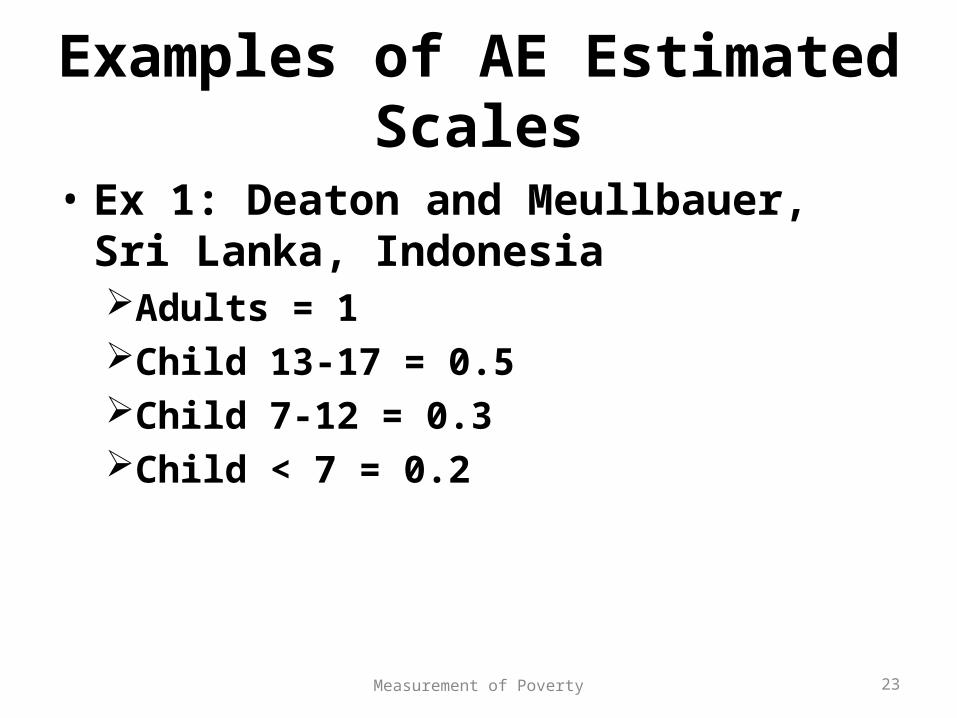
Examples of AE Estimated Scales
• Ex 1: Deaton and Meullbauer, Sri Lanka, IndonesiaAdults = 1Child 13-17 = 0.5Child 7-12 = 0.3Child < 7 = 0.2
23Measurement of Poverty
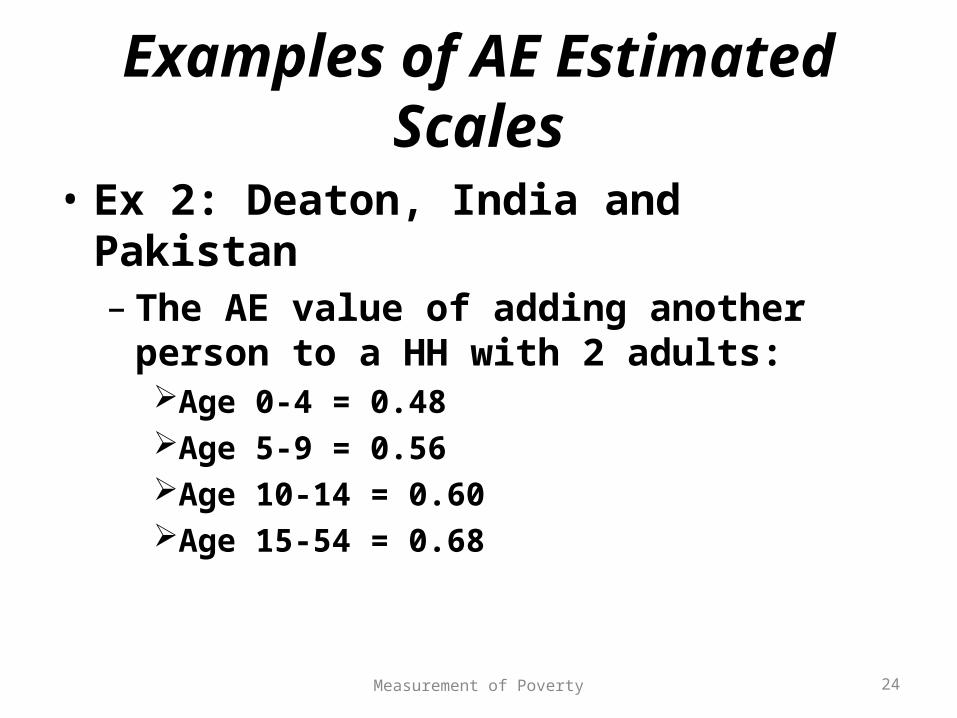
Examples of AE Estimated Scales
• Ex 2: Deaton, India and Pakistan– The AE value of adding another person to a HH
with 2 adults:Age 0-4 = 0.48Age 5-9 = 0.56Age 10-14 = 0.60Age 15-54 = 0.68
24Measurement of Poverty
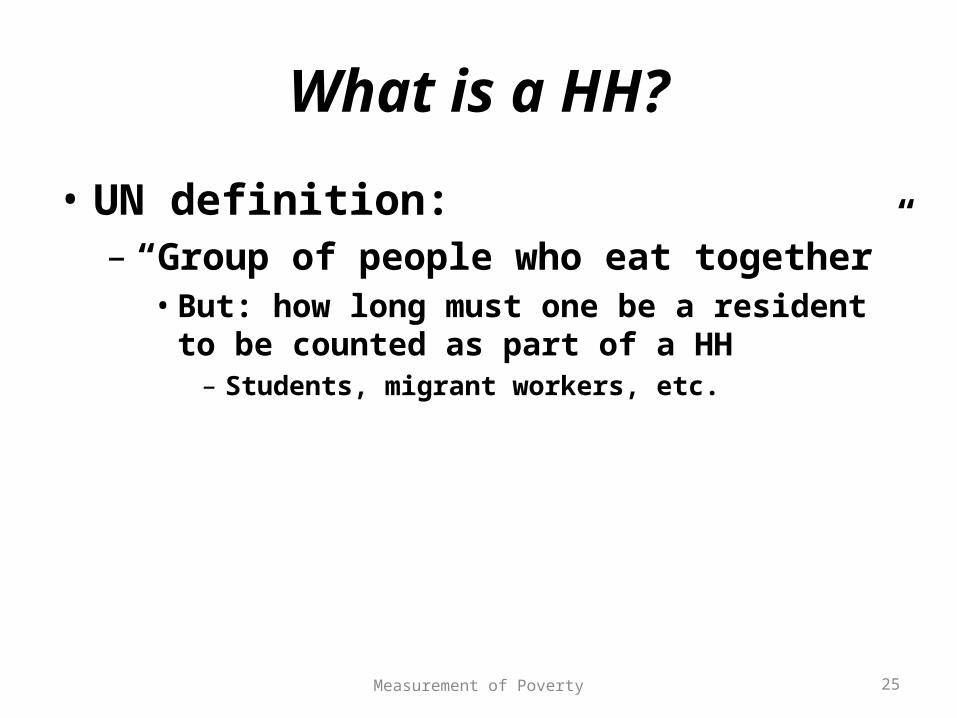
What is a HH?
• UN definition: – “Group of people who eat together”
• But: how long must one be a resident to be counted as part of a HH
– Students, migrant workers, etc.
25Measurement of Poverty
Measurement of Poverty Practical Concerns
• Identification of Poverty Line• Defining the Unit of Measurement• Selecting the Indicator of Well-being
26Measurement of Poverty
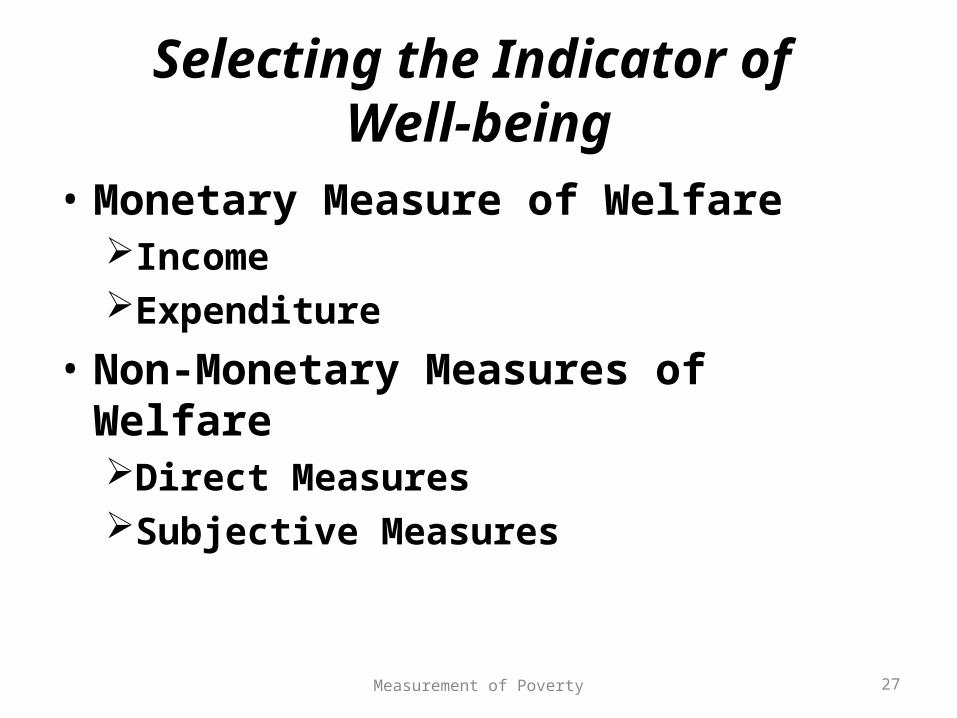
Selecting the Indicator of Well-being
• Monetary Measure of WelfareIncomeExpenditure
• Non-Monetary Measures of WelfareDirect MeasuresSubjective Measures
27Measurement of Poverty
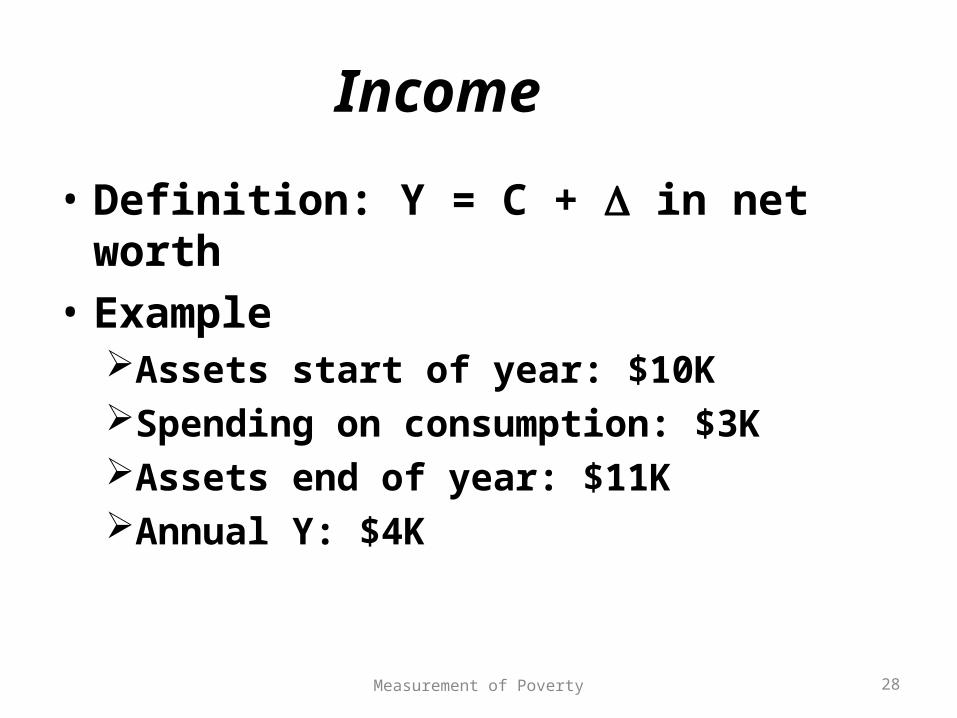
Income
• Definition: Y = C + in net worth• Example
Assets start of year: $10KSpending on consumption: $3KAssets end of year: $11KAnnual Y: $4K
28Measurement of Poverty
Problems with Income as Welfare Measure
• Conceptual Problems– Goal is to measure HH ability to meet basic
needs, but Y is just one factor • access to credit, public services, access, etc. are other
factors that determine ability to meet basic needs
29Measurement of Poverty
Problems with Income as Welfare Measure
• Measurement Problems– Understating of Y
Difficult to recall all of Y, especially when Y flow is erratic as in the informal sector
Fear of tax collectorIllegally earned YSeparating inputs from revenue in agricultureAccounting for own consumption of output
30Measurement of Poverty
Expenditure
• Generally preferred to Income– Is more direct measure of what is consumed– Less volatile than Y
• Consumption smoothing...
31Measurement of Poverty
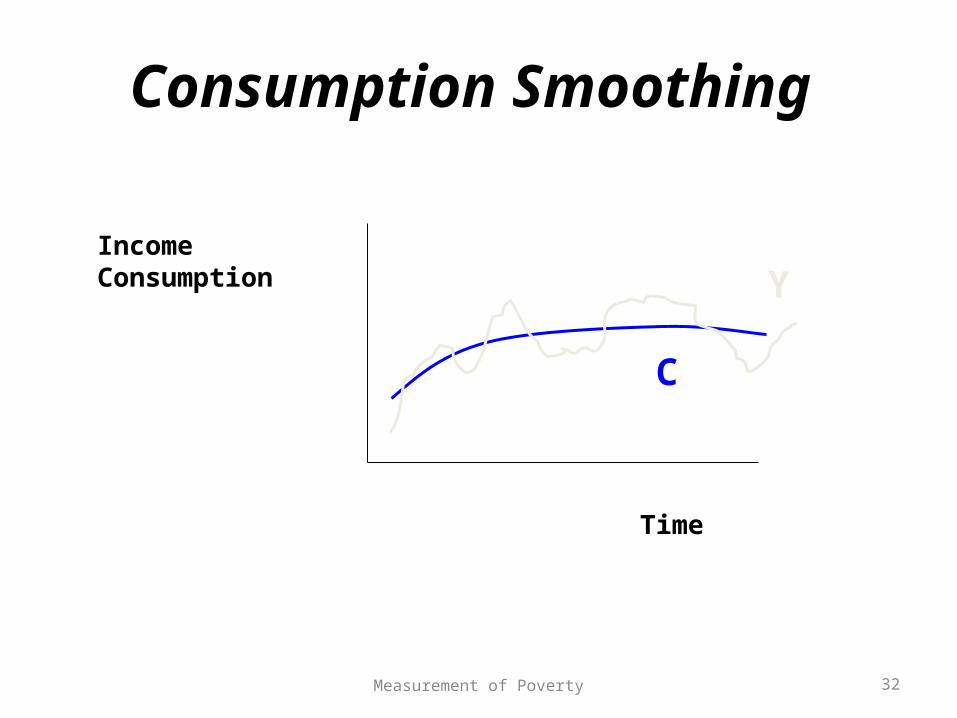
Consumption Smoothing
Income Consumption
Time
Y
C
32Measurement of Poverty
Calculating Y or Expenditure for HH
• How do we measure Y / Expenditure?• What is included?
• NB: HH may be both producers and consumers
33Measurement of Poverty
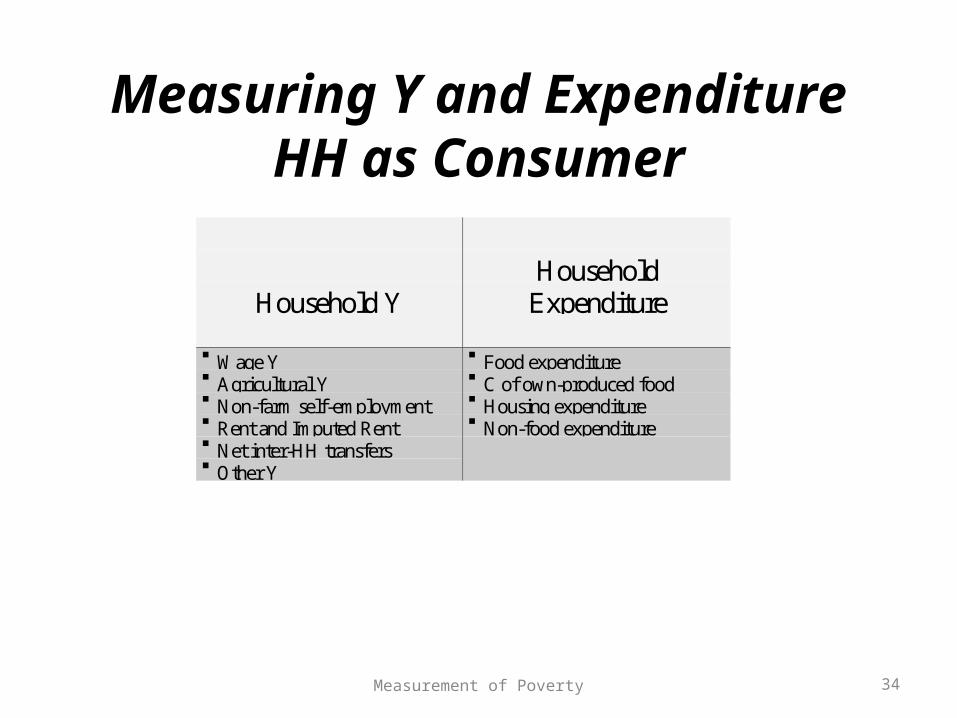
Measuring Y and ExpenditureHH as Consumer
Household YHousehold
Expenditure
Wage Y Agricultural Y Non-farm self-employment Rent and Imputed Rent Net inter-HH transfers Other Y
Food expenditure C of own-produced food Housing expenditure Non-food expenditure
34Measurement of Poverty
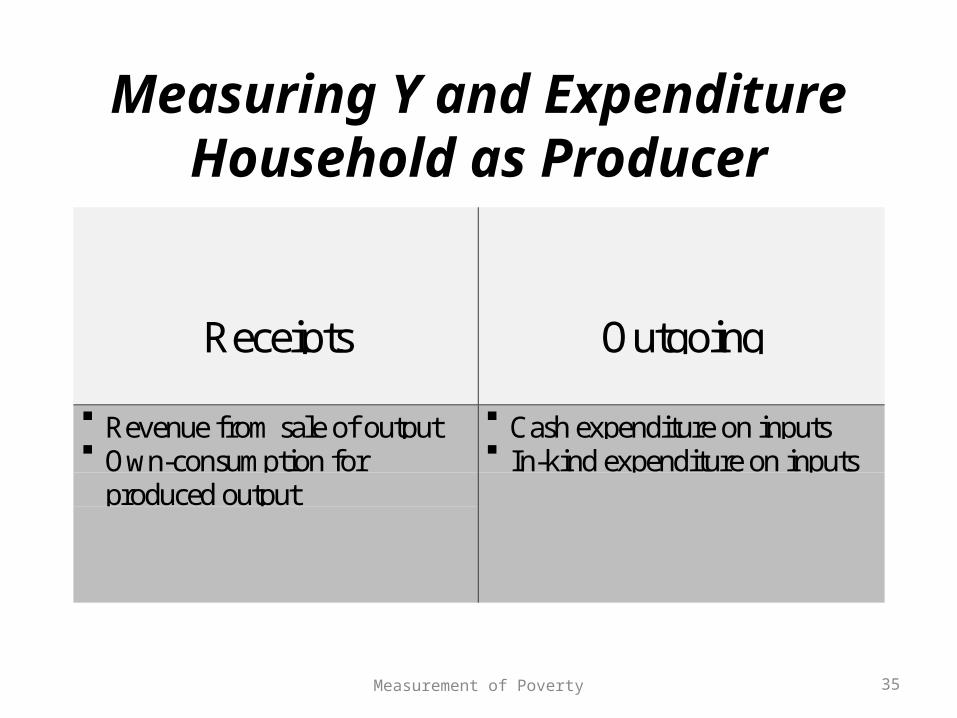
Measuring Y and ExpenditureHousehold as Producer
Receipts Outgoing
Revenue from sale of output Own-consumption for
produced output
Cash expenditure on inputs In-kind expenditure on inputs
35Measurement of Poverty
Calculating Y and Expenditure
• Must not include:Inputs into HH production, like money spent on
seeds, fertilizerExpenditure on investment, like purchase of
tools
36Measurement of Poverty
Calculating Y and Expenditure
• Should include:Housing for owner-occupied dwellingsExpenditure on durable goods
37Measurement of Poverty
Non-Monetary Measure of Welfare
• Direct Welfare MeasuresNutrition PovertyHealth PovertyEducation Poverty
38Measurement of Poverty
Nutrition Poverty
• Input– Example: Calories per day
• Outcomes– Example: Malnutrition
39Measurement of Poverty
Health Poverty
• Outcomes– Ex: life expectancy, infection rates
• Inputs– Ex: vaccination rates
40Measurement of Poverty
Education Poverty
• Outcomes– Ex: Literacy rates
• Inputs: – Ex: Enrolment numbers
41Measurement of Poverty
Subjective Measures
• HH may be asked directly about their welfare• HH may be asked to establish minimum
standards• Community indicators may be established
42Measurement of Poverty
Poverty Measures
• We may want to measure poverty directly instead of looking at Y and inequality together
• The most commonly used poverty measures are:Head Count IndexPoverty GapProportional Poverty GapSquared Poverty Gap
43Measurement of Poverty
Head Count Index
• HCI = (# poor) / (population)
• Measures the “incidence” of poverty– i.e. it tells us “How many poor”
44Measurement of Poverty
Head Count Index
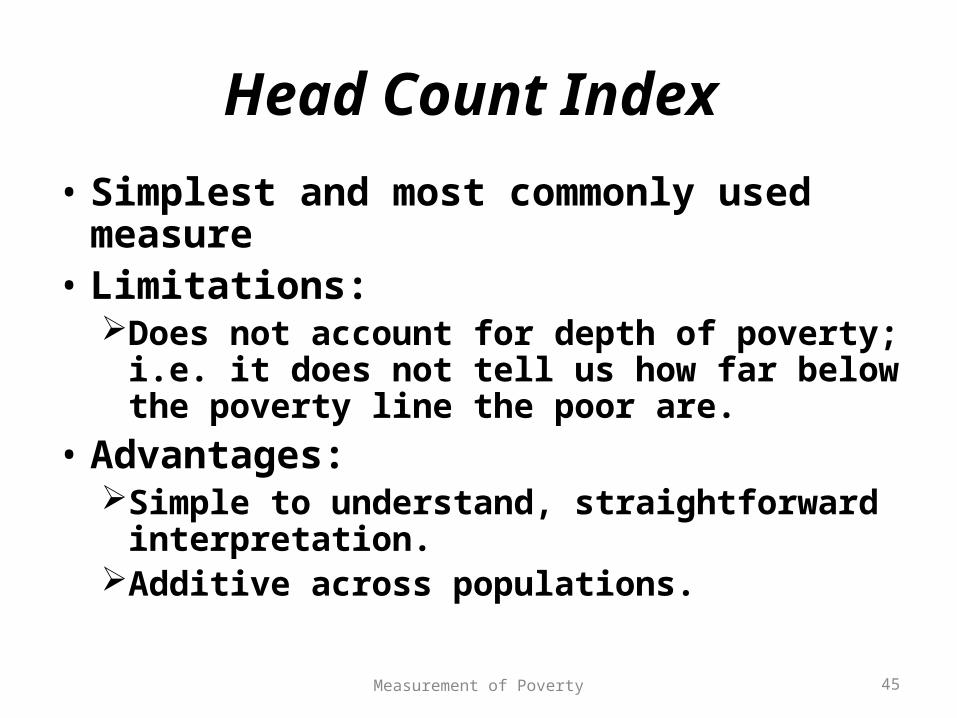
• Simplest and most commonly used measure• Limitations:
Does not account for depth of poverty; i.e. it does not tell us how far below the poverty line the poor are.
• Advantages:Simple to understand, straightforward
interpretation.Additive across populations.
45Measurement of Poverty
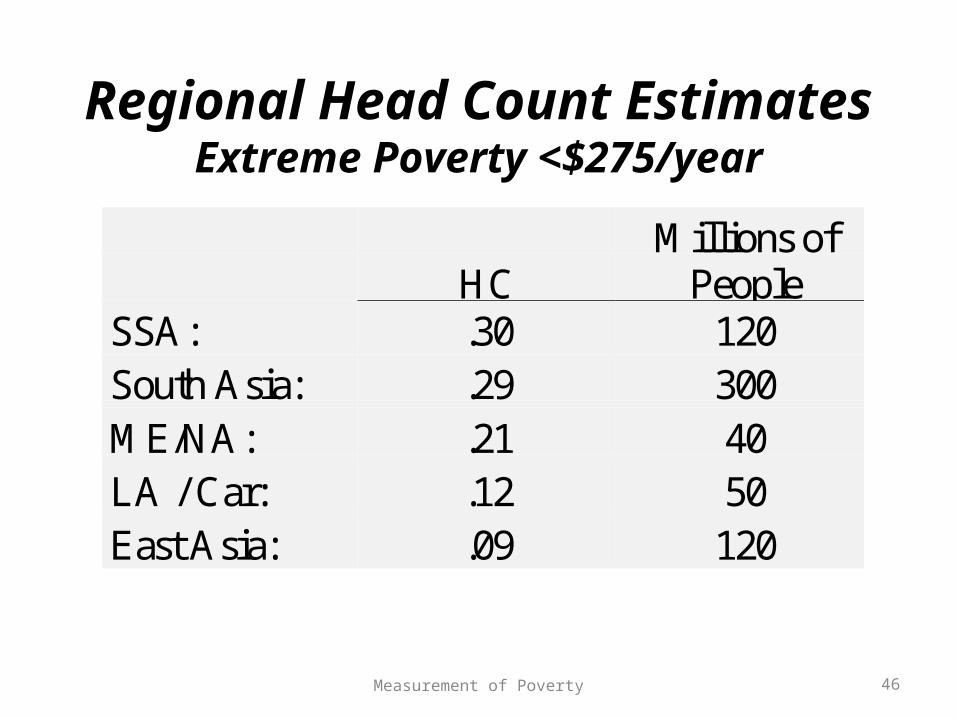
Regional Head Count Estimates Extreme Poverty <$275/year
HCMillions of
PeopleSSA: .30 120South Asia: .29 300ME/NA: .21 40LA / Car: .12 50East Asia: .09 120
46Measurement of Poverty
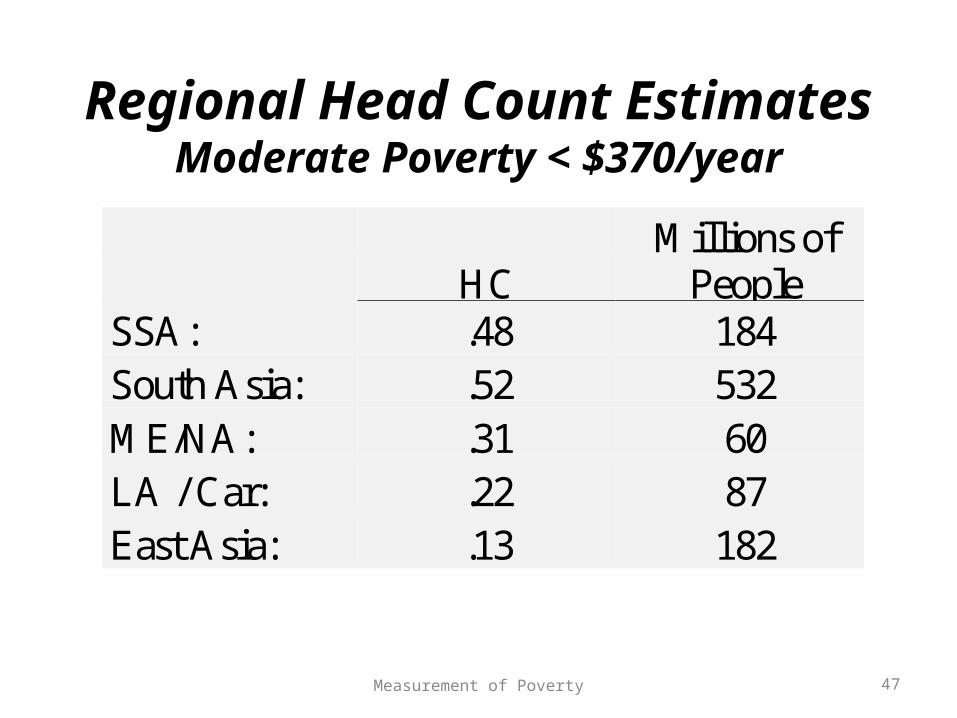
Regional Head Count Estimates Moderate Poverty < $370/year
HCMillions of
PeopleSSA: .48 184South Asia: .52 532ME/NA: .31 60LA / Car: .22 87East Asia: .13 182
47Measurement of Poverty
Absolute Poverty Gap
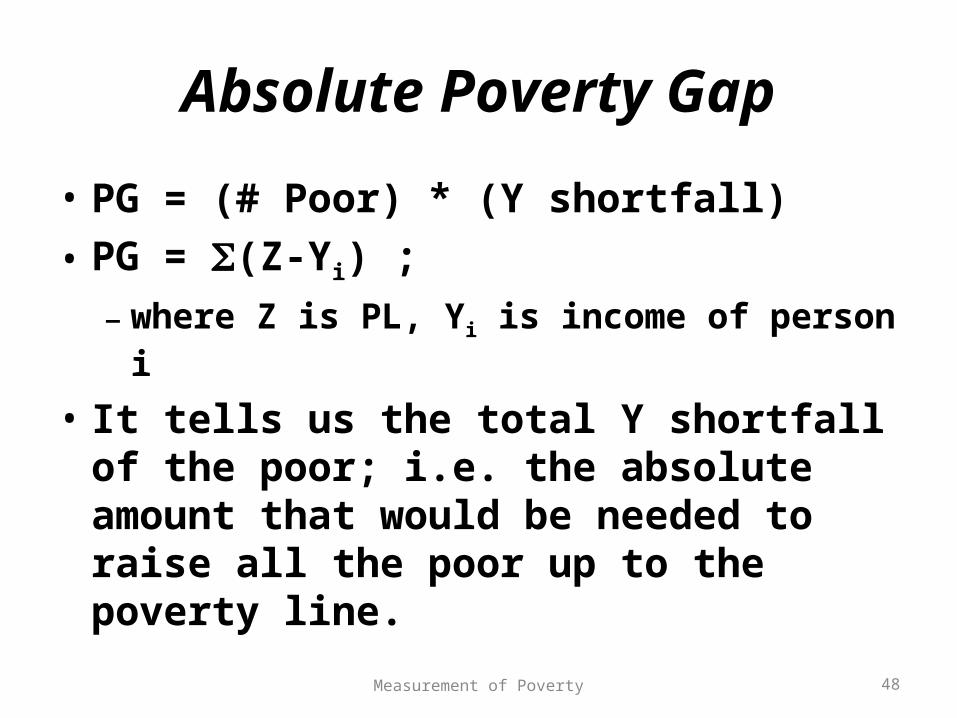
• PG = (# Poor) * (Y shortfall) • PG = (Z-Yi) ;
– where Z is PL, Yi is income of person i
• It tells us the total Y shortfall of the poor; i.e. the absolute amount that would be needed to raise all the poor up to the poverty line.
48Measurement of Poverty
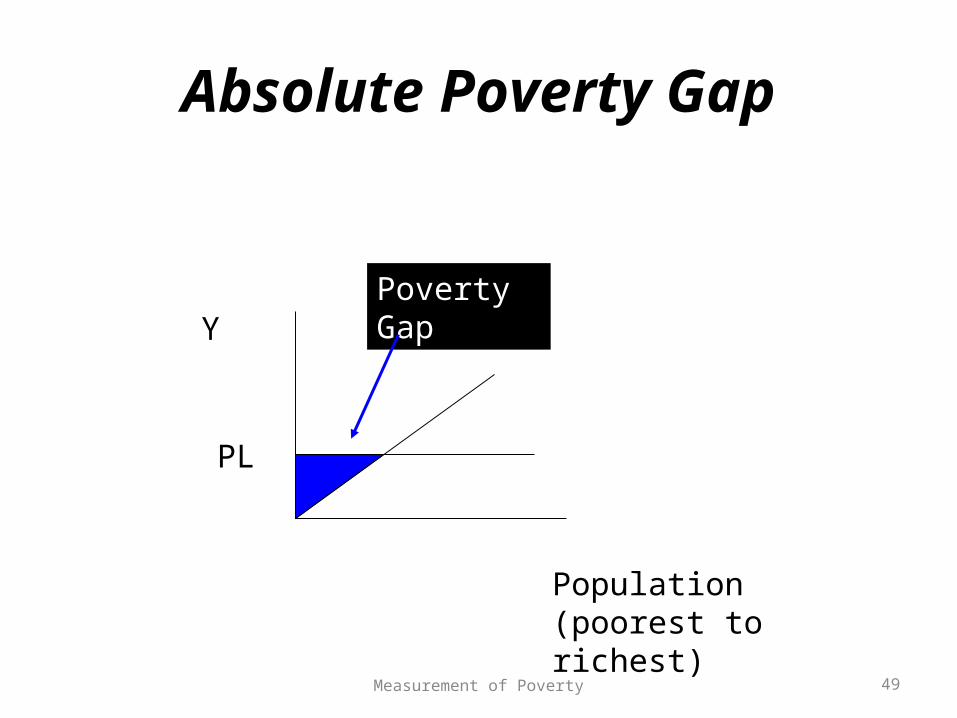
Absolute Poverty Gap
Y
Population (poorest to richest)
PL
Poverty Gap
49Measurement of Poverty
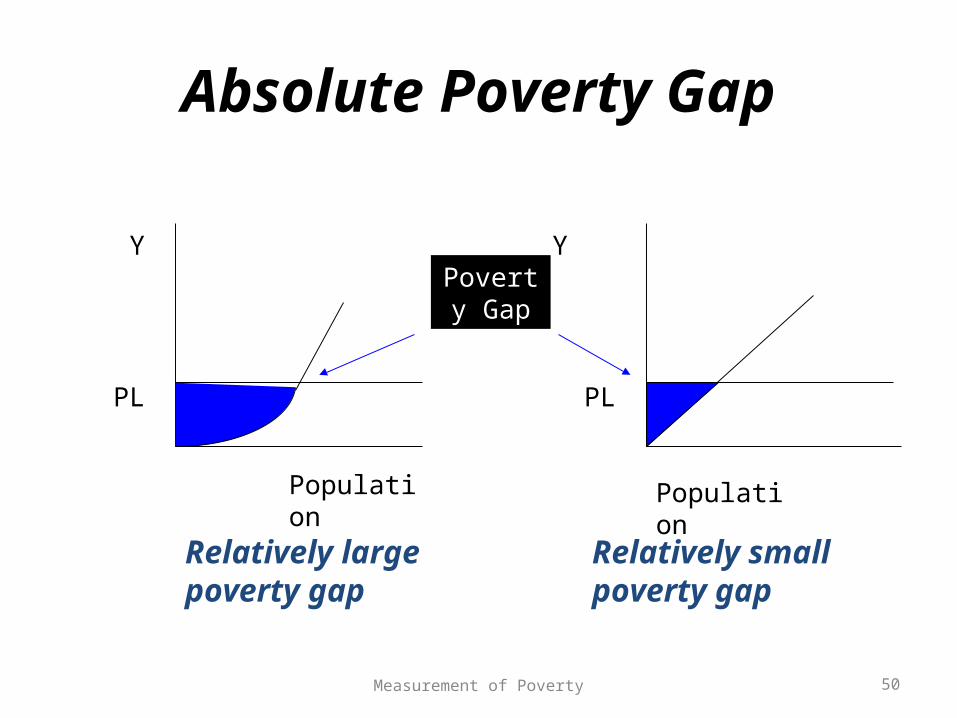
Absolute Poverty Gap
Y
Population Population
Y
Relatively large poverty gap
Relatively small poverty gap
PL PL
Poverty Gap
50Measurement of Poverty
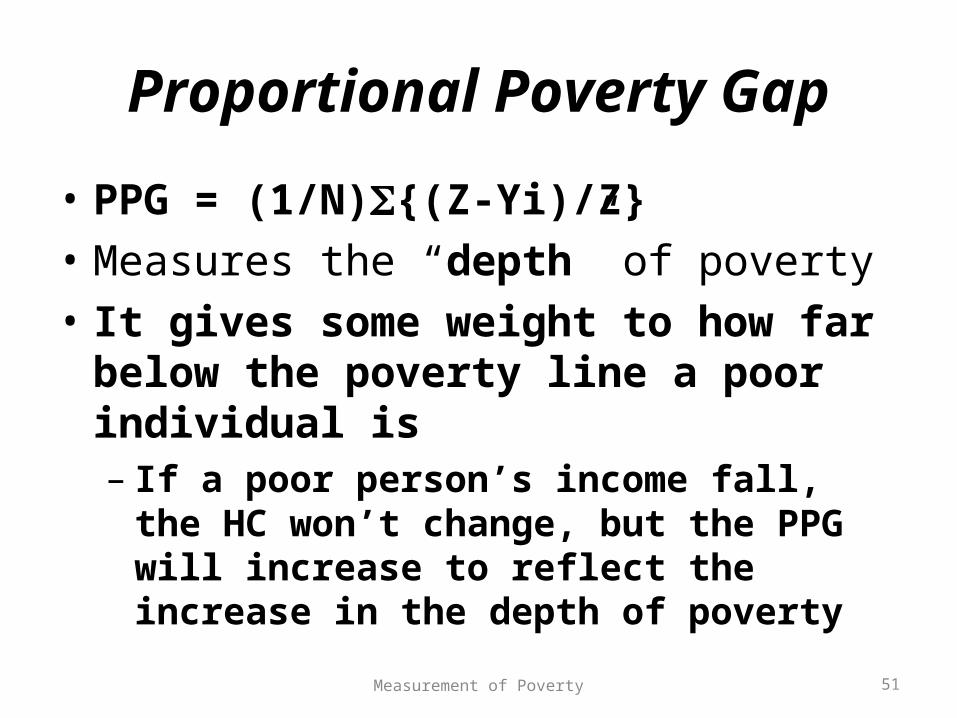
Proportional Poverty Gap
• PPG = (1/N){(Z-Yi)/Z}• Measures the “depth” of poverty• It gives some weight to how far below the
poverty line a poor individual is– If a poor person’s income fall, the HC won’t
change, but the PPG will increase to reflect the increase in the depth of poverty
51Measurement of Poverty
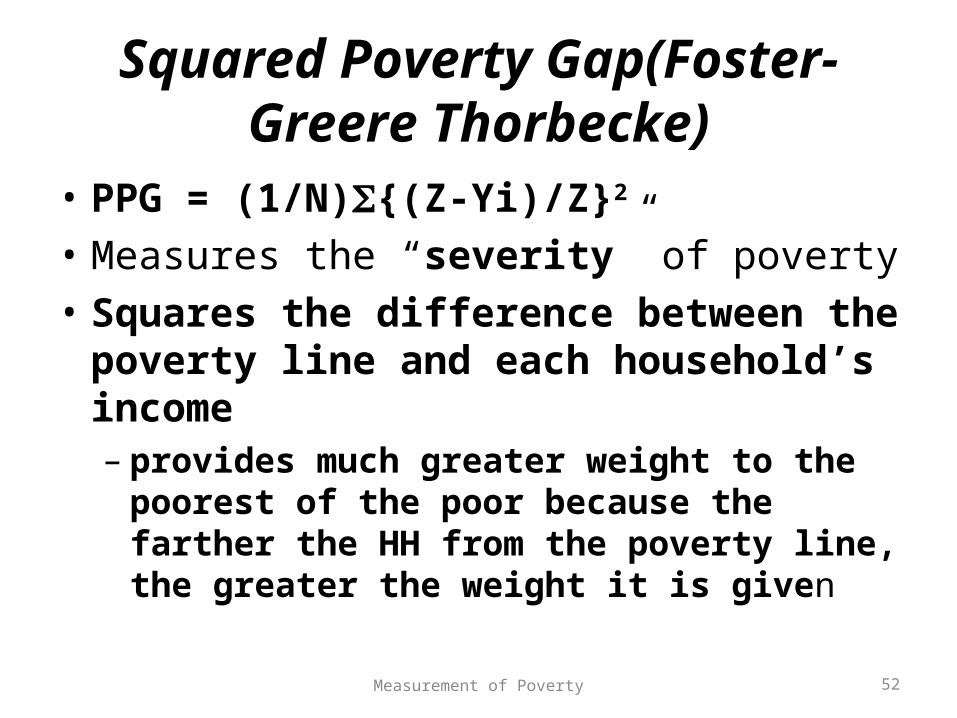
Squared Poverty Gap(Foster-Greere Thorbecke)
• PPG = (1/N){(Z-Yi)/Z}2
• Measures the “severity” of poverty• Squares the difference between the poverty
line and each household’s income– provides much greater weight to the poorest of
the poor because the farther the HH from the poverty line, the greater the weight it is given
52Measurement of Poverty
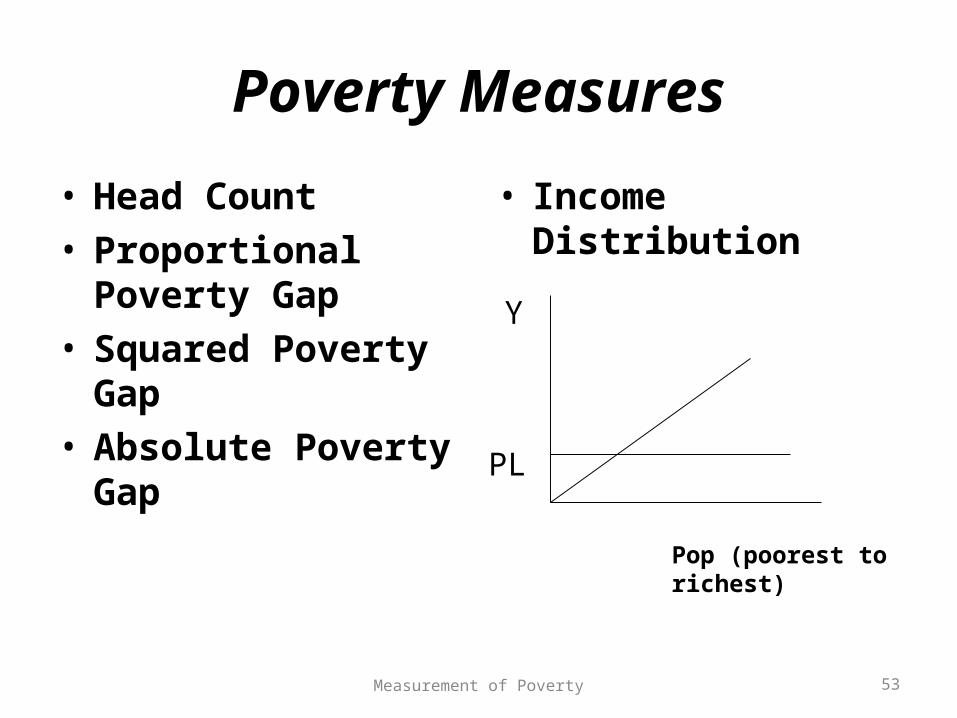
Poverty Measures
• Head Count• Proportional Poverty
Gap• Squared Poverty Gap• Absolute Poverty Gap
• Income Distribution
PL
Y
Pop (poorest to richest)
53Measurement of Poverty
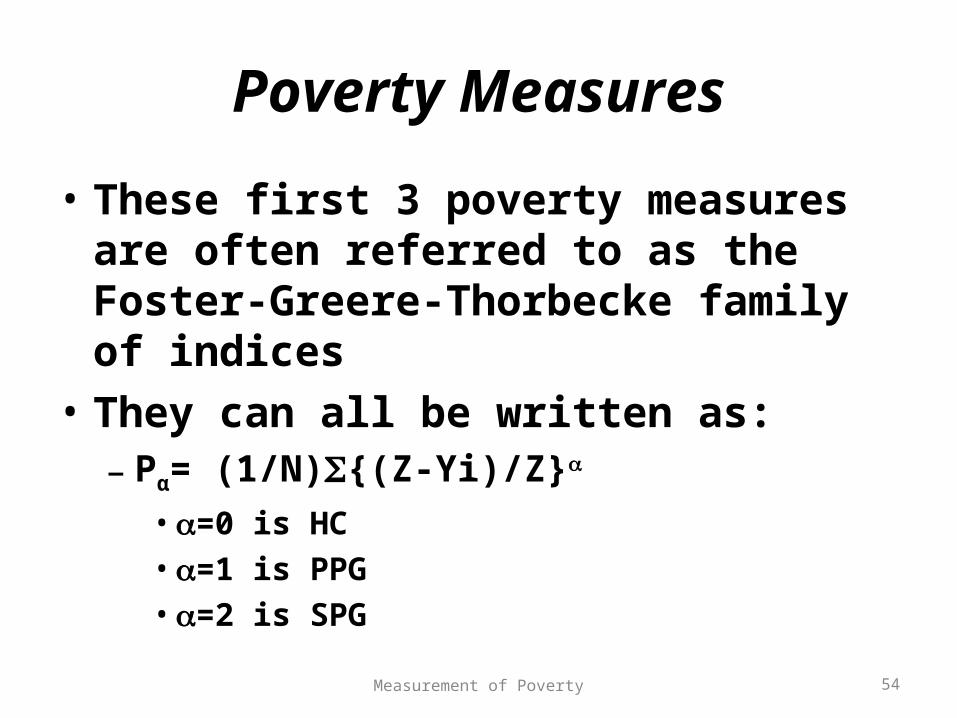
Poverty Measures
• These first 3 poverty measures are often referred to as the Foster-Greere-Thorbecke family of indices
• They can all be written as: – Pα= (1/N){(Z-Yi)/Z}
• =0 is HC• =1 is PPG• =2 is SPG
54Measurement of Poverty
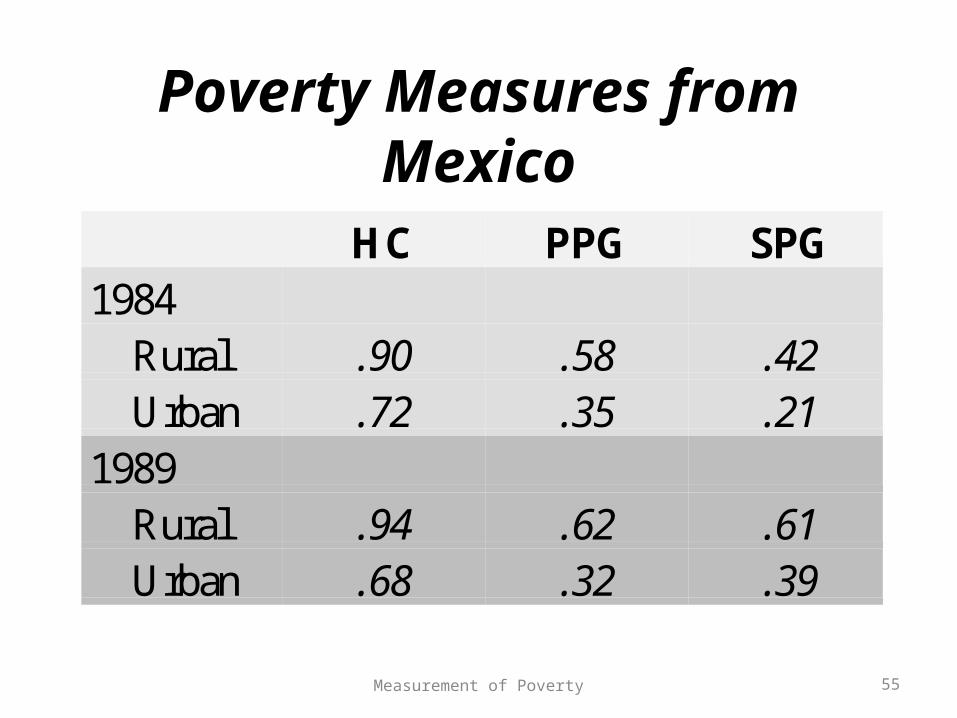
Poverty Measures from Mexico
HC PPG SPG1984 Rural .90 .58 .42 Urban .72 .35 .211989 Rural .94 .62 .61 Urban .68 .32 .39
55Measurement of Poverty
Human Development Index
• An attempt to account for some of the limitations of using just income or expenditure as a measure of welfare
• Tries to take seriously some of Sen’s arguments about capabilities – Sen argues that the goal is to increase
capabilities …to be well fed, educated, healthy– These capabilities won’t always be perfectly
correlated with income
56Measurement of Poverty
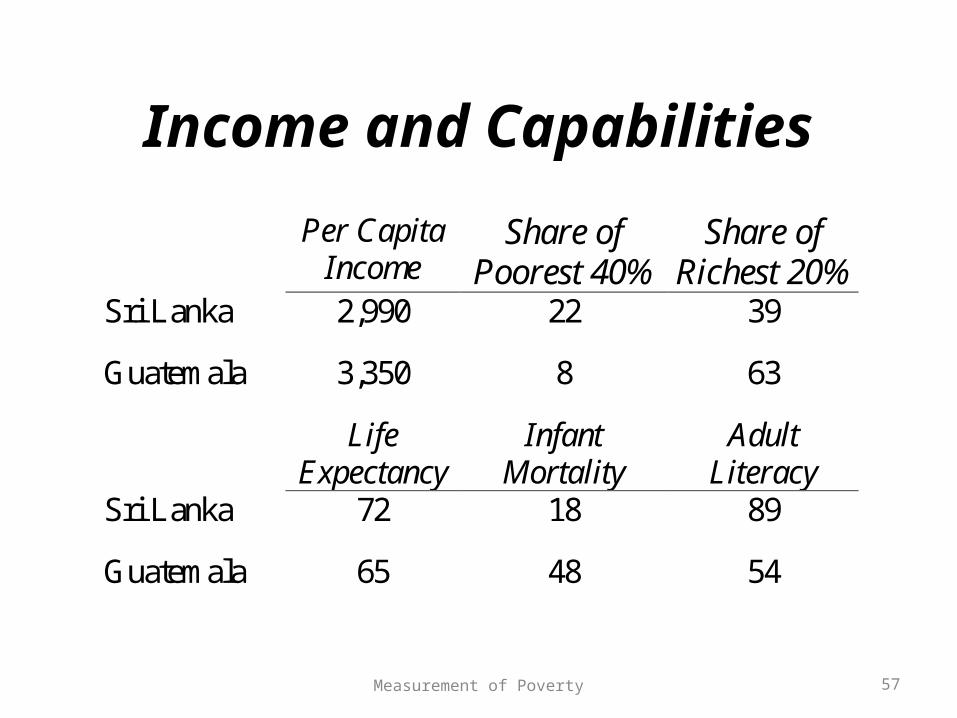
Income and Capabilities
Per Capita Income
Share of Poorest 40%
Share of Richest 20%
Sri Lanka 2,990 22 39
Guatemala 3,350 8 63
Life Expectancy
Infant Mortality
Adult Literacy
Sri Lanka 72 18 89
Guatemala 65 48 54
57Measurement of Poverty
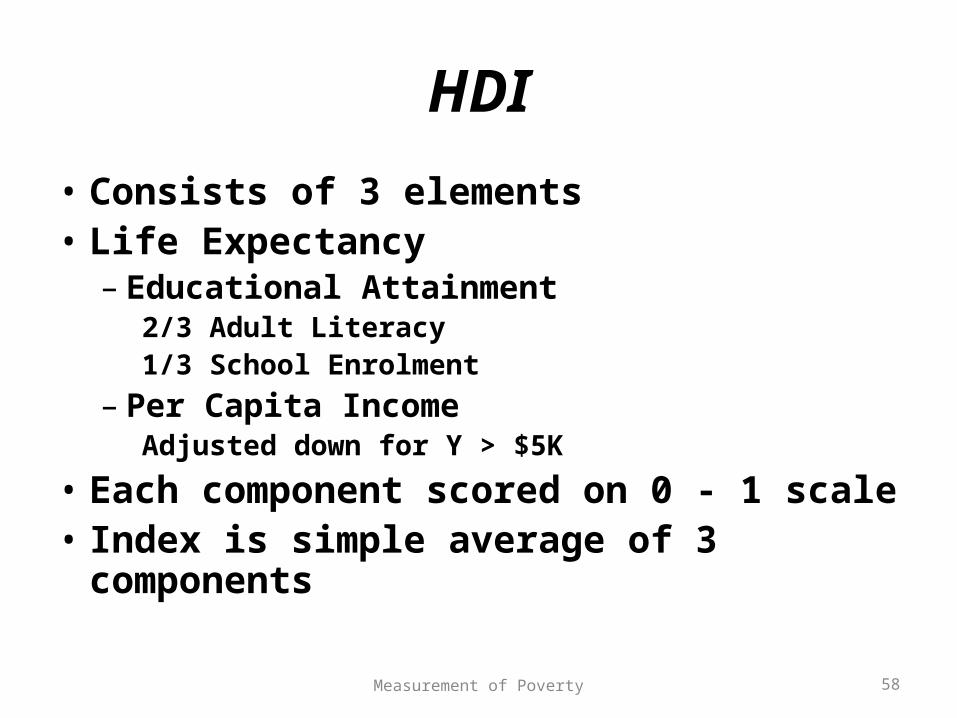
HDI
• Consists of 3 elements• Life Expectancy
– Educational Attainment2/3 Adult Literacy1/3 School Enrolment
– Per Capita IncomeAdjusted down for Y > $5K
• Each component scored on 0 - 1 scale• Index is simple average of 3 components
58Measurement of Poverty
Gender Development Index
• Motivated by inequality in the distribution of resources across gender.
• Is there evidence that resources are distributed unequally?
• The same 3 components as HDI, but gives weight to relative equality in Y and achievement of capabilities by gender.
59Measurement of Poverty
Human Poverty Index
• Attempt by UNDP to take Sen’s capability approach even more seriously
• Index combines 3 parts:Vulnerability to early deathAccess to educationOverall standard of living
• Health, water, nutrition
60Measurement of Poverty
Measurement of Poverty
The secret of truth is that there are no facts, only stories.
- Joao Ubaldo Ribeira Brazilian novelist
61Measurement of Poverty