measurement of sustainable...
TRANSCRIPT

[email protected] ‐ 1 ‐ tel:07811160822
"Not everything that counts can be counted, and not everything that can be counted counts." Albert Einstein (or so the legend goes)
ADAM WILKINSON AND ASSOCIATES by Adam Wilkinson and Bill Kirkup Disclaimer The views expressed in this paper are those of the author, and do not necessarily reflect the policy of the East Midlands Development Agency.
September 09
Measurement of Sustainable Procurement
[email protected] ‐ 2 ‐ tel:07811160822
EXECUTIVE SUMMARY 4
CRITICAL REVIEW FINDINGS 5 MEASUREMENT FRAMEWORKS 7 SUPPLIER SURVEY 9 FINAL RECOMMENDATIONS 11 STRATEGIC 11 OPERATIONAL 12 OTHER 12
SECTION 1 CRITICAL REVIEW 13
1.1 INTRODUCTION 13 1.2 CONTEXT 13 1.3 MEASURING SUSTAINABILITY 15 1.3.1 PROXIES 16 1.3.2 WHOLE LIFE COSTING/ LIFE CYCLE COSTING/ TOTAL COST OF OWNERSHIP 18 1.3.3 KEY PERFORMANCE INDICATOR SETS 22 1.3.4 ASSESSMENT OF THE SUITABILITY OF WLC AND KPIS FOR USE BY EMDA AND OTHER PUBLIC SECTOR
ORGANISATIONS 26 1.4 METHODOLOGIES USED FOR MEASURING THE ENVIRONMENTAL IMPACTS OF PROCUREMENT. 27 1.4.1 CARBON MEASUREMENT 27 1.4.2 AN ASSESSMENT OF THE RELATIVE STRENGTHS AND WEAKNESSES OF CARBON MEASUREMENT
METHODOLOGIES 32 1.5 METHODOLOGIES USED FOR MEASURING THE ECONOMIC IMPACTS OF PROCUREMENT. 36 1.5.1 MULTIPLIERS 37 1.5.2 LM3 MODEL 38 1.5.3 INPUT‐OUTPUT MODEL 39 1.5.4 AN ASSESSMENT OF THE SUITABILITY OF ECONOMIC MEASUREMENT METHODOLOGIES 40 1.6 METHODOLOGIES USED FOR MEASURING THE SOCIAL IMPACTS OF PROCUREMENT. 42 1.6.1 INTRODUCTION 42 1.6.2 AN OVERVIEW OF SOCIAL INDICATOR FRAMEWORKS 43 1.6.3 AN ASSESSMENT OF THE RELATIVE STRENGTHS AND WEAKNESSES OF SOCIAL INDICATOR FRAMEWORKS 47 1.6.4 AN ASSESSMENT OF THE SUITABILITY OF SOCIAL INDICATOR FRAMEWORKS 49 1.7 CONCLUSIONS 50 2.1 MEASURES SELECTION METHODOLOGY 53 2.1.1 GATEWAY CRITERIA 53 2.1.2 MEASUREMENT SELECTION 54 2.1.3 MEASUREMENT SCORING 57 2.1.4 SUGGESTED MEASURES (SUMMARY) 59
SECTION 3 PILOT SURVEY 61
3.1 PURPOSE OF QUESTIONNAIRE 61 3.2 SAMPLE 61 3.3 RESULTS 61 3.3.1 RESPONSE 61 3.3.2 ECONOMIC DATA 62 3.3.3 ENVIRONMENTAL 64 3.3.4 SOCIAL 65 3.4 RECOMMENDATIONS AND CONCLUSIONS

[email protected] ‐ 3 ‐ tel:07811160822
SECTION 4 FINAL CONCLUSIONS AND RECOMMENDATIONS 68
4.1 FINAL RECOMMENDATIONS 68 4.1.1 STRATEGIC 68 4.1.2 OPERATIONAL 69 4.1.3 OTHER 69
APPENDICES 71
APPENDIX 1 MULTIPLIERS 71 APPENDIX 2 LOCALISATION 74 WHAT IMPLICATIONS FOR THE DEBATE ON LOCALISATION? 74 APPENDIX 3 LETTER TO SUPPLIERS 76 APPENDIX 4 QUESTIONNAIRE 77
[email protected] ‐ 4 ‐ tel:07811160822
Executive Summary Public policy increasingly expects procurement to deliver a wide range of strategic policy objectives beyond the goods, services, works and utilities procured. This approach is broadly called Sustainable Procurement, encompassing the three key elements of sustainability (economic, environmental and social objectives).
Sustainable Procurement is a process whereby organisations meet their needs for goods, services, works and utilities in a way that achieves value for money on a whole life basis in terms of generating benefits not only to the organisation, but also to society and the economy, whilst minimising damage to the environment. Procuring the Future, Recommendations from the Sustainable Procurement Task Force, 2006
The UK Government’s Sustainable Development Strategy, Securing the Future, 2005 committed the Government to spend taxpayers’ money sustainably with the ambition to be recognised as being among the leaders in Sustainable Procurement across the EU member states in 2009. The Secretary of State for DEFRA and the Chief Secretary to the Treasury set up a business‐led task force to devise a National Action Plan. The Sustainable Procurement Task Force was established in May 2005 and published its recommendations a year later in Procuring the Future, DEFRA, 2006. Government responded to the recommendations of the Sustainable Procurement Task Force with the publication of Transforming Government Procurement, HM Treasury, January 2007 and UK Government Sustainable Procurement Action Plan, March 2007, which set out the actions to create a transformation in public services and Government supply chains to be increasingly low carbon, low waste, water efficient, respect bio‐diversity and deliver wider sustainable development goals. The policy environment affecting public procurement does not stand still. Since the publication of the Government’s Sustainable Procurement Action Plan we have witnessed the following examples of public policy initiatives identifying public procurement as a means to deliver strategic objectives. These include:
• More Small and Medium Sized Enterprises (SMEs) supplying the public sector as described in Accelerating the SME Economic Engine: through transparent, simple and strategic procurement, HM Treasury, Nov 2008. Known as the Glover Report, this examined what Government could do to make it easier for SMEs to contract with Government.
• Driving demand for new technologies, skills and processes as described in New Industry New Jobs, BERR (now BIS), April 2009. This outlined the aspiration for public procurement to have a powerful role in shaping markets, placing smarter, more strategic procurement as key to encouraging innovation and transforming the UK to a low carbon economy.
[email protected] ‐ 5 ‐ tel:07811160822
There are many challenges in translating public policy aspirations into day‐to‐day procurement practice. Arguably the biggest challenge to the success of delivering sustainable policy aspirations through public procurement lies in knowing what impact, if any these procurement practices will have. Commissioned by emda, this work seeks to better understand how success can be measured and how this can be embedded through implementation. The objective of the report is to generate a methodology that produces meaningful measures of sustainability that can be used within the procurement process. This is achieved by means of a critical review of existing methodologies that provides a considered base from which to recommend examples of smart indicators to measure key elements of sustainability. These have then been piloted with a subset of emda’s tier one suppliers.
CRITICAL REVIEW FINDINGS
The first key point of the review is that measurement and rigorous methodology are not a substitute for clearly stated policy intentions and prioritisation. A methodology for measuring impact can be applied, but to make it meaningful it needs to be used in the context of achieving the desired objective. It is this point that both underpins the need for a strategic approach to procurement and is also the reason for the growth in thinking about outcome based approaches. Some broad principles are established at the outset in order to determine a framework in which to construct meaningful measures of sustainability that can be applied to procurement practice. The first principle is that any measures or methodologies that are used in procurement practice need to be objective and should therefore be blind to the aspirations of public policy in their application. This means that they should simply measure the impact of public procurement in sustainability terms, independent from and neutral to the primacy of any particular public policy agenda. The second is in the overall approach to measurement in procurement practice. In defining sustainable procurement, the Government describes measuring achievement both in terms of ‘value for money on a whole life basis and generating benefits not only to the organisation, but also to society and the economy, whilst minimising damage to the environment’. These two approaches are explored as the paper considers the strengths and weaknesses of the use of whole life costing (WLC) and key performance indicators (KPIs). It concludes that while WLC may offer a longer term way forward, and is of real value now in some specific areas, this is currently outweighed by the demands of specialist data and the benefits of using well constructed KPIs. The suggested solution is that by using a smart KPI approach one can utilise the results of different methodologies across a number of different indicators that encompass the three dimensions of sustainable development (economic, social, and environmental).
[email protected] ‐ 6 ‐ tel:07811160822
A third strand in considering indicators lies in differentiating between generic and specific KPIs. The suggested solution is that for each dimension of sustainable development there are a small number of generic or corporate level indicators that should occur in almost all procurements. There are then a larger number of KPIs that may be applied specifically depending on considerations such as the value of the procurement, type of goods or services, and the desired strategic outcome. A final consideration in relation to meaningful indicators lies in the construction of proxy indicators. Proxy indicators have value in that they attempt to describe in a systematic way, a series of what could be considered subjective benefits. Proxy indicators can be categorised as direct and indirect proxies. Indirect proxies are more problematic and a particular challenge lies in monetising measures. At its simplest level it would be easiest if all indicators could be reduced to a reflection of either their costs or their contribution in financial terms as it would be easy to compare measures across different areas ‐ environmental, economic and social. Using monetised indicators in the economic arena is not particularly hard, but even here we see that other non‐financial indicators, such as Full Time employment (FTE) are also important. Where monetising proxy indicators becomes rapidly more complex is in the social field. By attempting to monetise social value the ‘£’ ceases to be a direct proxy and becomes an indirect proxy and one that is sometimes too far removed to be truly meaningful. The rejection of monetised proxies is recognised by the authors as being contentious. However it is seen as critical if a realistic and practical approach to using social indicators in public procurement is to be successful. In reviewing the practical application of social indicator frameworks to procurement practice, Social Return on Investment (SROI), Social Accounting and Audit (SAA) and Social Capital were explored. The conclusions drawn were that SROI works best as an appraisal / evaluation tool and does not easily translate to procurement practice. All three have substantial limitations in their practical application to procurement. However the review identified an existing example of using an ‘outcome star’ in procurement in Camden. By presenting a balanced suite of quantified, non‐ financial indicators in this way, the approach enables genuine comparison between products and/or suppliers. This could be easily adapted to support a KPI approach to measuring sustainability. In reviewing approaches to measuring the environmental impact of procurement we concluded that in an ideal scenario, input‐output models should be used in conjunction with other sources of information, such as existing generic/specific product information, and complementary tools such as activity emissions tools. For example a public procurer might request their suppliers to measure their emissions so that carbon reduction activity is registered. The development of a simple carbon footprint is not unduly onerous or complex although some suppliers may require support. A range of free on‐ line activity‐emission tools exist, we would suggest that the one developed by the Carbon Trust be applied and that suppliers be encouraged to achieve the Trust’s ‘Carbon Standard’.
[email protected] ‐ 7 ‐ tel:07811160822
Two broad approaches were reviewed in relation to measuring the economic impact of procurement: input/output models and multipliers. The conclusion was that both are needed to provide the range of information required by public bodies. Input/output should be seen as a broad strategic tool whereas LM3 is much better adapted for the assessment of local impact. The two approaches have been reconciled in practice in a project managed by the author on behalf of the Regional Development Agency in the North East (ONE), which looked specifically at the impact of public procurement on regional economies. As a final note on sustainable impacts, it is likely that the region’s public sector bodies ‘share’ many of their suppliers. We would recommend that where shared supply chains exist a collaborative approach is taken to supply chain engagement on sustainability issues such as carbon. As a starting point, procurers should agree a common approach to any measurement activity they or their suppliers undertake. The Government’s definition of sustainable procurement encompasses the three dimensions of sustainable development (economic, social, and environmental), each with its own agendas and proposed solutions. It is therefore not at all surprising that no single methodology emerges as being the complete answer, however what is unexpected is how some key themes have emerged in each area, these being the functionality of KPIs and the prevalence of input/output models.
MEASUREMENT FRAMEWORKS
The report moves forward from the review process to construct a methodology capable of producing a set of KPIs that can be used within procurement and provide meaningful measurement of the sustainability impacts. In order to achieve this, the following areas are discussed and conclusions reached. Gateway Criteria – For an indicator to become a candidate it must pass two key tests. These are that any measure:
1. Must be usable within a public procurement process; and 2. Must be capable of being expressed as a key performance indicator
Given the conclusion reached in the critical review, that monetising non‐financial proxies is not an acceptable way forward for achieving the aim of sustainable procurement indicators, other direct proxies were found that are both simpler and meet the gateway criteria. Two forms of KPI emerge. Corporate/generic indicators are few in number but apply to all strategic objectives of the organisation and should be used in all procurements, such as GVA or carbon saving. They would be monitored for impacts throughout the lifetime of the delivery of the good or service. The second are more specific to individual procurements. The methodology developed can and should be used to develop a ‘basket’ of such, specialised indicators.
[email protected] ‐ 8 ‐ tel:07811160822
All candidate indicators needed to be assessed against the following criteria:
1. Suitability 2. Availability 3. Objectivity 4. Scalability 5. Prioritisation 6. Strategic
This then produces a scoring template against which potential indicators can be rated and selected. Many sources of candidate measures were considered. The principal reasons for rejection were either for failing the gateway tests or on the basis of the criteria described above. The objective was not to produce an exhaustive list of possible generic and specific KPIs nor was it to generate an ‘ideal’ set; it was to produce a methodology which would enable potential KPIs to be identified. The outcome of the measurement selection process is a set of generic indicators with some examples of specific indicators that could then be tested against emda’s supply chain as a test of practicality. From over 200 potential indicators, nine generic and four specific indicators were produced across the three areas of sustainability – economic, environmental and social. Generic indicators:
• Economic ‐ Gross Value Added (GVA) (this indicator only works at regional scale and is a standard measure of economic value used by national government);
• Economic ‐ Full Time Employment (FTE) (standard organisational output target for the majority of regeneration related activity);
• Economic ‐ Consumer Re‐spend Propensity (basis for calculation of economic impact);
• Environmental ‐ Number of deliveries received (proxy for indicative mileage and carbon output);
• Environmental ‐ % of value of eco‐labelled products bought (proxy for supply chain carbon and carbon equivalence);
• Environmental ‐ % of suppliers with an Environmental Management System (proxy for degree of environmental awareness and action);
• Social ‐ % of suppliers involved in voluntary industry initiatives (proxy for social capital/community involvement – wellbeing);
• Social ‐ % by value with third sector organisations (direct numeric measure of socially based activity);
• Social ‐ % by value with social value initiatives (proxy for social orientation of supply chain).
Specific indicators examples:
[email protected] ‐ 9 ‐ tel:07811160822
• Economic‐ % spend with distributors (taken with the indicator ‘% spend with producers’ this can provide additional data for multiplier of regional economic value);
• Economic ‐ % spend with producers (taken with the indicator ‘% spend with distributors’ this can provide additional data for multiplier of regional economic value);
• Environmental ‐ Use of Whole Life Costing (where appropriate data exists, such as timber, this approach can give a more complete picture);
• Social ‐ % value to good cause (Proxy for contribution to community).
SUPPLIER SURVEY
125 of emda’s tier one suppliers were selected in order to test the KPIs that had been generated. 57 responded to the questionnaire that was conducted by a series of telephone interviews. Key findings were:
1. By and large respondents could see the value in the questionnaire and encouragingly some suppliers were keen to collect more data to measure their sustainability impact but wanted to know what data to collect, and have an assurance that any sustainability reporting requirement would be consistent across the public sector.
2. Although some economic data was available, suppliers found it challenging to
supply comprehensive impact data across the three dimensions of sustainability. The findings clearly demonstrate that more leadership is required from the public sector, making it clear what information is required in order to measure sustainability.
3. Economic indicators worked well as would have been expected, the major
difficulty being the regional breakdown of spend. Further analysis of the survey data shows that the suppliers who responded had a total turnover of £274 million. By applying an indicative LM3 calculation (discussed in detail in the section considering methodologies for measuring the economic impact of procurement), this suggests a regional economic impact of emda’s suppliers of £473 million. Using the same technique an indicative estimate of emda’s own direct regional economic impact from procurement was £216.55 million from an annual spend of £125.9 million (this includes Single Programme, National Coalfields Programme and European Programme spend and does not include emda’s wages and admin costs) in 2007/08.
4. Environmental assessment worked well within the constraints of a lack of
information and suppliers saw the measures as being practical. The striking finding is that although policies may be in place (expressed as a tender requirement), the ongoing monitoring of suppliers performance in these areas are not. This echoes other research work by IBM, June 2009.

[email protected] ‐ 10 ‐ tel:07811160822
5. Social indicators were seen as the least successful area. Business does not have a coherent approach to achieving or measuring social benefit. However the inclusion of employment and other specific socio/economic measures would make a significant difference. The opportunity for public sector bodies to provide leadership to the private sector in this area was seen as critical.
[email protected] ‐ 11 ‐ tel:07811160822
FINAL RECOMMENDATIONS
STRATEGIC
For public bodies to successfully utilise procurement to deliver sustainable development objectives, the findings of this study lead the authors to identify the following strategic recommendations:
1. Develop a standardised approach to measuring strategic outcomes across public sector procuring organisations, bringing clarity to markets by better specifying what they wish to buy and supporting suppliers to respond to consistently applied measures. This would provide an opportunity for suppliers and their supply chains to develop their own management and measurement systems and processes to collect and report outcomes in line with public policy goals.
2. Reconcile the policy aspirations that public procuring organisations are
required to deliver through procurement. It is necessary for an organisation to possess a clear strategic view of its sustainability objectives across economic, environmental and social areas and to be able to prioritise which outcomes any given procurement should deliver.
3. Clearly link the organisation’s impact measurement process to its strategic
sustainability objectives by establishing a meaningful set of measures that support their delivery.
4. Adopt an Outcome based approach to procurement as the key mechanism to
generate sustainability benefits through procurement.
5. We would recommend that consideration is given to further developing the KPI selection process into a standalone methodology that could be made available, free to all public organisations.
6. We recognise the need for a parallel process to take place to enable business
support organisations to support existing and potential suppliers to the public sector to demonstrate their delivery of sustainable outcomes perhaps through awareness raising, training and an ongoing support mechanism.
[email protected] ‐ 12 ‐ tel:07811160822
OPERATIONAL
From an operational perspective, the authors make the flowing recommendations:
1. Incorporate sustainability indicators in the form of smart KPIs into the corporate performance management systems of public procurers.
2. Create synergy between corporate KPIs that are used to monitor activity in
order to measure impact, and criteria used to score tenders. It is critical that the KPIs that are generated are translated and applied to the procurement process.
3. Develop the operational systems and procedures within procuring
organisations to embed sustainability measurement into day‐to‐day procurement and monitoring practice. This would help suppliers to know what information they need to produce and when and would provide the public sector leadership that is required, particularly in the social impact area.
4. In implementing the approach, procuring organisations should develop
operational guidance, that considers proportionality and the appropriate application of outcome based specifications. The value and the nature of the good or service may influence the extent to which strategic outcomes can be sensibly achieved through the procurement.
5. We would strongly recommend the development of an impact measurement
tool that would enable the organisation to monitor all KPIs in contracts and then have the ability to accumulate these to feedback the results against the corporate objectives. Such a tool would also be able to produce specific KPI data requests to individual contracts. This would greatly aid suppliers to improve their own data collection, as well as supplying a comprehensive mechanism for assessing sustainability for the procuring organisation.
OTHER
We would recommend identifying a number of key, large scale projects to demonstrate the approach outlined in the recommendations above. In doing so both process and strategic outcomes could be achieved and measured. Any demonstration of the approach should include the provision of practical support both for buyers and suppliers to develop the appropriate systems and processes to deliver sustainability through procurement.
[email protected] ‐ 13 ‐ tel:07811160822
SECTION 1 CRITICAL REVIEW
1.1 INTRODUCTION
Public policy increasingly holds up procurement as the means to deliver a wide range of policy aspirations through delivering strategic objectives beyond the goods, services, works and utilities procured. The challenge lies in choosing which strategic objectives should be achieved by any given procurement and then applying these priorities to procurement practice and measuring the impact in terms of the sustainable outcomes. It was not until the publication of ‘Procuring the Future’ in June 2006 that for the first time Economic, Environmental, and Social factors were all recognised as being of equal importance in sustainable procurement. It is the intention of this review to act as a standalone report on the various approaches that have been taken to measure the three key elements of sustainability. Given the size and complexity of the task this is not a teaching manual, rather it tries to bring together the field for the perspective of the public procurer. We have concentrated on the implications for procurement rather than quality of methodology per se. It is therefore not surprising that any review of methodologies uncovers a very disparate set of both approaches and measurement. Historically procurement departments have often operated quite simple rules. For example many procurement officers are still likely to explain that it is not possible to use ‘local’ as part of a procurement process. The most commonly stated reasons for this are either that this favours local companies and would therefore be uncompetitive or (more usually) that this is illegal under EU law. The point here is that what is considered ‘usable in procurement’ is more often an historical perspective that has more to do with risk aversion than actual legal basis. A recent and not yet published paper from the leading UK solicitors on the use of Social Clauses in public procurement expresses this as follows: “In Europe there appears to be a willingness to explore Europe‐wide good practice in taking into account social considerations in procurement. So at a UK government level, is the spirit willing, but the flesh wobbling?” Mark Cook – Anthony Collins Solicitors “Fresh Thinking” March 2009
1.2 CONTEXT
All public bodies have corporate and procurement strategies, but in our experience these often do not relate to each other and the actual process of procurement fails to reflect the objectives of these strategies. Currently most organisations produce spending information of some form. Local authorities were instructed to do this for the first time a few years ago as part of the
[email protected] ‐ 14 ‐ tel:07811160822
Regional Centres for Excellence in Procurement initiative (now merged into the Regional Improvement and Efficiency Partnership network). More recently there is discussion about what role Local Spending Reports could play. These were generated by the Department for Communities and Local Government (CLG) in April 2009 to meet the requirements of the Sustainable Communities Act, 2007. In all of these cases there is a desire to know and to show what impacts are being achieved on behalf of the communities and businesses that these bodies represent, whether this is Local Authority, Health Service, or Regional Development Agency. Potentially this data could show what contribution is being made to the regeneration and sustainable economic development of communities. In addition it could be used to demonstrate how social and environmental policy is being delivered and how effectively the strategic aims of the organisation are being met. Sadly all of this potential is wasted if spend data is not first compiled within a context of strategic objectives. Second the data needs to be used within a procurement mechanism that provides a way of delivering the strategic priorities. Finally the impact of this activity on sustainable development needs to be recorded by use of meaningful measures across economic, social, and environmental indicators. In effect expenditure information is a record of procurement activity. In order to deliver the real value the raw spending data needs three elements added to it. First we need to more closely relate public sector procurement activity to achieving public policy and strategic objectives that are desired. All procurement is now meant to be sustainable so spend analysis should demonstrate this. In fact a spend review should provide intelligence to support the delivery of corporate strategies. For example what % of total spend contributed to the delivery of carbon reduction targets? This is perfectly possible but not until we have the integrated approach described. Second we need to operate not with raw data but processed data that is meaningful for businesses, organisations and policy makers. The simplest way to do this is by adding key elements to the data. For example if we wanted to assess economic impact we can add the postcode of where the supplier is based. This then enables us to capture immediately an indicative economic impact for the locality with no further data (other than the constants derived by using the variation of the LM3 1 model developed in the North East across all 25 councils). This provision of a context for data is absolutely essential to the delivery of meaningful information. Third we need to embed these key performance indicators (KPIs)2 so that as priorities are decided at a strategic level and then expressed in meaningful KPIs they 1 LM3 is discussed in detail in the document as one of the economic measurement methodologies page 33
2 KPI are discussed in detail on page 18 onwards.
[email protected] ‐ 15 ‐ tel:07811160822
are then included as standard within the procurement process. We then need to capture the impact of these within the delivery of the goods or service. By making this a standard and automated part of monitoring we can then complete the circle and demonstrate with authority what the impact of spending is on communities, businesses and the economy. This information is what then gives real meaning to the spend review. The benefits of this approach are:
• Businesses, for the first time, would have greater clarity, enabling them to respond to public sector demand in a way that they can plan for, and demonstrate that they are contributing to the delivery of strategic objectives in line with public policy objectives.
• Purchasing organisations would be able to show how the strategic objectives
of Government and their organisation were being delivered, not only in terms of headline figures but actual direct impacts. In addition the adoption of an outcome based approach would also provide direct evidence of performance for impact evaluations, audits and other national requirements such as Comprehensive Area Assessments (CAA). It is in fact likely to demonstrate that far higher returns are already being delivered but currently go unreported because of a lack of the mechanism described.
• National government could accumulate standard spending data in a
meaningful way. This would enable a much better methodology for joining policy both across national ministries such as DCLG, BIS, and Defra, but also and critically bridging the gap between national, region, and local service delivery and policy.
1.3 MEASURING SUSTAINABILITY
Each of the three key elements of sustainability (economic, environmental and social) has quite distinct problems and opportunities associated with them. Economic assessment is well established. It has the great advantage that it is trying to measure wealth and that wealth is represented by a universally accepted standard measure, the £. It has until now operated within a broad consensus from the academic and professional world. In this sense the challenge is largely limited to a discussion of the effectiveness of measurement techniques and perhaps more important the availability of this data to procurers and monitoring organisations. In stark contrast the social world has exactly the opposite difficulty. Here there is agreement that many of the ‘softer’ impacts on communities and individuals are critical to success. Sadly it has proven to be extraordinarily difficult to provide measurements that span the gap between being objective in the sense of being usable within a public procurement system, and yet sensitive enough to capture the
[email protected] ‐ 16 ‐ tel:07811160822
subtlety of the benefits that both beneficiaries and organisations claim are needed for a more sensible implementation of public policy. These difficulties pale into insignificance when environmental methodologies are considered. This is a booming, buzzing world where all proponents are simultaneously trying to develop models that assess accurately the impact, measures that can inform these assessments, and standardised calculation techniques. Even when these are attempted there is still relatively little data to use. Finally unlike economic and for the most part social elements, all of these are measures are interdependent. A lower carbon count may easily mean a higher methane count. This is a hugely complex area in its very earliest days. It is therefore perhaps surprising to find that despite all of these differences emerging from the review common trends can be identified. For example running throughout the methodologies is a desire to produce measurable outcomes. There is agreement that KPIs, where they are embedded in the procurement process, offer a practical way forward (this is fully discussed in the later in the report). There is a universal agreement that measurement needs to be blind in its application and this has important implications for the Localisation debate that is included as an appendix to the review. Such is the complexity of this area and the range of emerging methodologies we have chosen to take a slightly different approach from normal. Instead of a straightforward description and analysis of the effectiveness of different approaches we have instead started with an analysis not of a methodology but with a discussion of the measurement themes that will concern us in this report. Three key elements of discussion are required. These are: Proxies and their use in measurement; Whole life costing; Key Performance Indicators. The conclusions of this discussion then enable us to examine the various economic, social and environmental methodologies from a consistent and reasonably solid base.
1.3.1 PROXIES
If it is our intention to prioritise strategic outcomes and then express these in measures that are meaningful and usable within a public procurement process, then
[email protected] ‐ 17 ‐ tel:07811160822
we need to begin by considering what types of measurement are available to us and what constraints may apply to them. In a perfect world we could use actual data, so if we wanted to measure the economic activity generated by a procurement we would start by knowing the benchmark, carry out our activity and then calculate the difference. Unfortunately we do not live in a perfect or discrete world so we have to use proxy measures. For the purpose of this debate we can divide these into two types. Those that are direct proxies for example in economic areas, ‘% of turnover spent locally’ and those that are indirect. While direct proxies are relatively straight forward, indirect are more problematic, particularly concerning the difference between an indirect proxy and a monetised proxy. For example if we were seeking to measure the impact of a new community centre, we might want to measure the number of volunteers, or incidents of anti‐social behaviour. Both of these are proxies. We could argue about how good they are at demonstrating impact on say community sustainability/regeneration but they are direct proxies in the sense that one can measure them. We can say before the community centre there were x incidents reported, after there were y and show the difference. A monetised proxy is when this direct proxy is taken and a value ascribed to it. So for example in our community centre if we had the aim of regenerating an area by employing unemployed people we could, as a direct proxy, measure the actual number of people. However a monetised proxy such as those used in Social Return On Investment (SROI)3 would then take that figure and seek to calculate a value for it. For example, the amount saved on state benefit + income tax generated is a first generation calculation and is both direct and objective. Where this gets more difficult is that many practitioners argue that in fact far more value is generated through this intervention than just these direct values, and that therefore these softer outcomes should also be valued. So we know that, for example, people in employment cost less to the Health Service, and they commit less crime. A value based approach generates a monetary value for these kinds of indirect outcomes. However these figures are not true cash savings and therefore are neither objective nor directly quantifiable. This in practical terms alone renders them unlikely to be effective as meaningful measures. This is a contentious area as prevailing fashion is that an SROI type approach will yield the most benefit and considerable national investment has been made. We believe that this approach is fundamentally flawed for two reasons. First, such an approach is difficult to reconcile with current procurement culture, statutory regulation, and European law. Second, and perhaps more important we believe that this approach is not only unachievable in practice but also wrong in principle. Michael Sandel has recently more eloquently expressed this view in the 2009 BBC Reith lectures. 3 SROI is fully discussed as a social methodology from page 40 onwards
[email protected] ‐ 18 ‐ tel:07811160822
“Cost benefit analysis is one instance of what I am calling market mimicking governance. It is objectionable on two grounds. First it puts a price tag on goods, including human life whose value cannot be captured in monetary terms. Second, by claiming to be a science of public choice it elevates technocratic decision making at the expense of democratic deliberation.” http://www.bbc.co.uk/iplayer/episode/b00lb6bt/The_Reith_Lectures_The_Reith_Lectures_2009_A_New_Politics_of_the_Common_Good/ It is not within the scope of this work to argue the case fully either for or against this approach. However for the purposes of the practical use we have not included such proxies. The reason for this is that it is difficult to see procurements being routinely scored or measured on such values so our elimination of this approach is entirely pragmatic. Where one could see this change is if government were to publish and accept a standard set of value tables using this type of approach. Work is underway with the New Economics Foundation and the Office of the Third sector looking at this type of approach; our view is that it is unlikely to come to fruition in the foreseeable future. However the use of direct proxies in both social and environmental areas and expressed as KPIs is achievable today. A second area of considerable debate and some misunderstanding lies in the approach of measurement by whole life costing.
1.3.2 WHOLE LIFE COSTING/ LIFE CYCLE COSTING/ TOTAL COST OF OWNERSHIP
‘Life cycle costing also called Whole Life Costing is a technique to establish the total cost of ownership.’ Office of Government Commerce.
As suggested by the quote above the terms whole life costing (WLC), Life Cycle Costing and Total Cost of Ownership are regarded by many organisations as interchangeable and for the purposes of this document we will treat them as such (though it should be noted that this is not a universally accepted convention). In the public sector WLC is the more commonly used term and the one we have elected to use for the purposes of this report. In the private sector the term Total Cost of Ownership is in common usage, as far as we can determine (and as the OGC quote suggests) this is simply another way of describing the same form of approach. ‘The benefits of whole life costing have been recognised and endorsed by the National Audit Office (NAO) and the National Sustainable Procurement Task Force (NSPTF). The Treasury has also made the application of whole life costing an explicit requirement in the procurement Green Book.’ Costing the Future, 2008, Westminster Sustainable Business Forum
[email protected] ‐ 19 ‐ tel:07811160822
WLC in its various guises is a methodology that is conceptually familiar to public (and private) sector buyers and as indicated in the preceding quote is widely endorsed as a means by which organisations can assure ‘best value’. It is informed by a recognition that the upfront cost of a product represents only one element of the total financial cost of ownership and that in many cases the costs associated with owning and operating a product (in terms of running costs/maintenance/use of consumables/disposal etc) may be several times that of the initial purchase price when calculated over its operational lifespan. This being the case the ‘cheapest’ option may not always represent best value for money. For example when purchasing a car, a given model may have a significantly lower asking price than an alternative in the same category. Assuming that a buyer has sufficient money to exercise choice then in addition to purchase price they would be wise to take into account the costs associated with running the vehicle. For example, these would include miles per gallon, reliability, the costs of spare parts and maintenance, insurance and ultimately the likely operational lifespan of the vehicle. Effectively this is a simple WLC approach, with the car buyer playing the role of the procurer seeking to identify and estimate the full range of significant costs associated with the ownership of a product, with a view to enabling a full cost comparison to be made between different product options. The range of costs that should be considered will vary depending upon the complexity of the product (or service) being bought. According to the Chartered Institute of Purchasing and Supply (CIPS) the range of costs considered in a WLC exercise should as a minimum cover the following. ‘acquisition’ and all its components (delivery costs, installation costs, commissioning costs, etc; Operating costs and all its components such as energy, spares, costs of maintenance; End of life costs such as de‐commissioning and removal costs; Details of precisely when costs are incurred. Whole Life Costing, Chartered Institute of Purchasing and Supply, 2008. According to the CIPS there is no single approach to WLC, there are though a range of freely available sector specific tools and it would seem prudent to use these where available particularly for the more complex forms of procurement. WLC is not a sustainability accounting tool per se. It evolved to enable organisations to better understand the full financial implications of procurement decisions. As such its use is arguably simply good procurement practice. In recent years it has also been identified as a methodology which can also help organisations to improve the environmental sustainability of their procurement activity. Specifically it has been identified as a means by which organisations can identify the energy use and associated costs (and therefore the carbon emissions) and use of
[email protected] ‐ 20 ‐ tel:07811160822
consumables associated with the use of a product over its operational lifespan, and therefore as a means of helping procurers to determine the relative merits of different products in terms of environmental sustainability.
AN ASSESSMENT OF THE RELATIVE STRENGTHS AND WEAKNESSES OF WHOLE LIFE COSTING Whilst there is widespread familiarity with the concept of WLC there is strong evidence to suggest that it is neither widely applied nor necessarily well understood in practice.
‘ Implemented by less than 10% of companies, Total Cost of Ownership (TCO) models are clearly lagging despite the value they provide’ European Sustainable Procurement Survey‐ 2007, HEC. ‘ Evidence submitted to the Task Force suggested that whole life costing was not being implemented in practice.’ Procuring the Future, 2006, Defra. ‘the inquiry’s findings suggest that the application of whole‐life costing is still, at best, sporadic. Furthermore it appears that when whole life costing is used, its application is far from rigorous.’ Costing the Future, 2008, Westminster Sustainable Business Forum
In the public sector WLC is widely used in PFI initiatives, and there is significant sector specific advice available in relation to construction. On the whole though there would appear to be a lack of guidance for procurers on the subject and we would suggest that this is hindering its more widespread adoption.
‘The Treasury Procurement Green Book cites the need for whole‐life costing to be applied in public sector procurement projects, but fails to provide a detailed guidance on how this process could occur and what factors should be considered.’ Costing the Future, 2008, Westminster Sustainable Business Forum
There would also appear to be a lack of the data necessary to inform whole‐life costing calculations and gathering such data can be time consuming and expensive (though once collected it can be re‐used in future calculations and by other organisations). Perhaps though the most significant barrier preventing the wider use of WLC in the public sector is the tendency to equate lowest cost with the most efficient outcome. Interviews with procurement staff undertaken by the National Sustainable Procurement Taskforce found that;
[email protected] ‐ 21 ‐ tel:07811160822
‘Affordability was often cited as a barrier and options with even very short paybacks were being rejected by public sector buyers because they did not pay back in the budget year.’
This is compounded by the fact that for many forms of procurement the buyer has no responsibility for running costs. Therefore where buyers are under pressure to reduce their expenditure there is an incentive for them to choose the lowest cost option. We would suggest that this is the most fundamental barrier to the wider use of WLC. WLC was not developed as an environmental accounting tool. However because there is a cost associated with the use of what may be termed environmental variables, such as energy, water and consumables, these are taken into account during the calculation of a WLC. Therefore a WLC can be used to help organisations to choose between different options on the basis of their environmental impact over their operational lifespan. With the current focus on climate change it is perhaps no surprise that a number of tools are now being developed to help organisations to calculate the CO2 emissions associated with the usage of different products. For example we understand that, Forum for the Future, International Council for Local Environmental Initiatives (ICLEI), Defra and the NHS are all developing WLC tools which will encompass carbon measurement. There is good reason to consider the use of WLC in procurement. Arguably it is simply good practice (though not applicable in all circumstances), but it also provides a systematic and objective mechanism for making comparisons between different options in relation to some key environmental variables, such as energy and water use. However, from an environmental perspective the approach has two key limitations. It does not take into account environmental impacts associated with the production of the product e.g. carbon emissions, only those associated with its use. Nor does it account for the type of materials used in the production of a good. For example, there is a recognised problem with illegal and unsustainably sourced timber within the construction industry, however this will not be taken account of by the use of WLC. WLC is a potentially powerful aid to the procurement professional, allowing better informed decisions to be made on the relative costs of different purchasing options. It can also be of great value to organisations wishing to take into account environmental considerations. Users must however be aware of its limitations, it is vital that good quality data inform the model and that the range of cost variables considered is sufficiently wide to enable informed comparisons to be made. From an environmental sustainability perspective the inherent weaknesses of the tool can be addressed by ensuring that final procurement decisions take into
[email protected] ‐ 22 ‐ tel:07811160822
account other forms of assessment, for example product carbon footprints and or some of the KPIs referred to elsewhere in this document. It should be noted however that the buyer may still end up having to make a choice between different environmental priorities. Tools such as WLC can be used to help to inform the decision making process but they will not always deliver an unambiguous decision.
1.3.3 KEY PERFORMANCE INDICATOR SETS
The use of KPIs to measure and monitor procurement activity is a well established practice in both the public and private sector. Typically a ‘balanced scorecard’ approach is used. This describes key performance areas and identifies a suite of KPIs which relate to each performance area. Conventionally this system is used to monitor and measure issues such as financial performance, internal business process and supplier performance. It can though readily accommodate other forms of indicator including sustainability indicators. Alternatively environmental procurement indicators can be integrated with an organisation’s environmental management system (EMS). Advice on this is given in the European Commissions Green Public Procurement Toolkit. As best we can determine the use of environmental KPIs in public sector procurement is not yet widespread. For example the Scottish government’s 2008 publication ‘Best Practice Indicators for Public Procurement in Scotland’ includes only two sustainability indicators, neither of which address environmental issues. Nor at first glance do procurement specific environmental KPIs appear to be readily accessible. For example none are supplied in the main forms of public sector support material on sustainable procurement. The OGC’s advice note on ‘How to address environmental issues in public procurement’, ICLEI’s Procura + Manual and Forum for the Futures sustainable procurement toolkit, Procuring the Future. There is some evidence from the private sector which bears out the view that there is a shortage of environmental KPIs. A recent survey of 85 major European companies undertaken by the Paris based HEC Business School recorded that; ‘The lack of indicators associated with sustainable procurement was reported by companies as being the number one challenge, hindering their efforts in deploying initiatives within their organisations.’ However, the authors of this report suggest that in their view it is not so much that indicators are not available, rather that issues such as the lack of awareness of available resources amongst procurement professionals is lacking. We would be inclined to support this view.
[email protected] ‐ 23 ‐ tel:07811160822
AN ASSESSMENT OF THE RELATIVE STRENGTHS AND WEAKNESSES OF KEY PERFORMANCE INDICATORS
Key performance indicators (KPIs) are recognised as being a useful management tool and are widely used by both public and private sector organisations to monitor and measure a range of performance variables. As a consequence organisations are familiar with them and have established systems for collecting and collating data. The use of environmental KPIs is relatively new but has become more widespread as organisations have sought to respond to public and political interest and increasingly in the case of public sector organisations as a result of policy. For example the national indicator set for local authorities now contains several climate change indicators. Information concerning environmental KPIs, including datasets is readily available and accessible via public websites, for example www.defra.gov.uk/environment/business/envrp/pdf/envkpi‐guidelines.pdf. Others may be found in the CSR reports of larger companies such as Boots Alliance, Du Pont, Kingfisher, Carillion and on the sites of initiatives such as Project Sigma, see www.projectsigma.com. A wide range of environmental performance variables are covered, those most commonly used cover issues such as waste, emissions and energy use, but we have also found a number relating to supply chain/procurement issues.
PROCESS AND/OR OUTCOME KPIS
In general KPIs can be grouped into two categories. For the purposes of this report we will use the terms process and outcome KPIs. Process indicators measure actions taken which are expected to result in improved outcomes, for example staff training. The measures described in the Sustainable Procurement Taskforce’s flexible framework4 are effectively process KPIs though they are not described as such. Process KPIs have the general advantages of being relatively easy to measure and achieve. They are particularly useful where an organisation wishes to measure compliance with a policy. For example an organisation may require all drivers to have been trained in efficient driving techniques as a means of reducing fuel use and the associated costs and emissions. This would be an easy measure to track. Simply measuring process however does not guarantee outcomes, In the case of driver training, drivers may simply not apply the techniques they have been taught. By way of contrast outcome KPIs have the advantage of measuring results, in relation to our driver training scenario an outcome indicator such as average fleet fuel consumption would help to measure whether a driver training programme had
4 The flexible framework is a table that allows organisations to assess where they have reached across 6 different axis of measurement.
[email protected] ‐ 24 ‐ tel:07811160822
been successful. As this example demonstrates it can often be helpful to use a mix of process and outcome measures. Process KPIs can help to demonstrate an organisations intent to external organisations whilst also helping the organisation track the implementation of policies. Outcome measures are however the means by which progress in relation to results can be tracked and the only means of demonstrating success. Note: the distinction between process and outcome KPIs is not always clear cut. For example we would describe as an outcome KPI as one which measures the use of eco‐labelled products. The assumption here is that a tangible outcome will result from this because such labels are independently audited, i.e. there is some guarantee of a positive outcome and a link between the use of eco‐labelled products and that outcome. However the outcome (or outcomes) themselves are not measured.
NEED FOR BALANCED SUITE OF KPIS
The activities of all organisations will have multiple forms of significant sustainability impacts and therefore organisations will need to use several KPIs to enable these to be monitored. The use of a balanced suite of KPIs is also important given that there can be tensions between different environmental or indeed other sustainability objectives. For example, globally fish stocks are under intense pressure, including those in British waters. A procurement response might be to prioritise the purchase of fish from fisheries certified through the Marine Stewardship Councils sustainable fisheries scheme or to boycott certain species of fish altogether. In practice this would be likely to lead to a greater use of imported fish species such as Alaskan Pollack. We are not aware of any studies of the carbon footprints associated with the use of different fish species but it seems reasonable to assume that the use of imported fish species will entail greater use of fossil fuels (and therefore CO2 emissions) to preserve and transport the product than would be the case where a fish from UK waters was used. In this instance if your sole object is to reduce the greenhouse gas emissions associated with your supply chain then this may lead you to purchase a UK product which may on balance arguably be a less environmentally sustainable option. In short organisations should be wary of adhering slavishly to the pursuit of individual KPIs without giving consideration to a wider range of impacts. To enable this it is good practice to use a suite of KPIs which reflect the organisations significant impacts and priorities. This should include social and economic considerations in addition to environmental as again there may be tensions between different priorities which may not be picked up on if the key variables are not being measured.
GENERIC/CORPORATE V SPECIFIC KPIS
[email protected] ‐ 25 ‐ tel:07811160822
As a final area for consideration we need to consider one further key classification of measure type. This is the difference between generic and specific measures. It is arguable that this is a key distinction that runs right through the procurement process and is therefore a consequence of procurement as much as a separate distinction. This is interesting from an academic perspective however what is important here is that this is a real and practical distinction. Whilst there is a need for a sufficiently wide range of KPIs to enable a reasonable assessment of an organisations performance to be made, this must be balanced against the availability of resources for data capture and management. For example the environmental impacts of procurement are only one subset of an organisation’s overall range of impacts. Environmental impacts themselves form a subset of sustainability which in turn is only one of the performance areas which an organisation will wish to measure. There is a need to limit the number of KPIs used. The difficulty lies in choosing indicators capable of covering the range of an organisations activities. This is particularly true of large complex organisations such as local authorities which run multiple services, all of which have some form of environmental impact. In practice larger organisations may seek to use environmental KPIs at both a corporate and operational level. This allows for greater attention to be paid to specific priority issues within given service areas. In general we would expect operational indicators to feed into corporate datasets though at an operational level data for a corporate KPI may be measured via a subordinate subset of KPIs. For example a local authority catering operation may elect to set separate KPIs for its use of Fairtrade produce. Fairtrade is a common priority for local authorities though significant more for political reasons than impact (being a negligible spend and therefore impact area). There may therefore be a need to collect data, but at a corporate level an organisation is unlikely to wish to collect separate data for each form of product certification it may use. In this case it may be more practical at a corporate level to simply collect data on the use of certified products (or equivalent) thereby allowing it to cover all spend areas where sustainability specifications are available e.g. timber, energy efficiency labels etc. For the purposes of this study we are concentrating on corporate indicators. However it is important to appreciate the need for corporate KPIs to be relevant to operational activity. Our previous work with social clauses and relating these to local authority procurement classification systems (www.demo.sociaclause.net) demonstrates this. All procurement systems will breakdown procurements into classes, for example in Proclass there are 16 different top level classifications such as Transport. However the most effective and flexible mechanism for applying a corporate policy is to generate a generic clause that can be inserted in all tenders so for example. “The regional fair trade project for Yorkshire and the Humber is committed to working together with local communities and other partners. The National
[email protected] ‐ 26 ‐ tel:07811160822
Procurement Strategy for Local Government encourages councils to achieve community benefits through procurement and to actively engage with a diverse range of suppliers, including small and medium‐sized enterprises (SMEs). To this end, the regional fair trade project for Yorkshire and the Humber would like you to provide details of what community benefits your organisation can offer when providing this contract.”) www.demo.sociaclause.net If in addition to this the clause is included as a core requirement of the procurement contract this greatly strengthens its use within the process. It is for this reason that generic clauses and consequent measures are both powerful and preeminent. However as previously discussed they do require a proper policy and prioritisation mechanism to be in place to be used effectively. Generic clauses are not however the complete answer. They will almost always inevitably (because of their generality) be more strategic and corporate in approach. There is an additional role for KPIs that are specific to particular policies and procurements. These more targeted KPIs are likely to occur not in every case but where more detail is required. An example is shown for the candidate measures in the table below. However it is perfectly possible to have a generic measure such as ‘% of spend within the region’ that is applied in all procurements as a matter of corporate policy. However only in more directly relevant procurements would the sub measures such as ‘% spend with producers and suppliers’ be used. Where this leads is to the adoption of a ‘basket’ approach where there are a small number of generic measures that should be applied either as selection or monitoring measures in all procurements and grants. These will meet all of the tests outlined above and have direct strategic and corporate applications. These are then supported by a basket of specific measures. These would be selected as required for various types of procurement and grant making.
1.3.4 ASSESSMENT OF THE SUITABILITY OF WLC AND KPIS FOR USE BY emda AND OTHER PUBLIC SECTOR ORGANISATIONS
The use of WLC is already widely recommended to all public sector organisations. It is perceived as being an important tool in ensuring best value and medium ‐ long term efficiency gains. Additionally many organisations have championed it as a means of enabling organisations to take better account of the environmental sustainability of their purchasing decisions. We agree with the consensus and would recommend to emda and its partners that if it does not already do so WLC be recognised as a valuable tool which can be used to assist public (and private) sector organisations to improve both their sustainability and efficiency. However, further work is required to identify and assure the types of tool which emda should adopt. Before undertaking this exercise we would recommend that
[email protected] ‐ 27 ‐ tel:07811160822
consideration be given to identifying those areas of spend where to which WLC might most effectively be applied. emda should appreciate that even if staff are familiar with WLC the adoption of new tools is likely to require an investment in staff training and may entail a need to develop data sets to enable the tools to be implemented effectively. Once collected however such data can be re‐used and also be applied by other organisations. Where national datasets do not exist the East Midlands may want to consider a collaborative approach to the development of datasets. As a result of this review it is our conclusion that the key approach that offers the most practical way forward for procurement practice in sustainability is the development of Key Performance Indicator sets. As has been discussed the use of KPIs is well established in public sector organisations, their purpose is understood and mechanisms exist for managing data collection and collation. We would recommend that where this does not already happen public sector procurers should incorporate environmental KPIs into their current performance management systems. This approach would help organisations to better align their activities with corporate environmental priorities, for example delivery against the national indicator set, whilst also allowing them to demonstrate to the audit commission a responsible ‘use of resources’. We would suggest that at a corporate level only a limited range of KPIs be adopted and that these should be informed by the need for them to be: Relevant‐ i.e. be related to corporate objectives whilst also being relevant to operational activity; Meaningful‐ i.e. they should look to measure significant operational impacts or key policy objectives; Measurable – i.e. it should be possible to calculate a realistic figure within the prevailing resource constraints. With this basis agreed it now becomes possible to describe and discuss a range of methodologies that have been used to try and measure sustainability across the environmental, economic, and social fields.
1.4 METHODOLOGIES USED FOR MEASURING THE ENVIRONMENTAL IMPACTS OF PROCUREMENT.
1.4.1 CARBON MEASUREMENT
[email protected] ‐ 28 ‐ tel:07811160822
INTRODUCTION Current government policy does little to encourage the public sector to consider the carbon emissions associated with procurement. For example, none of the National Indicators relating to climate change directly encompass procurement activity. As a result there has as yet been limited attention paid to reducing procurement related emissions by the majority of public sector bodies. This seems likely to change as there is a growing awareness that the emissions associated with the production and provision of the goods and services that public sector bodies procure will (in total) often exceed those arising from an organisations operational activity. In other words bodies that are serious about reducing their contribution to climate change must consider the type of goods and services they procure and the manner in which these are delivered. We are aware that the Audit Commission is now taking an interest in this issue and would anticipate that they will look for evidence that procurers are taking action on CO2 when undertaking their ‘use of resources’ assessment. We would suggest that carbon measurements should be considered as part of a wider environmental KPI set (carbon emissions are only one of a range of key environmental issues). For the purposes of this study however we have elected to consider them in isolation. This is in recognition both of the political significance of climate change and the consequent focus of attention on mechanisms for monitoring and measuring emissions, but also because of the complexity of the subject. This complexity is due both to the technical nature of carbon measurement but also due to the lack of clarity in this field, for example concerning what can and what should be measured, how reliable measurements are and what constitutes a significant measurement. It is important to appreciate that whilst it is conventional to talk about carbon management there are six major greenhouse gases (GHGs), i.e. gases contributing to climate change. Carbon Dioxide (CO2) is the most common of these forming about 86% of UK GHG emissions, it is generated principally by the combustion of fossil fuels. The other GHGs are methane, nitrous oxide, Hydrofluorocarbons (HFCs), Perflurocarbons (PFCs) and Sulphur Hexafluoride. Although emitted in far smaller volumes, these other GHGs have a higher Global Warming Potential (GWP) than CO2. For example, each unit of methane is 21 times more powerful a greenhouse gas than CO2. To better enable carbon accounting GHGs are measured in terms of carbon equivalency, CO2e. Following this convention the value of each unit of methane is therefore 21 when measured in units of carbon. We have identified two main approaches to carbon measurement which have application in relation to public sector procurement. These are described below.
PRODUCT CARBON FOOTPRINTING
[email protected] ‐ 29 ‐ tel:07811160822
The production of any good (and service) can be broken down into a series of stages, each stage is likely to result in the production of carbon dioxide (principally arising from the combustion of fossil fuels) and possibly other greenhouse gases. Using a methodology called Life Cycle Assessment a value, expressed in CO2e, can be estimated for each stage of a products life cycle. Summing the CO2e figure for each stage generates the product’s Carbon Footprint. It should be noted that this figure does NOT normally take into account any emissions which may be associated with the USE of a product. As yet only a very limited range of products have had their carbon footprint calculated but it seems certain that this will increase in response to policy imperatives, market demand and as suppliers look to differentiate their products from competitors. Evidence of this can be seen in several sectors, for example construction and food As with all forms of carbon measurement there has historically been a wide variation in approach, generally this relates to the scope or boundaries of the measurement exercise. There are two issues to consider,:
• Have all GHGs been measured or just CO2 and if the latter is it just emissions from the use of fossil fuels which have been calculated or all emissions.
• How comprehensive has the life cycle assessment been? I.e. have all the stages of emission generating activity been accounted for?
If products are compared on the basis of their relative carbon footprints it is essential to ensure that comparable approaches to measurement have been applied. A standard for calculating product carbon footprints has now been developed, ‘PAS 2050‐ specification for the assessment of the life cycle greenhouse gas emissions of goods and services’, this offers a welcome opportunity to bring increased consistency to the marketplace. Note: Life cycle assessment can be used to calculate a range of environmental impacts (though not issues such as landscape or biodiversity). A carbon footprint is a partial life cycle assessment and takes no account of other environmental variables, it should be noted that a product can have a lower carbon footprint than an alternative but may be less sustainable when assessed against other environmental variables. In short the product with the smallest carbon footprint will not always represent the most sustainable option.
ORGANISATIONAL FOOTPRINTING The measurement of organisational carbon footprints has become increasingly common in both the public and private sector, as with product footprinting however
[email protected] ‐ 30 ‐ tel:07811160822
there has been a lack of consistency in approach and once again it is critical to understand what has been measured (and how) when dealing with this issue. It is generally recommended that organisations consider all of the 6 major GHGs, with these being sub‐divided into three categories of emission‐ direct, emissions from the use of electricity and indirect emissions. This approach is based on the Greenhouse Gas (GHG) Protocol, a widely recognised standard developed by the World business Council for Sustainable Development and the World Resources Institute. Under the GHG protocol these categories are described as scope 1,2 and 3. Scope 1: Direct Emissions These arise from activities owned or controlled by the organisation, for example from the combustion of fossil fuels in heating systems or vehicles. Scope 2: Emissions from the use of electricity These are dealt with separately from scope 1 because the emissions associated with the generation of electricity are not under the control of the organisation, it is however deemed to be indirectly responsible for such emissions. Scope 3: Indirect emissions from products and services Scope 3 emissions are those which are generated as a consequence of an organisations activity but which are not directly under its control. Emissions associated with the generation of the products that an organisation procures (sometimes described as embodied or embedded emissions) are outside of the direct control of the organisation, but by creating a demand for them and subsequently by consuming them the organisation has a degree of responsibility for them. The majority of organisations undertaking a carbon footprinting exercise opt to measure Scopes 1 and 2. This is a relatively straightforward and low cost option, indeed organisations may choose to undertake this themselves using web based tools such as that provided by the Carbon Trust (http://www.carbontrust.co.uk/solutions/CarbonFootprinting/FootprintCalculators.htm). Organisations wishing to measure the impact of their procurement activity are however entering into a Scope 3 exercise, this is a significantly more complex exercise as it requires an organisation to account for the emissions associated with the production and delivery of all of the goods and services it uses, i.e. to trace emissions back down the supply chain. For public sector procurers, who buy a huge range of goods and services the calculation of a carbon footprint for procurement activity poses a significant challenge owing to the paucity of product specific data.

[email protected] ‐ 31 ‐ tel:07811160822
Nevertheless several public sector organisations have undertaken or commissioned carbon footprinting work which has generated an estimate of the GHG emissions associated with their procurement. The two best known examples include a study undertaken on behalf of the Sustainable Development Commission of the English schools estate, which estimated that 45% of the GHG emissions associated with schools derive from procurement. More recently (Sept 2008) an NHS commissioned study concluded that 60% of its carbon footprint (CO2 only) arises from the procurement of goods and services. In both these examples a modified version of the input‐output tool, Resources and Analysis Programme (REAP) was used.
‘ An input‐output model assumes each industry consumes outputs of various other industries in fixed ratios in order to produce its own unique and distinctive output. For example, manufacturing a car will lead to activity in the steel, rubber, electronics etc sectors in various proportions… Thus the total GHG emissions from say, purchasing a car, can be estimated by summing the constituent emissions from the steel, rubber, electronics etc sectors.’ Climate Change Tools for Local Authorities, SNIFFER.
The NHS Carbon Footprinting Report claims to have accounted for all emissions associated with NHS procurement across the whole supply chain, including those from abroad. This was accomplished via the modified REAP tool, which uses industry average data (derived from the Office of National Statistics, ONS) to assign generic emissions figures to specific forms of goods or service. Through this approach REAP is able to produce a figure for all forms of economic interaction. It should be noted however that the methodology is unable to distinguish between goods and services at the product level. So for example it cannot distinguish between one type of laptop and another. This limitation will be discussed in the next section. A study by Scotland and Northern Ireland Forum for Environmental Research (SNIFFER) looking at climate change tools used by local authorities in Scotland identified 2 other forms of input‐output model Bottomline3 and UKCEED. Bottomline3 is a tool which was originally developed by the University of Sydney, a UK version (again using ONS data) has been developed by Centre for Sustainability Accounting (CenSA). Reportedly this tool is more appropriate for measuring procurement related emissions than REAP and it has now been used by several UK local authorities and other public sector organisations. We have been unable to find out any further information regarding the UKCEED tool referred to in the SNIFFER report. Recently we have also become aware of another input‐output methodology developed by the environmental consultancy Trucost. This has now also been used by several public sector organisations. The SNIFFER report drew a distinction between input‐output tools and what it called activity‐emission methodology’s, such as the Carbon Trusts calculator, which are
[email protected] ‐ 32 ‐ tel:07811160822
used to measure scope 1 and 2 emissions. We will use the terms input‐output and activity emission in the following section in order to distinguish between the two forms of organisational footprinting.
1.4.2 AN ASSESSMENT OF THE RELATIVE STRENGTHS AND WEAKNESSES OF CARBON MEASUREMENT METHODOLOGIES
CARBON PRODUCT FOOTPRINTS
Product footprinting is a methodology which has been designed to be applied by suppliers rather than procurers. However where product footprints are available, reliable and allow for comparisons to be made between different product options they can be a useful tool in the hands of procurement professionals. Procurers can use such information in two ways, firstly to help guide and inform the type of products an organisation seeks to purchase. Secondly to assist in making a choice between different product options at the award of contract stage. However as yet only a limited range of products have had their carbon footprint calculated and the approach to calculation has been inconsistent. Some publicly accessible databases exist, for example the University of Bath’s ‘Inventory of Carbon and Energy’ exist but even when using such sources comparisons between different products should be undertaken with caution unless the user has access to expertise in this area. It is particularly important to be sure that all of the main CO2 emissions associated with the production of a product have been accounted for (i.e. that you are not just being presented with a partial picture) and ideally that all forms of GHG have been taken into account. The development of a standard for carbon product footprinting, the PAS 2050 will, if widely adopted, greatly assist buyers by introducing consistency to the process of product footprinting, thereby better enabling ‘like for like’ comparisons to be made between different product options.
LIMITATIONS OF CARBON PRODUCT FOOTPRINTING
‘The life cycle GHG emissions of products determined by using PAS 2050, and changes in these emissions over time, do not provide an indicator of the full environmental impact of providing and using these goods and services’ Carbon Trust. Aside from the current lack of reliable data the main limitation of carbon product footprinting is one which is shared by all forms of carbon measurement, namely that it does not take into account other environmental impacts, as such procurers should ideally use them in conjunction with other forms of environmental information in order to ensure a balanced approach to decision making.
[email protected] ‐ 33 ‐ tel:07811160822
ORGANISATIONAL CARBON FOOTPRINTING
Increasingly suppliers are offering to provide information on their organisational carbon footprint, in the majority of cases however this will have been calculated using an activity‐emissions methodology and will only encompass scope 1 and 2 emissions. Such data can be useful in sustainable supply chain management initiatives however it is important that its value is not overestimated. On the positive side the provision of an annual carbon footprint by a supplier (showing the proportion associated with transactions with the procuring body) provides a relatively accurate and simple form of measurement. In addition by providing a breakdown of emission sources it can also help to identify ‘hotspots’, helping procurers and their suppliers to target priority areas for reduction and to inform potential reduction options. For example, distribution can be a major component of a supplier’s organisational footprint, where this is the case procurers may be able to identify opportunities to reduce the frequency of deliveries. Subsequent ‘footprinting’ activity will then be able to measure the value of such interventions. However it is essential to appreciate that in many cases the scope 1 and 2 emissions of your supplier may only equate to a small proportion of the purchased products total carbon footprint. This is particularly true where a supplier is providing goods produced by another business. For example a wholesale food business supplying food to schools may find that the largest component of its organisational footprint (scope 1 and 2) is associated with distribution. Whilst there is much concern about the emissions associated with the movement of food (and other goods) in the majority of cases other stages in the product life cycle (e.g. production, processing, extraction, manufacturing) generate much greater volumes of GHGs. For example, one of the most high profile product carbon footprinting exercises was a pilot undertaken by the Carbon Trust and Walkers. This estimated that a bag of Walkers crisps has a carbon footprint of 75gram’s, the majority of which is produced during the production (32g) and processing stages (21g), only 5g (approx) arises from distribution. The key issue from a sustainable procurement perspective is that often an organisations supplier may only be directly responsible for a small proportion of the carbon emissions generated by the production of the purchased products. Therefore supplier organisational footprints covering scope 1 and 2 emissions do not provide a meaningful mechanism for measuring the carbon footprint of the purchasing organisation’s procurement activity.

[email protected] ‐ 34 ‐ tel:07811160822
If an organisation wishes to promote ‘low carbon’ procurement then in the absence of comprehensive product footprint data the use of some form of input‐output tool currently appears to offer the only realistic means of providing such a measurement. In addition to generating a total figure for procurement related emissions input‐output tools can also supply a breakdown by product category, thereby allowing for the ready identification of those areas of spend which generate the most significant volume of emissions. They are not however without their weaknesses, input‐output tools rely on a relatively limited range of aggregated datasets and use industry averages in their calculations. Consequently their ability to distinguish between products within the same class is heavily restricted or non‐existent. As a result, whilst the use of an input‐output tool may generate a useful baseline procurement footprint, and enable the targeting of high carbon spend areas its value as an ongoing monitoring tool will be restricted by its limited ability to register carbon reduction activity. For example, whilst interventions such as reducing the overall consumption of high carbon products will register, others such as a move from a higher to a lower impact product may not be recorded. Similarly other forms of activity designed to reduce emissions, for example a reduction in the frequency of deliveries or a move to lower emission delivery vehicles, would not be captured. Specific activity of this type can however be picked up through the use of complementary forms of measurement (e.g. monitoring of activity‐emissions for high impact suppliers) and or key performance indicators.
ASSESSMENT OF THE SUITABILITY OF CARBON FOOTPRINTING FOR USE BY EMDA AND OTHER PUBLIC SECTOR ORGANISATIONS
Carbon product footprinting is not designed to be used directly by public sector procurers, rather by their suppliers. Procurers should though be aware of the existence of this approach (and its limitations) as we would anticipate a growth in suppliers making claims on behalf of their products, particularly in areas like construction. A range of specific and generic, publicly available, product information exists. This can be used by procurers to guide and inform their organisations requirements for goods and services as part of a low carbon procurement strategy. Such data though needs to be approached with care and it is advisable to seek expert input. Where there is an absence of reliable data relating to a product or category of strategic importance procurers could commission a third party to undertake carbon footprinting on their behalf. This is a relatively expensive option but we can foresee

[email protected] ‐ 35 ‐ tel:07811160822
instances when this may be justifiable, if it is decided to go down this route then we would recommend that measurements are undertaken in accordance with PAS2050. The use of an input‐ouput model offers a cost effective and reportedly relatively low effort (in terms of data collection/provision) means of enabling public sector organisations to measure the carbon footprint of their procurement function. The SNIFFER reports on carbon measurement tools identified three input‐output tools, REAP, Bottomline 3 and UKCEED and indicated that all were underpinned by the same methodology. We have been unable to find out any more information regarding the UKCEED Emissions toolkit. A hybrid form of the REAP tool has been used to measure the carbon footprint of procurement activity within the NHS and schools estate. Other options now in use include Bottomline3 and Trucosts in house service. Both of the latter appear to have been tailored for application to procurement. Bottomline 3 has been used to assess the carbon footprints of Stockton Borough Council, Bedfordshire County Council and Ashfield District Council. Ashfield are of course located in the East Midlands region and therefore may be able to offer some further insights into this tool. Trucost is newer to this market; the only example we are aware of is a project they have undertaken for the London Borough of Lewisham. The use of an input‐output model allows for a comprehensive assessment of procurement emissions and enables the user organisation to identify the carbon hotspots within the supply chain, thereby providing the information required to develop a targeted approach to carbon reduction. They have several weaknesses however owing to the relatively coarse grained nature of the data which is used in their calculations. This restricts their value as a monitoring tool and also their ability to highlight high/low carbon alternatives within the data classes which they draw upon. In an ideal scenario therefore they should be used in conjunction with other sources of information, such as existing generic/specific product information, and complementary forms of tools including activity emissions tools. For example EMDA might request their suppliers to measure their scope 1 and 2 emissions so that carbon reduction activity is registered. The development of a simple carbon footprint is not unduly onerous or complex although some suppliers may require support. A range of free on‐ line activity‐emission tools exist, we would suggest that the one developed by the Carbon Trust be applied and that suppliers be encouraged to achieve the Trusts ‘Carbon Standard’. As a final note, it is likely that the regions public sector bodies ‘share’ many of their suppliers, we would recommend that where shared supply chains exist a collaborative approach is taken to supply chain engagement on carbon issues, as a
[email protected] ‐ 36 ‐ tel:07811160822
starting point procurers should agree a common approach to any measurement activity they or their suppliers undertake.
1.5 METHODOLOGIES USED FOR MEASURING THE ECONOMIC IMPACTS OF PROCUREMENT.
This review of economic measurement is restricted to the methodologies that are used to measure economic impact. In contrast with the other areas of sustainability where in the environmental field we see a plethora of measures but little accepted methodology, and in the social field where there are many methodologies but little agreement on measures; the economic assessment of impact is simplicity itself. This section sets the foundations with brief explanatory pieces on the key concepts covered, it then examines the two most commonly used methodologies in the UK for assessing economic impact before drawing conclusions about how these can be used for meaningful measurement. It is worth by beginning with a very brief nod to the history of economics. It is not too great an oversimplification to say that almost all of our current thinking is based on the concept of ‘growth accounting’. There is an assumption that growth is good and that over time there will be more of it. Economists have developed models to measure that growth. The following excellent summary defines the basis of these methodologies. “Logically, output growth can be exhaustively divided into growth in inputs, plus a residual. The part of growth attributed to labour is its growth rate multiplied by its share in total output, and likewise for capital. The contribution of labour to growth will (or should) incorporate quality changes, such as better schooling, and productivity improvements specific to labour, such as more effective teamwork methods; and likewise of capital. The part left unaccounted for by growth and improvement in inputs is known as total factor productivity. It is usually identified with technical progress, although it will also include anything left out of the measurement of inputs, including quality changes not properly accounted for. Such omissions would lead to overestimates of the importance of technical change. On the other hand, productivity improvements due to innovation will increase investment in capital, so part of the growth attributed to capital will in fact be caused by technical change.” Coyle Diana. 2007 “The Soulful Science”. Princeton University Press. p45. This is important as although this review is interested in the ways in which this change is measured the quotation also provides the rationale for much of government and regional intervention and this sets the scene for the debate about the assumptions that are raised in the brief with regard to localisation/ local economies. The current economic crisis and the longer term realisation that we
[email protected] ‐ 37 ‐ tel:07811160822
cannot continue to exploit our planets resources in the same way, coupled with the understanding that we are going to have to change our economic base radically away from our current carbon dependant economy is now beginning to be felt. It now seems probable that in the medium term we will evolve different mechanisms for measuring success that are not simply dependant on growth. emda has in some ways begun to foreshadow this with the work commissioned for it by the New Economics Foundation that looks at Wellbeing and how to measure this as an alternative to the more usually accepted GVA measurement.
1.5.1 MULTIPLIERS
The concept of the multiplier dates back several centuries, but was popularised and formalised by British chief economist John Maynard Keynes in the 1930s. Multiplier analysis relies on regional and national statistics, but often in a more aggregated form, making it easier to pursue. In many ways, Input‐Output analysis arose as a reaction to multiplier analysis’s shortcomings. An economic multiplier is a number used to estimate economy‐wide impacts of industry‐specific economic changes. Multipliers are generated from numerical or statistical models of a national or regional economy. Using models, multipliers can be calculated for every business or industry sector in the economy. A multiplier is always greater than one because it is a ratio that is calculated by dividing a) the estimated total effect resulting from a given economic "shock" to the economy by b) a necessarily smaller partial effect, namely the direct project‐ or activity‐specific effect. Each multiplier can be thought of as an empirical, quantified measurement of the strength of the economic linkages between a given industry or economic sector and the rest of the regional economy. The greater the extent of the linkages, the greater the size of the multiplier. The greater the multiplier, the greater the economy‐wide dollar or employment impact of any given stimulus to one industry or sector of the economy. There are two methodologies that are considered for this section of the report. These are often portrayed as competitive with each other. In fact they are not and have already been used in a complementary form. The two are:
• Local Multiplier Three (LM3) • Input/output methodology (IO)
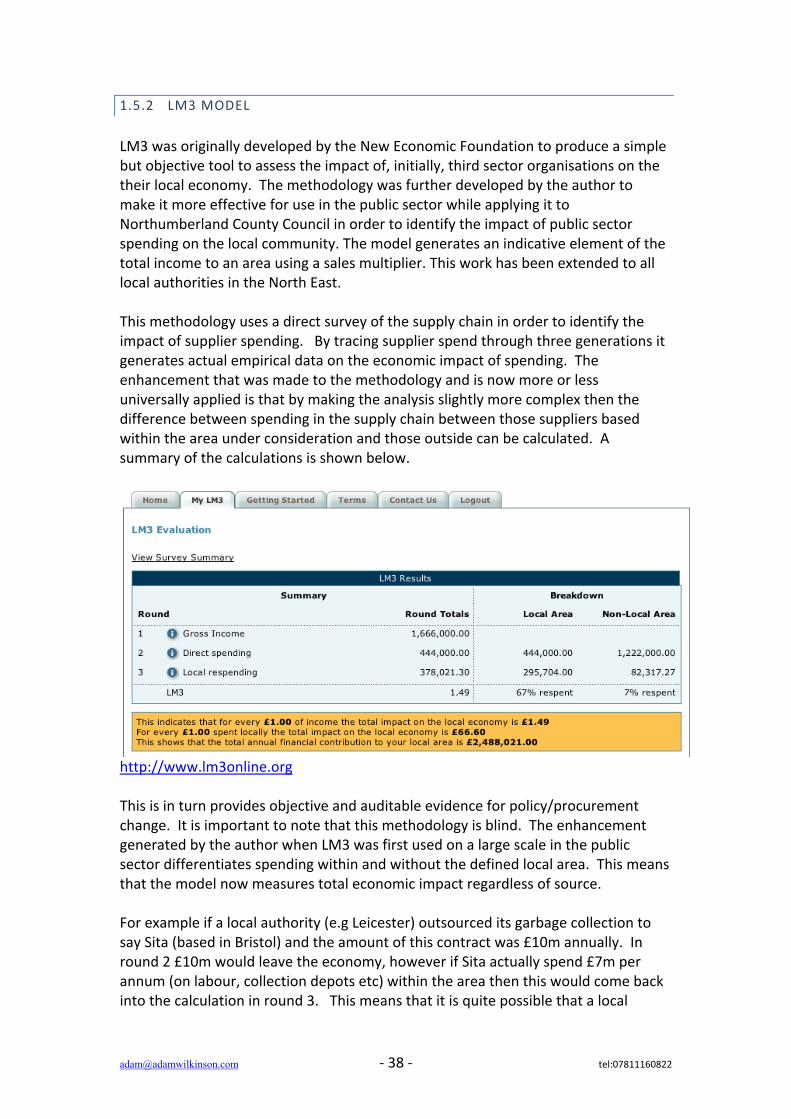
[email protected] ‐ 38 ‐ tel:07811160822
1.5.2 LM3 MODEL
LM3 was originally developed by the New Economic Foundation to produce a simple but objective tool to assess the impact of, initially, third sector organisations on the their local economy. The methodology was further developed by the author to make it more effective for use in the public sector while applying it to Northumberland County Council in order to identify the impact of public sector spending on the local community. The model generates an indicative element of the total income to an area using a sales multiplier. This work has been extended to all local authorities in the North East. This methodology uses a direct survey of the supply chain in order to identify the impact of supplier spending. By tracing supplier spend through three generations it generates actual empirical data on the economic impact of spending. The enhancement that was made to the methodology and is now more or less universally applied is that by making the analysis slightly more complex then the difference between spending in the supply chain between those suppliers based within the area under consideration and those outside can be calculated. A summary of the calculations is shown below.
http://www.lm3online.org This is in turn provides objective and auditable evidence for policy/procurement change. It is important to note that this methodology is blind. The enhancement generated by the author when LM3 was first used on a large scale in the public sector differentiates spending within and without the defined local area. This means that the model now measures total economic impact regardless of source. For example if a local authority (e.g Leicester) outsourced its garbage collection to say Sita (based in Bristol) and the amount of this contract was £10m annually. In round 2 £10m would leave the economy, however if Sita actually spend £7m per annum (on labour, collection depots etc) within the area then this would come back into the calculation in round 3. This means that it is quite possible that a local
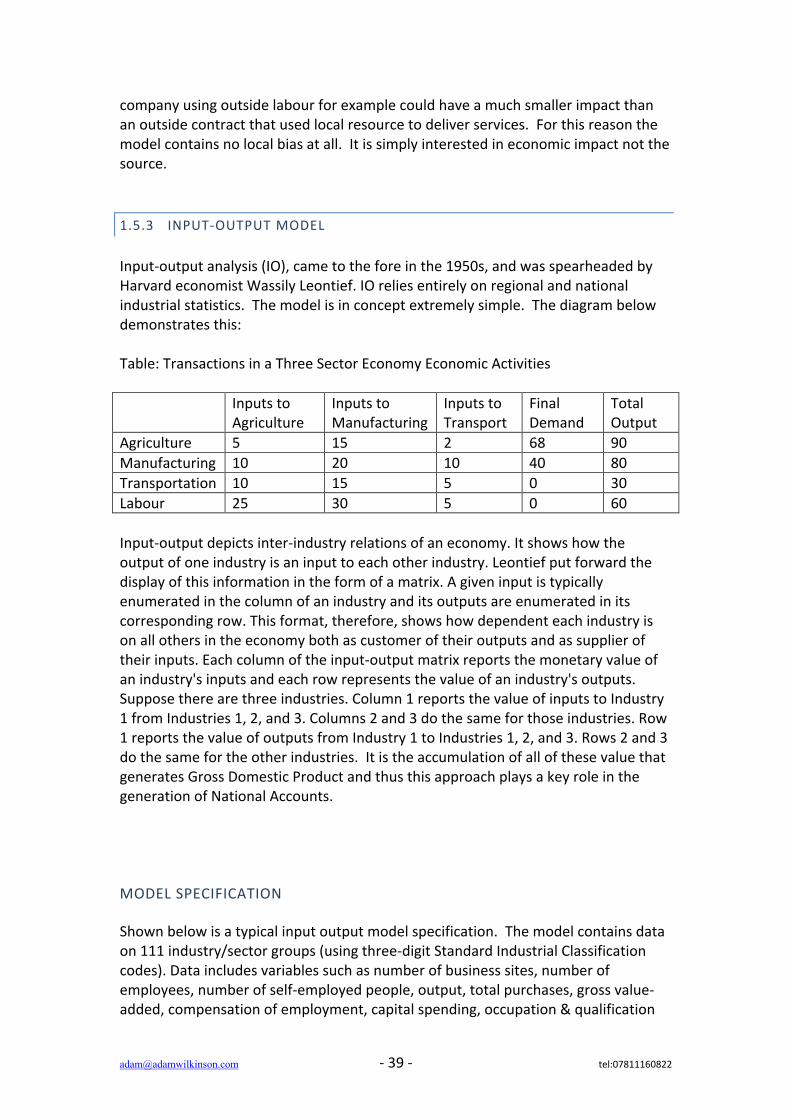
[email protected] ‐ 39 ‐ tel:07811160822
company using outside labour for example could have a much smaller impact than an outside contract that used local resource to deliver services. For this reason the model contains no local bias at all. It is simply interested in economic impact not the source.
1.5.3 INPUT‐OUTPUT MODEL
Input‐output analysis (IO), came to the fore in the 1950s, and was spearheaded by Harvard economist Wassily Leontief. IO relies entirely on regional and national industrial statistics. The model is in concept extremely simple. The diagram below demonstrates this: Table: Transactions in a Three Sector Economy Economic Activities Inputs to
Agriculture Inputs to Manufacturing
Inputs to Transport
Final Demand
Total Output
Agriculture 5 15 2 68 90 Manufacturing 10 20 10 40 80 Transportation 10 15 5 0 30 Labour 25 30 5 0 60 Input‐output depicts inter‐industry relations of an economy. It shows how the output of one industry is an input to each other industry. Leontief put forward the display of this information in the form of a matrix. A given input is typically enumerated in the column of an industry and its outputs are enumerated in its corresponding row. This format, therefore, shows how dependent each industry is on all others in the economy both as customer of their outputs and as supplier of their inputs. Each column of the input‐output matrix reports the monetary value of an industry's inputs and each row represents the value of an industry's outputs. Suppose there are three industries. Column 1 reports the value of inputs to Industry 1 from Industries 1, 2, and 3. Columns 2 and 3 do the same for those industries. Row 1 reports the value of outputs from Industry 1 to Industries 1, 2, and 3. Rows 2 and 3 do the same for the other industries. It is the accumulation of all of these value that generates Gross Domestic Product and thus this approach plays a key role in the generation of National Accounts. MODEL SPECIFICATION Shown below is a typical input output model specification. The model contains data on 111 industry/sector groups (using three‐digit Standard Industrial Classification codes). Data includes variables such as number of business sites, number of employees, number of self‐employed people, output, total purchases, gross value‐added, compensation of employment, capital spending, occupation & qualification
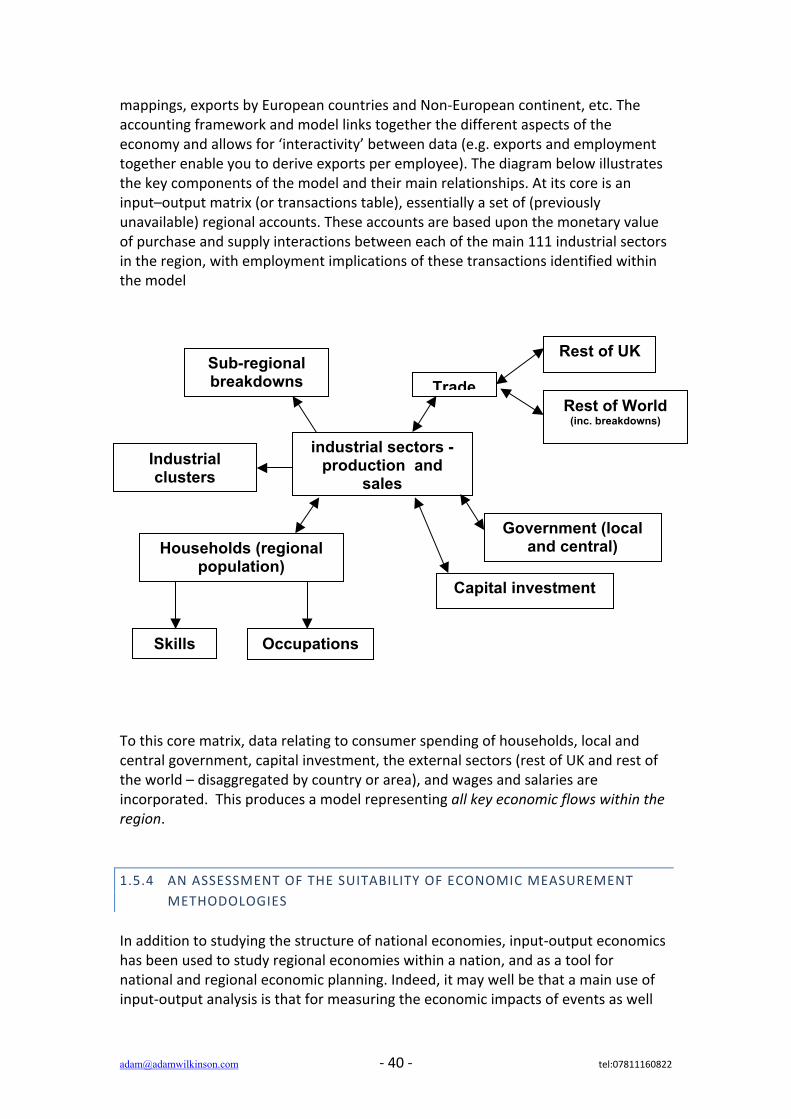
[email protected] ‐ 40 ‐ tel:07811160822
mappings, exports by European countries and Non‐European continent, etc. The accounting framework and model links together the different aspects of the economy and allows for ‘interactivity’ between data (e.g. exports and employment together enable you to derive exports per employee). The diagram below illustrates the key components of the model and their main relationships. At its core is an input–output matrix (or transactions table), essentially a set of (previously unavailable) regional accounts. These accounts are based upon the monetary value of purchase and supply interactions between each of the main 111 industrial sectors in the region, with employment implications of these transactions identified within the model
To this core matrix, data relating to consumer spending of households, local and central government, capital investment, the external sectors (rest of UK and rest of the world – disaggregated by country or area), and wages and salaries are incorporated. This produces a model representing all key economic flows within the region.
1.5.4 AN ASSESSMENT OF THE SUITABILITY OF ECONOMIC MEASUREMENT METHODOLOGIES
In addition to studying the structure of national economies, input‐output economics has been used to study regional economies within a nation, and as a tool for national and regional economic planning. Indeed, it may well be that a main use of input‐output analysis is that for measuring the economic impacts of events as well
industrial sectors - production and
sales
Trade
Government (local and central)
Sub-regional breakdowns
Households (regional population)
Skills
Rest of UK
Rest of World (inc. breakdowns)
Occupations
Industrial clusters
Capital investment
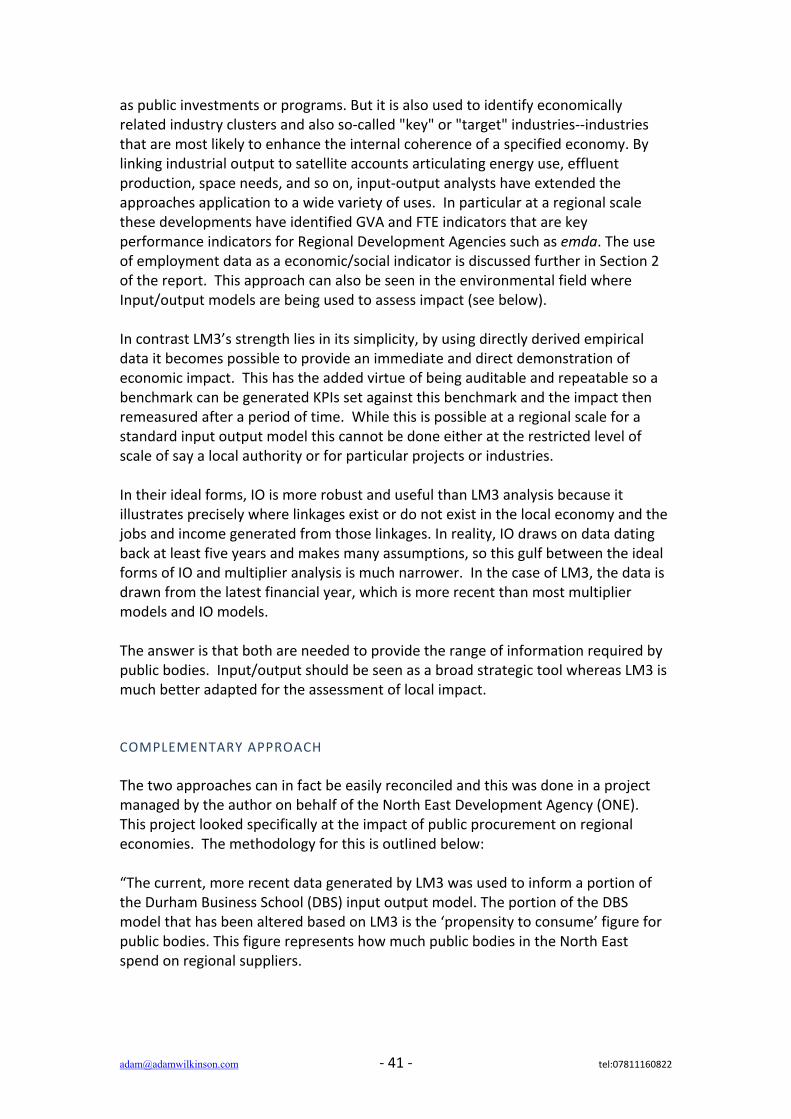
[email protected] ‐ 41 ‐ tel:07811160822
as public investments or programs. But it is also used to identify economically related industry clusters and also so‐called "key" or "target" industries‐‐industries that are most likely to enhance the internal coherence of a specified economy. By linking industrial output to satellite accounts articulating energy use, effluent production, space needs, and so on, input‐output analysts have extended the approaches application to a wide variety of uses. In particular at a regional scale these developments have identified GVA and FTE indicators that are key performance indicators for Regional Development Agencies such as emda. The use of employment data as a economic/social indicator is discussed further in Section 2 of the report. This approach can also be seen in the environmental field where Input/output models are being used to assess impact (see below). In contrast LM3’s strength lies in its simplicity, by using directly derived empirical data it becomes possible to provide an immediate and direct demonstration of economic impact. This has the added virtue of being auditable and repeatable so a benchmark can be generated KPIs set against this benchmark and the impact then remeasured after a period of time. While this is possible at a regional scale for a standard input output model this cannot be done either at the restricted level of scale of say a local authority or for particular projects or industries. In their ideal forms, IO is more robust and useful than LM3 analysis because it illustrates precisely where linkages exist or do not exist in the local economy and the jobs and income generated from those linkages. In reality, IO draws on data dating back at least five years and makes many assumptions, so this gulf between the ideal forms of IO and multiplier analysis is much narrower. In the case of LM3, the data is drawn from the latest financial year, which is more recent than most multiplier models and IO models. The answer is that both are needed to provide the range of information required by public bodies. Input/output should be seen as a broad strategic tool whereas LM3 is much better adapted for the assessment of local impact. COMPLEMENTARY APPROACH The two approaches can in fact be easily reconciled and this was done in a project managed by the author on behalf of the North East Development Agency (ONE). This project looked specifically at the impact of public procurement on regional economies. The methodology for this is outlined below: “The current, more recent data generated by LM3 was used to inform a portion of the Durham Business School (DBS) input output model. The portion of the DBS model that has been altered based on LM3 is the ‘propensity to consume’ figure for public bodies. This figure represents how much public bodies in the North East spend on regional suppliers.
[email protected] ‐ 42 ‐ tel:07811160822
Use of the two models enables ONE to make a more informed judgment about both the economic impact of public procurement as well as the key leverage points to improve that impact. LM3 offers an overall figure that ONE can use for ongoing performance management while IO offers explicit industry information that ONE can use to enhance its policy and programme delivery.” An example of the output of such a synthesised model is shown below.
Wilkinson Adam, 2007, “Public Procurement: Quantifying economic value in the North East”, commissioned by ONE In this sense, the LM3 approach has been shown to be more effective in acting as a catalyst for change at an operational level; however the IO approach is better suited (particularly where informed by empirical multiplier data) at a strategic level. However if data on measures such as employment are seen as critical then a combined approach is likely to be the most effective.
1.6 METHODOLOGIES USED FOR MEASURING THE SOCIAL IMPACTS OF PROCUREMENT.
1.6.1 INTRODUCTION
[email protected] ‐ 43 ‐ tel:07811160822
This section outlines three frameworks of social indicators; social return on investment, social accounting and audit, and social capital. It reviews each approach and concludes that none is appropriate to evidencing diverse public service delivery. The idea of social impacts, which underpins all the frameworks, is proposed as a focus that is directly open to examination and flexible across wide‐ranging expenditure programmes.
1.6.2 AN OVERVIEW OF SOCIAL INDICATOR FRAMEWORKS
An initial assessment of potential frameworks of social indicators were undertaken using the ‘library’ on www.proveandimprove.org, an online resource run by the New Economics Foundation. This identified three relevant frameworks that are reviewed in this paper; Social Return on Investment (SROI), Social Accounting and Audit (SAA) and Social Capital. SOCIAL RETURN ON INVESTMENT SROI is “an approach to measurement, developed from cost‐benefit analysis and social auditing, which captures social value by translating social objectives into financial, and non‐financial, measures… SROI measures the value of the benefits relative to the costs of achieving those benefits.” (Measuring Real Value, NEW ECONOMICS FOUNDATION, undated). The key stages of the process are; stakeholder analysis and impact mapping, data collection to allow the ‘monetisation’ of impacts, analysis and reporting. It was initially developed by a US venture philanthropy fund. The Office of the Third Sector is funding the Measuring Social Value Project to take forward the work on SROI in the UK up to 2011 The following extract taken from the SROI website (www.sroi‐uk.org) sets out the principles: SROI is an approach to understanding and managing the impacts of a project, organisation or policy. It is based on stakeholders and puts financial value on the important impacts identified by stakeholders that do not have market values. The aim is to include the values of people that are often excluded from markets in the same terms as used in markets, that is money, in order to give people a voice in resource allocation decisions. SROI is a framework to structure thinking and understanding. It’s a story not a number. The story should show how you understand the value created, manage it and can prove it. The benefits of SROI are: • a consistent and clear approach to understanding and reporting on the changes
caused by an organisation; resulting in • better organisations, with better strategies, systems and accountability; and
[email protected] ‐ 44 ‐ tel:07811160822
• more able to manage risks, identify opportunities and raise finance required to achieve their mission or strategy.
Principles of SROI: 1. Stakeholders perceptions. Understand the way in which the organisation
creates change through a dialogue with stakeholders; 2. Scope and Materiality. Acknowledge and articulate all the values, objectives
and stakeholders of the organisation before agreeing which aspects of the organisation are to be included in the scope; and determine what must be included in the account in order that stakeholders can make reasonable decisions;
3. Understand change. Articulate clearly how activities create change and evaluate this through the evidence gathered;
4. Comparative. Make comparisons of performance and impact using appropriate benchmarks, targets and external standards;
5. Transparency. Demonstrate the basis on which the findings may be considered accurate and honest; and showing that they will be reported to and discussed with stakeholders;
6. Verification. Ensure appropriate independent verification of the account; 7. Financial proxies. Use financial proxies for indicators in order to include the
values of those excluded from markets in same terms as used in markets. These principles are core to SROI and how it should be used. However, in encouraging consistency of models, SROI UK is in discussion with practitioners who use related tools to see if principles can be aligned and agreement established on measuring social impact. Therefore, these principles and how they are expressed may be revised. SOCIAL ACCOUNTING AND AUDIT Provides a framework through which an organisation can “build on its existing monitoring, documentation and reporting systems to develop a process whereby it can account fully for its social, environmental and economic impacts, report on its performance and draw up an action plan to improve on that performance.” The three stage process ‐ planning; accounting; reporting and external audit ‐ allows an agency to “measure how well they are achieving their overall objectives and living up to their values” (Social Audit Network (SAN), Information Sheet. www.socialauditnetwork.org.uk). Although there is limited information available, discussions between SROI (UK) and SAN have been held to look at potential collaboration and joint development.
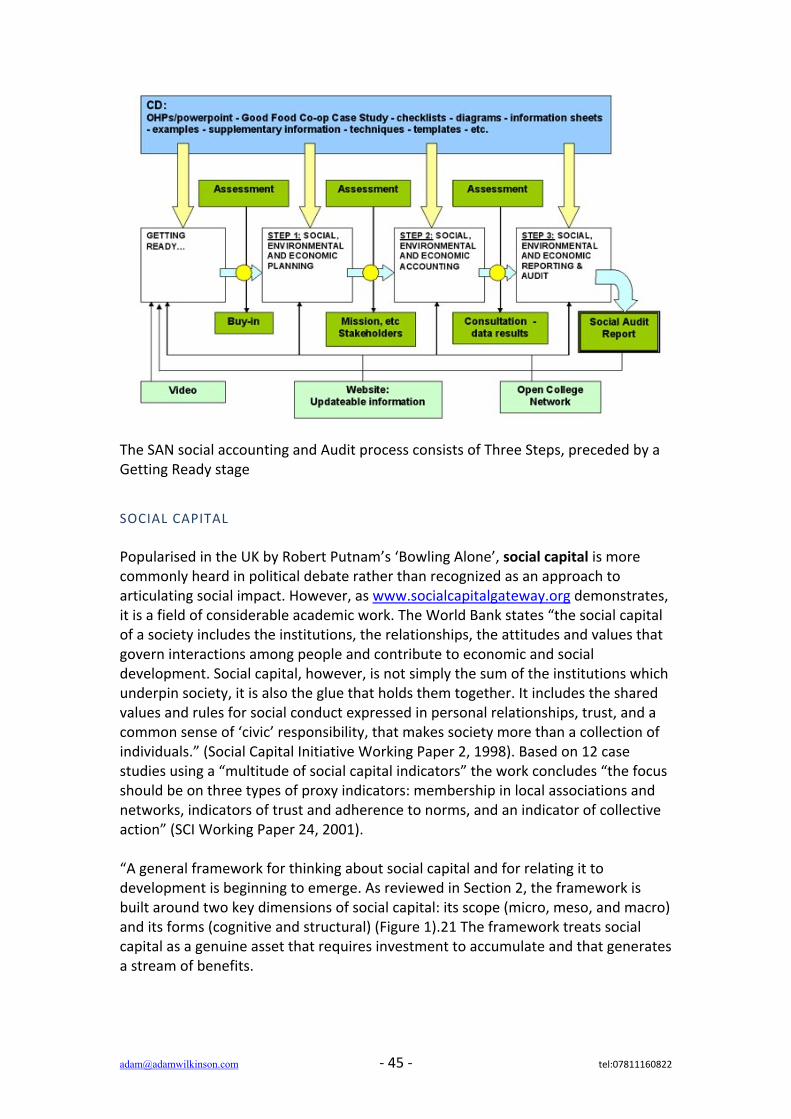
[email protected] ‐ 45 ‐ tel:07811160822
The SAN social accounting and Audit process consists of Three Steps, preceded by a Getting Ready stage SOCIAL CAPITAL Popularised in the UK by Robert Putnam’s ‘Bowling Alone’, social capital is more commonly heard in political debate rather than recognized as an approach to articulating social impact. However, as www.socialcapitalgateway.org demonstrates, it is a field of considerable academic work. The World Bank states “the social capital of a society includes the institutions, the relationships, the attitudes and values that govern interactions among people and contribute to economic and social development. Social capital, however, is not simply the sum of the institutions which underpin society, it is also the glue that holds them together. It includes the shared values and rules for social conduct expressed in personal relationships, trust, and a common sense of ‘civic’ responsibility, that makes society more than a collection of individuals.” (Social Capital Initiative Working Paper 2, 1998). Based on 12 case studies using a “multitude of social capital indicators” the work concludes “the focus should be on three types of proxy indicators: membership in local associations and networks, indicators of trust and adherence to norms, and an indicator of collective action” (SCI Working Paper 24, 2001). “A general framework for thinking about social capital and for relating it to development is beginning to emerge. As reviewed in Section 2, the framework is built around two key dimensions of social capital: its scope (micro, meso, and macro) and its forms (cognitive and structural) (Figure 1).21 The framework treats social capital as a genuine asset that requires investment to accumulate and that generates a stream of benefits.

[email protected] ‐ 46 ‐ tel:07811160822
The ideal approach to measuring social capital would embody all four quadrants of figure 1. In practice, the state of the art has not advanced to that stage. The majority of the SCI studies focused on one or two of these quadrants. Most studies are situated at the micro level and focus on institutions or norms that are relevant for households, villages, and communities. Most SCI studies tried to incorporate aspects of both structural and cognitive social capital, although measurement is often more advanced for structural social capital. Indicators that formally capture both structural and cognitive social capital are found in Krishna and Uphoff’s study of watersheds in India, Isham and Kähkönen’s analysis of water supply systems in Indonesia, Pargal, Huq, and Gilligan’s study of waste management in urban neighborhoods in Bangladesh, and Rose’s study of networks in Russia. Two questions arise naturally from the SCI studies. First, how much progress have we made in measuring social capital and its impact? Have we learned enough to conclude that measuring social capital is realistic, that social capital can be measured as successfully as natural, physical, and human capital? If social capital can be measured, what problems remain in measuring it, and what are the priorities for future research? The second question concerns policy recommendations. The fact that social capital is called capital suggests that one can invest in it, just as one can invest in human and physical capital. Is this the case, and if so, how is it to be done? Which actors are involved in such investment—the state, the private sector, civil society, households, or individuals?” UNDERSTANDING AND MEASURING SOCIALCAPITAL: A SYNTHESIS OF FINDINGS AND RECOMMENDATIONS FROM THESOCIAL CAPITAL INITIATIVE, By Christiaan Grootaert and Thierry van Bastelaer World Bank 2001
[email protected] ‐ 47 ‐ tel:07811160822
1.6.3 AN ASSESSMENT OF THE RELATIVE STRENGTHS AND WEAKNESSES OF SOCIAL INDICATOR FRAMEWORKS
All of the three approaches for describing social impacts have a single key factor in common. They are trying to describe in a systematic way a series of what could be considered in many cases subjective benefits. This is not to say that these are not real, nor important. It is simply the challenge of this area. In a sense we can ask does it matter? If the organisations and their stakeholders feel that these techniques do provide an accurate picture this is in itself sufficient. This would be the case if all funding for these organisations were either earned commercially or grant given. However for good or bad this is not the case and these types of organisations trying to deliver softer types of impacts are increasingly being called upon to act competitively. It is this that is driving the ‘measure it’ element of all three and this area of all three faces the most difficult task in generating meaningful KPI type measures that are capable of the objective assessment necessary to conform with public sector procurement processes. The most obvious route for this is that which has been taken by the Office of the Third Sector to develop the SROI model. The drive is to produce a set of benefits that will then have a standard set of monetised values set against them. So for example the benefit of taking on an unemployed person could be worked out as £x. This would become a standard value that could be applied whenever appropriate. While this value table approach is attractive we believe that this is likely to produce any significant change in public sector procurement practice. What perhaps could have been asked is how to do you measure social impact in such a way that it can be used in mainstream procurement and commissioning? If this work had been commissioned then it would have been much easier to develop what we would argue (and in fact have produced) in section 2 of this work; much more practical measures. By choosing a methodology first this opportunity has been missed. The result will in our view mean that there is a significant likelihood that the adoption of social measures within procurement will be hampered as professional procurers are asked to reconcile objective quantification with monetisation. SAA does not have the same developmental needs as SROI. It is a well established approach with a network of experienced external auditors/validators working with evidence generated within the agency. Because the approach builds on existing management systems, it addresses the demands of regulatory requirements, evidencing delivery, and organisational learning and development with the need to generate the minimum additional data. It is an example of the COUNT (Count Once Use Numerous Times) approach, with its reduction of administrative overheads. If engagement in contracted delivery is seen as a route to building capacity of delivery organisations and service improvement, SAA provides a framework in which this can be co‐produced, and evidenced. This may be particularly relevant to
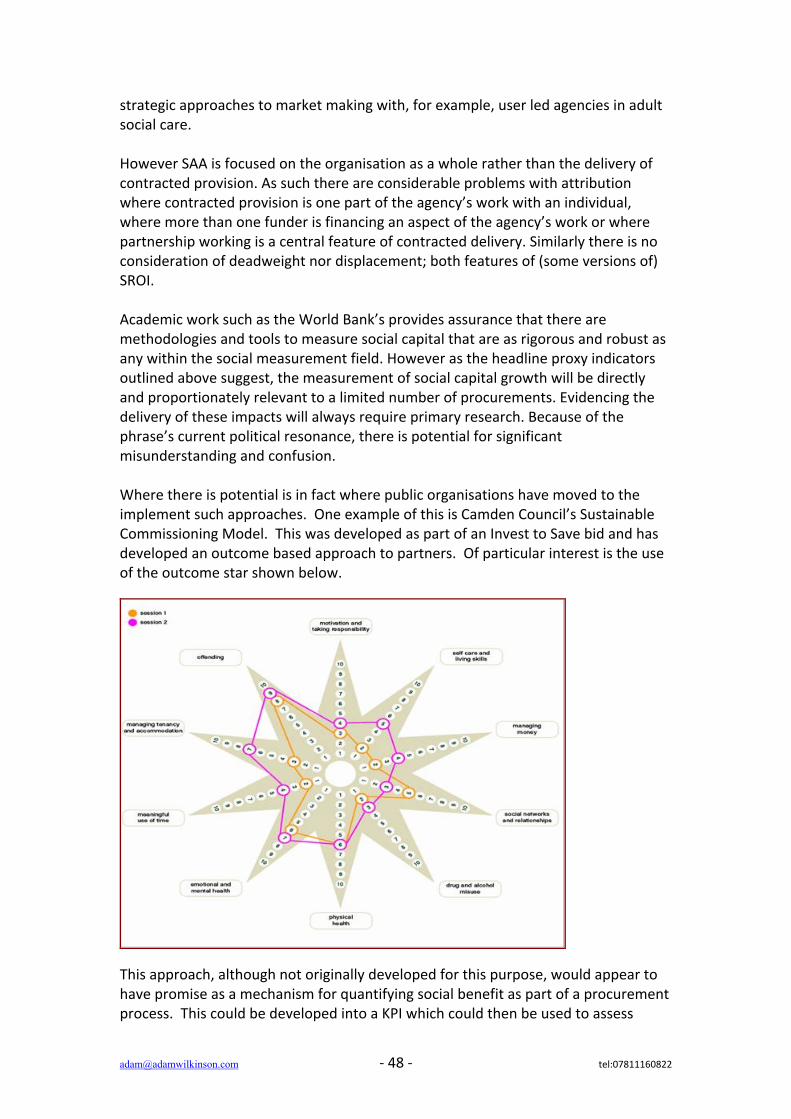
[email protected] ‐ 48 ‐ tel:07811160822
strategic approaches to market making with, for example, user led agencies in adult social care. However SAA is focused on the organisation as a whole rather than the delivery of contracted provision. As such there are considerable problems with attribution where contracted provision is one part of the agency’s work with an individual, where more than one funder is financing an aspect of the agency’s work or where partnership working is a central feature of contracted delivery. Similarly there is no consideration of deadweight nor displacement; both features of (some versions of) SROI. Academic work such as the World Bank’s provides assurance that there are methodologies and tools to measure social capital that are as rigorous and robust as any within the social measurement field. However as the headline proxy indicators outlined above suggest, the measurement of social capital growth will be directly and proportionately relevant to a limited number of procurements. Evidencing the delivery of these impacts will always require primary research. Because of the phrase’s current political resonance, there is potential for significant misunderstanding and confusion. Where there is potential is in fact where public organisations have moved to the implement such approaches. One example of this is Camden Council’s Sustainable Commissioning Model. This was developed as part of an Invest to Save bid and has developed an outcome based approach to partners. Of particular interest is the use of the outcome star shown below.
This approach, although not originally developed for this purpose, would appear to have promise as a mechanism for quantifying social benefit as part of a procurement process. This could be developed into a KPI which could then be used to assess
[email protected] ‐ 49 ‐ tel:07811160822
benefit. It should be emphasised that the reason for this is that a social outcome could be used in procurement as the basis of an objective set of KPIs. This would be achieved by setting quantifiable and objective measures for example number of teenage pregnancies, or % of budget controlled by users. These would tend to be specific to the contract however they could be used within procurements as either monitoring or outcome based conditions of the tender. This seems significantly more likely to produce usable approach than those that try to monetise the subjective.
1.6.4 AN ASSESSMENT OF THE SUITABILITY OF SOCIAL INDICATOR FRAMEWORKS
The frameworks reviewed above can all be used to evidence delivery. It may be that in the future a standardised SROI is more widely used in diverse contexts as developmental work increases the availability of competent practitioners and reduces the costs. SAA’s focus on the organization makes it particularly appropriate in certain circumstances. The effect of any intervention on social capital can be identified; it is a pertinent focus for procuring agencies for particular, fairly limited, sorts of intervention. However none of the frameworks as currently developed lend themselves to being applied across a wide range of different expenditure programmes. Underpinning all three of the frameworks is the idea of impact. They seek to express the social impact of an intervention: SROI places a financial value on it, SAA is focused on the impact of an organization and before/after studies demonstrate the difference to levels of social capital. Impact measures can be used directly in the specification, award and management of contracts. They can similarly be used with grants as well as contracts, although the assurance of delivery and recourse in the event of non‐delivery is considerably reduced with grants programmes. The added value of using any of the above frameworks needs to be assessed against their costs, to procuring and contracted agencies. In our view none of them at their current stage of development can produce measures that can be consistently used within standard procurement practice, although the outcome star approach is worthy of further consideration. Instead we believe that is both more simple and more accurate at this stage to use either direct financial proxy indicators for measurement of social impact (for example % of turnover spent with not for profits or straight forward indirect proxies such as number of teenage pregnancies. These will be outlined in section 2 of the work.
[email protected] ‐ 50 ‐ tel:07811160822
1.7 CONCLUSIONS
Where do these considerations around methodology take us? It is our hope that this review does clarify the range of complexity and issues being faced in this emerging field. At the moment the methodologies reflect an almost random selection of tools being grabbed from the toolbox in an attempt to measure and mend something that we had not even really imagined we needed to do even ten years ago. Our belief is this review shows how developing more coherent policy and taking a strategic view of priorities leads directly towards an outcome based approach. This in turn allows the appliance of KPIs that are meaningful because they are outcome led. Then various methodologies can be used to generate the data to assess actual impact. The first key point of the review is that measurement and rigorous methodology are not a substitute for clearly stated policy intentions and prioritisation. A methodology for measuring impact can be applied, but to make it meaningful it needs to be used in the context of achieving the desired objective. It is this point that both underpins the need for a strategic approach to procurement and is also the reason for the growth in thinking about outcome based approaches. Some broad principles are established at the outset in order to determine a framework in which to construct meaningful measures of sustainability that can be applied to procurement practice. The first principle is that any measures or methodologies that are used in procurement practice need to be objective and should therefore be blind to the aspirations of public policy in their application. This means that they should simply measure the impact of public procurement in sustainability terms, independent from and neutral to the primacy of any particular public policy agenda. The second is in the overall approach to measurement in procurement practice. In defining sustainable procurement, the Government describes measuring achievement both in terms of ‘value for money on a whole life basis and generating benefits not only to the organisation, but also to society and the economy, whilst minimising damage to the environment’. These two approaches are explored as the paper considers the strengths and weaknesses of the use of whole life costing (WLC) and key performance indicators (KPIs). It concludes that while WLC may offer a longer term way forward, and is of real value now in some specific areas, this is currently outweighed by the demands of specialist data and the benefits of using well constructed KPIs. The suggested solution is that by using a smart KPI approach one can utilise the results of different methodologies across a number of different indicators that encompass the three dimensions of sustainable development (economic, social, and environmental). A third strand in considering indicators lies in differentiating between generic and specific KPIs. The suggested solution is that for each dimension of sustainable development there are a small number of generic or corporate level indicators that
[email protected] ‐ 51 ‐ tel:07811160822
should occur in almost all procurements. There are then a larger number of KPIs that may be applied specifically depending on considerations such as the value of the procurement, type of goods or services, and the desired strategic outcome. A final consideration in relation to meaningful indicators lies in the construction of proxy indicators. Proxy indicators have value in that they attempt to describe in a systematic way, a series of what could be considered subjective benefits. Proxy indicators can be categorised as direct and indirect proxies. Indirect proxies are more problematic and a particular challenge lies in monetising measures. At its simplest level it would be easiest if all indicators could be reduced to a reflection of either their costs or their contribution in financial terms as it would be easy to compare measures across different areas ‐ environmental, economic and social. Using monetised indicators in the economic arena is not particularly hard, but even here we see that other non‐financial indicators, such as Full Time employment (FTE) are also important. Where monetising proxy indicators becomes rapidly more complex is in the social field. By attempting to monetise social value the ‘£’ ceases to be a direct proxy and becomes an indirect proxy and one that is sometimes too far removed to be truly meaningful. The rejection of monetised proxies is recognised by the authors as being contentious. However it is seen as critical if a realistic and practical approach to using social indicators in public procurement is to be successful. In reviewing the practical application of social indicator frameworks to procurement practice, Social Return on Investment (SROI), Social Accounting and Audit (SAA) and Social Capital were explored. The conclusions drawn were that SROI works best as an appraisal / evaluation tool and does not easily translate to procurement practice. All three have substantial limitations in their practical application to procurement. However the review identified an existing example of using an ‘outcome star’ in procurement in Camden. By presenting a balanced suite of quantified, non‐ financial indicators in this way, the approach enables genuine comparison between products and/or suppliers. This could be easily adapted to support a KPI approach to measuring sustainability. In reviewing approaches to measuring the environmental impact of procurement we concluded that in an ideal scenario, input‐output models should be used in conjunction with other sources of information, such as existing generic/specific product information, and complementary tools such as activity emissions tools. For example a public procurer might request their suppliers to measure their emissions so that carbon reduction activity is registered. The development of a simple carbon footprint is not unduly onerous or complex although some suppliers may require support. A range of free on‐ line activity‐emission tools exist, we would suggest that the one developed by the Carbon Trust be applied and that suppliers be encouraged to achieve the Trust’s ‘Carbon Standard’. Two broad approaches were reviewed in relation to measuring the economic impact of procurement: input/output models and multipliers. The conclusion was that both are needed to provide the range of information required by public bodies.
[email protected] ‐ 52 ‐ tel:07811160822
Input/output should be seen as a broad strategic tool whereas LM3 is much better adapted for the assessment of local impact. The two approaches have been reconciled in practice in a project managed by the author on behalf of the Regional Development Agency in the North East (ONE), which looked specifically at the impact of public procurement on regional economies. As a final note on sustainable impacts, it is likely that the region’s public sector bodies ‘share’ many of their suppliers. We would recommend that where shared supply chains exist a collaborative approach is taken to supply chain engagement on sustainability issues such as carbon. As a starting point, procurers should agree a common approach to any measurement activity they or their suppliers undertake. The Government’s definition of sustainable procurement encompasses the three dimensions of sustainable development (economic, social, and environmental), each with its own agendas and proposed solutions. It is therefore not at all surprising that no single methodology emerges as being the complete answer, however what is unexpected is how some key themes have emerged in each area, these being the functionality of KPIs and the prevalence of input/output models.
[email protected] ‐ 53 ‐ tel:07811160822
SECTION 2 MEASUREMENT FRAMEWORKS The critical review highlighted the diversity of and some surprising similarities between the various dimensions of sustainable procurement and the various models that have been used to measure impact and change. This section of the work although guided by the conclusions of the review will look specifically at what measures might be used. The starting point for this and the restriction on it is that these measures should be designed for public procurement use. Finally the suggested measures will be field tested against a significant sample of emda’s tier one suppliers. This last exercise will look not only to provide data directly but also to examine how practical the suggested measures are.
2.1 MEASURES SELECTION METHODOLOGY
2.1.1 GATEWAY CRITERIA
In order to establish the key questions within the brief that any measures should be both meaningful and usable two key gateway criteria were agreed. These were that any measure:
• Be usable within a procurement process • Be capable of being expressed as a key performance indicator
The reasoning behind these is as follows. It may at first glance seem self evident that any suggested measure should be usable, this is after all the point of the process however real life is not always so simple. There is a distinct and significant difference between measures that that are used to monitor the impact of a tender and those that are used as part of the award process of a tender. The intention in identifying measures is that they could translate into a requirement of tender applications. In the former there are really no significant barriers to overcome, while in the latter there is a higher degree of risk as the clause could be challenged. Never the less, the point remains that any measure we select should be usable within a procurement process although we would accept that a measure could also be used in a monitoring context. The second gateway criteria, that any measure should be capable of being expressed as a KPI is somewhat more straightforward to discuss. First there is very little point in our view in having a measure that does not relate to performance against the strategic objective of the procurement (and the organisation’s broader strategic objectives). To us the purpose of measurement is as a mechanism to achieve change, for that change to be beneficial it therefore follows that the measurement mechanism must be directly related to or generated from the desired outcome of the procurement and the strategic objectives of the organisation. This of course
[email protected] ‐ 54 ‐ tel:07811160822
should be true for all measurement, however in this case we are directly concerned with measures that can be used within procurement process and delivery. The critical review discussed the importance of methodology being objective irrespective of the desired policy outcome. If the public sector is to use measures across all sectors of sustainability then a critical prerequisite is that these measures should be objective. Well constructed KPIs have both this ability and are able to inform and often catalyse change in the direction desired. For this reason alone we deemed it necessary that any measure should be capable for use as a KPI.
2.1.2 MEASUREMENT SELECTION
As this approach had not previously been attempted the focus was on developing a methodology that could successfully identify KPIs that were usable in public procurement. The outcome of the measurement selection is therefore a set of generic KPIs but with some specific examples. These could then be tested against emda’s supply chain as test of practicality rather than as a ‘perfect set’. The selection of indicators could have been related directly to emda’s own strategic and procurement objectives but this was not done so that all public sector organisations could benefit from this approach. The methodology can now be standardised and applied to specific organisations objectives, and this is recommended as a next stage toward full implementation. It should be remembered that we are seeking to establish measurements that are practical and meaningful for both emda and other public bodies. The criteria below cover both of these areas. The following criteria were selected as being key by the authors and emda. These are:
1. Suitability 2. Availability 3. Objectivity 4. Scalability 5. Prioritisation 6. Strategic
SUITABILITY
In essence has the candidate measure passed the ‘gatekeeper’ tests and how easy or not is it to express this as a quantifiable KPI? This is of particular reference to the social measures as per our discussion around the use of proxies.
[email protected] ‐ 55 ‐ tel:07811160822
AVAILABILITY
Availability is split by source. It is perfectly possible to imagine a measure, for example Gross Value Add (GVA), that is available at a regional scale (from input/output models) but not directly from the supply chain. However if it can be calculated from supply chain information in this sense it is a first generation financial proxy.
OBJECTIVITY
The normal mechanism to ensure objectivity is a third party (audit) approach however this is unlikely to be practical so instead measures are scored against the degree of intrinsic objectivity. For example an estimate of regional % of turnover spend is less objective than say number of employees.
SCALABILITY
While the focus of this work is on emda’s supply chain and management a major element remains the consideration of other public sector organisations and the ability of this work to provide a ‘template’ that could be used by others. Scalability is a key issue in this area. The best example of this is GVA. This is a key measure for emda at a regional level and it is essential for the organisation to monitor its impacts against this. However data is generated from a regional input/output model (see critical review). The minimum scale at which this operates is a regional one. GVA is less important for local authorities but it could be argued that it is not likely that emda could really understand the impacts of its activities (particularly in grant making) unless this measure did extend. We therefore score measures against their scalability. It scarcely needs saying that the more scalable the measure the more useful it is.
PRIORITISATION
The purpose of measurement is to achieve beneficial change. In the reality there is no possibility of emda or indeed any organisation achieving 100% of all objectives. This being the case there will always be a need for prioritisation. This is particularly true in sustainability where as is often said “we can have polar bears or we can have SUV’s, we just can’t have both.” We have already explained that measurement only makes sense within a strategic context. However unless there is a way to relate a measure to a mechanism for prioritisation at a both a strategic and individual procurement level, then there is no quantifiable mechanism available. This we believe is a major difficulty for most organisations and will be explored further in the
[email protected] ‐ 56 ‐ tel:07811160822
conclusions to the work. At this point it is sufficient to score the measure against its suitability for use in prioritisation.
STRATEGIC
There are some measures such as GVA that are intrinsically more strategic than others. emda as a strategic organisation is naturally more interested in these than many other parts of the public sector. Measures are therefore scored for their strategic value. KPI SELECTION As the criteria were developed to select suitable indicators, potential candidates from a range of sources were compared to the criteria and either rejected or accepted. This process allowed us to test both the validity of the criteria and the indicators. There are many sources of candidate measures that were considered and either rejected for failing the gateway criteria or rejected for other reasons. For example, Defra published the Sustainable Development indicators in 2008. Sixty eight main indicators across all sections of sustainability including Wellbeing are described and it was tempting to use these where possible if for no other reason that they would then line the work up with national initiatives. Unfortunately while some of these could have been used from which to develop KPIs, for example recorded crime as a specific social indicator, it was hard to see how these could have passed the use in procurement criteria. Further potential sources of indicators were, the models identified in the critical review, for example the input output models cited in both environmental and economic areas. The coarse grained nature of the data which is used in their calculations restricts their value as a monitoring tool. The difficulty in considering environmental candidates surrounded the lack of standardised information. Large numbers of potentially generic indicators do exist, for example methane and other greenhouse gases. However from a generic perspective what was needed was a single reasonably coherent measure that could be used with some degree of confidence. It was for this reason that the Carbon tool approach was used to try and provide this single indicator. It was accepted that this fell outside of a KPI in its strictest form as it really an organisational status tool but was seen as an acceptable mechanism. The survey results later confirmed the practicality of this approach but also demonstrated that the more comprehensive version of the model needed to be completed. This we would suggest lies at the heart of measurement selection process. In particular the continuing theme of this report that is the lack of a chain from strategic national objective through to actual procurement process. While over two
[email protected] ‐ 57 ‐ tel:07811160822
hundred different candidates were suggested the vast majority failed to progress for three reasons.
1. That they were not usable within a public procurement process; 2. They could have had specific KPIs developed but did not have the potential
to be generic KPIs; 3. They operated at a scale (usually regional +) that made them unusable at a
contract supplier level.
2.1.3 MEASUREMENT SCORING
The table shown below applies all of the various elements of the measurement methodology discussed to the generic candidate measures for emda across all three areas of sustainability. Each is briefly discussed below.
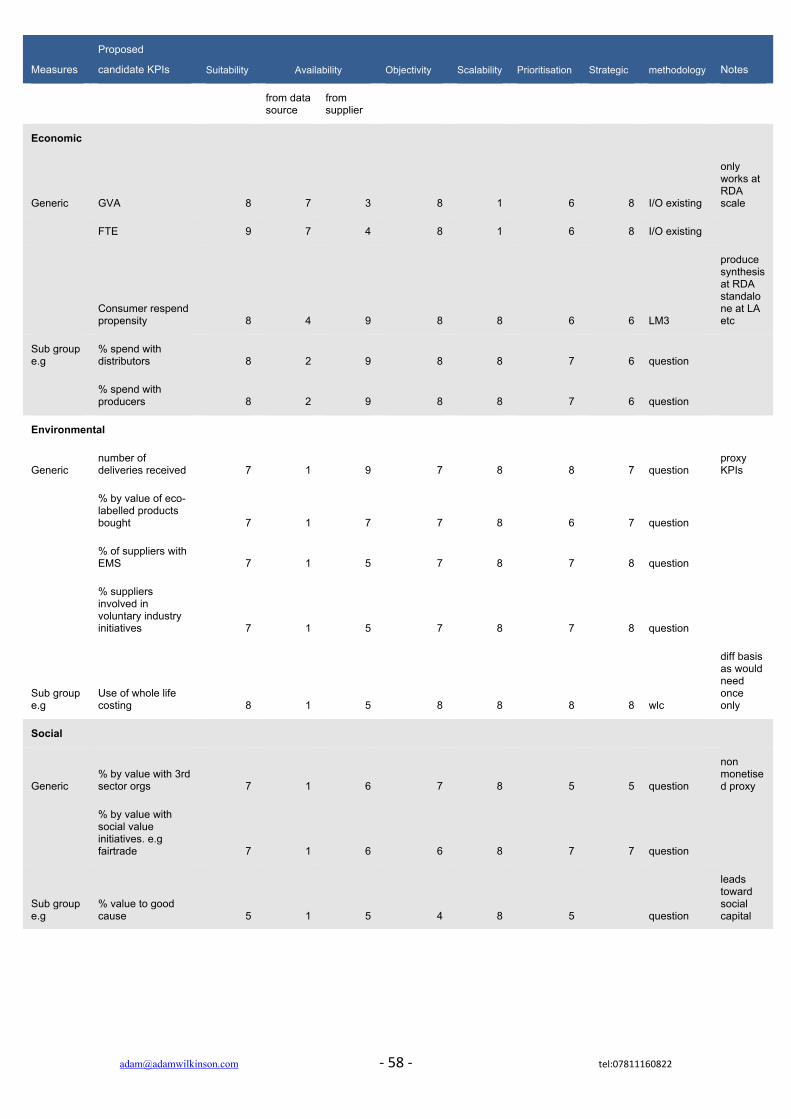
[email protected] ‐ 58 ‐ tel:07811160822
Measures
Proposed
candidate KPIs Suitability Availability Objectivity Scalability Prioritisation Strategic methodology Notes
from data source
from supplier
Economic
Generic GVA 8 7 3 8 1 6 8 I/O existing
only works at RDA scale
FTE 9 7 4 8 1 6 8 I/O existing
Consumer respend propensity 8 4 9 8 8 6 6 LM3
produce synthesis at RDA standalone at LA etc
Sub group e.g
% spend with distributors 8 2 9 8 8 7 6 question
% spend with producers 8 2 9 8 8 7 6 question
Environmental
Generic number of deliveries received 7 1 9 7 8 8 7 question
proxy KPIs
% by value of eco-labelled products bought 7 1 7 7 8 6 7 question
% of suppliers with EMS 7 1 5 7 8 7 8 question
% suppliers involved in voluntary industry initiatives 7 1 5 7 8 7 8 question
Sub group e.g
Use of whole life costing 8 1 5 8 8 8 8 wlc
diff basis as would need once only
Social
Generic % by value with 3rd sector orgs 7 1 6 7 8 5 5 question
non monetised proxy
% by value with social value initiatives. e.g fairtrade 7 1 6 6 8 7 7 question
Sub group e.g
% value to good cause 5 1 5 4 8 5 question
leads toward social capital
[email protected] ‐ 59 ‐ tel:07811160822
2.1.4 SUGGESTED MEASURES (SUMMARY)
ECONOMIC
Economic measures are relatively straightforward as GVA really suggests itself as a measure. The issues arise around scalability and data availability. GVA does not work properly below a regional scale. In addition work done elsewhere with 25 local authorities in the North East suggested considerable issues with the accuracy of the data within an input/output model as opposed to direct empirical data gathered using LM3. However the synthesis of the model showed how this could be reconciled (see critical review). Therefore it makes sense to include both measures as standard. An additional refinement as used in the supplier survey is to ask for the base data from suppliers to enable GVA to be calculated. This means that we obtain a triangular data set consisting of:
• Input/output data (derived from regional emda model); • Empirical GVA data calculated from pilot; • Empirical Sales multiplier (LM3) from pilot.
The example sub group suggested would enable this data to be further refined by analysing the difference between producers and distributors, with the implication that more value is created by production than distribution. An additional area for consideration is employment data and its use as a social/economic measure. This measure is widely used by agencies as a key indicator of economic progress. However this is really an output rather than outcome measure. For example if the objective is to increase GVA then increasing employment per se would have a detrimental impact on this unless productivity is also increased. It is therefore difficult to argue for its inclusion as a proxy economic indicator. Our view is that it is a key indicator (all be it one that requires careful presentation), because of this we would expect it to be included in most procurement as a monitoring KPI but not as full blown generic KPI.
ENVIRONMENTAL
No single set of data is going to generate an environmental measurement. The challenges have already been discussed within the critical review. In this area we have used a dual approach. The first is to use the Carbon footprint calculator from the Carbon Trust to produce a benchmark of Carbon. This being separate from other measures.
[email protected] ‐ 60 ‐ tel:07811160822
Second we have selected a number of direct proxies (as explained in the review) to provide broader indicators of environmental impact. It is fully accepted that at this stage the challenge of data availability from suppliers is considerable, and the level of indicator has been intentionally pitched to reinforce the practical element of data gathering. Whole life costing does offer a parallel and in some ways more direct alternative approach. However this as yet is available to only a few areas and therefore does not really meet the criteria of availability.
SOCIAL
The key decision making element in this section is the rejection of monetisation of social impact (as discussed in the critical review). This leave two types of indicator available either direct financial proxies which are the ones used or indirect proxies for example the number of previously unemployed people. At this stage direct proxies have been suggested for ease of use by suppliers. This area in particular is capable of generating large numbers of sub measures. The outcome star approach used by Camden Council within their outcome based procurement work does offer an interesting way forward for generating more specific sets of these indicators. This approach is discussed in more detail within the conclusions and recommendations section.
[email protected] ‐ 61 ‐ tel:07811160822
SECTION 3 PILOT SURVEY
3.1 PURPOSE OF QUESTIONNAIRE
The objective of the questionnaire phase of the project was to establish whether the suggested measures from phase 2 could be applied effectively within the supply chain. However almost as important was the need to discover the attitudes and experiences of the businesses being questioned in relation to sustainable procurement. For these purposes qualitative data was actively sought in addition to the purely quantitative measures being suggested.
3.2 SAMPLE
The methodology adopted was not to take a simple sample or to construct a statistical basis. Rather it was considered more important to ensure that a range of suppliers was represented, and that the sample should be composed both of suppliers awarded contracts through a procurement process and organisations in receipt of grant funding. The original intention was that we should concentrate entirely on telephone based interviews to ensure that the maximum amount of qualitative information was gained. 125 suppliers were selected by emda staff and a letter (Appendix 3) was sent to them. This was followed by a phone call from our staff to make contact and arrange an interview time. The questions asked (Appendix 4) were based entirely on the measures suggested in phase 2 of this work, with the addition of a small amount of ‘base’ data at the request of emda.
3.3 RESULTS
3.3.1 RESPONSE
125 different suppliers were contacted, of these 57 (45.6%) responded. A full analysis of the responses is contained below. It is important to point out that a number of important issues arose at the contact point. First, no contact name was available for the majority of the suppliers. This meant that a significant amount of time was needed to make contact with the right people in the organisation to answer the questions. Second, no organisations had all of the information in one place and often the contact, once established had to spend time talking to others to gather the information on our behalf. This is not surprising given the breadth of the information being requested, however it clearly showed that currently organisations are not collecting this data in a systematic form across their organisations. This is
[email protected] ‐ 62 ‐ tel:07811160822
explored in more detail in the conclusions section. However from a practical point of view it meant that time spent to collect data was considerable. Generally three or four phone conversations were required for each respondent. Businesses for whom emda contracts provide a significant share of annual turnover where generally happy to oblige, as were the majority of suppliers located within the East Midlands region. Businesses based outside of the region or that have few or no suppliers or staff in the East Midlands were less keen to take part and questioned the relevance of their information to a study that is looking at the East Midlands. They were encouraged to take part by explaining that without their information, estimating the economic impact of emda’s spend, for example, will be skewed. A number of businesses stated that they would be more willing to spend time on answering the questions, provide more accurate and complete information if there was either a commercial benefit from doing so, or if it became a condition of contract for emda or other notable public sector suppliers. It should be emphasised that emda as a regional development agency has a relatively restricted supplier list. It is not a deliverer of goods and services as is the case in most public sector organisations. This in itself will tend to restrict the range of responses available.
3.3.2 ECONOMIC DATA
Generally speaking, there was a willingness amongst participants to provide the financial data requested as part of the telephone interview. Indeed, only four businesses were unwilling to provide any financial data at all, suggesting that it was too sensitive to disclose to emda and were reluctant to provide it as part of a telephone interview with a consultant. Only five businesses were unable to provide details of annual spend on goods and services; six could not provide annual wage costs and eight, net profit. The area where the economic assessment is most challenging for the interviewee is in relation to the distribution of spend with suppliers inside and outside the East Midlands. This question was answered by 44 of the 57 respondents, but for a substantial number these are rough estimates rather than calculations as accounting systems are simply not designed to provide this sort of analysis. This is also true, and perhaps increasingly so, for the division of spend between producers and distributors of goods and services. This question was answered by 38 of the 57 respondents. Whilst some businesses with a smaller number of suppliers were able to scan down their supplier list and quickly add up different types of spend, for those with 100+ suppliers this is less of a manageable task and as before, accounts systems are not currently configured for this type of report. However in general as expected the economic indicators were reasonably straightforward. Certainly if these were made a condition of contract there is not likely to be significant difficulty in gathering this information. The area where a more specific tool would be needed is in the data collection of regional spend and its analysis.
[email protected] ‐ 63 ‐ tel:07811160822
We have taken the financial data provided and carried out a further analysis to demonstrate how this can be used to generate economic impact analysis. As explained in section one of this report this data could be used both to cross check the input/output model but could also be merged with it to determine a more accurate economic impact forecast. Table 1 below shows the economic impact of the suppliers who answered the regional breakdown data (47 suppliers).
Source : questionnaire results for supplier turnover and spend. This table shows that if we take the total turnover of the respondents and average the respend % from the survey data, we can then calculate and indicative LM3 (using the constants developed in the North East Work) this gives us an indicative total economic impact of £473.8 million from the tier one suppliers in the emda supply chain. By assuming that the same spend pattern would apply across all of the emda spending we can then extrapolate using the same constants to show that the indicative total direct economic impact of emda’s activity in 2007/8 was £244.9m Table 2 Combines emda’s total regional programme spend for 2007/08 (excluding wage and admin costs) Total spend 2007/8 (£m) emda tier 1 total spend 125.9 Extrapolated total economic impact E midlands
216.55
Extrapolated indicative lm3 1.72 Source: emda financial figures for 2007/8. What these tables demonstrate is not necessarily an absolute figure but they show clearly how using a basic economic impact figure can be used as both a benchmark and target. By using these as KPIs within procurement and embedding these within
5 LM3 constants were developed as a part of the work done with all 25 councils in the North East of England and from other LM3 data. They enable a reasonable ‘indicative’ total LM3 figure to be derived from only two rather than 3 generations of spending.
Spend 2007/8 (£m)
Notes
Total turnover 274 Those that supplied financial data
% in East Midlands (£) 49% Average those supplied distribution of spend
Extrapolated total economic impact in East Midlands
473.8 Using lm3 constants5
Indicative lm3 1.72
[email protected] ‐ 64 ‐ tel:07811160822
the contract conditions and then monitoring them a full picture of economic impact and supplier performance can be built up over time. LM3 supply chain manager (www.lm3supplychain.com) demonstrates how this can be done. As an interesting side area the 57 businesses that responded to the questionnaire employed 7483 people in full time or FTE posts.
3.3.3 ENVIRONMENTAL
The Carbon Trust provides an on‐line calculator that allows businesses to calculate carbon emissions (CO2 equivalent) by providing details of their annual energy bill (heating and lighting costs in accounting terms) and the sector in which they operate. Survey participants were asked to take part is this exercise by either logging on to web‐link provided or by providing their annual energy spend to the interviewer to do the calculation for them. 38 of the 57 respondents took part in this question, 13 of which reported a CO2 estimate of 8.8 tonnes pa and 11 reported 88 tonnes. The calculator would appear to have a number of limitations: The lowest spend figure you can use in the calculation is £1,000, meaning that some of the figures reported are an over estimate. The CO2 calculation would appear to be preset for each of the spend bands and sectors. So, for example, and office based business activity spending £1,000 pa on heating and lighting will have the same CO2 output as a business spending £5,000 pa (8.8 tonnes), whist all office‐based businesses spending any amount between £5,001 and £15,000 will all have an output of 88 tonnes pa. Two businesses who had undertaken a detailed carbon footprint assessment with the Carbon Trust felt that the calculator generated figures that vastly over‐estimated their CO2 emissions. These drawbacks would suggest that whilst the calculator may have some use in helping businesses to appreciate the impact of their energy consumption of the environment, but as a means of measuring change and improvement over time it is much more limited. We have recommended that the more comprehensive calculator is used in further work. ENVIRONMENTAL MANAGEMENT SYSTEMS Only eight of the 57 respondents did not have a written environmental policy or management system in place. Of the eight, five were still positive about things like recycling, energy efficiency and sustainable travel. Of the remaining 49 respondents, 39 have a written policy or statement and just 10 have an EMS. Policies were seemingly all fairly standard, covering recycling, waste minimisation, energy efficiency, water efficiency, travel and in fewer cases sustainable/ethical procurement. Of those with policies, the majority are generally enthusiastic about what it covers and how the policy is implemented. A couple are currently working
[email protected] ‐ 65 ‐ tel:07811160822
towards or plan to work towards ISO14001. However, 10 of the businesses suggested that they have an environmental policy because it is a requirement for most public sector contracts. Only nine of the 57 businesses knew whether their suppliers have an EMS or written policy, and some of these estimates were based on guesswork. The reason for the low response to this question is that there is currently no commercial reason for them to collect or request this information from suppliers. WHOLE LIFE COSTS Whole life cost was not a term or principal that all respondents were aware of, but on explanation 32 of the 57 respondents indicated that this approach is taken around purchasing (and in some cases leasing) capital equipment. The majority mentioned PCs and office equipment as common areas, whilst other areas included cars, heating systems and other equipment. Initial outlay and maintenance/servicing costs were considered by all businesses and to a lesser extent disposal methods and costs were also reviewed. Environmental considerations were less important, with energy efficiency being the most common response, followed by CO2 emissions for cars and use of recycled materials. The 22 that did not use WLC principals felt that commercial factors such as initial cost, quality and fit for purpose were more important considerations. For a number of the 22, people (sub‐contractors) were the most important service bought in and for those WLC principals do not apply, with experience and expertise the dominant factors.
3.3.4 SOCIAL
This area of the survey was the least satisfactory of the three areas. This is not surprising because as discussed previously the social area of activity is both very wide and also often quite specific in its application. This favours more specific KPI that are more likely to be targeted at individual contracts with specific aims. However two key finding emerge from the analysis below. Firstly, that we would need to be more specific in explaining what form of activity should be counted. Secondly that in this case in particular it is essential to make these clear before the start of any contract delivery. In addition our feeling is that we should in this area concentrate on developing the basket of specific KPIs more fully. So for example there has been debate about whether one could include employment outcomes either as a generic social/economic KPI that could also act as a proxy for social impact. This is attractive as it is a key indicator for many public sector organisations and is relatively easily accounted for. However it is difficult to see how it could be a true generic indicator as there are significant areas of work that would have no impact on employment rates and for an indicator to be generic it has to be applicable to all activity. This
[email protected] ‐ 66 ‐ tel:07811160822
would suggest that it is a specific indicator that would have wide use in both economic and social monitoring. However other indicators that would fit into the same type of bracket are training and qualification based outcomes. It is tempting having rejected the monetisation route for proxy indicators to fall back into these more output related areas, our feeling is that this should be resisted and further work can be done to develop the type of social indicator used in this survey. The key element here is being clear about what is going to be asked for in advance. VOLUNTARY INDUSTRY INNITIATIVES (VII’s) Nine of the 57 respondents said that they were involved in voluntary initiatives, but all were uncertain whether they qualify as VII’s. Examples included the Carbon Reduction Initiative, Rural Community Carbon Network, Voluntary Environmental Index, Transact (Nottingham) and initiatives related to pesticide usage and wildlife management. A number of respondents mistook VII’s for corporate and social responsibility type initiatives, whilst a proportion felt that these types of initiatives were probably more suited to other sectors and to manufacturing and process industries in particular. None of the respondents were aware of supplier involvement in VIIs, again because they simply haven’t needed to ask them about it SOCIAL BENEFITS All respondents answered the question relating to the wider social impact of procurement, although the answers provided were quite varied. Most respondents focused on the terms on conditions imposed by suppliers on staff and on things like health and safety and equal opportunities in particular. The general consensus was that they had not asked or had any need to ask suppliers for this type of information. There were some exceptions to this, in particular if suppliers or sub‐contractors are being named on a public sector tender submission that requires evidence of equal opportunity and health & safety policies. There were also a minority of businesses that actively looked for ethical suppliers that were either staff friendly or which provided products or services that have limited or no impact on the environment. Social value initiatives – this question did not work for two reasons. First, the only social value initiative that the majority had heard of was fair trade; and spend on goods from these types of sources is generally very low and notably less than 1%. Good Causes – there are a proportion of suppliers that donate a percentage of turnover or a percentage of profit to good causes, either donations to charities or as sponsorship of events/activities. Where this is true, the business has been able to provide a % figure as requested. However, there are many more businesses that
[email protected] ‐ 67 ‐ tel:07811160822
provide in‐kind support to good causes through staff time and free services e.g. they work in schools with Young Enterprise, do fund raising activities, run community activities, etc. As they were generally unable to place a financial value on these types of activities, what might be more appropriate would be to ask then how much time (number of staff days/hours) are spent on this type of activity per year.
3.4 RECOMMENDATIONS AND CONCLUSIONS
In general respondents were prepared to cooperate with the survey and could see why emda should be interested in collecting this data. The economic area worked well as might be expected with straightforward questions about areas businesses already do or at least should collect information. Fully established analysis mechanisms also make this relatively easy. The additional analysis showing how economic impacts can be calculated demonstrates how to apply these mechanisms in a systematic ways. The principles used for the social area were confirmed however the actual results were less satisfactory. This is seen to be largely because there are relatively few generic social indicators. There is a much greater need for this area for specific KPIs and the inclusion of broader indicators such as employment and training that would overlap with other economic indicators. However the key recommendation remains that objective, specific, social indicators are the most effective way forward. In addition it is in this area more than any other where agencies such as emda can provide a lead for suppliers, to enable them to collect relevant data. On the environmental side it has become clear that the carbon baseline used needs to be calculator, rather than the indicator, this does require more participation from the supplier initially but does provide a better benchmark. For EMS schemes we believe that we should narrow the question to ask if they have or are working towards ISO14001 or EMAS. These are both independently validated. There are an ever growing number of eco‐labels, the flower is just one of many. The idea behind using eco‐labels as a KPI (and emda might want to consider just which it will accept as they are not all equal) is twofold, firstly procurers should be using them, the extent to which they are used will then be measured by the KPI. Secondly, there will in some cases be suppliers who are supplying certified product to emda but no one is bothering to mention this.
[email protected] ‐ 68 ‐ tel:07811160822
SECTION 4 FINAL CONCLUSIONS AND RECOMMENDATIONS
4.1 FINAL RECOMMENDATIONS
4.1.1 STRATEGIC
For public bodies to successfully utilise procurement to deliver sustainable development objectives, the findings of this study lead the authors to identify the following strategic recommendations:
1. Develop a standardised approach to measuring strategic outcomes across public sector procuring organisations, bringing clarity to markets by better specifying what they wish to buy and supporting suppliers to respond to consistently applied measures. This would provide an opportunity for suppliers and their supply chains to develop their own management and measurement systems and processes to collect and report outcomes in line with public policy goals.
2. Reconcile the policy aspirations that public procuring organisations are
required to deliver through procurement. It is necessary for an organisation to possess a clear strategic view of its sustainability objectives across economic, environmental and social areas and to be able to prioritise which outcomes any given procurement should deliver.
3. Clearly link the organisation’s impact measurement process to its strategic
sustainability objectives by establishing a meaningful set of measures that support their delivery.
4. Adopt an Outcome based approach to procurement as the key mechanism to
generate sustainability benefits through procurement.
5. We would recommend that consideration is given to further developing the KPI selection process into a standalone methodology that could be made available, free to all public organisations.
6. We recognise the need for a parallel process to take place to enable business
support organisations to support existing and potential suppliers to the public sector to demonstrate their delivery of sustainable outcomes perhaps through awareness raising, training and an ongoing support mechanism.
[email protected] ‐ 69 ‐ tel:07811160822
4.1.2 OPERATIONAL
From an operational perspective, the authors make the flowing recommendations:
1. Incorporate sustainability indicators in the form of smart KPIs into the corporate performance management systems of public procurers.
2. Create synergy between corporate KPIs that are used to monitor activity in
order to measure impact, and criteria used to score tenders. It is critical that the KPIs that are generated are translated and applied to the procurement process.
3. Develop the operational systems and procedures within procuring
organisations to embed sustainability measurement into day‐to‐day procurement and monitoring practice. This would help suppliers to know what information they need to produce and when and would provide the public sector leadership that is required, particularly in the social impact area.
4. In implementing the approach, procuring organisations should develop
operational guidance, that considers proportionality and the appropriate application of outcome based specifications. The value and the nature of the good or service may influence the extent to which strategic outcomes can be sensibly achieved through the procurement.
5. We would strongly recommend the development of an impact measurement
tool that would enable the organisation to monitor all KPIs in contracts and then have the ability to accumulate these to feedback the results against the corporate objectives. Such a tool would also be able to produce specific KPI data requests to individual contracts. This would greatly aid suppliers to improve their own data collection, as well as supplying a comprehensive mechanism for assessing sustainability for the procuring organisation.
4.1.3 OTHER
We would recommend identifying a number of key, large scale projects to demonstrate the approach outlined in the recommendations above. In doing so both process and strategic outcomes could be achieved and measured. Any demonstration of the approach should include the provision of practical support both for buyers and suppliers to develop the appropriate systems and processes to deliver sustainability through procurement.
[email protected] ‐ 70 ‐ tel:07811160822
Acknowledgements It is not often that there is an opportunity to step back from the everyday and to think more strategically about how it may be possible to make a real difference to how the world works. This report offered an opportunity to do just this. While we would not make any claim that there is anything intrinsically world changing in our thinking, we do believe that we have shown that there is a common sense way of moving forward that can offer practical benefits for those concerned with the application of public resources and the measurement of outcomes. Particular thanks are due to Helen Bell for her unstinting support for our attempts to make sense, and to write sense. Chris Ford deserves mention for his contribution to the social analysis. Bill Kirkup with his perfectionist desire to understand everything about environmental measurement, has made a crucial contribution to by far the most challenging part of this work. Bryan Latty deserves several medals for his persistence and persuasive powers in cajoling and cudgelling the unlucky suppliers to produce information that they often did not know that they had. Our hope is that this can make it easier for policy makers, and procurement departments to make better sense of a confusing and often contradictory world. Adam Wilkinson
[email protected] ‐ 71 ‐ tel:07811160822
Appendices
APPENDIX 1 MULTIPLIERS
Economic Multipliers and Local Economic Impact Analysis David Kay, Cornell Local Government Program December 2002 http://www.cdtoolbox.net/economic_development/000149.html Final Demand Changes, Multiplier Rounds, and Leakage There are at least three key concepts that must be understood to understand what lies behind the use of most multipliers. The first is the concept of an economic stimulus through a change in final demand. The second is the notion of a chain of spending and respending that is set into motion by an initial economic stimulus. The third is the notion of "leakage" from a local economy. "Final demand" refers to the sales of economic goods and services to purchasers who are the ultimate users or consumers of these products. The demand is "final" as opposed to "intermediate". In other words, the goods and services are valued in and of themselves rather than for their usefulness in the economic production of new goods and services. When final demand increases, a kind of chain reaction of economic events is triggered. The initial stimulus of new spending sets into motion a series of additional spending and respending activities. Most multipliers are used with the presumption that, in a precise mirror image of an increase, any decrease in existing final demand sets into motion a whole series of spending contractions. The best way to explain this may be to give an example (using a spending increase). Assume the overall final demand for locally made ice cream increases significantly, say boosting sales by $100,000 because of a successful non‐local advertising campaign. The local ice‐cream manufacturer's receipts then increase, but that is not the end of the money trail. In order to meet the increased demand, the manufacturer will typically respond by increasing production. To do this, the firm will use some portion of the $100,000 to buy more inputs in the form of additional goods and services. The additional inputs for new ice cream production will include ingredients like cream, sugar, fruits, and chocolate; paper and ink for more containers; more electricity and water; more labour; perhaps even new equipment; and so on. But again, this is not the end of the money trail. Each of the ice‐cream manufacturer's suppliers will respond in similar fashion. As demand for their products increase, so they too will increase their purchases of all the inputs they require for their production processes. Ultimately, the chain of input purchases is
[email protected] ‐ 72 ‐ tel:07811160822
likely to reach far beyond the sectors of the economy that are most obviously linked to ice cream production. Increased purchases of inputs by business firms are not the only way in which the economic stimulus of increased final demand diffuses throughout the economy. People also benefit from increased demand as workers or business owners earn more. They are very unlikely to stash all of their increased revenues unproductively in a cookie jar. More likely, they will spend some or all of that money on a wide variety of new consumer goods and services, not to mention new investments. Depending on their income classes, purchasers of new consumer goods will likely spend across the full spectrum from cookies to cars to piano lessons. Next, as the grocery stores, car dealers, and piano teachers respond to this increased demand, they will in turn increase their own purchases of inputs to their businesses. Moreover, any owners and employees in these businesses will have additional income or profit to spend on still other goods and services. At first glance, this cycle of spending and respending seems like it might continue without end. However, this is not the case. The reason can be summarized in the term "leakage". Leakage represents the dollars that are withdrawn from the respending cycle. Insofar as they are not respent, the withdrawn dollars cannot stimulate further purchases. Starting right at the very first round of spending associated with an increase in final demand, and continuing in all subsequent rounds, a certain portion of the dollars will "leak" out of the economy. Because of leakage, at each round of spending and respending, the dollar amount re‐spent diminishes. The amount that it diminishes is usually averaged across the entire process and summarized in percentage terms. A small amount of leakage may indeed end up in a cookie jar or under someone's mattress. However, leakage more importantly is associated with other sources including: * other forms of long term saving and nonlocal investment * increased tax payments * spending on goods and services that are not produced locally, (e.g. domestic and foreign imports) While it is true that some of what is termed leakage here may eventually be re‐spent locally, this is not likely to be immediate or automatic. If such spending does occur, it would generally be considered a new increase in final demand. A single city or county, especially in a rural area, is much more likely to experience high levels of leakage. This is because, compared to a state or nation, most "small" economies are more dependent on the need to buy many goods and services produced outside its boundaries. For this reason, it is nearly always but not
[email protected] ‐ 73 ‐ tel:07811160822
necessarily true that multipliers for small geographic areas are smaller than for larger ones. In fact, a couple of the more likely errors behind exaggerated economic impact reports pertain to misunderstandings of the role of geographic boundaries. One is the misapplication of a large area multiplier (state and national multipliers are usually easier to acquire at low cost) to a small area like a county. Another is the failure to account for the fact that new consumer spending that is associated with one new project in a regional economy (a retail mall, for example) may be partly or even fully counterbalanced by reduced consumer spending at existing, competitive facilities within the same region. Figure 1 illustrates the rounds of spending and leakage that are associated with a $100,000 change in final demand. A multiplier of 2.5 and 40% leakage are assumed. Many Kinds of Multipliers One of the reasons references to multipliers can be confusing is that there are a number of different kinds of multipliers that can be calculated. Multipliers often vary in their unit of measurement or denominator (e.g. output, jobs, income). I‐O multipliers also vary in the assumptions they make about the relationship between increased worker and investor incomes and subsequent consumer spending behaviour. An employment multiplier summarizes the number of total jobs in the economy that will be created for each new job created directly by a given increase in final demand. An output multiplier represents the total value of new sales that will be stimulated in the economy for each dollar increase in final demand. And the income multiplier indicates the total amount of new income that will be generated for each dollar of income earned by workers in the industry directly affected by the increased final demand. Any one of these multipliers is as valid to use as any others. The choice of which to use depends upon what issues are being studied and what kinds of measures are of greatest salience to the intended audience. These three kinds of multipliers are often calculated before others because they tend to have high political salience.
APPENDIX 2 LOCALISATION
WHAT IMPLICATIONS FOR THE DEBATE ON LOCALISATION?
“The Strategy has provided a shared understanding of the region, its challenges and opportunities, and a high degree of consensus over the priorities and the activities we need to focus on to improve the economic performance of the region, while at the same time improving the quality of life of all those who live and work here.” emda RES A Flourishing Region p11. The brief asks what implications there are in this review of methodology for debates around some of the assumptions about locality. For example is a self sufficient economy a healthy one, what impact could one form of impact measurement have on local prosperity versus another? As the quotation above suggests this is not a straightforward argument. There are a number of factors here which run through and around this debate. If we start with the notion of protectionism versus localisation we can see immediately that whether something is considered protectionist (bad) or ‘improving the quality of life for all those who live and work here’ (good) , depends largely on who asks the question and where they sit. emda’s officers, and indeed all the other public sector employees in the region are being asked to deliver policies that provide beneficial change for their communities. If we move the scale up another notch then the same is true of National civil servants, up again and we are at the scale of the European community, up one more and we have reached a global scale. The argument of political leaders is that in a global economy we have only one scale, the global one, and within this any protectionism is bad. However at the same time America is subsidising its car industry, the UK our financial industry, China its currency. Fiscal stimulation is not directed at our competitor economies but at our own. If we look at the question in this way we can see that localisation is not a straightforward issue. By the same token if we look at some of the methodologies, for example SROI, this attempts to monetize a social cost or benefit (as does incidentally the ‘Regional Index of Sustainable Economic Wellbeing’). It does so not on the basis of value to the country or globe but on the value to region. It is interesting to note that although some of the models examined are capable of factoring in displacement this aspect does not figure in the regional growth models (or at least not explicitly). So in this sense the region is competing against other regions for national resource and it follows at least some of the growth will come at the cost of other less successful regions. Finally it is self evident that in European grant terms there is direct competition between regions and sub regions for regeneration funding where ironically the case
[email protected] ‐ 75 ‐ tel:07811160822
is often made on the basis of how poorly an area is performing. All of these represent competitive forces that are structured into the institutions that distribute public wealth. However while all of this remains true and while we hope that this demonstrates that there are many occasions where a local improvement can be a perfectly valid outcome, for example reducing local unemployment; this is quite different from using a methodology that skews outcomes in favour of localisation as integral part of its mechanism. In the discussion of LM3 we explained how a contract that is let outside the region could bring more benefit than one that is let inside. The reason for this is that net economic benefit (to the region) is objectively calculated is used. The calculation mechanism itself is blind. By this we mean that nothing that is contained within the model will weight the result in favour of a locality. This is a key point and one that needs to be embedded within all measurement of regional and local activity. In section 2 of the brief we discuss the measures that might be used as a standard set of KPIs, an intrinsic element of these is the independence of the measures. The important thing to understand here is that localisation can be a desirable outcome, or a self sufficient economy may or may not be a good thing. These are not questions of impact methodologies they are policy or political issues (Protectionism versus Laissez Faire). However the methodologies and the tools that we use to examine these policies and their impacts need to be objective. Thus if we want to know if a self contained economy is a good one we need to measure it. If the tool shows that total wealth and maybe social factors are ‘better’ then we can draw this conclusion. If they score such an economy lower on the same factors then it can be said not to be better in terms of the policy objectives, and only the policy objectives.

APPENDIX 3 LETTER TO SUPPLIERS
Dear Mr A Sample Supplier Questionnaire Adam Wilkinson and Associates have been commissioned by emda to undertake a study designed to understand the impact of emda’s procurement practice and the extent to which procurement is contributing towards the agency’s vision of improving prosperity and productivity in the East Midlands. The team has already undertaken a critical review of different approaches to measure the impact of our procurement and has designed a series of SMART key performance indicators (KPIs). The team is now seeking to test these KPIs with some key suppliers. The team will contact you within the next few days, so that we can conduct a short telephone interview. I would be grateful if you could answer a few questions to help us with this work. The questions are attached on the accompanying sheet for your information but there is no need for you to take further action until we telephone you. The information that you provide will be treated in confidence and will contribute to improving our approach to procurement. If you would like to contact us directly with regard to the interview please contact Bryan Latty on 0845 6435371 or if you would like to speak to the project director at emda please contact Helen Bell on 0115 9888393. Yours sincerely Helen Bell Economic Renewal Advisor enc: supplier questionnaire
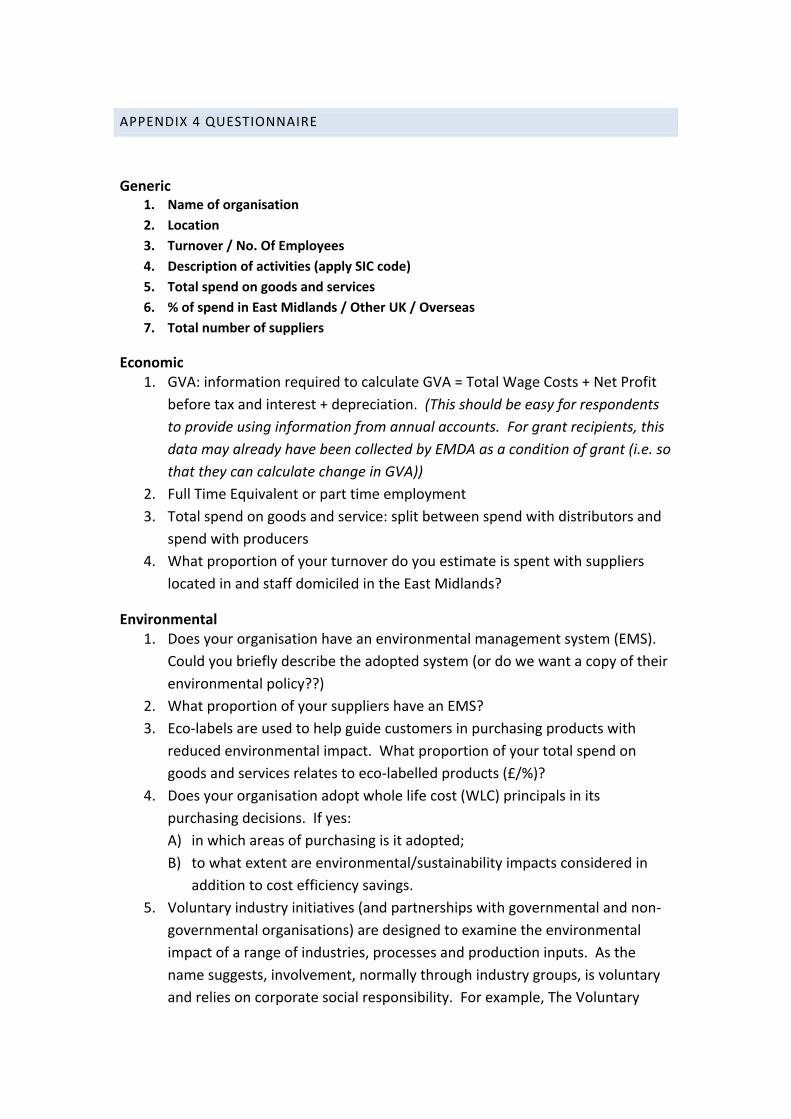
APPENDIX 4 QUESTIONNAIRE
Generic
1. Name of organisation 2. Location 3. Turnover / No. Of Employees 4. Description of activities (apply SIC code) 5. Total spend on goods and services 6. % of spend in East Midlands / Other UK / Overseas 7. Total number of suppliers
Economic 1. GVA: information required to calculate GVA = Total Wage Costs + Net Profit
before tax and interest + depreciation. (This should be easy for respondents to provide using information from annual accounts. For grant recipients, this data may already have been collected by EMDA as a condition of grant (i.e. so that they can calculate change in GVA))
2. Full Time Equivalent or part time employment 3. Total spend on goods and service: split between spend with distributors and
spend with producers 4. What proportion of your turnover do you estimate is spent with suppliers
located in and staff domiciled in the East Midlands?
Environmental 1. Does your organisation have an environmental management system (EMS).
Could you briefly describe the adopted system (or do we want a copy of their environmental policy??)
2. What proportion of your suppliers have an EMS? 3. Eco‐labels are used to help guide customers in purchasing products with
reduced environmental impact. What proportion of your total spend on goods and services relates to eco‐labelled products (£/%)?
4. Does your organisation adopt whole life cost (WLC) principals in its purchasing decisions. If yes: A) in which areas of purchasing is it adopted; B) to what extent are environmental/sustainability impacts considered in
addition to cost efficiency savings. 5. Voluntary industry initiatives (and partnerships with governmental and non‐
governmental organisations) are designed to examine the environmental impact of a range of industries, processes and production inputs. As the name suggests, involvement, normally through industry groups, is voluntary and relies on corporate social responsibility. For example, The Voluntary
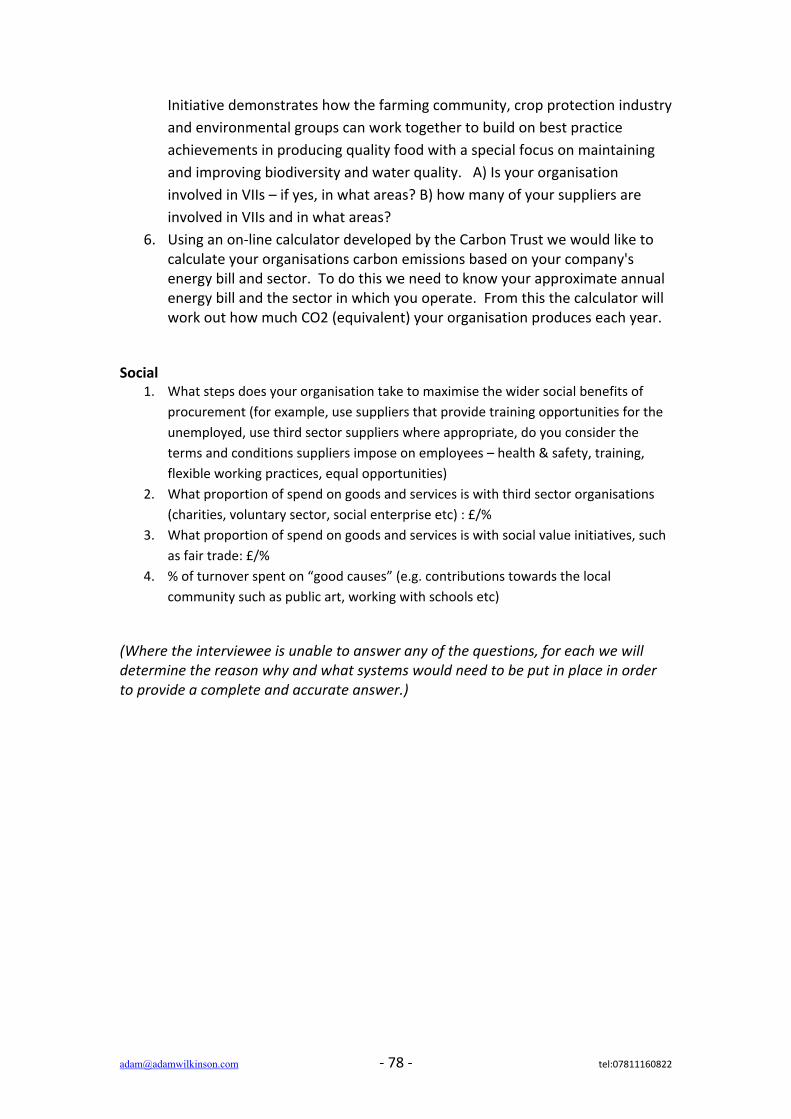
[email protected] ‐ 78 ‐ tel:07811160822
Initiative demonstrates how the farming community, crop protection industry and environmental groups can work together to build on best practice achievements in producing quality food with a special focus on maintaining and improving biodiversity and water quality. A) Is your organisation involved in VIIs – if yes, in what areas? B) how many of your suppliers are involved in VIIs and in what areas?
6. Using an on‐line calculator developed by the Carbon Trust we would like to calculate your organisations carbon emissions based on your company's energy bill and sector. To do this we need to know your approximate annual energy bill and the sector in which you operate. From this the calculator will work out how much CO2 (equivalent) your organisation produces each year.
Social 1. What steps does your organisation take to maximise the wider social benefits of
procurement (for example, use suppliers that provide training opportunities for the unemployed, use third sector suppliers where appropriate, do you consider the terms and conditions suppliers impose on employees – health & safety, training, flexible working practices, equal opportunities)
2. What proportion of spend on goods and services is with third sector organisations (charities, voluntary sector, social enterprise etc) : £/%
3. What proportion of spend on goods and services is with social value initiatives, such as fair trade: £/%
4. % of turnover spent on “good causes” (e.g. contributions towards the local community such as public art, working with schools etc)
(Where the interviewee is unable to answer any of the questions, for each we will determine the reason why and what systems would need to be put in place in order to provide a complete and accurate answer.)