measurement oftrans and other isomeric unsaturated fatty acids in butterand margarine
TRANSCRIPT
Measurement of trans and Other Acids in Butter and Margarine L.M. SMITH, W.L. DUNKLEY, A. FRANKE, and T. DAIRIKI , Department of Food Science and Technology, University of California, Davis, California 95616
Isomeric Unsaturated Fatty
ABSTRACT
A procedure is described for gas liquid chroma- tographic determinat ion of cis and trans isomers of unsaturated fat ty acids after fract ionation of the saturated, monenoic, dienoic, and polyenoic fat ty acid methyl esters by argentation thin layer chro- matography. To test its reliability, the procedure was used for quantitative measurement of trans- isomers of unsaturated fat ty acids in a known mixture of simple triglycerides containing saturated fat ty acids from 4:0 to 24:0 and cis and trans isomers of 14:1. 16:1, 18:1, and 18:2. Results of the analyses of five margarine and five but ter samples are presented, together with results of in- frared spect rophotometr ic analyses for trans fa t ty acid concentrations, ultraviolet spect rophotometr ic analyses for conjugated fa t ty acid concentrations, and enzymatic analyses for e i s -c i s -methy lene inter- rupted fat ty acid concentrations. The combined argentation thin layer and gas chromatographic procedure is suitable for determinat ion of the principal fa t ty acids in complex food lipids such as milk fat.
INTRODUCTION There is increasing interest in the biological uti l ization
and effects of trans and other isomeric unsaturated fat ty acids on human health (1). Fats from ruminants usually have small amounts of trans and conjugated acids (2). Many foods contain vegetable oils that have been partially hydro- genated, resulting in the formation of variable amounts of trans and conjugated isomers. Oxidat ion during processing or storage of foods may cause increases in the content of these constituents. The information presently required for nutri t ional labeling of foods does not include trans-, conju- gated, or mono-unsaturated fatty acid contents, but the regulations may be amended in the future to provide this knowledge for the consumer.
A need exists for simple improved methods to determine isomeric unsaturated fat ty acids in foods on a routine basis. Total isolated trans unsaturat ion can be est imated by infra- red spectroscopy, but this method gives no information concerning specific structures of individual fat ty acids. Ultraviolet spectroscopy can be used to determine conju- gated dienoic and trienoic double bonds but not double bond positions or carbon chain length. Gas liquid chroma- tography (GC) of fatty acid methyl esters is widely used to determine the major fat ty acids in biological materials. However, most GC systems using packed columns provide little or no separation of cis and trans isomers of the same carbon chain length and of isomers that differ only in the posit ion of double bonds. An automated glass capillary GC system has recently been developed by Jaeger et al. (3) which gives a greatly improved separation of complex mix- tures of fat ty acid methyl esters including cis-trans isomers. Unfortunately the method requires expensive, complicated equipment and a high degree of technical experience and skill.
The recent development of improved stat ionary phases, such as Apolar-10C (4), SP-2340 (5), and OV-275 (6), has
facilitated the separation on packed GC columns of cis and trans isomers of the same carbon chain lengthand number of double bonds. However, lipids of biological and nutri- tional interest may contain complex mixtures of saturated and unsaturated fat ty acids. At present, to resolve such mixtures it is necessary to combine GC with other tech- n i q u e s i n c l u d i n g thin layer chromatography (TLC). Conacher (7) has reviewed the methodology for the chro- matographic determinat ion of geometric and positional isomers in fats and oils.
In the present paper, we describe a packed column GC procedure to determine the fat ty acid composi t ion of but te r and margarine, including cis and trans unsaturated isomers, af ter preseparation into saturated, monoenoic, dienoic, and polyenoic methyl esters by argentation TLC. The procedure was devised pr imari ly for the quantitative analysis of dairy and other foods whose lipids contain a wide variety of fatty acids including those of short chain lengths. Results obtained for the analysis of several mar- garine and but te r samples are compared with data obtained by infrared, ultraviolet, and enzymic analyses.
EXPERIMENTAL PROCEDURES
Materials Purified fat ty acid methyl esters and simple triglycerides
(Nu-Chek Prep, Elysian, MN) were used to prepare standard mixtures to assist in the identif icat ion and quantif ication of components found by the various analytical procedures. Solvents and other materials used were of reagent grade.
Five different brands of margarine, including both hard and soft types, were purchased locally. The five brands of but ter purchased were representative of but te r made in California and in the midwestern U.S.
Extraction of Lipids An extract ion method was employed which would be
applicable to most foods. A 2-g sample of margarine or but ter was weighed into a 100-ml Virtis Homogenizer jar, and 60 ml of chloroform-methanol (2: 1, v:v) was blended with the sample at high speed for 2 mix. The mixture was decanted through a filter (Whatman 2V) into a 250-ml separatory funnel. Another 60 ml of chloroform-methanol was added to the jar, b lended for 2 mix, and transferred to the filter. Then 30 ml of deionized water was added to the combined extracts in the separatory funnel. The mixture was shaken 60 sec and allowed to stand overnight in a refrigerator for phase separation. The lower phase was run into a 100-ml volumetric clask and made up to the mark with methanol . A 5-ml aliquot of the solution was evapo- rated, and the residue was weighed. A volume of the solu- tion calculated to contain 600 mg of lipid was measured into a 50-ml centrifuge tube and evaporated to dryness at 60 C with nitrogen. The lipid was dissolved in 15 ml of iso-octane, and the solution was stored under nitrogen at -20 C until analyzed.
GC of Butyl Esters
The major fa t ty acids of the extracted lipids were deter- mined by a procedure based on that of Parodi (8). Butyl
257
258 JOURNAL OF THE AMERICAN OIL CHEMISTS' SOCIETY VOL. 55
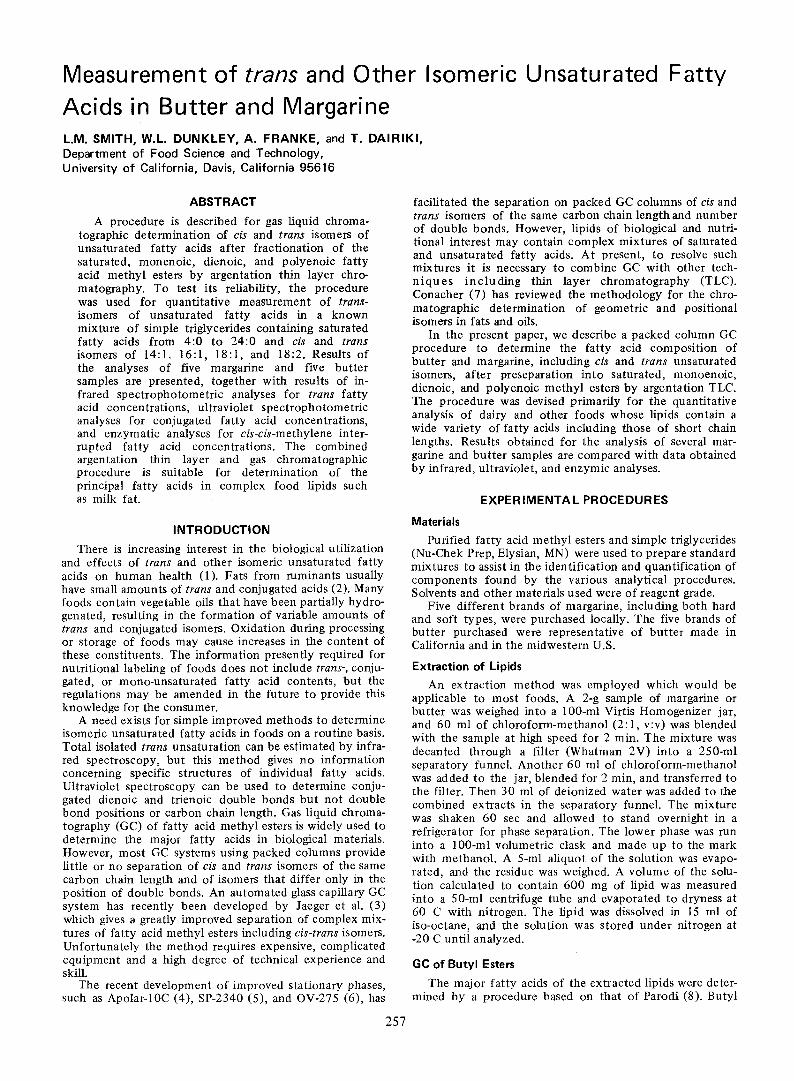
FIG. l. Separation by argentation thin layer chromatography of methyl esters from (1) butter, (2) mixture of simple triglycerides and (3) margarine. Fractions: S, saturated; M, monoenoic; D, dienoic and P, polyenoic. Conditions are described in the text.
6:0
18:0
.J
;18:1 cclS:Z
cl6:1 116:1
~8:3
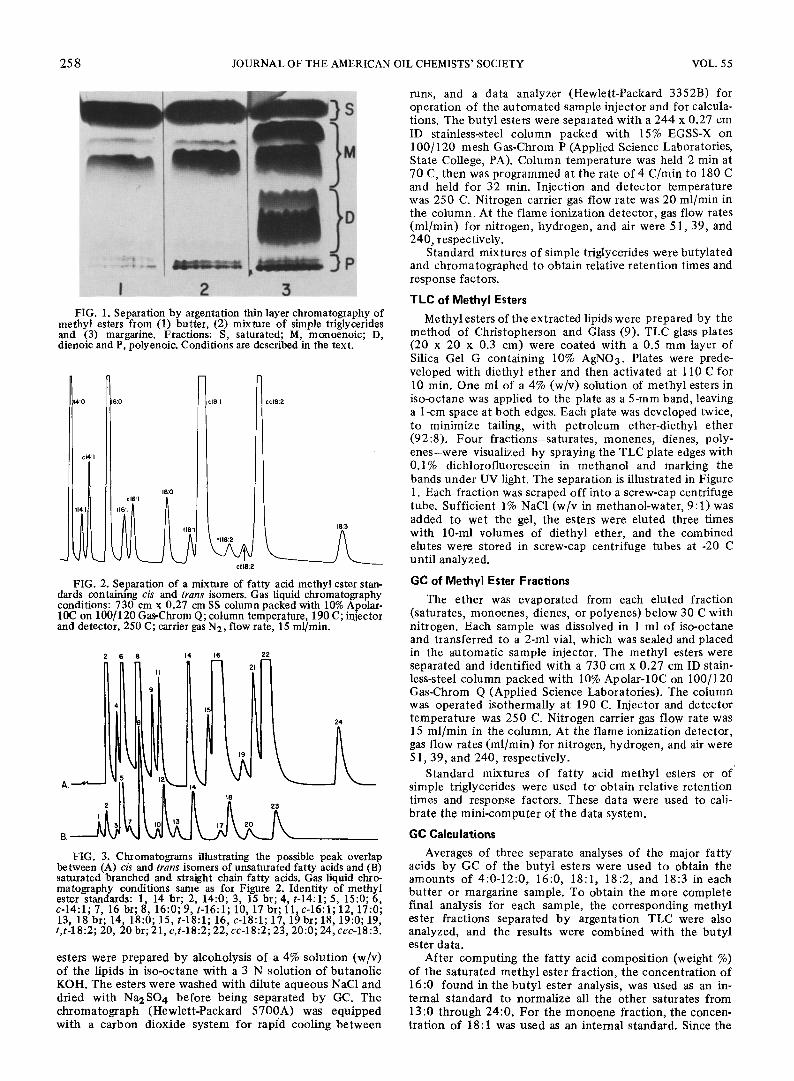
ct18:2 FIG. 2. Separation of a mixture of fatty acid methyl ester stan-
dards containing cis and trans isomers. Gas liquid chromatography conditions: 730 cm x 0.27 cm SS column packed with 10% Apolar- 10C on 100/120 Gas-Chrom Q; column temperature, 190 C; injector and detector, 250 C; carrier gas N2, flow rate, 15 ml/min.
2 6 8 14 16 22
911 2
4 I
A
B.
FIG. 3. Chxomatograms illustrating the possible peak overlap between (A) cis and trans isomers of unsaturated fatty acids and (B) saturated branched and straight chain fatty acids. Gas liquid chro- matography conditions same as for Figure 2. Identity of methyl ester standards: 1, 14 br; 2, 14:0; 3, 15 br; 4, t-14:l; 5, 15:0; 6, c-14:1; 7, 16 br; 8, 16:0; 9, t-16:l; 10, 17 br; 11, c-16:1; 12, 17:0; 13, 18 br; 14, 18:0; 15, t-18:l; 16, c-18:1; 17, 19 br; 18, 19:0; 19, t , t -18:2; 20, 20 br; 21, c,t-18:2; 22, cc-18:2; 23, 20:0; 24, ccc-18:3.
esters were prepared by alcoholysis of a 4% solut ion (w/v) of the lipids in iso-octane with a 3 N solution of butanolic KOH. The esters were washed with dilute aqueous NaC1 and dried with Na2SO 4 before being separated by GC. The chromatograph (Hewlett-Packard 5700A) was equipped with a carbon dioxide system for rapid cooling between
runs, and a data analyzer (Hewlett-Packard 3352B) for operat ion of the automated sample injector and for calcula- tions. The bu ty l esters were separated with a 244 x 0.27 cm ID stainless-steel column packed with 15% EGSS-X on 100/120 mesh Gas-Chrom P (Applied Science Laboratories, State College, PA). Column temperature was held 2 min at 70 C, then was programmed at the rate of 4 C/rain to 180 C and held for 32 rain. Injection and detector temperature was 250 C. Nitrogen carrier gas flow rate was 20 ml/min in the column~ At the flame ionizat ion detector , gas flow rates (ml/min) for nitrogen, hydrogen, and air were 51, 39, and 240, respectively.
Standard mixtures of simple triglycerides were butyla ted and chromatographed to obtain relative re tent ion times and response factors.
TLC of Methyl Esters
Methyl esters of the extracted lipids were prepared by the method of Christopherson and Glass (9). TLC glass plates (20 x 20 x 0.3 cm) were coated with a 0.5 mm layer of Silica Gel G containing 10% AgNO 3. Plates were prede- veloped with diethyl ether and then activated at 110 C for 10 mino One ml of a 4% (w/v) solution of methyl esters in iso-octane was applied to the plate as a 5-mm band, leaving a 1-cm space at both edges. Each plate was developed twice, to minimize tailing, with petroleum ether-diethyl ether (92:8). Four f rac t ions-sa tura tes , monenes, dienes, poly- enes -were visualized by spraying the TLC plate edges with 0.1% dichlorofluorescein in methanol and marking the bands under UV light. The separation is i l lustrated in Figure 1. Each fraction was scraped off into a screw-cap centrifuge tube. Sufficient 1% NaC1 (w/v in methanol-water, 9:1) was added to wet the gel, the esters were eluted three times with 10-ml volumes of diethyl ether, and the combined elutes were stored in screw-cap centrifuge tubes at -20 C until analyzed.
GC of Methyl Ester Fractions
The ether was evaporated from each eluted fraction (saturates, monoenes, dienes, or polyenes) below 30 C with nitrogen. Each sample was dissolved in 1 ml of iso-octane and transferred to a 2-ml vial, which was sealed and placed in the automatic sample injector. The methyl esters were separated and identified with a 730 cm x 0.27 cm ID stain- less-steel column packed with 10% Apolar-10C on 100/120 Gas-Chrom Q (Applied Science Laboratories). The column was operated isothermally at 190 C. Injector and detector temperature was 250 C. Nitrogen carrier gas flow rate was 15 ml/min in the column. At the flame ionization detector, gas flow rates (ml/min) for nitrogen, hydrogen, and air were 51, 39, and 240, respectively.
Standard mixtures of fat ty acid methyl esters or o f simple triglycerides were used to- obtain relative retention times and response factors. These data were used to cali- brate the mini-computer of the data system.
GC Calculations Averages of three separate analyses of the major fa t ty
acids by GC of the bu ty l esters were used to obtain the amounts of 4:0-12:0, 16:0, 18:1, 18:2, and 18:3 in each but ter or margarine sample. To obtain the more complete final analysis for each sample, the corresponding methyl ester fractions separated b y argentation TLC were also analyzed, and the results were combined with the bu ty l ester data.
After computing the fa t ty acid composi t ion (weight %) of the saturated methyl ester fraction, the concentration of 16:0 found in the bu ty l ester analysis, was used as an in- ternal s tandard to normalize all the other saturates from 13:0 through 24:0. For the monoene fraction, the concen- trat ion of 18:1 was used as an internal standard. Since the
FEBRUARY, 1978 S M ITH E T AL: M E A S U R E M E N T O F teens BY T L C A N D GC 259
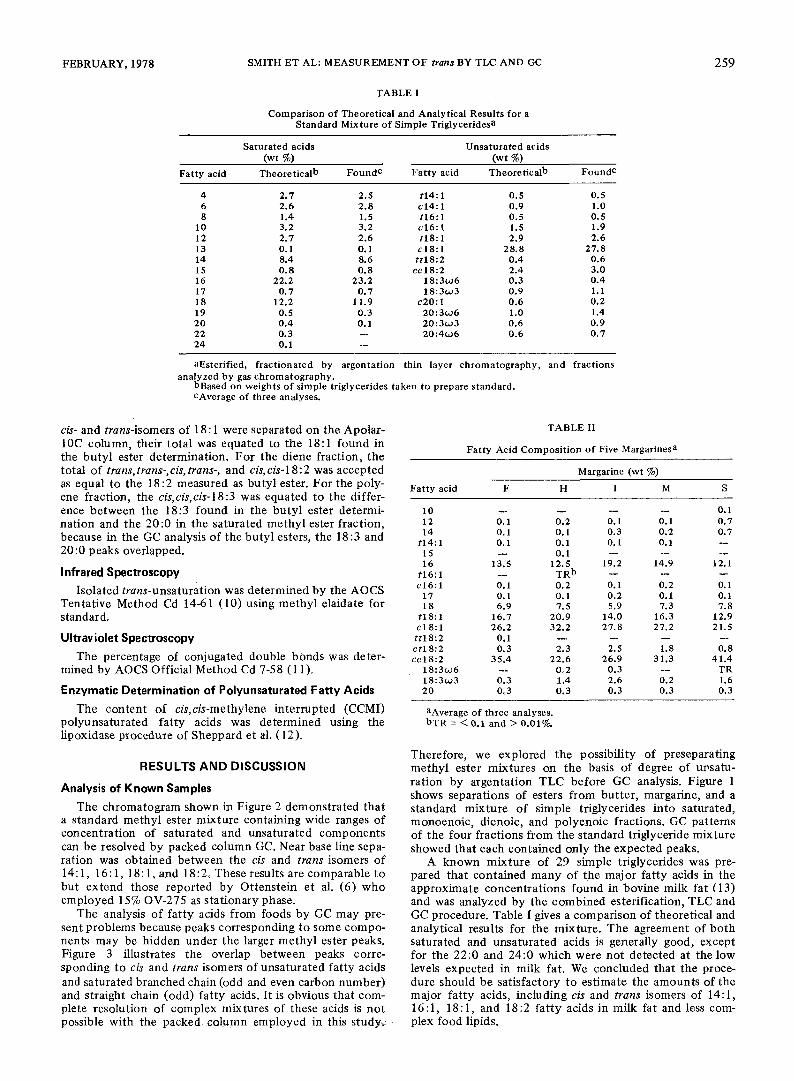
T A B L E I
C o m p a r i s o n o f Th eo re t i c a l and Ana ly t i ca l Resul ts for a S t anda rd Mix tu re o f S imple Triglycerides a
Saturated acids Unsaturated acids (wt %) (wt %)
Fatty acid The o re t i c a l b F o u n d c F a t t y acid T h e o r e t i c a l b F o u n d c
4 2 .7 2.5 t 1 4 : l 0.5 0.5 6 2.6 2 .8 c14 :1 0.9 1.0 8 1.4 1.5 t 1 6 : l 0 .5 0.5
10 3.2 3.2 c16 :1 1.5 1.9 12 2.7 2.6 t18:1 2.9 2.6 13 0.1 0.1 c18 :1 28 .8 27 .8 14 8.4 8.6 t t 1 8 : 2 0.4 0.6 15 0 .8 0 .8 c c 1 8 : 2 2.4 3.0 16 22.2 23 .2 18 :3 to6 0.3 0.4 17 0.7 0 .7 1 8 : 3 w 3 0.9 1.1 18 12.2 11.9 c 2 0 : I 0 .6 0.2 19 0.5 0.3 20 :3 (o6 1.0 1.4 20 0.4 0.1 2 0 :3 to 3 0.6 0.9 22 0.3 --- 2 0 : 4 t o 6 0.6 0.7 24 0.1 - -
aEster i f ied , f r a c t i o n a t e d by a r g e n t a t i o n thin layer c h r o m a t o g r a p h y , a n d f rac t ions ana lyzed by gas c h r o m a t o g r a p h y .
19] Based on we igh t s o f s imple t r ig lycer ides t aken to p repa re s t an d a rd . CAverage o f three analyses .
cis- and trans-isomers of 18:1 were separated on the Apolar- 10C column, their total was equated to the 18:1 found in the butyl ester determination. For the diene fraction, the total of trans, trans-,cis, trans-, and cis, cis-18:2 was accepted as equal to the 18:2 measured as butyl ester. For the poly- F H I M erie fraction, the cis, cis, cis-18:3 was equated to the differ- ence between the 18:3 found in the butyl ester determi- 10 . . . . . nation and the 20:0 in the saturated methyl ester fraction, 12 0.1 0.2 0.1 because in the GC analysis of the butyl esters, the 18:3 and 14 0.1 o. 1 0.3
t 1 4 : l 0.1 0.1 0.1 20:0 peaks overlapped. 15 -- o.1 --
16 13.5 12.5 19.2 Infrared Spectroscopy t 1 6 : l - - T R b - -
I s o l a t e d trans-unsaturation was determined by the AOCS c 16:1 o. 1 0.2 o. 1 17 0.1 0.1 0.2
Tentative Method Cd 14-61 (10) using methyl elaidate for t8 6.9 7~ 5.9 standard~ t l 8:1 16.7 20 .9 14.0
c18 :1 26 .2 32 .2 27 .8 Ultraviolet Spectroscopy t t 1 8 : 2 0.1 - - - -
c t 1 8 : 2 0~ 2.3 2.5 The percentage of conjugated double bonds was deter- cc18:2 35.4 22.6 26.9
mined by AOCS Official Method Cd 7-58 (11)o 18:36o6 - - 0~ 0.3 18:3 to3 0.3 1.4 2.6
Enzymatic Determination of Polyunsaturated Fatty Acids 20 0.3 0.3 0.3
The content of cis, cis-methylene interrupted (CCMI) polyunsaturated fatty acids was determined using the lipoxidase procedure of Sheppard et el. (12).
RESULTS AND DISCUSSION
Analysis of Known Samples The chromatogram shown in Figure 2 demonstrated that
a standard methyl ester mixture containing wide ranges of concentration of saturated and unsaturated components can be resolved by packed column GC. Near base line sepa- ration was obtained between the cis and trans isomers of 14:1, 16:1, 18:1, and 18:2o These results are comparable to but extend those reported by Ottenstein et el. (6) who employed 15% OV-275 as stationary phase.
The analysis of fatty acids from foods by GC may pre- sent problems because peaks corresponding to some compo- nents may be hidden under the larger methyl ester peaks. Figure 3 illustrates the overlap between peaks corre- sponding to cis and trans isomers of unsaturated fatty acids and saturated branched chain (odd and even carbon number) and straight chain (odd) fatty acids. It is obvious that com- plete resolution of complex mixtures of these acids is not possible with the packed column employed in this s tudy.
T A B L E II
Fa t t y Acid C o m p o s i t i o n o f Five Margar ines a
Fa t t y acid
Margar ine (wt %)
- - 0.1 0.1 0.7 0.2 0.7 0.1 - -
14.9 12.1
0.2 0.1 0.1 0.1 7.3 7.8
16.3 12.9 27.2 21.5
1.8 0.8 31.3 41 .4
- - TR 0.2 1.6 0.3 0.3
aAverage o f th ree analyses . b T R = < 0.1 an d > 0 .01%.
Therefore, we explored the possibility of preseparating methyl ester mixtures on the basis of degree of ursatu- ration by argentation TLC before GC analysis. Figure 1 shows separations of esters from butter, margarine, and a standard mixture of simple triglycerides into saturated, monoenoic, dienoic, and polyenoic fractions. GC patterns of the four fractions from the standard triglyceride mixture showed that each contained only the expected peaks.
A known mixture of 29 simple triglycerides was pre- pared that contained many of the major fatty acids in the approximate concentrations found in bovine milk fat (13) and was analyzed by the combined esterification, TLC and GC procedure. Table I gives a comparison of theoretical and analytical results for the mixture. The agreement of both saturated and unsaturated acids is generally good, except for the 22:0 and 24:0 which were not detected at the low levels expected in milk fat. We concluded that the proce- dure should be satisfactory to estimate the amounts of the major fatty acids, including cis and trans isomers of 14:1, 16:1, 18:1, and 18:2 fatty acids in milk fat and less com- plex food lipids.
260 JOURNAL OF THE AMERICAN OIL CHEMISTS' SOCIETY VOL. 55
TABLE III
Fatty Acid Composition of Five Buttersa
Butter (wt %)
Fatty acid A C D F L
4 4.1 4.2 4~ 4.1 4.0 6 2.6 2.7 2.6 2.6 2~ 8 1.5 1o6 1.5 1.5 1.4
10 3.3 3.2 3.2 3.2 3.0 12 3.4 3.4 3.3 3.3 3.2 13 0.1 0.1 0.1 0.1 0.1 14 br 0~ 0.2 0~ 0.2 0.2 14 10.6 10.6 10.3 10.4 10.3
t14: l . . . . 0.1 -- TR b c14:1 1.3 1.5 1.4 1.3 1.2
15 br 0.6 0.7 0.7 0.7 0~ 15 1o2 1.3 1.3 1.3 1.3 16 br 0.3 0.3 0.3 0~ 0.3 16 28.0 27.2 27.7 27.6 28.1
c16:1 2.4 2.6 2~ 2.4 2.4 17 br 0.6 0.6 0.6 0.6 0.6 17 0.8 0.7 0.8 0.8 0.7 18 br -- 0.1 0.1 -- 0.1 18 9.7 10.0 9.9 9.9 10.5
t l 8:1 1.8 1.8 1.8 1.8 1.8 c 18:1 22.0 22.1 22.2 22.2 22.5
ct18:2 -- 0.2 TR 0.2 0.2 cc18:2 4.1 3.7 4.2 4.1 4.1
18:3~o6 0.1 0.1 TR 0.1 0.1 18:3~o3 1.1 101 1o0 1.1 1.0 20 0.2 0.1 0.2 0.2 0.1
c20:1 . . . . . . . . 0.1 20:3to6 0.2 0.2 0.1 0.2 0.2 20:4to6 0.1 0.2 0.1 0.2 0.2
aAverage of three analyses. bTR = < 0.1 and > 0.01%.
Analyses of Margarine Samples
The f a t t y acid c o m p o s i t i o n of five b r a n d s of m a r g a r i n e was d e t e r m i n e d b y t he c o m b i n e d a r g e n t a t i o n T L C and GC p r o c e d u r e (Tab le II). T he margar ines c o n t a i n e d 34-53%
m o n o e n o i c , 25 -42% dienoic , and 0 .2-2 .9% t r i eno ic acids. T h e p r inc ipa l t rans acid was t-18 : 1 w h i c h var ied f rom 12.9 to 20.9%. These values are w i th in t he ranges r e p o r t e d b y o the r s ( 6 , 1 4 , 1 5 , 1 6 ) .
S e p a r a t i o n b y a r g e n t a t i o n T L C was clean, and GC chro- m a t o g r a m s s h o w e d on ly one level of u n s a t u r a t i o n in each o f t h e four f rac t ions . B r o a d e n i n g of the cis and t rans 18:1
peaks d i f fe red a m o u n g the samples , p r e s u m a b l y because o f d i f fe rences in c o n c e n t r a t i o n s of pos i t i ona l i somers r e l a t ed to h y d r o g e n a t i o n t r e a t m e n t s (17) .
Analyses of Butter Samples Tab le III gives the f a t t y acid analyses o f five b rands of
b u t t e r as d e t e r m i n e d b y the c o m b i n e d a r g e n t a t i o n TLC and GC procedure . T h e r e was l i t t le va r i a t ion a m o n g the samples , and t he average values for m o n e n o i c , d ienoic , and t r i eno ic acids were 27.8, 4 .1 , and 1.3%, respect ively~ T h e m o s t im- p o r t a n t t rans acid was t - 1 8 : l w h i c h averaged 1.8%. These values are m u c h lower t h a n for the margar ines . The overall c o m p o s i t i o n of the b u t t e r s was more c o m p l e x t h a n t h a t o f the margar ines because o f t h e p r e sence of shor t -cha in , b r a n c h e d - c h a i n , and o d d - c a r b o n n u m b e r sa tu ra t ed acids, and long-cha in p o l y u n s a t u r a t e d f a t t y acids.
S e p a r a t i o n b y a r g e n t a t i o n TLC was n o t as comple t e as for t he margar ines (Fig. 1). The GC c h r o m a t o g r a m s indi- ca ted t h a t smal l a m o u n t s of t rans m o n o e n e s m a y have b e e n i n c l u d e d w i th t he sa tura tes , of trans, t rans dienes w i th the m o n o e n e s , and of cis, cis dienes w i t h t he polyenes . These c o n t a m i n a n t s in t he f r ac t ions were d is regarded in calcu- l a t ing f a t t y acid compos i t i on~ B r o a d e n i n g o f the 18:1 peaks was less t h a n for the margar ines .
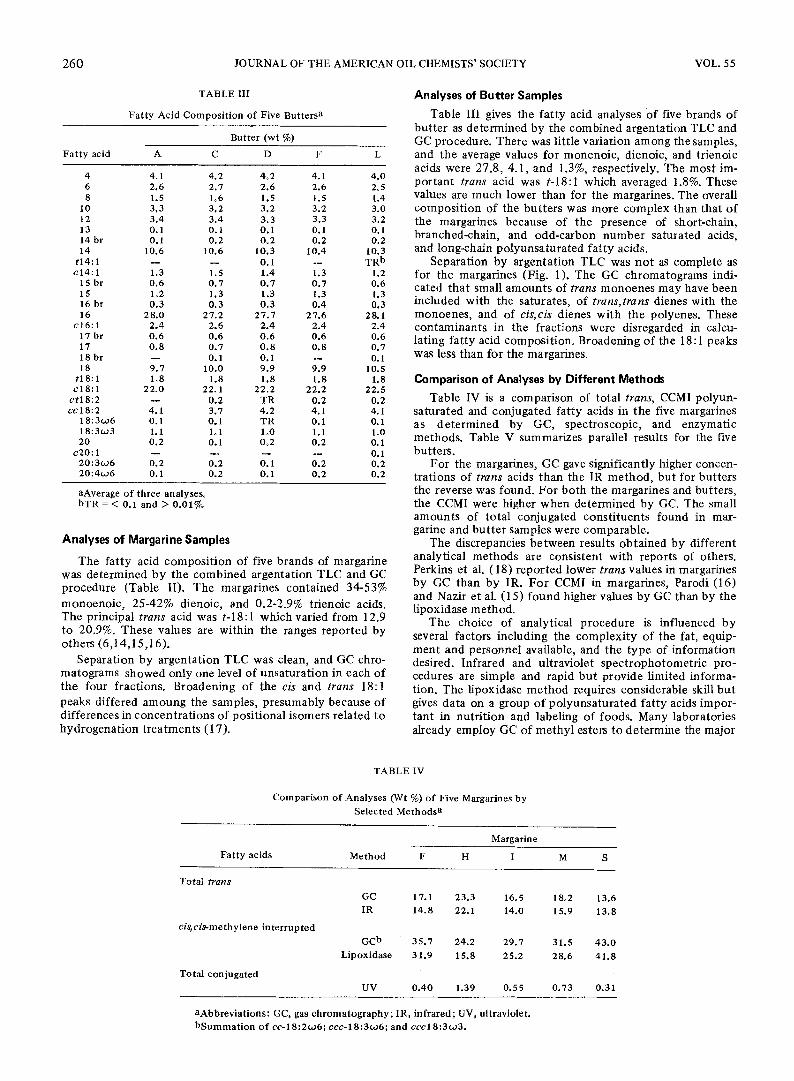
Comparison of Analyses by Different Methods Tab le IV is a c o m p a r i s o n of t o t a l t rans , CCMI po lyun -
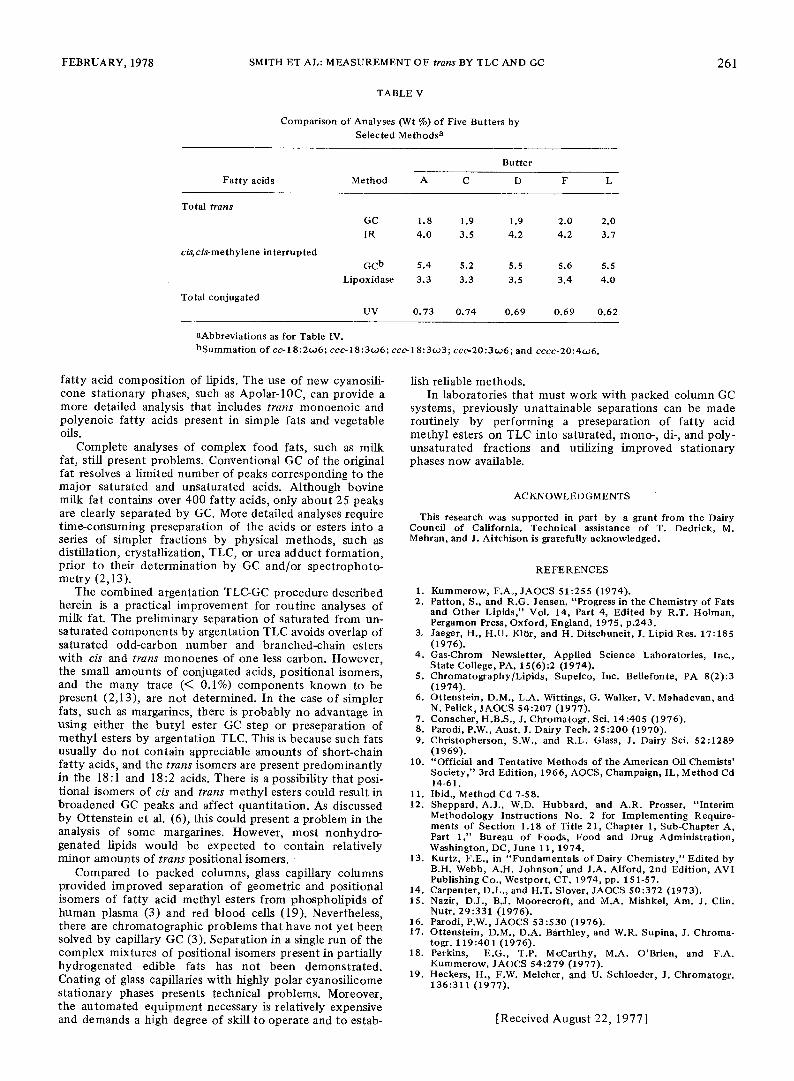
s a t u r a t e d and c o n j u g a t e d f a t t y acids in t h e five margar ines as d e t e r m i n e d b y GC, spec t roscop ic , and e n z y m a t i c m e t h o d s . Table V s u m m a r i z e s paral le l resul ts for the five bu t t e r s .
Fo r the margar ines , GC gave s ign i f i can t ly h igher concen- t r a t i o n s of t rans acids t h a n the IR m e t h o d , b u t for b u t t e r s t he reverse was f o u n d . F o r b o t h t he marga r ines and bu t t e r s , the CCMI were h igher w h e n d e t e r m i n e d b y GC. The smal l a m o u n t s of t o t a l c o n j u g a t e d c o n s t i t u e n t s found in mar- gar ine and b u t t e r samples were c o m p a r a b l e .
T h e d iscrepancies b e t w e e n resu l t s o b t a i n e d b y d i f fe ren t ana ly t i ca l m e t h o d s are cons i s t en t w i t h repor t s of o thers . Perkins et al. ( 18 ) r e p o r t e d lower t rans values in margar ines b y GC t h a n b y IR. F o r CCMI in margar ines , Parodi (16) and Nazi r e t al. (15) f o u n d h igher values b y GC t h a n b y the l ipox idase m e t h o d .
T h e choice of ana ly t i ca l p r o c e d u r e is in f luenced b y several factors i n c l u d i n g the c o m p l e x i t y of the fat , equip- m e n t and p e r s o n n e l available, and t he t y p e of i n f o r m a t i o n desired. I n f r a r ed and u l t r av io le t s p e c t r o p h o t o m e t r i c pro- cedures are s imple and rap id b u t p rov ide l imi ted i n fo rma- t ion . The l ipoxidase m e t h o d requires cons ide rab le skill b u t gives da ta on a g roup o f p o l y u n s a t u r a t e d f a t t y acids impor - t a n t in n u t r i t i o n and label ing of foods . Many labora to r ies a l ready e m p l o y GC o f m e t h y l esters to d e t e r m i n e the m a j o r
TABLE IV
Comparison of Analyses (Wt %) of Five Margarines by Selected Methodsa
Margarine
Fatty acids Method F H I M S
Total trans
cis, cis-methylene interrupted
Total conjugated
GC 17.1 23.3 16o5 18.2 13.6 IR 14.8 22.1 14.0 15.9 13.8
GC b 35.7 24.2 29.7 31.5 43.0 Lipoxidase 31.9 15.8 25.2 28.6 41.8
UV 0.40 1.39 0.55 0.73 0.31
aAbbreviations: GC, gas chromatography; IR, infrared; UV, ultraviolet. bSummation of cc-18:2to6; ccc-18:3to6; and cccl 8:3to3.
FEBRUARY, 1978 SMITH ET AL: MEASUREMENT O F trans BY TLC AND GC 261
TABLE V
Compar ison o f Analyses (Wt %) o f Five Butters by Selected Methods a
Butter
Fa t ty acids Method A C D F L
Total trans
cis, cis-methylene in te r rupted
Total conjugated
GC 1.8 1.9 1.9 2.0 2.0 IR 4.0 3.5 4.2 4.2 3.7
GC b 5.4 5.2 5.5 5.6 5.5 Lipoxidase 3.3 3.3 3.5 3.4 4.0
UV 0.73 0.74 0.69 0.69 0.62
aAbbreviat ions as for Table IV. bSummat ion o f cc-I 8:2to6; ccc-18:3co6; ccc-18:3to3; ccc-20:3to6; and cccc-20:4to6.
fa t ty acid composi t ion of lipids. The use of new cyanosilio cone stat ionary phases, such as Apolar-10C, can provide a more detailed analysis that includes t rans monoenoic and polyenoic fat ty acids present in simple fats and vegetable oils.
Complete analyses of complex food fats, such as milk fat, still present problems. Conventional GC of the original fat resolves a l imited number of peaks corresponding to the major saturated and unsaturated acids. Although bovine milk fat contains over 400 fat ty acids, only about 25 peaks are clearly separated by GC. More detailed analyses require t ime-consuming preseparat ion of the acids or esters in to a series of simpler fractions by physical methods, such as distillation, crystallization, TLC, or urea adduct formation, prior to their determinat ion by GC and/or spectrophoto- metry (2,13).
The combined argentation TLC-GC procedure described herein is a practical improvement for rout ine analyses of milk fat. The prel iminary separation of saturated from un- saturated components by argentation TLC avoids overlap of saturated odd-carbon number and branched-chain esters with cis and t rans monoenes of one less carbon. However, the small amounts of conjugated acids, posi t ional isomers, and the many trace (< 0.1%) components known to be present (2 , t3) , are not determined. In the case of simpler fats, such as margarines, there is probably no advantage in using either the bu ty l ester GC step or preseparat ion of methyl esters by argentation TLC. This is because such fats usually do not contain appreciable amounts of short-chain fat ty acids, and the t rans isomers are present predominant ly in the 18:1 and 18:2 acids. There is a possibi l i ty that posi- tional isomers of cis and t rans methyl esters could result in broadened GC peaks and affect quantitationo As discussed by Ottenstein et al. (6), this could present a problem in the analysis of some margarines. However, most nonhydro- genated lipids would be expected to contain relatively minor amounts of t rans posit ional isomers.
Compared to packed columns, glass capillary columns provided improved separation of geometric and posit ional isomers of fat ty acid methyl esters from phosphol ipids of human plasma (3) and red blood cells (19). Nevertheless, there are chromatographic problems that have not ye t been solved by capillary GC (3). Separation in a single run of the complex mixtures of posit ional isomers present in part ial ly hydrogenated edible fats has not been demonstrated. Coating of glass capillaries with highly polar cyanosil icome stat ionary phases presents technical problems. Moreover, the automated equipment necessary is relatively expensive and demands a high degree of skill to operate and to estab-
lish reliable methods. In laboratories that must work with packed column GC
systems, previously unat ta inable separations can be made routinely by performing a preseparation of fa t ty acid methyl esters on TLC into saturated, mono-, di-, and poly- unsaturated fractions and utilizing improved stat ionary phases now available.
ACKNOWLEDGMENTS
This research was suppor ted in part by a grant f rom the Dairy Council of California. Technical assistance of T. Dedrick, M. Mehran, and J. Ai tchison is gratefully acknowledged.
REFERENCES
1. Kummerow, F.Ao, JAOCS 51:255 (1974). 2; Pat ton, S., and R.G. Jensen, "Progress in the Chemis t ry of Fats
and Other Lipids ," Vol. 14, Part 4, Edited by R.T. Holman, Pergamon Press, Oxford , England, 19"/5, p.243.
3o Jaeger, H., H.U. Kl/3r, and H. Ditschunei t , J. Lipid Res. 17:185 (1976).
4o Gas-Chrom Newsletter , Applied Science Laboratories , Inc., State College, PA, 15(6):2 (19'74).
5. Chromatography/Lip ids , Supelco, Inc. Bellefonte, PA 8(2):3 (1974).
6. Ot tens te in , DoM., L.A. Wittings, G. Walker, V. Mehadevan, and N. Pelick, JAOCS 54:207 (1977).
7. Conacher , H.B.S., J. Chromatogr . Sci. 14:405 (1976). 8. Parodi, P.W., Aust . J. Dairy Tech. 25 :200 (1970). 9. Chr is topherson, S.W., and R.L. Glass, J. Dairy Sci. 52:1289
(1969). 10. "Official and Tentat ive Methods of the Amer ican Oil Chemis ts '
Socie ty ," 3rd Edition, 1966, AOCS, Champaign, IL, Method Cd 14-61.
11. Ibid., Method Cd 7-58. 12. Sheppard, A.J., W.D. Hubbard , and A.R. Prosser, " Inter im
Methodology Ins t ruct ions No. 2 for Implement ing Require- ments of Sect ion 1.18 of Title 21, Chapter 1, Sub-Chapter A, Part 1," Bureau o f Foods, Food and Drug Adminis t ra t ion , Washington, DC, June 11, 19'74.
13. Kurtz, F.E., in " F u n d a m e n t a l s o f Dairy Chemis t ry , " Edited by B.H. Webb, A.H. J o h n s o n , and J.A. Alford, 2nd Edit ion, AVI Publishing Co., Westport , CT, 1974, pp. 151-57.
14. Carpenter , D.L., and H.T. Slover, JAOCS 50:372 (1973). 15. Nazir, D.J., B.J. Moorecroft , and M.A. Mishkel, Am. J. Clin.
Nutr . 29:331 (1976). 16. Parodi, P.W.j JAOCS 53:530 (19"76). 17. Ot tens te in , D.M., D.A. Barthley, and W.R. Supina, J. Chroma-
togr. 119:401 (1976). 18. Perkins, E.G., T.P. McCarthy, M.A. O'Brien, and F.A.
Kummerow, JAOCS 54:279 (1977). 19. Heckers, H., F.W. Melcher, and U. Schloeder, J. Chromatogr .
136:311 (19"77).
[Received August 22, 1977]