measurement uncertainties
DESCRIPTION
Measurement Uncertainties. Physics 161 University Physics Lab I Fall 2010. Measurements. What do we do in this lab? Perfect Measurement Measurement Techniques Measuring Devices Measurement Range. Uncertainties. Types of Errors - PowerPoint PPT PresentationTRANSCRIPT

Measurement Uncertainties
Physics 161
University Physics Lab I
Fall 2010
Measurements
• What do we do in this lab?
• Perfect Measurement
• Measurement Techniques
• Measuring Devices
• Measurement Range

Uncertainties
• Types of Errors
• Random Uncertainties: result from the randomness of measuring instruments. They can be dealt with by making repeated measurements and averaging. One can calculate the standard deviation of the data to estimate the uncertainty.
• Systematic Uncertainties: result from a flaw or limitation in the instrument or measurement technique. Systematic uncertainties will always have the same sign. For example, if a meter stick is too short, it will always produce results that are too long.

Uncertainty
• Difference between uncertainty and error.
• Blunder is not an experimental error!
• Calibration
Mean and STD
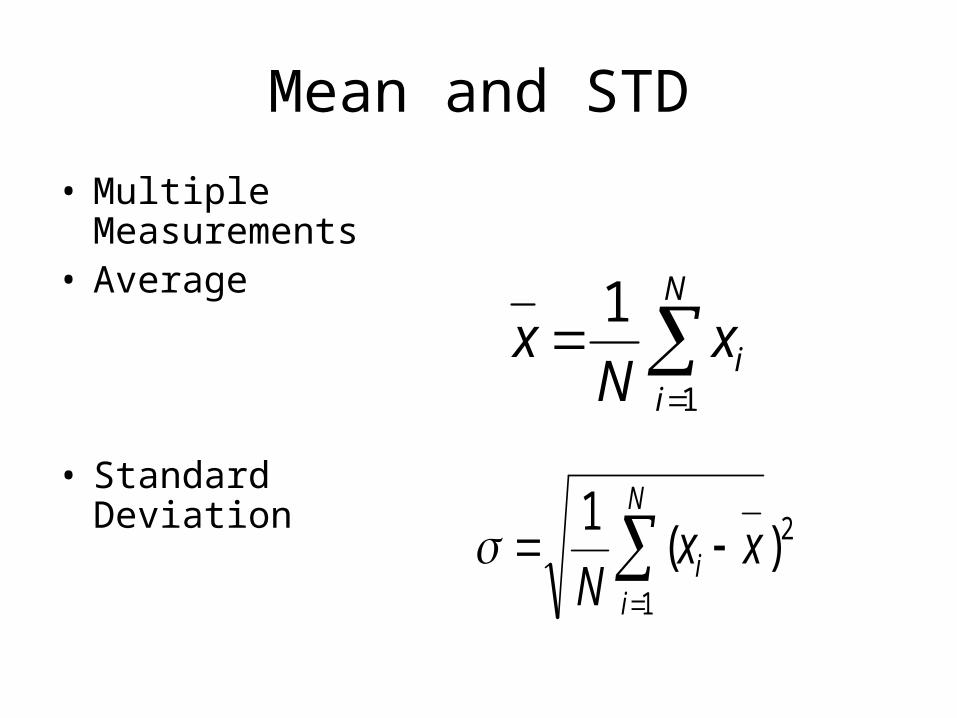
• Multiple Measurements
• Average
• Standard Deviation
N
iix
Nx
1
1
2
1
)(1
N
ii xx
N
Reporting a Value
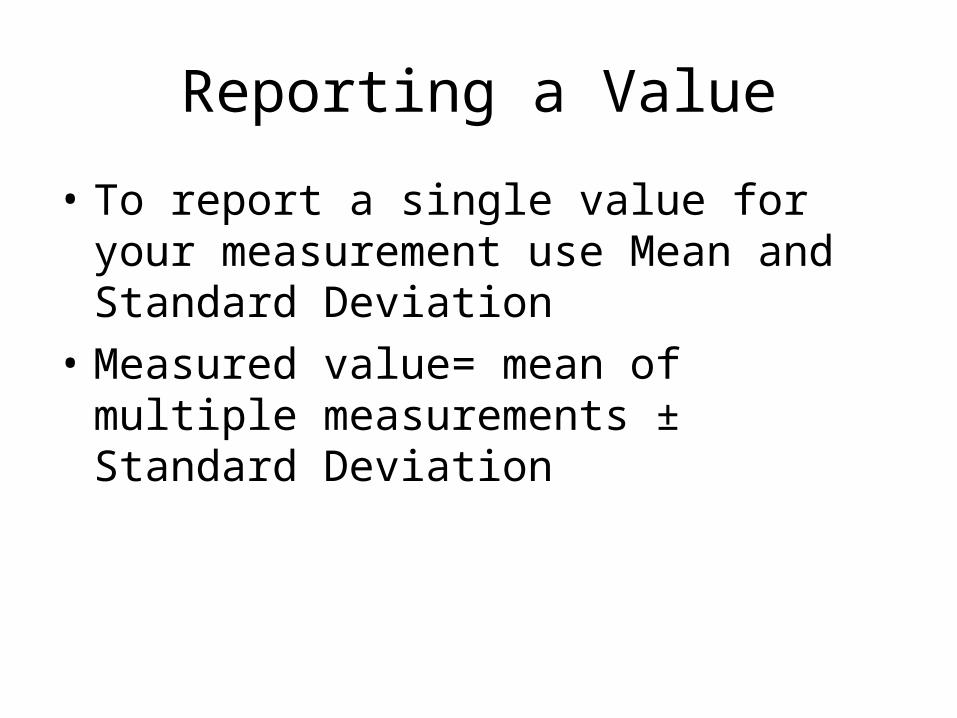
• To report a single value for your measurement use Mean and Standard Deviation
• Measured value= mean of multiple measurements ± Standard Deviation

Expressing Results in terms of the number of σ
•In this course we will use σ to represent the uncertainty in a measurement no matter how that uncertainty is determined
•You are expected to express agreement or disagreement between experiment and the accepted value in terms of a multiple of σ.
•For example if a laboratory measurement the acceleration due to gravity resulted in g = 9.2 ± 0.2 m / s2 you would say that the results differed by 3σ from the accepted value and this is a major disagreement
•To calculate Nσ
32.0
2.98.9exp
erimentalacceptedN
Example
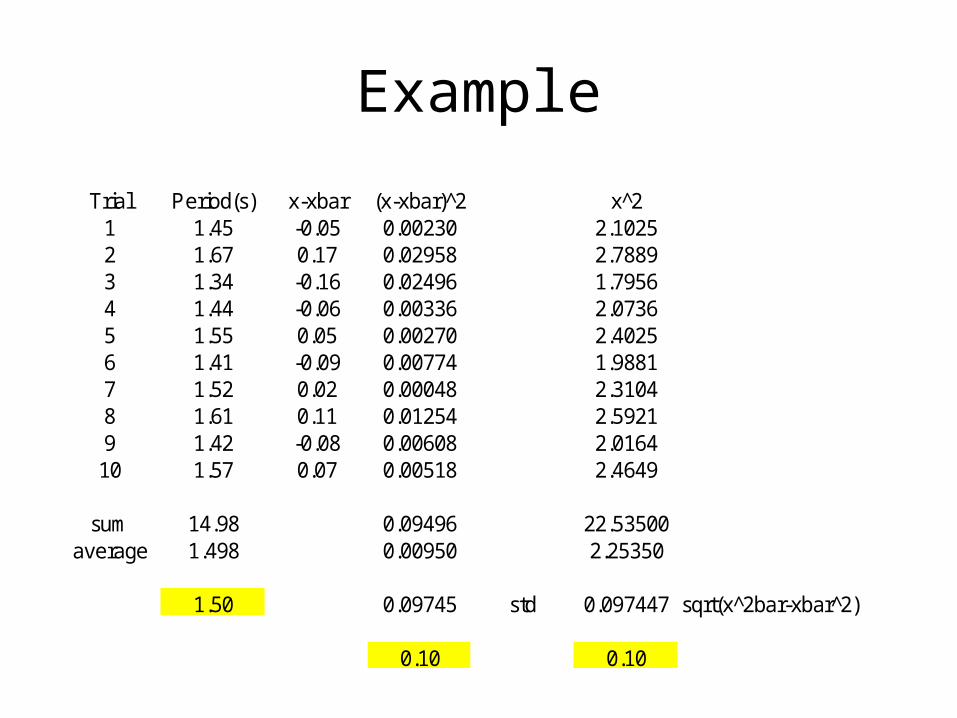
Trial Period(s) x-xbar (x-xbar)^2 x^21 1.45 -0.05 0.00230 2.10252 1.67 0.17 0.02958 2.78893 1.34 -0.16 0.02496 1.79564 1.44 -0.06 0.00336 2.07365 1.55 0.05 0.00270 2.40256 1.41 -0.09 0.00774 1.98817 1.52 0.02 0.00048 2.31048 1.61 0.11 0.01254 2.59219 1.42 -0.08 0.00608 2.016410 1.57 0.07 0.00518 2.4649
sum 14.98 0.09496 22.53500average 1.498 0.00950 2.25350
1.50 0.09745 std 0.097447 sqrt(x^2bar-xbar^2)
0.10 0.10
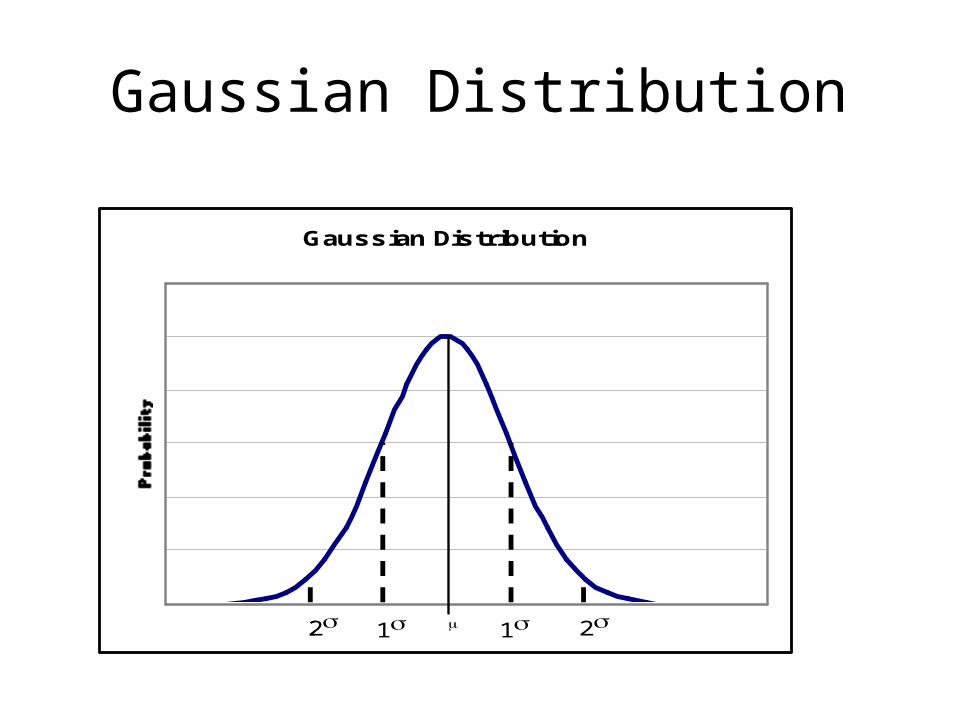
Gaussian Distribution
Gaussian Distribution
1 122 2
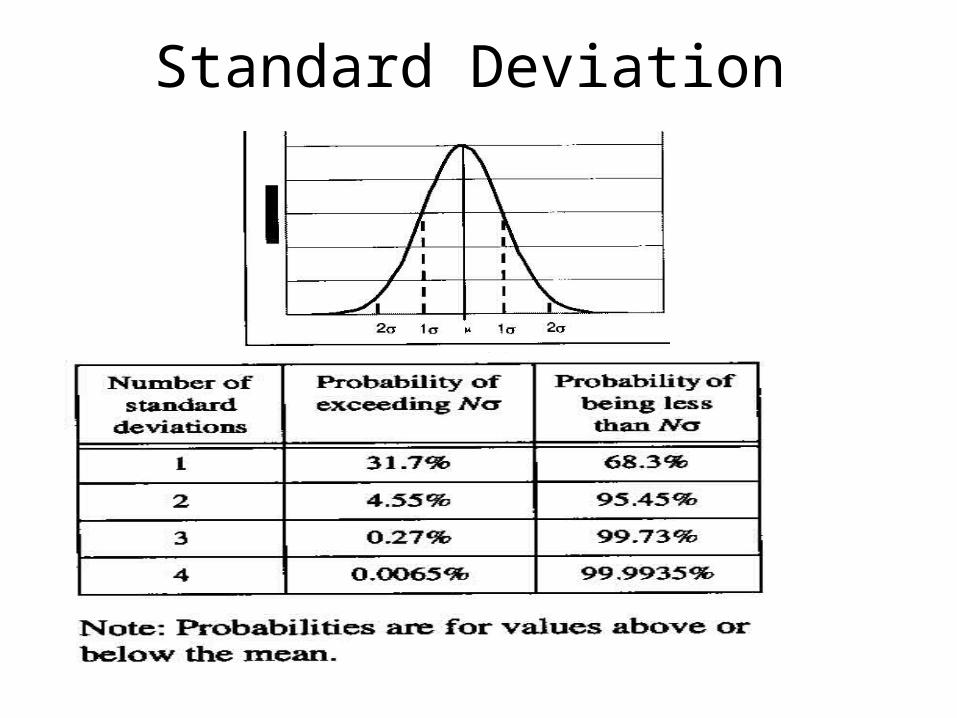
Standard Deviation

Accuracy vs. Precision
• Accurate: means correct. An accurate measurement correctly reflects the size of the thing being measured.
• Precise: repeatable, reliable, getting the same measurement each time. A measurement can be precise but not accurate.
Accuracy vs. Precision
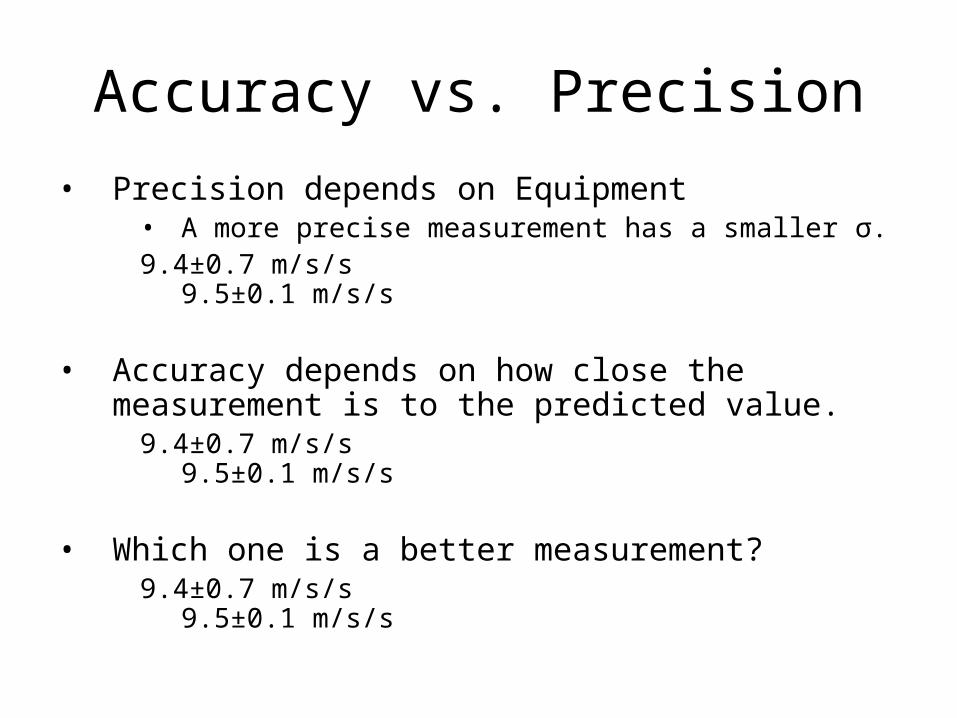
• Precision depends on Equipment• A more precise measurement has a smaller σ.9.4±0.7 m/s/s 9.5±0.1 m/s/s
• Accuracy depends on how close the measurement is to the predicted value.
9.4±0.7 m/s/s 9.5±0.1 m/s/s
• Which one is a better measurement?9.4±0.7 m/s/s 9.5±0.1 m/s/s

Comparison of Measurements
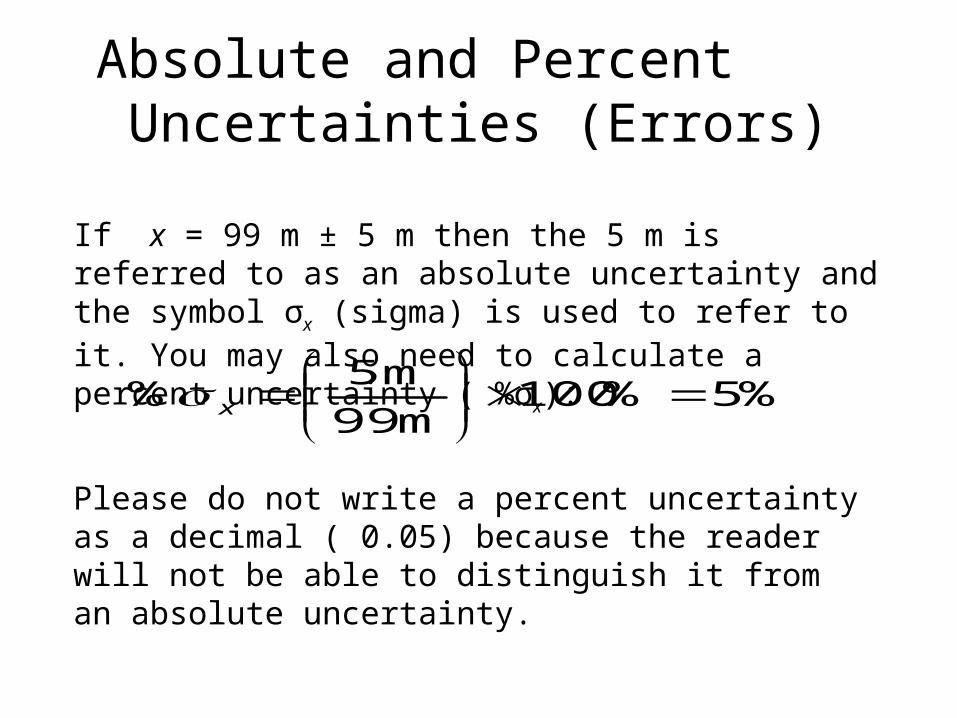
Absolute and Percent Uncertainties (Errors)
If x = 99 m ± 5 m then the 5 m is referred to as an absolute uncertainty and the symbol σx (sigma) is used to refer to it. You may also need to calculate a percent uncertainty ( %σx):
%5%100m99
m5%
x
Please do not write a percent uncertainty as a decimal ( 0.05) because the reader will not be able to distinguish it from an absolute uncertainty.
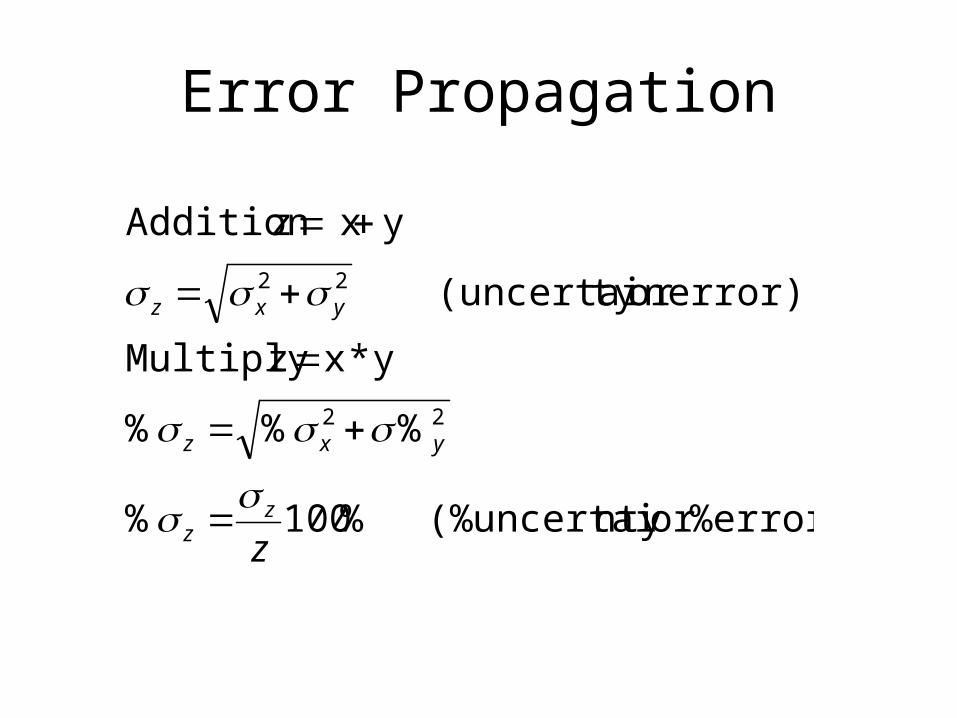
Error Propagation
%error)or nty (%uncertai %100%
%%%
y*xzMultiply
error)or ty (uncertain
y xzAddition
22
22
zz
z
yxz
yxz

Propagation of Uncertainties withaddition or Subtraction
22yxz
If z = x + y or z = x – y then the absolute uncertainty in z is given by
Example:
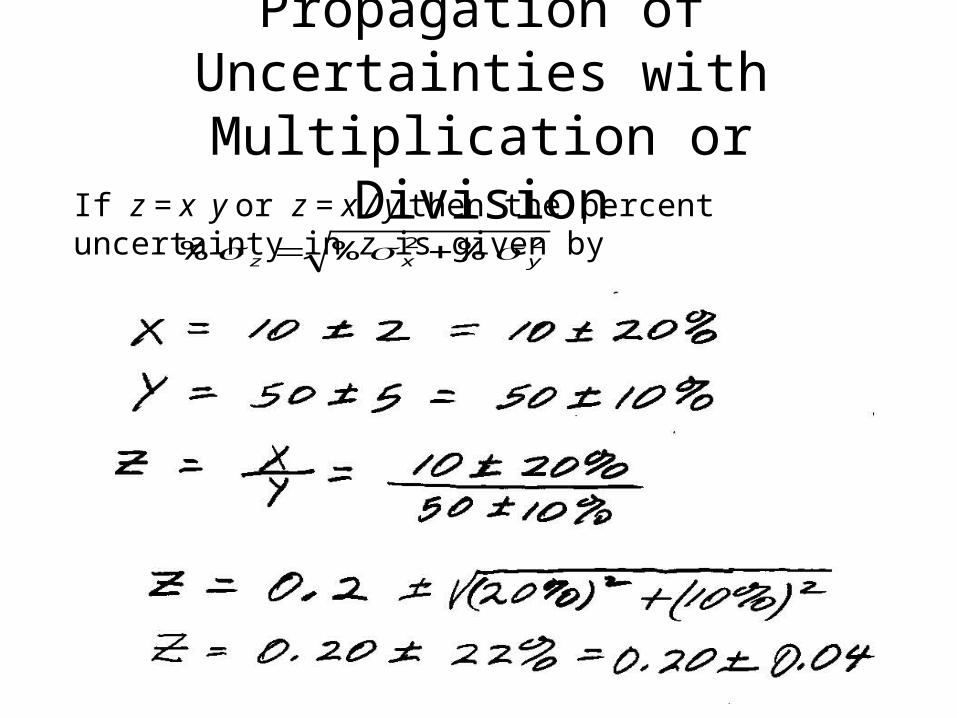
Propagation of Uncertainties withMultiplication or Division
22 %%% yxz
If z = x y or z = x / y then the percent uncertainty in z is given by
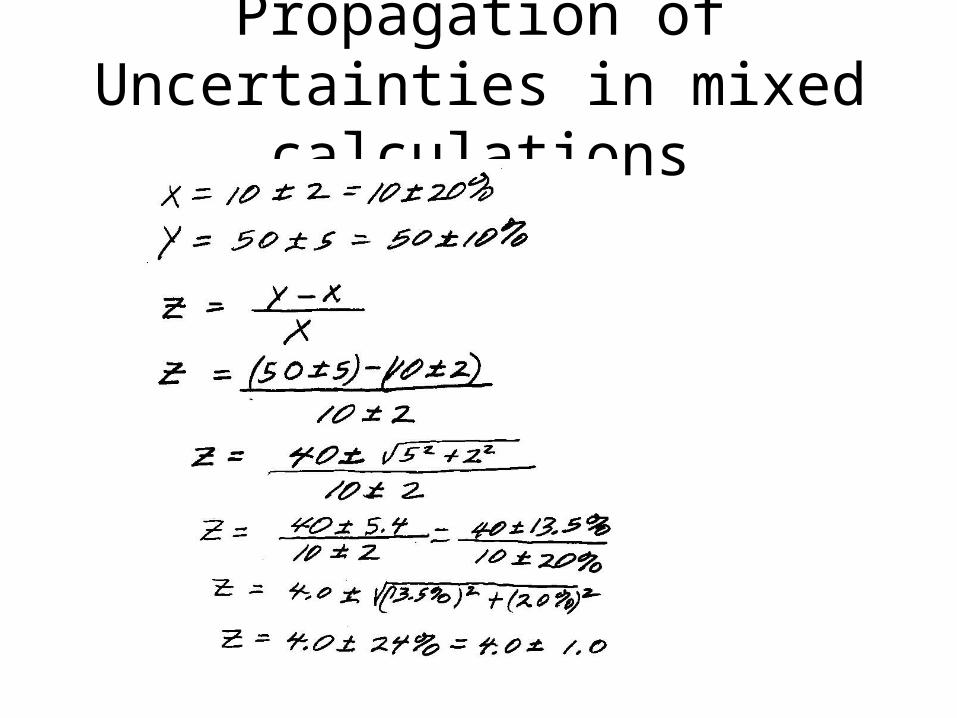
Propagation of Uncertainties in mixed calculations

Error Propagation
deviation. standard
same the have tsmeasuremen theall if only and if
...)/Ny(xz Rule Average
%2%
xz : rule Power 2
Nx
z
xz

Error Propagation
z
yx
xzyxz
Find
) and (i.e.y andfor x esuncertaiti Given the
),y(or let 2
1
2
33

Error Propagation
22
z
22w
22
33
%)%3()2/1(%
therefore,)%2/1(% handother the
on ,%)3%(% then ,%3%
sincebut ,%%% so
,
then,let also weIf . so ,u zlet
:rulespower andtion multiplica use We
yxz
u
yxux
ywu
wyu
xwyxu

Example
• Let x=4±.4 and y=9±.9 then
79.3100/)81.15(24100/%*
24)94(y)x(z since
%81.1510*%10*5.0%
%)10(%)10*3(5.0%
%)%3()2/1(%
5.030.53
22
22
zz
z
z
yxz
z
%10% and %10% ,9.0 ,4.0 so yxyx
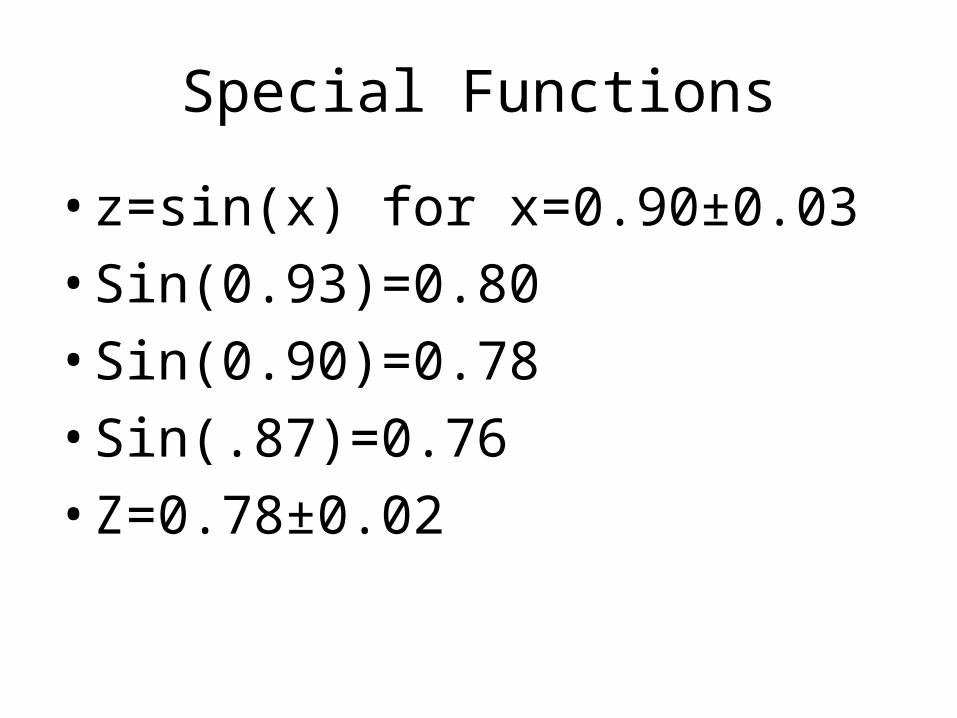
Special Functions
• z=sin(x) for x=0.90±0.03
• Sin(0.93)=0.80
• Sin(0.90)=0.78
• Sin(.87)=0.76
• Z=0.78±0.02
Least Square Fitting
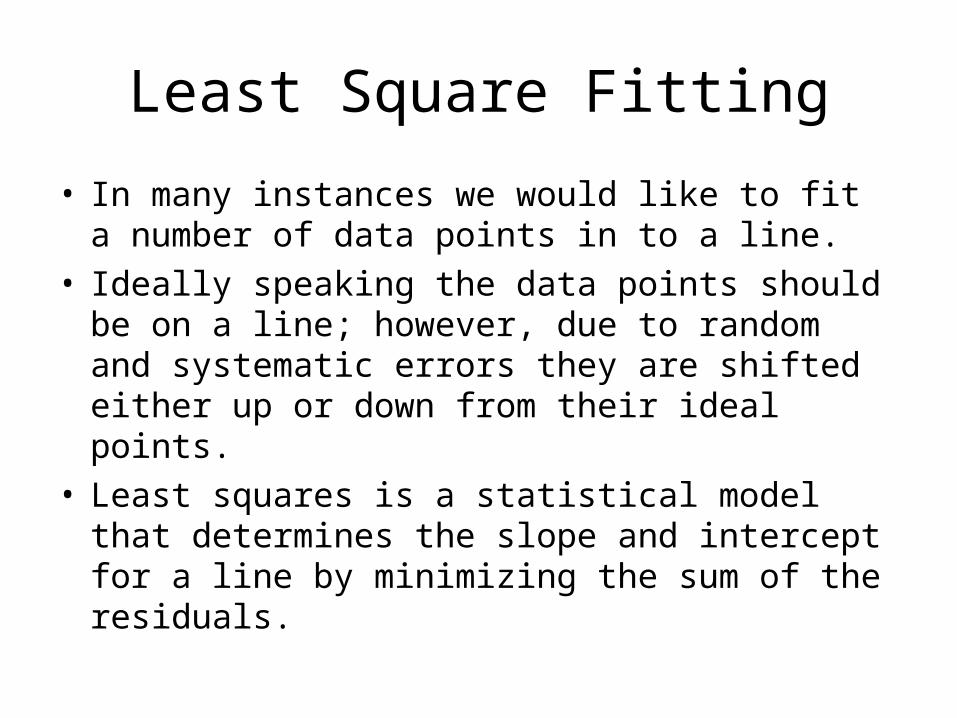
• In many instances we would like to fit a number of data points in to a line.
• Ideally speaking the data points should be on a line; however, due to random and systematic errors they are shifted either up or down from their ideal points.
• Least squares is a statistical model that determines the slope and intercept for a line by minimizing the sum of the residuals.

Least Squares
0
5
10
15
20
25
30
35
0 2 4 6 8 10
X
Y
Least Squares
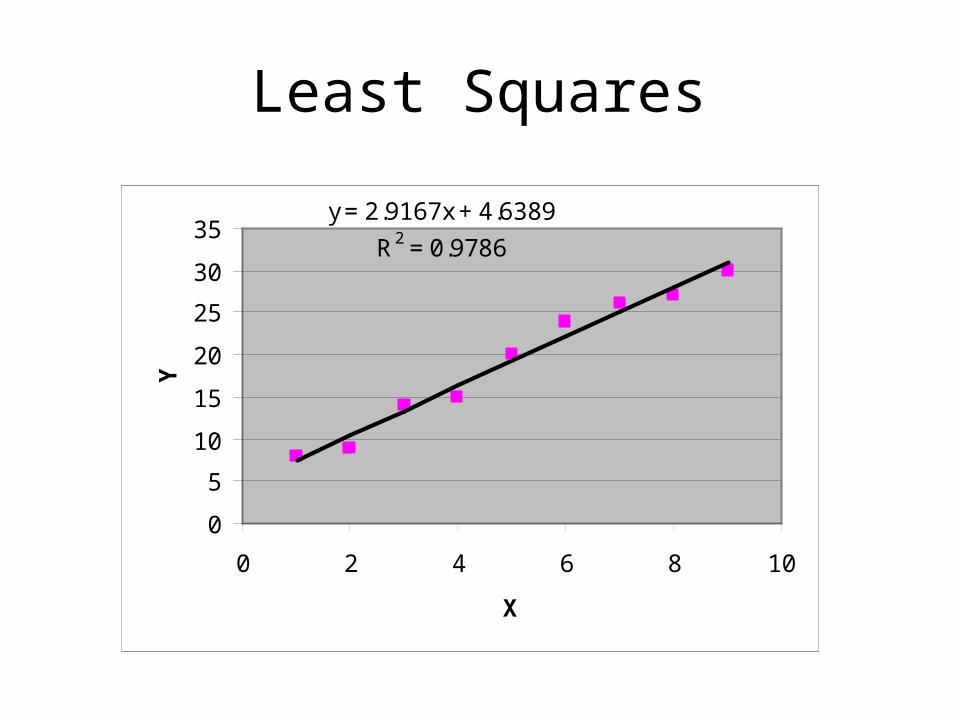
y = 2.9167x + 4.6389
R2 = 0.9786
0
5
10
15
20
25
30
35
0 2 4 6 8 10
X
Y

Least Squares
Slope
Intercept
k kk
jjk
j kkj
iii
xxxN
xyyxN
m 2
)(
j kkj
ii
i j i jjjiji
xxxN
yxxyx
b2
2 )(
Least Squares
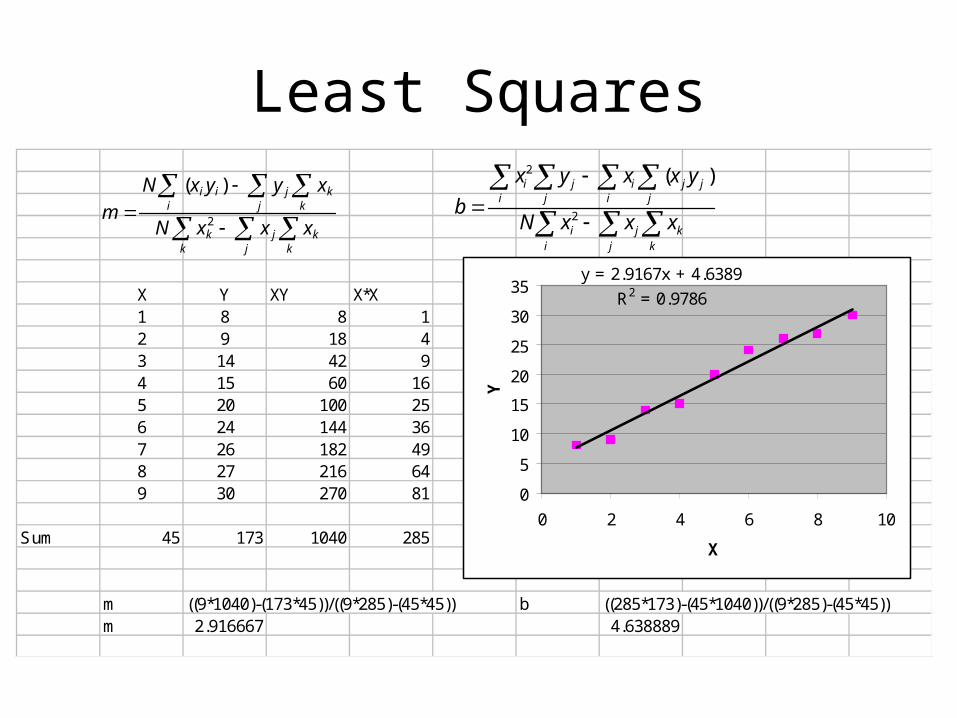
X Y XY X*X1 8 8 12 9 18 43 14 42 94 15 60 165 20 100 256 24 144 367 26 182 498 27 216 649 30 270 81
Sum 45 173 1040 285
m ((9*1040)-(173*45))/((9*285)-(45*45)) b ((285*173)-(45*1040))/((9*285)-(45*45))m 2.916667 4.638889
y = 2.9167x + 4.6389
R2 = 0.9786
0
5
10
15
20
25
30
35
0 2 4 6 8 10
X
Y
j kkj
ii
i j i jjjiji
xxxN
yxxyx
b2
2 )(
k kk
jjk
j kkj
iii
xxxN
xyyxN
m2
)(
Percent Difference
%100 valueaccepted
valuealexperiment- valueaccepteddiff%
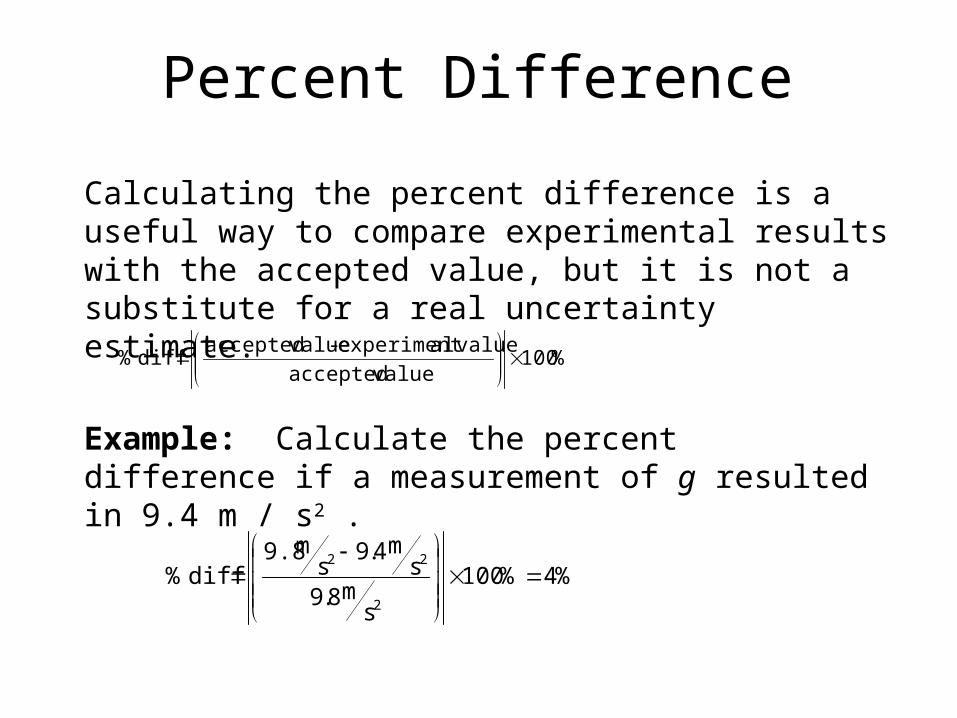
Calculating the percent difference is a useful way to compare experimental results with the accepted value, but it is not a substitute for a real uncertainty estimate.
%4%100
sm8.9
sm4.9
sm9.8
diff%2
22
Example: Calculate the percent difference if a measurement of g resulted in 9.4 m / s2 .
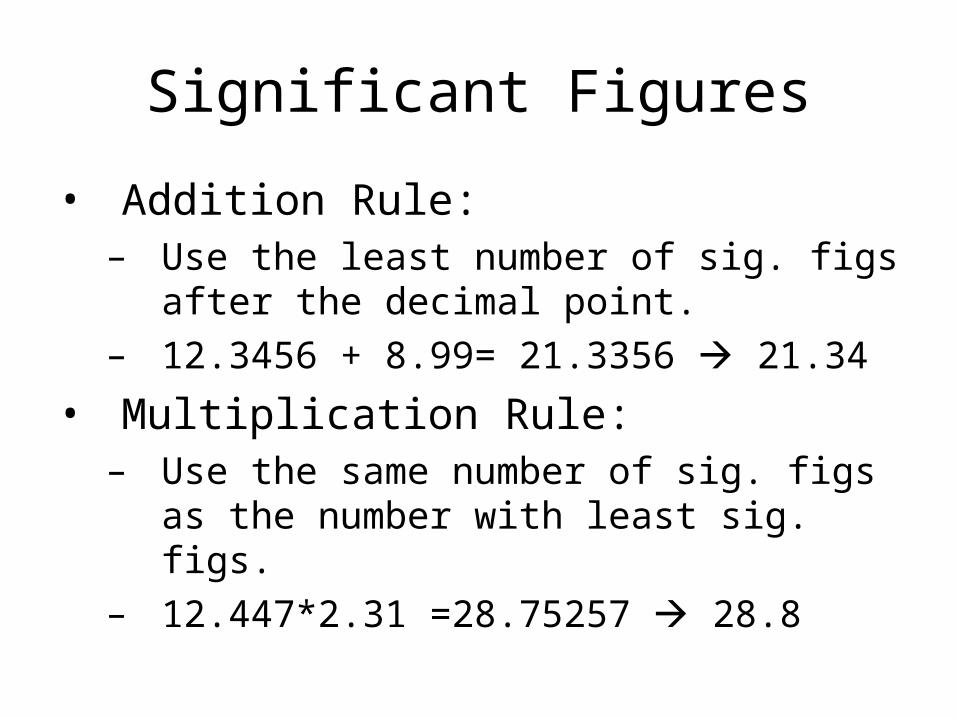
Significant Figures
• Addition Rule:– Use the least number of sig. figs after the
decimal point.– 12.3456 + 8.99= 21.3356 21.34
• Multiplication Rule:– Use the same number of sig. figs as the
number with least sig. figs.– 12.447*2.31 =28.75257 28.8