measurement uncertainty and feasibility study of a flush airdata …€¦ · measurement...
TRANSCRIPT

NASA Technical Memorandum 4627
Measurement Uncertainty
and Feasibility Study of a
Flush Airdata System for a
Hypersonic Flight
Experiment
Stephen A. Whitmore and Timothy R. Moes
Dryden Flight Research Center
Edwards, California
National Aeronautics and
Space Administration
Office of Management
Scientific and TechnicalInformation Program
1994
https://ntrs.nasa.gov/search.jsp?R=19940032870 2020-06-06T03:57:25+00:00Z


MEASUREMENT UNCERTAINTY AND FEASIBILITY STUDY OF
A FLUSH AIRDATA SYSTEM FOR A HYPERSONIC FLIGHT EXPERIMENT
Stephen A. Whitmore* and T'unothy R. Moes t
NASA Dryden Flight Research Center, P. O. Box 273, Edwards, California 93523-0273
Abstract NASP
Presented is a feasibility and error analysis for a hyper- Symbols
sonic flush airdata system on a hypersonic flight experi- ament (HYFLITE). HYFLITE heating loads make intrusive
airdata measurement impractical. Although this analysis is A¢
specifically for the HYFLITE vehicle and trajectory, theproblems analyzed are generally applicable to hypersonic b
vehicles. A layout of the flush-port matrix is shown. Sur- cface pressures are related airdata parameters using a simple
aerodynamic model. The model is linearized using small
perturbations and inverted using nonlinear least-squares. C1,"Effects of various error sources on the overall uncertainty
are evaluated using an error simulation. Error sources rood- CPe
eled include boundary-layer/viscous interactions, pneu- Dmatic lag, thermal transpiration in the sensor pressure
tubing, misalignment in the matrix layout, thermal warping Dportof the vehicle nose, sampling resolution, and transducererror. Using simulated pressure data for input to the estima- F
don algorithm, effects caused by various error sources areanalyzed by comparing estimator outputs with the original g(M)
trajectory. To obtain ensemble averages the simulation is h(M)
run repeatedly and output statistics are compiled. Outputerrors resulting from the various error sources are pre- Int[...]sented as a function of Mach number. Final uncertainties
Kwith all modeled error sources included are presented as a
function of Mach number.
Nomenclature
Acronyms and Initialisms
FADS
HY-FADS
HYFLITE
ICBM
flush airdata sensing
hypersonic flush airdata sensing
hypersonic flight experiment
intercontinental ballistic missile
MOS model output statistic
Copyright © 1994by the AmericanInstitute of AeronauticsandAstro-nautics, Inc. No copyrightis assertedin the UnitedStates under'13tle17,U.S. Code. The U.S. Government has • royalty-free license to exerciseall fights trader the copyright claimedhereinfor Governmentalpurpose=.All otherrightsate reservedby the copyrightowner.
*AerospaceEngineer.AIAAmember.tAerospaceEngineer.AIAAmember.
L
L.
L,ff
Moo
M 2
P
P
P0
P02
e_
Pc
National Aerospace Plane
Knudsen's empirical constant (24.6)
tube cross-section areas, in2
Knudsen's empirical constant (2.46)
sonic velocity, ft/sec; also Knudsen's
empirical constant (3.15)
stagnation point pressure coefficient
pressure coefficient at incidence angle
tube diameter, in.
port diameter, in.
aerodynamic model function
Mach number function
Mach number function
integer roundoff of real value
empirical coefficient for port damping
(0.5O)
tube length, in.
surface length, in.
effective tubing length, in. (includes port
effects)
free-stream Mach number
downstream Mach number
pressure, lb/ft 2
sampled pressure value, lb/ft 2
pressure at incidence angle, 0, lb/ft 2
stagnation pressure downstream of shock,
lb/ft 2
free-stream static pressure, lb/ft 2
pressure at transducer, lb/ft 2

Po
7t**
q2
R
R@
$
t
Tavg
T
Tsurf
Ttra ns
TI¢
V
Vn, 1
Vn,2
V 2
V
X
Y
Z
(x
_c
_$
P
8
8_
8p.
pressure at port, lb/ft2
free-stream incompressible dynamic pres-sure, lb/ft2
dynamic pressure downstream of shock,lb/ft2
acoustic impedance Obf-sec/fP)
Reynolds number at surface
Laplace variable (l/sec)
skin thickness, in.
average temperaturein tube, OR(°F)
temperature at outer edge of boundarylayer, °R (OF)
surface temperature, *R (oF)
transducer temperature, °R (oF)
adiabatic wall temperature, °R (OF)
transducer volume, in3
upstream velocity normal to shock wave,ft/sec
downslream velocity normal to shockwave, fffsec
downstream velocity, ft/sec
upstream velocity, ft/see
longitudinal coordinate, in.
lateral coordinate, in.
normal coordinate, in.
angle of attack, deg
thermal expansion coefficient, carbon,inJinJ°R
thermal expansion coefficient, steel,inJinJ°R
angle of sideslip, deg
ramp angle, deg
pressure altitude residual, ft
free-stream Mach number residual, ft
free-stream pressure residual, ft
flee-stream dynamic pressure residual, ft
incremental radius of curvature resulting
8si
8a
8p
8o
Y
F
11
K
g
0
P
_n
V
Subscripts
i
J
oo
0
from heating, in.
incremental length change resulting fromheating, in.
angie-of-attack residual, deg
angle-of-sideslip residual, deg
incidence angle residual, deg
clock angle, deg
ratio of specific heats
oblique shock angle, deg
white noise source
Knudsen number
cone angle, deg
dynamic viscosity, lbf-sec/ft
incidence angle, deg
density, Ibm/fP
standard deviation
damping ratio
viscous interaction parameter
natural frequency, rad/sec
gradient of vector
port index
iteration index
free-stream parameter
initial condition of parameter
parameterdownstreamofshock
Introduction
The former National Aerospace Plane (NASP) program
proposed a hypersonic flight experiment (HYFLITE) toevaluate the performance of scramjet technologies. _ The
proposed vehicle has a forebody shape resembling theNASP, and was designed to support a scrarnjet test engine.This paper presents the results of a feasibility study anderror analysis performed for a hypersonic flush airdata sys-tem (HY-FADS) on the HYFLITE vehicle. The study and
analyses are based on models generally accepted as validwithin the aerospace community. Some parts of the systemare not modeled and are so noted. Although the analysis

performed is specific to the HYFLITE vehicle and trajec-
tory, the methods described and the problems analyzed are
generally applicable to other hypersonic vehicles. This
paper addresses feasibility and accuracy issues common tomost hypersonic vehicles.
This study presents the physical layout of a candidate
flush-port matrix, and the effects of various error sourceson the overall system uncertainty ate evaluated using an
error simulation. In this simulation a realistic set of pres-
sure data is generated along the trajectory, and various
error sources are superimposed on the data. Using the sim-
ulated pressure data (with the various error sources super-
imposed) for input to the airdata estimation algorithm,estimates of the trajectory parameters are generated. The
effects caused by the various error sources are analyzed by
comparing the outputs of the estimation algorithm with
the original trajectory data. To obtain ensemble averagesof the errors induced by random input error components,
the simulation is run repeatedly and model output statis-
tics (MOSs) are generated. Output error magnitudes
resulting from the various (inpu0 error sources are pre-sented as a function of Mach number. The peak Mach
number analyzed is approximately 13 and the peak alti-tude is 120,000 ft. This report analyzes only supersonic
and hypersonic conditions.
Background
Because airdata values are used to normalize perfor-
mance and flight mechanics parameters and to schedule
control and guidance system gains or to provide direct
flight control feedback, accurate airdata measurements
have always been critical for the flight test community.
Although the requirements for measurement uncertainty
for hypersonic vehicles have been difficult to firmly estab-
lish, uncertainties for Mach number of about 0.10 and
flow incidence angles of about 0.25 ° have frequently been
requested. Accuracies on this level are needed for engine
flowpath and vehicle trajectory optimization
Historically, airdata measurements were obtained usingintrusive booms that extended beyond the local flow field
of the aircraft and measured airmass velocities by.directly
stagnating the flow via a pitot tube at the end. 2 Flow inci-
dence angles were measured using mechanical vanes
attached to the probe. Because heating loads induced by
hypersonic vehicles make it difficult for intrusive mea-surement devices to survive, probes are considered
impractical for hypersonic vehicles.
To bypass the difficulties with intrusive systems, theflush airdata sensing (FADS) system concept, in which
airdata are inferred from nonintrusive surface pressure
measurements, was developed in the early 1960's and
used to measure hypersonic conditions on the Saturn IVb
space launch vehicle and X-15 rocket. The concept was
further refined during the shuttle reentry airdata sensing
experiment, which demonstrated that the concept was fea-sible for blunt-nosed hypersonic vehicles. Concurrent with
the shuttle experiment, early aeronautical applications in-
cluded programs conducted at NASA Dryden FlightResearch Center on the KC-135 and F-14 vehicles. (-5Later
programs at NASA Dryden demonstrated the autonomous
capability of the system, with fully redundant systems
being demonstrated on the F-18 High Alpha ResearchVehicle and autonomous real-time systems demonstrated
on the F-18 Systems Research Aircraft. 6'7 References 8
and 9 provide an overview of failure detection and fault
management techniques developed for the real-time FADS
system.
The FADS method offers the advantage of inferring
dynamic pressure, Mach number, and flow incidence
angles without requiring that the stagnation flow conditionbe created and measured direcdy. This approach allows the
heating load at the pressure orifices to be significantlydiminished for orifices positioned away from the forebody
stagnation point and makes the FADS method ideal for
application to hypersonic vehicles.
Trajectory and Vehicle Description
HYFLITE achieves high Mach numbers at high
dynamic pressures using a depressed trajectory. To reachthis trajectory an intercontinental ballistic missile boosts a
test article to hypersonic conditions suitable for perform-
ing scramjet research. _This trajectory accelerates the vehi-
cle to approximately Mach 13 at 120,000 ft with peak
dynamic pressures of 2800 lb/ft 2. Figure 1 shows the pro-
posed flight envelope.
16
14
12
10
Mach 8
number 6
4
2
0
- Vehicle staging - 4
- (ICBM) _ 2
- (x [ /_ 0
--iI_M_ i I -.__26 Angle of
attack,_ deg
M_ -8
-10
-12
20 40 60 80 100120 140 x 103
Altitude, ft _o2s4
Fig. 1. HYFLITE vehicle flight envelope.
Figure 2 pictures the vehicle to be analyzed. The pro-
posed configuration resembles the NASP forebody and
was designed to support a scram jet test engine. The vehi-cle has a shovel-like nose with 5 ° wedge angles at the

Front view
Side view Z
Top view (enlarged)looking down
8
6_
"! . _
x -t o, .y~2 in. 5
Y
_ " °
I x ~ 40 in. _
X-_
,6- i311'_-_X ~ 48 in.
I X - 96.0 in. t
Side view (enlarged)(not to scale)
looking Inboard
Top view
X
Fig. 2. Proposed pressure FADS port locations for HYFLITE vehicle.
940255
leading edge. The top surface ramp expandsto a 6° halfangle approximately halfway aft, and the lower surfacehas an isentropic compression ramp for the scramjet fix-ture. For this study the isenu'opic ramp was approximatedby a 6° wedge. The longitudinal leading-edge radius of thenose is 0.1 in., and the lateral leading-edge radius isapproximately 20 in. The approximate vehicle length is33 ft. Although the leading edge---which was chosen togive good flow characteristics at the scramjet inlet forsingle-stage-to-orbit performance---is quite sharp, this
analysis assumes that the leading edge is blunt enough toallow sufficient heating relief for the nose to withstand the
resulting surface temperamre.s without active cooling.
Airdata System Port Layout
The port matrix layout was determined as a compromisebetween the need to accurately model the flow characteris-
tics near the pressure ports, and the need to give good sen-sitivity of the pressure measurements relative to the airdata

parameters. Regions where high-terapcralmv viscousinteractions cause boundary-layer thickening were
avoided. Only locations along the leading edge (where theboundary-layer thickness is small) and locations fartheraft on the ramp surfaces (where the viscous interactionsdiminish) were considered.
Results presented in references 6, 7, 8, and 9 show thatmore ports always lead to more accurate measurements,but that diminishing returns are reached when the number
of ports exceeds nine. Below this number of ports, airdatameasurement errors can rise significantly. Thus, a total ofnine ports was used: five along the leading edge and fourdistributed on the centerline of the two-dimensional rampsurfaces. The ports along the leading edge provide the pri-mary information source for measuring Mach number(M), angle of sideslip (15), and static pressure (pressurealtitude, Hp). The ports on the upper and lower ramp sur-faces provide the primary information source for angle-of-attack (c0 measurement.
The port locations are described using a clock and coneangle coordinate system that is an analytical mappingfrom the actual surface to a hemisphere. The cone angle,Z., is the total angle that the normal to the surface makeswith respect to vehicle axis of symmetry. The clock angle,_b, is the clockwise angle looking aft around the axis ofsymmetry starting at the bottom of the fuselage. As men-tioned earlier, to keep the locations of the leading-edgeports far enough forward on the vehicle so that boundary-layer effects could be ignored, ports were placed near thenose with cone angles of 0 °, ±45°, and ±80°. The rampports were placed farther aft on the vehicle where theeffects of viscous interactions diminish. The first set of
ports were located approximately 4-ft aft of the nose, and
the second set 8 ft aft. Figure 2 depicts the HYFLITEvehicle and approximate port locations. Table 1 lists thecoordinate angles of the pressure ports.
Table 1. Pressure port coordinates.
Port no. k, deg dp,deg Lxx:ation
0 0 0 Stagnation
1 85 0 Lower ramp
2 85 180 Upper ramp
3 84 0 Lower ramp (aft)
4 84 180 Upper tamp (aft)
5 45 -90 Leading edge
6 45 90 Leading edge
7 80 -90 Leading edge (aft)
8 80 90 Leading edge (aft)
The angles of attack and sideslip, t_ and _, are related tothe port coordinate angles 6 by
cos (el) = cos (a) cos (13) cos (_,i) +
sin (13) sin (t_i) sin (_i) + sin (or) cos (13)cos (_i) sin (ki)
where 0 i is the total incidence angle relative to the localsurface.
Pressure Modeling
The key to this analysis is to develop a pressure modelthat relates the airdata to the surface pressures in an accu-rate way, but is still simple enough to be inverted andimplemented as part of an airdata estimation algorithm.Fct accuracy equilibrium high-temperature gas effectsmust be modeled in the analysis. Because Mach numberpeaks out in the Mach 12 region, however, previousresults _° indicate that nonequilibrium high-temperaturegas effects are not significant, and they were ignored inthis analysis. Because pressure is a mechanical quantityand depends primarily upon the mechanical aspects of the
flow, influences caused by high-temperature gas chemistryare always secondary. Viscous boundary-layer interactionsare significant, however;, errors resulting from the interac-tions were modeled and their effects introduced in the
error analysis section.
Near the leading edge the stagnation properties (Cp,,,)were computed using the high-temperature equilibrium
normal shock tables and equations of state for air, TM _2and
the pressure dislribution was described using modifiedNewtonian flow. _°
Po - P** P02 - P** 2cos (0) =
O. : Ceo : L
Cp.., cos2 (O)
(la)
On the ramp surfaces, the pressure distribution was com-puted using the equilibrium normal shock tables and theshock wave angle-turning angle relationship for high-tem-perature equilibrium flow. _°Here, the oblique shock angle,F, is an implicit function of the free-stream velocity andthe surface wedge (taming) angle, 8
tan (r- 8) = v_---_2mn(r)Vn, 1
(lb)
where Vn,1 is the upstream velocity normal to the shockwave, and V,,.2 is the downstream velocity normal to theshock wave. The ratio

V,,_._22= V2sin (F)
V,, 1 V sin (F)
is determined from the equilibrium normal shock tables.
For a given mining angle, equation (lb) is iterated untilthe velocity ratio is consistent with the normal shocktables. Once the shock angle and downstream velocityhave been determined, the downstream pressure coeffi-cient is determined from the equations of continuity andmomentum, 13
P2V2 = PlV1 ,
P2 + P2 [V2sinF] 2 ffiPI + Pl [V2sinF] 2
to give
CPwed&e = 2sin2 [F] [1 - V_ ] (lc)
The specific form of the nonlinear function F[...]depends on whether the port is located on the leading edge
on the ramp surfaces. The parameter rli is a noise vec-tor and can be used to represent the various modeling-,
system-, and measurement-error sources. Taken together,the matrix of ports forms an overdetermined nonlinearmodel in that the number of observations (9) is larger thanthe number of states to be estimated (4).
The system is nonlinear in ¢zand 15,and Mach number is
a parameter of the system, which is in turn related to theairdata parameters. As a result of this nonlinearity andinterdependence, the system of equations must be solvediteratively to estimate the airdata states. This iteration isimplemented by linearizing about a starting value for eachport, and the perturbations between the measured (gener-ated) data and the model predictions are evaluated. At agiven data frame for each pressure port, i ---1.... N,
)] =
The clock angle is always either 180° for the upper sur-face ramp or 0° for the lower surface ramp; thus, the inci-dence angle is related to the wedge half-angle by
Upper Surface:
cos (e i) = [cos (a) sin (8) - sin (ct) cos (8) ] cos (15)
Lower Surface:
cos (0 i) = [cos (a) sin (8) + sin (ct) cos (8)] cos (15)
Equations (la), (lb), and (lc), along with the high-temperature equilibrium normal shock tables for air, canbe used to simulate pressure data along the vehicle flighttrajectory. This system of equations was also used as themodel that relates the measured pressure to the airdatastates in the airdata estimation algorithm.
Airdata Estimation Algorithm
This section develops the regression algorithm that wasused to extract the airdata estimates from the pressuredata. For this analysis the airdata state vector is describedin terms of four parameters: dynamic pressure behind the
shock (q2), angle of attack (ct), angle of sidesfip (1_),and free-stream static pressure (P). Using these fourbasic airdata parameters, other airdata quantifies of inter-est may be directly calculated. For a given pressure obser-vation the form of the model is
8D2 j + 1
V q2 F_i X SP**J + 1
sgj+ 1
•4- .°.
(2b)
Defining
j+lq2
pj+l
oLJ+ !
_S+l
q21 SqJ+ q
j+l[P "1 8P.
I sd +tl
.15,j 8¢ +1]
the updated state vector is solved using recursive least
squares
q j+ 1 q2 '2
pj+l p j
¢tj + 1 I otj
I¢+ J
[ -1--11 m I
+ vTFI¢_F_ I V'FI-k
8p1 j+
_p NJ +
(2c)
+ 11i (2a)
At the end of each iteration cycle the downstream Mach
number, M 2, is determined from the ratio of q2 IP**"P**isused to determine the altitude, and the temperature isdetermined using a standard atmosphere. With these val-ues for pressure, temperature, and M2, free-stream Mach
6

number is determined using a table lookup of the equilib-rium normal shock tables for air. For each data frame the
iteration cycle is repeated until algorithm convergence is
reached---typicaUy from 2 to 5 cycles. For this algorithmfree-stream Mach number is used as the convergence cri-
teflon, and changes in the free-stream Mach number ofless than 0.001 are considered to indicate a converged
cycle. At the beginning of each new data frame, the sys-
tem of equations is linearized about the result of tim previ-ous data frame. The Cholesld factorization techniques
used to perform the regression are standard imple-mentations 1' and will not be discussed here.
Error Analysis: Development
of Error Models
In this section error sources for the pressure measure-
ments are considered, and error propagation models, both
random and systematic, are developed. These error modelsare used to contaminate the pressure data. The corrupted
pressure data are subsequendy used as input to the airdata
estimation algorithm. The simulation is designed to allowerrors to be superimposed individually or in groups. Impo-
sition of the errors individually allows the magnitudes of
the various effects to be quantified individually.
This error analysis assumes that the flow models
described earlier are accurate. Except those made for
viscous boundary-layer interaction, no attempt is made to
characterize the uncertainty of the surface pressure
models. The error models developed address only thelocal measurement error sources. Vehicle dependent
effects, such as bending about the center of gravity and
position error, 2 are not considered. For a real vehicle, theseeffects must be calibrated.
Viscous Interaction Error Model
As mentioned previously, equilibrium high-temperature
gas effects are included in the estimation model, and non-
equilibrium high-temperature effects are considered negli-
gible in this analysis. Because the shock is detached nearthe nose, shock-boundary-layer interactions can be
ignored. At high free-stream velocities, however, viscousinteractions between the boundary layer and the external
flow can significantly increase the boundary-layer thick-
ness, which can in turn significantly affect the local pres-sure distribution. Based on the analysis of reference 10,
the induced pressure error (caused by viscous interactions)
is directly proportional to the governing similarity param-
eter, _, where
(3a)
The subscript w indicates quantifies at the wall, and the
subscript • represents quantifies at the outer edge of the
boundary layer. If pressure is constant (vertically)
throughout the boundary layer and viscosity is propor-tional to the square root of the temperature, n then
(3b)
Assuming an adiabatic wall (with a recovery factor of Rc),
M 3
m 1/4 (3c)
+Rc( -21)M2.]
A value of X < 3 indicates a weak boundary-layer inter-action, and a value of _ >- 3 indicates a strong interaction.
For a flat plate the increment in pressure resulting from aweak interaction is approximately 1°
[_Pviscous] ,_ 1 + 0.31X + (4a)O.05X 2
P inviscid J weak
and the increment in pressure resulting from a strong inter-
action is approximately
[ Prise°us] ", 0.514_ - 0.241P inviscid J strong
(4b)
If the wall is nonadiabatic such as for an actively cooled
surface, then the viscous interaction errors will be less
than those predicted by equations (3) and (4). Thus, theviscous interaction analysis is conservative.
Pneumatic Lag Error Model
Because of the hostility of the surface environment, sur-
face pressures must be sensed by transducers located
remotely within the aircraft body. The measurement trans-ducers are connected to the surface via lengths of pneu-
matic tubing. This tubing induces spectral distortion
caused by frictional losses and wave resonance. Based onthe analysis described in reference 7, the pneumatic atten-uation effects are modeled by a time-varying, second-
order system of the form
PL (S) 1= (5a)
Po(S) 1 2+2___s +1f,0 2 COn
n

where PL is the pressure measured at the transducer andP0 is the surface pressure input. The natural frequency ofthe system is described by
Q) 2
n
LV
12 (p0 c) 2J 1 + (LR)26 (po c) 2
and the damping ratio is given by
whereL isthetubinglength,Ac istherobecross-sec-
tionalarea,c isthelocalsonicvelocity,P0 isthelocaldensity(withinthetube),andV istheentrappedvolumeofthetransducer.Assuming laminarflowin thetubethe
acousticimpedanceofthesystemisdefinedby
For each pressure sensor [ and o)n are evaluated at eachtime point based on an average of the surface conditionsand the conditions at the transducer.
The effects of the surface pressure ports are modeledusing the analyses of references 16 and 17. Here the effectof the port is to extend the effective length of the tube bythe amount
8Leff _ KD oft= + _Rey (5b)
where7, P,M, It, andc areevaluatedbasedon localcon-
ditions,and Dportistheportdiameter.Entrappedvol-umes found where the tubejoinsthesurfaceportate
ignored.Forthisanalysistheeffectiveincrementintubing
lengthissmall,aboutIto5percentofthetotallength.
Thermal Transpiration Error Model
The transpiration-inducedpressurenonequilibrium,whichresultsfromlargetemperaturegradientsand small
tubingdiameters,isprimarilya molecularflowphenome-
non?8Along an unequallyheatedgasboundary,kinetic
theory predicts that the gasadjacent to the boundary wall
will creep from the colder region to the hotter region. Forsmile conditions in which there is no net mass flow within
the tube, to balance this creep the gas in the center of thetube tends toward the colder end of the tube. The result of
this opposing flow is that a static pressure gradient isestablished, with the cold region of the tube rfading lowerthan the hot region. This effect, referred to as transpira-tion or molecular creep, is primarily a steady-state
phenomenon.
For high ambient pressure levels at which continuumflow exists, the molecular creep effect is not consideredimportant and can be ignored. At low-pressure levels,however, this effect becomes important. For low-pressureconditions the pressure gradient induced by longitudinaltemperature gradients is primarily a function of Knudsen'snumber, _. If the characteristic length of the system istaken to be the tube diameter, then for air
.r519 ftL " secd J D P
The transpiration effect is modeled by numerical inte-gration of Knudsen's molecular creep equation n
_P (x) _0T (x)
r tc(p,T,O) (K(p,T,D) +a) ]22T(x) I_(P,T,D) 2+ (a+b)K(P,T,D) +bc
(6)
where the constants a. b, and c have been empiricallydetermined to be
a b c
Knudsen's constants 24.6 2.46 3.15
and D is the tube diameter. For a prescribed value of Dequation (6) may be treated as an initial value problem,which is integrated over a prescribed temperature rangefrom the transducer to the surface. It can then be imple-
mented as a part of the overall simulation scheme.
Port Misalignment Error Models
This analysis models the effects of port alignmenterrors. Two types of errors are modeled: (1) an initial (ran-dora) error in the port alignment and (2) systematic defor-mation of the structure resulting from heating loads.
Initial Port Misalignment Error Model
The clock and cone angle bias alignment errors wereintroduced into the simulation at the beginning of eachMonte-Carlotime historyrunusing a normalized random-
number generator. Once the values of the alignment errorshave been set fox a particular data run, they are held con-stant throughout the data run.

StructuralDeformationErrorModel
Modeling of the thermal expansion of the highly curvedleading edge is extremely difficult, and only the deforma-tion of the ramp surfaces is addressed in this model. Theanalysis is for a flat plate with the primary deformationmechanism assumed to be differential expansion of the
skin layers. Referring to figure 3, the skin is assumed to becarbon-carbon on the exterior bonded to a stainless steel
substrate on the interior. The thermal expansion coeffi-
cients are ac(carbon-carbon) and as(stainless steel).Assuming identical thickness for the two layers, thenbased on the analysis of reference 16, the radius of curva-
ture resulting from differential thermal expansion of thetwo layers is
2t (7a)5Ri = 3 (a c - a s) (T i- Tref)
stainless steel), Ti is the temperature at the surface, and
Tr, f is the reference temperature at which the skins werebonded. Referring to figure 3, the differential incidence
angle is given by
where _Ri is the induced radius of curvature at the ithport, t is the thickness of the skin (earbon-carbon and
(7b)
where 8si is the length expansion to the surface. From ref-erence 17 the expansion per unit length is given by
_Si ac
L"_ ffi -2 (Ti- Tref)
and the resulting deformation model is then given by
(7c)
3_( (ac) 2_OLcas)(Ti_ Tref) 28el ffi 4tk (7d)
Carlx
Undeformed skin
Deformed skin
Stainless steel
94O256
_R
Fig. 3. Thermal expansion deformation model for HYFLITE skin.
9

Forthisanalysisthe per-length parameter, Li , is the dis-tance over which the heating has occurred and for thisanalysis is defined as the distance from the tip of the vehi-cle to the port.
Resolution and Transduction Error Models
System quantization levels of 12 and 16 bits are ana-lyzed. To simulate this quantization the generated pressuredata are sampled and truncated after n bits (2n counts) ofresolution.
Pi_i = int[Full Sca_'Reading × 2hi ×Full Scale Readin_
2n
(g)
This analysis assumes that the measurement transducersare located in an environmentally controlled area, and thatthe manufacturer's environmental specifications are not
exceeded. Furthermore, it is assumed that known biaserrors are eliminated using preflight tare calibrations;unknown bias errors or variable but systematic transduc-tim errors are lumped with the random errors for this anal-ysis. The random transducer errors are modeled asunbiased Gaussian white noise sequences and are gener-ated using a normalized random-number generator. Theerrors are allowed to vary randomly for each data frameand across the collection of pressure ports.
Results and Discussion
The results of the en'or analysis will now be presented.Figures 4 through 10 show sample residuals (from one ofthe Monte-Carlo data runs) for each of the error sources.For the final uncertainty analysis of the system, all errorsources are superimposed simultaneously. The model out-puts from 100 data runs are averaged to give ensemble sta-tistics. Table 2 lists root-mean-square (1-o rms) errorstatistics.
8M..
.175
.150
.125
.100
.075
.050
.025
B
.1
m
_5o:, 0_ deg
L I0 2 4 6 8 10 12 14
Moo94O257
Fig. 4. Mack-number residual caused by high-temperature viscous-boundary-layer interactions.
.1-
--' -_" \ZS.,TT"2.'_ : -_
-.1 I I I I I I I0 2 4 6 8 10 12 14
Moo9402541
8Moo
(a) Mack.number residual.
Fig. 5. Residuals caused by pressure-tubing lags, reso-nances, and attenuations.
10
D
j-- Effects from
tube resonance
-.1 I I I I I I I0 2 4 6 8 10 12 14
Moo
(b) Angle-of-attack residual.
Fig. 5. Concluded.
.1-
8Moo 0
-.1 I t I I I I I0 2 4 6 8 10 12 14
Moo94O26O
(a) Mack-number residuaL
Fig. 6. Residuals caused by thermal transpiration of
pressure tubes.

_0_'deg 0
.1-
-.10
I I I I I I I2 4 6 8 10 12 14
Moo94O261
(b) Angle-of-attack residual.
Fig. 6. Concluded.
8Moo 0
-'10 2 4 6 8 10 12 14
Moo94O264
(a) Mach-number residual.
.1-
8M_
.20-
.15
.10 -
.05 -
0-
-,5 -
-.10 -
-.15 0
= 0.25°_/ 8(Z'deg 0 .......
/
6 8 10 12 14
Moo uo2_
(b) Angle-or-attack residual.
Fig. 8. Residuals caused by heating-induced structuraldeformation.
I I I I I I I2 4 6 8 10 12 14
M_g40262
.4
.3
8(X, .2
deg .1
(a) Mach-number residual
- = 0 /7
e:o.os I I I I I I I
-'10 2 4 6 8 10 12 14
GM_263Moo
(b) Angle-of-attack residual,
Fig. 7. Residuals caused by initial port misalignmenterror.
10 Conventional sensors
-I i I I I I I I
2 Hlgh quallty sensors
-Sp = :L0.05%, _.......... ..,..,....,,,J
8 Moo 01 ............. ,,'r-_l_
I-2 I I I I I I J
State-of-the-art sensors
-.2 I I I I I I I0 2 4 6 8 10 12 14
Moo940266
(a) Mach-number residuals.
Fig. 9. Residuals caused by transducer error.
11
1 Conventional sensors .1 -
deg 8M oo 0
I I I I I I I
Hlgh quallty sensors
_p = !-0.05% -.1 I I I I I I I
I I I 1 I I I 16-bit resolution
State-of-the-art sensors
1F_p = :L0.01%Ga,deg 0 ; .- -::_....- _ ::_
-I I I0 2 4
(_(x,
dogB
I I I I I II I I I I -'10 2 4 6 8 10 12
6 8 10 12 14 MooMoo
940267
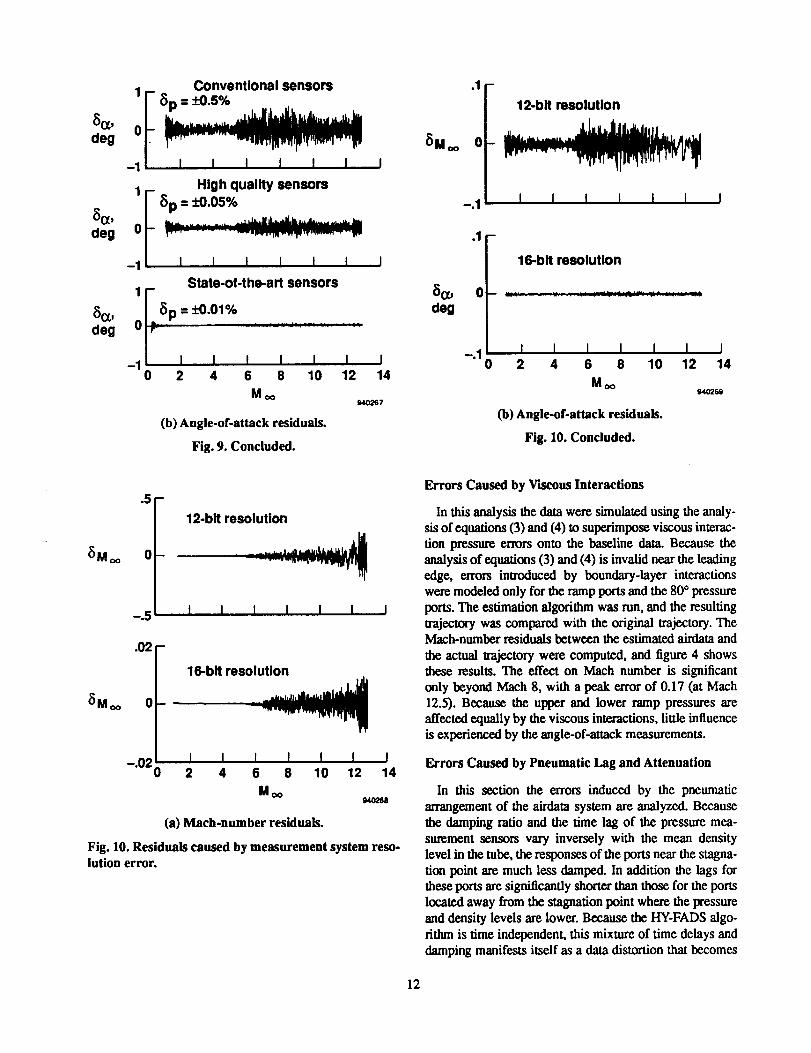
(b) Angle-of-attack residuals. (b) Angle-of-attack residuals.
Fig. 10. Concluded.Fig. 9. Concluded.
J14
940269
_Moo 0
.5-
-.5
12-bit resolution
I I I ! I I I
.02
(SMoo 0
n
16-bit resolution
I I I I I I I-'020 2 4 6 8 10 12 14
Moo94O268
(a) Mack-number residuals.
Fig. 10. Residuals caused by measurement system reso-lution error.
Errors Caused by Viscous Interactions
In this analysis the data were simulated using the analy-sis of equations (3) and (4) to superimpose viscous interac-tion pressure errors onto the baseline data. Because theanalysis of equations (3) and (4) is invalid near the leadingedge, errors introduced by boundary-layer interactionswere modeled only for the ramp ports and the 80° pressure
ports. The estimation algorithm was run, and the resultingtrajectory was compared with the original trajectory. TheMath-number residuals between the estimated airdata and
the actual lrajectory were computed, and figure 4 showsthese results. The effect on Mach number is significantonly beyond Mach 8, with a peak error of 0.17 (at Mach12.5). Because the upper and lower ramp pressures areaffectedequally by the viscous interactions,little influenceis experienced by the angle-of-attack measurements.
Errors Caused by Pneumatic Lag and Attenuation
In this section the errors induced by the pneumaticarrangement of the airdata system are analyzed. Becausethe damping ratio and the time lag of the pressure mea-surement sensors vary inversely with the mean densitylevel in the tube, the responses of the ports near the stagna-tion point are much less damped. In addition the lags forthese ports are significandy shorter than those for the portslocated away from the stagnation point where the pressureand density levels are lower. Because the HY-FADS algo-rithm is time independent, this mixture of time delays anddamping manifests itself as a data distortion that becomes
12

Table2.I-_ ,'msabsoluteandI_ rmspercentageerrorestimatesfor theHY-FADSsystem.
M 8 M 8-, 8Up, _ia , 8_, 8u/u , 8_/_, 5Hp/H p,- q
lb/ft 2 ft deg deg % % %
1.0 0.0 1.0 10 0.2 0.1 0.3 0.1 0.1
2_ 0.0 1.5 10 0.2 0.2 0.2 0.1 0.0
3.0 0.0 0.3 10 0.1 0.2 0.1 0.0 0.0
4.0 0.0 0.8 25 0.1 0_ 0.1 0.0 0.1
5.0 0.0 4.0 1_ 0.2 0.3 0.2 0_ 0.2
6.0 0.0 5.0 250 0.2 0.3 0.4 0.6 0.2
7.0 0.0 2.0 350 0.2 0.3 0.6 0.3 0.3
8.0 0.1 1.0 450 0.2 0.4 1.0 0.1 0.4
9.0 0.1 3.0 5_ 0.2 0.3 1.1 0A 0.5
10.0 0.1 3.0 600 0.2 0.3 1.2 0.3 0.5
11.0 0.2 2.0 750 0.2 0.3 1.6 0.2 0.7
12.0 0.3 1.0 11_ 0.2 0.3 2.3 0.1 0.8
12.5 0.4 4.0 1350 0.2 0.3 3.3 0A 1.0
most pronounced at high Mach numbers, at which thespread of damping and lags is greatest. Thus, it is gener-ally a good idea to match the lags and damping of the var-ious sensors as closely as possible over the range of testconditions. A practical system with minimal pneumaticeffects (except an inherent time-latency) can generally beachieved by varying the lengths and diameters of the con-nective tubing. Table 3 lists the configuration used for thissimulation.
Table 3. Pneumatic layout of airdata system.
Tube Tube Port
Port L _, diameter, length, diameter,no. deg deg in. in. in.
0 0 0 0.020 60 0.010
1 85 0 0.060 24 0.020
2 85 180 0.060 24 0.020
3 84 0 0.060 24 0.020
4 84 180 0.060 24 0.020
5 45 -90 0.020 60 0.010
6 45 90 0.020 60 0.010
7 80 -90 0.060 24 0.020
8 80 90 0.060 24 0.020
For this analysis it is assumed that the transducers arelocated in a thermally conlxolled environment and that thetransducer temperature is maintained at 100 OF for theduration of the flight. The volume entrapped by the trans-ducer is assumed to be minimal, and a value of 0.05 in3
was used. To eliminate problems with surface heating, theexternal port size is constrained to be 0.01 in. for all lead-
ing-edge ports and 0.02 in. for the ramp surface ports. Themodel parameters are computed using the average of thesurface and transducer temperatures. Temperatures at the
external ports are computed using the equilibrium obliqueshock equations for the ramp ports, and the equilibriumnormal shock tables far the leading-edge ports. The gasdensity within the pressure tubes was evaluated using theinput pressure level and the average between the surfacetemperaatre (computed from equilibrium analysis) and theassumed transducer temperature (100 *F). Figure 5(a)shows the resulting Mach number residuals, and the angle-of-attack residuals are shown in figure 5(b).
Errors Caused by Thermal Transpiration
The thermal transpiration or molecular creep error anal-ysis was performed using the configuration analyzed in theprevious section. Figure 6 presents Mach-number andangle-of-attack residuals. Again the effect on Math num-ber is significant only beyond Mach 6. It is at these speedswhere the conditions rarefied enough to induce moleculareffects. The effects on angle of attack are insignificant.
13

Errors Caused by Port Misalignment
This section presents the results of the port misalign-ment error analyses. Errors resulting from the initial portmisalignment will be presented firsL The errors resultingfrom systematic deformation of the structure caused by
heating loads will be presented next
Initial Port Misalignment Error
For this analysis the three initial misalignment errorbounds were considered---0.05*, 0.10 °, and 0.25 °. The
squares of these bounds defined the variances for therandom-number generator. Figure 7 shows the results of asingle data run.
Thermal Expansion Port Misalignment Error
Figure 8 presents the effects of the thermal expansionon port misalignment. As mentioned earlier, the modelingof the thermal expansion of the leading edge is beyond thescope of this analysis, and only the deformation of theramp surfaces was addressed. The reference temperaturewas assumed to be 70 °F and the skin thickness 0.5 in. The
surface temperature was computed using the equilibriumoblique shock equations. A value of 4A ×10-_]°R was
used for a¢, and a value of 7.562 × 10-_/°R was used for¢xs . Computations were based on the distance from thenose--which is unconstrained and can move freely--tothe pressure port.
Errors Caused by Transduction and Resolution
The transduction uncertainty and system resolution areimportant and must be carefully considered when devel-oping a HY-FADS system. Depending on the needs of themeasurement users, varying degrees of raw measurementquality and sampling resolution is required. For this analy-sis it was assumed that absolute pressure transducers wereused. The analysis assumed a 40 lb/in2 (5760 lb/ft2) full-scale reading for the three transducers connected to theports nearest the stagnation point. A 15 lb/in2 (2160 lb/ft2)full-scale reading edge was assumed for the rest of thetransducers. Three transducer error levels were analyzed;these represent
1. Conventional sensors with 1-o standard error at x_0.5
percent of full scale
2. High-quality sensors with standard error at 1-o
£'0.05 percent of full scale
3. State-of-the-art sensors with standard error of 1-o
_+0.01percent of full scale
Figure 9 shows the effects of the transduction error.TheMach-number error for the conventional sensors exceeds
0.96 at Mach 12; for the high-quality sensors theMach-number error exceeds 0.36 at Mach 12. The
state-of-the-art sensors give a Mach-number eZT(Xlessthan 0.06 at Mach 12.
Once the data were corrupted with meas_ent noise,they were sampled assuming 12-bit and 16-bit resolutions.Figure 10 presents the effects of the resolution errors. TheMach-number error induced by the 12-bit resolution isnearly 0.50 at Mach 12. The 16-bit resolution gives anerrorthat is less than 0.05 at high Mach number. The effecton angle of attack is small for both resolution levels.
Collected Error Analysis: Monte-Carlo Simulation
Accuracy estimates for a state-of-the-art system wereassessed. In this system all of the error models were incor-porated. The system was assumed to have 16-bit resolu-floe, and the transducers were assumed to have a noiselevel of less than 0.01 percent of full scale. The port layoutwas according to table 1 and the initial port layout uncer-tainty was assumed to have a 1-a error of 0.05 °. Thesensor pneumatics used the configuration of table 2. Toobtain ensemble averages of the errors induced by random
input error components, the simulation was run repeatedlyand model output statistics (MOSs) were generated. Assuch the simulation can be referred to as a Monte-Carlosimulation.
The 1-a rms absolute error MOSs were listed for Machnumber, dynamic pressure, altitude, angles of attack and
sideslip, and as a function of free-stream Mach number intable 3. Presented also were the 1-o rms percentage (of
reading) error MOSs for Mach number, dynamic pressure,and altitude. As mentioned earlier, these results are contin-gent on the assumption that the aerodynamic models usedare accurate.
Even at very high altitudes and Mach numbers at whichthe thermal conditions become the most extreme, the 1-a
measurement uncertainty still was less than 0.1 for atMach 8, and less than 0.4 at Mach 12. The dynamic pres-sure measurement uncertainty was less than 5 lb/ft2 for allof the Mach numbers analyzed.
Concluding Remarks
This paper addressed feasibility and uncertainty issuesassociated with applying a flush airdata sensing (FADS)system to the hypersonic flight experiment (HYFLITE)vehicle, which is a sharp-nose configuration of the type
required for single-stage-to-orbit performance. Heatingloads to be experienced by the HYFLITE make the use ofintrusive airdata measurement devices impractical.Although the analysis in this paper was performed specifi-caUy for the HYFLITE vehicle, the methods described andthe problems analyzed are considered generally applicableto hypersonic vehicles.
14

Thisstudypresentedthephysicallayoutofacandidateflush-portmatrix,andtheeffects of various error sourceson the overall system uncertainty were evaluated using anerror simulation. In this simulation a realistic set of
pressure data was generated along the trajectory and vari-ous error sources were superimposed on the data. The
pressure data contaminated with the various error modelswere then used as input to an airdata estimation algorithmand effects resulting from the various error sources wereanalyzed by comparing the outputs of the estimation algo-rithm with the original trajectory data. Ensemble modeloutput statistics were generated, and output error magni-tudes resulting from the vadons (input) error sources werepresented as a function of Mach number.
The error sources modeled include errors introduced by
boundary-layer thickening caused by high-temperatureviscous interactions, pneumatic lag induced by the pneu-matic layout of the measurement sensors, and thermaltranspiration resulting from high-temperature molecularcreep in the pressure sensor pressure tubing. Other errorsources modeled are misalignment errors in the initialpressure matrix layout, port misalignment errors/esultingfrom thermal warping of the vehicle noseshape, samplingresolution error, and transducer sensing error. Nonequilib-riurn high-temperature gas effects and vehicle-dependenteffects, such as bending about the center of gravity andposition error, were not considered.
Simulation uncertainty estimates for a state-of-the-artsystem were presented. Even at very high altitudes andMach numbers, at which the measureanent conditionsbecome the most extreme, the 1-t_ measurement uncer-tainty still was less than 0.1 for Mach numbers up to 8,and less than 0.04 at Mach 12. The measurement uncer-
tainty of dynamic pressure was less than 5 lb/ft2 for allMach numbers.
While the results presented are contingent on theassumption that the aerodynamic models used are accu-rate, a large range of potential error sources was modeled,and the results presented are believed to represent thetypes of accuracies that can be achieved by a hypersonicflush airdata sensing (I-IY-FADS) system. This report indi-cates that the HY-FADS measurement system is not onlyfeasible for the HYFLITE vehicle, but that without
extraordinary measures it is possible to obtain sufficientlyaccurate airdata results. The pressure measurements canbe taken with very small diameter (0.01 in.) tubes to avoidproblems with surface heating. A flush airdata systemshould be considered for future hypersonic test vehicles.
References
tKock, Berwyn 1993: HYFLITE III Concept StudyResults, NASP Paper No. 1275, presented at Monterey,CA, April 13.
R3racey, William 1980: Measurement of Aircraft Speedand Altitude, NASA RP- 1046.
3Siemers, P. M., HI; Wolf, H.; and Henry, M. W. 1988:Shuttle Entry Air Data System (SEADS)----FIight Verifica-tion of an Advanced Air Data System Concept, AIAA
No. 88-2104.
'_Larson, Terry J.; and Siemers, Paul M., HI 1980:. Use ofNose Cap and Fuselage Pressure Orifices for Determina-tion of Air Data for Space Shuttle Orbiter Below Super-
sonic Speeds, NASA TP- 1643.
5Larson, Terry J.; Whitmore, Stephen A.; Ehernberger,L. J.; Johnson, J. Blair;, and Siemers, Paul M., III 1987:
Qualitative Evaluation of a Flush Air Data System atTransonic Speeds and High Angles of Attack, NASA TP-2716.
_Whitmore, S. A.; Moes, T. R.; and Larson, T. J. 1992:
High Angle-of-Auack Flush Airdata Sensing System, J.Aircraft, vol. 29, no. 5, Sept.--Oct., pp. 915-919.
7Whitmore, Stephen A.; and Moes, Timothy R. 1991:The Effects of Pressure Sensor Acoustics on AirdataDerived From a High-Angle-of-Attack Flush Airdata Sens-
ing (HI-FADS) System, NASA TM-101736.
ta,Vhitmore, Stephen A.; Moes, "l_mothy R.; andLeondes, Cornelius T. 1992: Development of a Pneumatic
High-Angle-of-Attack Hash Airdata Sensing (HI-FADS)System. Control and Dynamic Systems: Advances in The-ory and Applications, vol. 52, Academic Press, Inc., SanDiego, pp. 453-511.
Wihitmore, Stephen A.; Moes, Tunothy R. 1992: Fail-ure Detection and Fault Management Techniques for aPneumatic High-Angle-of-Attack Flush Airdata Sensing
(HI-FADS) System, NASA TM-4335.
tOAnderson, John D., Jr. 1989: Hypersonic and HighTemperature Gas Dynamics, McGraw-Hill Book Co., NewYork.
nHansen, C. Frederick 1959: Approximations for theThermodynamic and Transport Properties of High-
Temperature Air, NASA TR R-50.
nHuber, Paul W. 1963: Hypersonic Shock-Heated FlowParameters for Velocities to 46,000 Feet per Second andAltitudes to 323,000 Feet, NASATR R-163.
_3Liepman, H. W.; and Roshko, A. 1978: Elements ofGas Dynamics, 3rd ed. John Wiley & Sons, Inc.
t4Dongana, J. J.; Bunch, J. R.; Moler, C. B.; Stewart, G.W 1979: UNPACK User's Gu/de. Siam Publishing, Phila-
delphia, PA.
15

tSNOAA 1976: U. S. Standard Atmosphere, 1976.
NOAA-S/T 76-1562, Washington, DC.
16Doebelin, Ernest O. 1983: Measurement Systems,
Application and Design, 3rd ed. Mc-Graw Hill Book Co.,New York.
tTAvallone, Eugene A., ed.; and Baumeister, Theodore
ITI, ed. 1984: Marks' Standard Handbook for Mechanical
Engineers, 9th ed. Mc-Graw Hill Book Co., New York.
_SKennard, Earle, H. 1938: Kinetic Theory of GasesWith an Introduction to Statistical Mechanics. Mc-Graw
Hill Book Co., Inc., New York.
16


REPORT DOCUMENTATION PAGE For A ,rov, OMB No. 0704-0188
PulPit mpo_ng burOen lot this collecaon Of infocmatJon m estJmate(I to average 1 hour per r_, including the t_rne tor rewewlng instrocl_ns, searc_ng oxistmg ¢lala sources,
ga§lenng 1111¢Irnamtainlng the data _. and cocnpkltin 9 and reviewing the colklcbon of infomtation. Send cornmlmts regarding lh*s IDurl_m estimale or any Ofher aspect of Ibis
collecl_on of i_, inckJding suggeslions for reducing Utis btm:le_, It:) Washington H_ers Sen/Ices, Directorate for Infownabon Operel_ns attd Reflods, 1215 J=,fterson
Daws Highway, Suite 1204, Adington, VA 22202-4302, and to the Office of Management and Budget Papemork Reduction Profect (0704-O188), Washington, DC 20503
1. AGENCY USE ONLY (Leave blank) 2. REPORT DATE 3. REPORT TYPE AND DATES COVERED
June 1994 Technical Memorandum
4. TITLE AND SUBTITLE 5. FUNDING NUMBERS
Measurement Uncertainty and Feasibility Study of a Rush Airdata System for
a Hypersonic Right Experiment
6. AUTHOR(S)
Stephen A. Whitmore and Timothy R. Moes
7.PERFORMINGORGANIZATIONNAME(S)ANDADDRESS(ES)
NASA Dryden Right Research CenterP.O. Box 273
Edwards, California 93523-0273
9.SPONSORING/MONOTORINGAGENCYNAME(S)ANDADDRESS(ES)
National Aeronautics and Space AdministrationWashington, DC 20546-0001
WU 505-68-40
8. PERFORMING ORGANIZATION
REPORT NUMBER
H-2010
10. SPONSORING/MONITORING
AGENCY REPORT NUMBER
NASA TM-4627
11.SUPPLEMENTARYNOTES
This memorandum originally appeared as AIAA-94-1930 and was prepared for the Applied AerodynamicsConference, Colorado Springs, CO, June 20-23, 1994.
121. DISTRIBUTION/AVAILABIUTY STATEMENT
Unclassified--Unlimited
Subject Category 02
12b. DISTRIBUTION CODE
13. ABSTRACT (Ikudmum 200 words)
Presented is a feasibility and error analysis for a hypersonic flush airdata system on a hypersonic flight experiment
(HYFLITE). HYFLITE heating loads make intrusive airdata measurement impractical. Although this analysis is specifi-
cally for the HYFL1TE vehicle and trajectory, the problems analyzed are generally applicable to hypersonic vehicles. A
layout of the flush-port matrix is shown. Surface pressures are related airdata parameters using a simple aerodynamic
model. The model is linearized using small perturbations and inverted using nonlinear least-squares. Effects of various
error sources on the overall uncertainty are evaluated using an error simulation. Error sources modeled include boundary-
layer/viscous interactions, pneumatic lag, thermal transpiration in the sensor pressure tubing, misalignment in the matrix
layout, thermal warping of the vehicle nose, sampling resolution, and transducer error. Using simulated pressure data for
input to the estimation algorithm, effects caused by various error sources are analyzed by comparing estimator outputs
with the original trajectory. To obtain ensemble averages the simulation is run repeatedly and output statistics are com-
piled. Output errors resulting from the various error sources are presented as a function of Mach number. Final uncertain-
ties with all modeled error sources included are presented as a function of Math number.
14. SUBJECT TERMS
Airdata; Hypersonic flight; Least-squares; NASP; Parameter estimation
17. SECURITY CLASSIFICAllON 18. SECURITY CLASSIRCATION 19. SECURITY CLASSIFICATION
OF REPORT OF THIS PAGE OF ABSTRACT
Unclassified Unclassified Unclassified
NSN 7540-01-280-5500 Available from the NASA Centerfor AemSpace lnformation, 8OO EIkridge Landing Road,Linthtcum Heights, MD 21090; (301)621-0390
15. NUMBER OF PAGES
]9
16. PRICE CODE
AO3
20, UMITATION OF ABSTRACT
Unlimited
Standard Form 298 (Rev. 2-89)l=rm=dbed by/_Sl Std. Z3e-1$211e-10_