measurements of acute cerebral infarction: lesion size...
TRANSCRIPT

871
Measurements of Acute Cerebral Infarction:Lesion Size by Computed Tomography
Thomas Brott, MD, John R. Marler, MD, Charles P. Olinger, MD,
Harold P. Adams Jr., MD, Thomas Tomsick, MD, William G. Barsan, MD,
Jose Biller, MD, Robert Eberle, Vicki Hertzberg, PhD, and Michael Walker, MD
As part of a prospective therapy study of 65 patients with acute, nonhemorrhagic, cerebralinfarction, computed tomographic scans of the head were obtained at admission, 7-10 days, and3 months. The scans were analyzed for the presence, site, size, and volume measurement of theinfarction. At 7-10 days, the mean infarction volume as measured by computed tomographywas 55 cm3 or about 4x4x3.5 cm (range=0-507 cm3). At 3 months, the mean infarction volumedecreased by 25% to 41 cm3. For the 26 scans showing infarction at the time of admission, themean lesion volume was 33 cm3 at admission, 51 cm3 at 7-10 days, and 49 cm3 at 3 months. Withlesion size at 7-10 days expressed as percentage of total brain volume, the mean infarction sizewas only 5%. Of the 49 patients with lesions revealed by computed tomography at 7-10 days,20 had an infarction of 1% or less of total brain volume, while only six had an infarction of 20%or more of total brain volume. The lesion volumes as measured by the 7-10-day computedtomography correlated with the neurologic examination scores on admission (Spearman'srank-order correlation=0.78) and with the scores at 1 week (Spearman's rank-ordercorrelation=0.79). (Stroke 1989;20:871-875)
Cerebral infarction size as reflected by com-puted tomography (CT) of the brain pro-vides important clinical information.
Patients with large lesions detected after stroke areat greater risk of developing life-threatening cere-bral edema.1 They are also at greater risk forsubsequent hemorrhagic conversion, with2 or with-out heparin.3 Lesion size measured by CT is usedby clinicians to assist in prognosis,4 even thoughevidence linking lesion size to prognosis is limited.1-5
Lesion volume has not yet been correlated to theclinical neurologic examination. We describe below aprospective analysis of CT scanning in the setting ofacute cerebral infarction, carried out as part of a studyof naloxone as therapy for acute ischemic stroke.6
From the Departments of Neurology (T.B., C.P.O., R.E.),Radiology (T.T.), Emergency Medicine (W.G.B.), and Environ-mental Health (V.H.), University of Cincinnati, Cincinnati,Ohio; the Department of Neurology (H.P.A., J.B.), Universityof Iowa, Iowa City, Iowa; and the Division of Stroke andTrauma, National Institute of Neurological Disorders and Stroke(J.R.M., M.W.), Bethesda, Maryland.
Supported by United States Public Health Service, NationalInstitutes of Health, and National Institute of NeurologicalDisorders and Stroke Contracts N01-NS-2324, TO 1 (Universityof Cincinnati) and NO1-NS-2326, TO 1 (University of Iowa).
Address for reprints: Thomas Brott, MD, Department ofNeurology, University of Cincinnati Medical Center, 231 BethesdaAvenue, Cincinnati, OH 45267-0525.
Received November 7, 1988; accepted January 9, 1989.
Subjects and MethodsSixty-five patients with the clinical diagnosis of
acute ischemic cerebral infarction were examinedby CT scan without contrast at stroke onset, andwithout and with contrast at 7-10 days and at 3months. The scans were performed on either aGeneral Electric 9800 scanner or Picker scanner(600 or 1200) with a 512x512 matrix using 8-10-mmslices. The lesions' anatomic location and vasculardistribution were determined using the templates ofDamasio.7 All patients had initial CT scans within48 hours of stroke onset. The mean interval fromtime of latest progression of neurologic deficit totime of naloxone administration was 13 hours, 26minutes (SD=10 hours, 11 minutes).
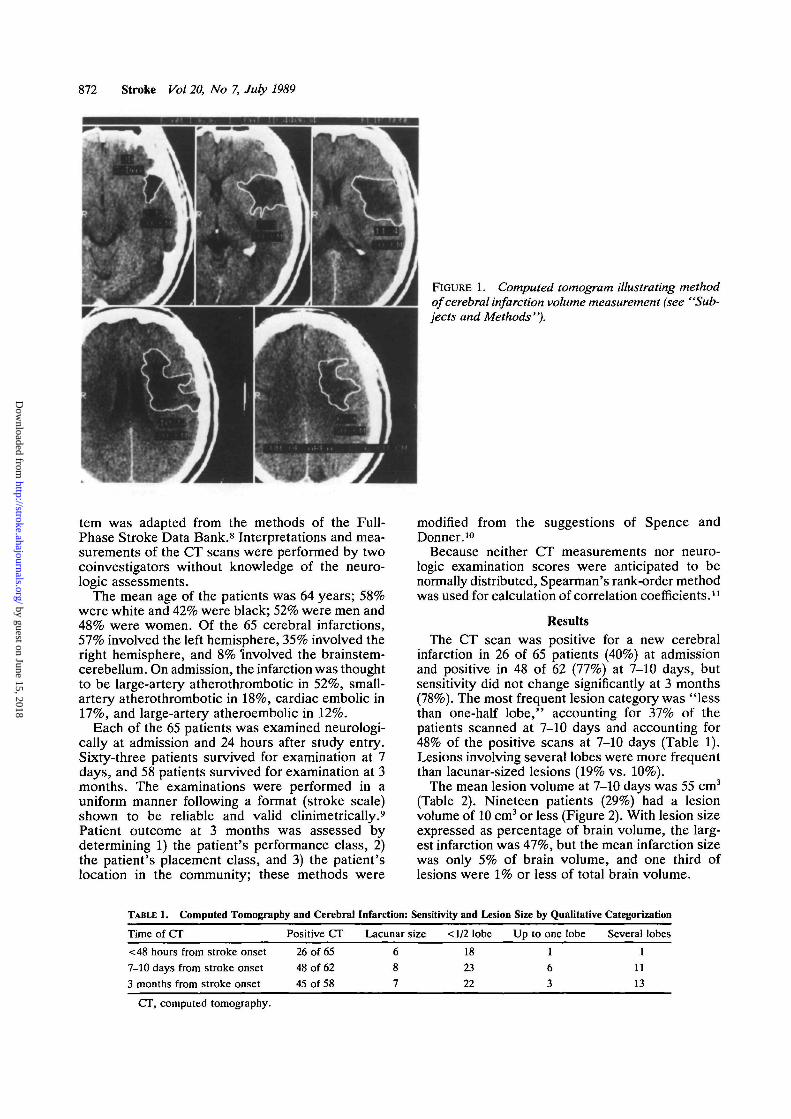
Lesion size was measured directly: the area ofabnormal low attenuation was traced on each CTslice, and the area was summed for the slicesshowing the infarct (Figure 1). The volume wasderived from the area and the slice thickness. Foreach CT slice, the total brain parenchyma area wasalso measured, and then the total brain parenchymavolume was calculated. Lesion size was also mea-sured qualitatively as normal, lacunar, less thanone-half lobe, up to one lobe, and several lobes(e.g., a lesion less than one-half lobe in size butinvolving two different anatomic lobes was scoredas less than one-half lobe). The measurement sys-
by guest on June 15, 2018http://stroke.ahajournals.org/
Dow
nloaded from
872 Stroke Vol 20, No 7, July 1989
FIGURE 1. Computed tomogram illustrating methodof cerebral infarction volume measurement (see "Sub-jects and Methods").
tem was adapted from the methods of the Full-Phase Stroke Data Bank.8 Interpretations and mea-surements of the CT scans were performed by twocoinvestigators without knowledge of the neuro-logic assessments.
The mean age of the patients was 64 years; 58%were white and 42% were black; 52% were men and48% were women. Of the 65 cerebral infarctions,57% involved the left hemisphere, 35% involved theright hemisphere, and 8% 'involved the brainstem-cerebellum. On admission, the infarction was thoughtto be large-artery atherothrombotic in 52%, small-artery atherothrombotic in 18%, cardiac embolic in17%, and large-artery atheroembolic in 12%.
Each of the 65 patients was examined neurologi-cally at admission and 24 hours after study entry.Sixty-three patients survived for examination at 7days, and 58 patients survived for examination at 3months. The examinations were performed in auniform manner following a format (stroke scale)shown to be reliable and valid clinimetrically.9
Patient outcome at 3 months was assessed bydetermining 1) the patient's performance class, 2)the patient's placement class, and 3) the patient'slocation in the community; these methods were
modified from the suggestions of Spence andDonner.10
Because neither CT measurements nor neuro-logic examination scores were anticipated to benormally distributed, Spearman's rank-order methodwas used for calculation of correlation coefficients.11
ResultsThe CT scan was positive for a new cerebral
infarction in 26 of 65 patients (40%) at admissionand positive in 48 of 62 (77%) at 7-10 days, butsensitivity did not change significantly at 3 months(78%). The most frequent lesion category was "lessthan one-half lobe," accounting for 37% of thepatients scanned at 7-10 days and accounting for48% of the positive scans at 7-10 days (Table 1).Lesions involving several lobes were more frequentthan lacunar-sized lesions (19% vs. 10%).
The mean lesion volume at 7-10 days was 55 cm3
(Table 2). Nineteen patients (29%) had a lesionvolume of 10 cm3 or less (Figure 2). With lesion sizeexpressed as percentage of brain volume, the larg-est infarction was 47%, but the mean infarction sizewas only 5% of brain volume, and one third oflesions were 1% or less of total brain volume.
TABLE 1. Computed Tomography and Cerebral
Time of CT
<48 hours from stroke onset
7-10 days from stroke onset
3 months from stroke onset
Positive CT
26 of 65
48 of 62
45 of 58
Infarction:
Lacunar
687
Sensitivity and Lesion
size < 1/2 lobe
18
23
22
Size by Qualitative
Up to one lobe
1
6
3
Categonzation
Several lobes
11113
CT, computed tomography.
by guest on June 15, 2018http://stroke.ahajournals.org/
Dow
nloaded from

Brott et al Measuring Cerebral Infarction 873
TABLE 2. Computed Tomography and Cerebral Infarction: Sensitivity and Infarction Size by Volume
Time of CT
<48 hours from stroke onset7-10 days from stroke onset3 months from stroke onset
n=65.CT, computed tomography.
CTs showinginfarction (%)
26 of 65 (40%)48 of 62 (77%)45 of 58 (78%)
Mean volume ofinfarction by CT (cm3)
14 (range 0-238)55 (range 0-328)41 (range 0-291)
Mean size of infarction(% of total brain volume)
1.0%4.4%3.3%
After excluding patients with normal CTs at base-line, the mean increase in lesion volume during the1st week was 18 cm3 (54%) (Table 3). Lesionvolume decreased by 25% between the 1st weekand 3 months when considering all patients, but itdid not decrease significantly for patients with aninitially positive CT (Table 3).
The infarction was shown by CT at 7-10 days toinvolve the middle cerebral artery distribution in 40of the 49 positive scans (82%) (Table 4). The CTscans did not demonstrate a lesion in four of theseven patients diagnosed clinically as having brain-stem infarctions. At 7-10 days, contrast enhance-ment was identified in 22 of the 49 positive scans(45%) (Table 5). Mass effect was seen in 37% of allscans at 7-10 days and in 47% of the positive CTs(Table 5).
The Spearman's rank-order correlation betweenthe stroke scale score at 7 days and the CT scanlesion volume at 7-10 days was 0.74 (Table 6). Afterconverting the lesion volume to a ratio of total brainvolume, the lesion size-scale score correlation was0.76 (p<0.0001). The admission neurologic deficitas measured by the stroke scale also correlatedstrongly with the 7-10 day CT lesion volume (r=0.74,
301-400
201-300
101-200
U J
FIGURE 2. Bar graph of cerebral infarction volumes at7-10 days (as measured by computed tomography), cat-egorized by size. Mean lesion volume was 55 cm3, and78% of scans showed infarction.
/?<0.0001). Correlations between infarction volumeand neurologic deficit were the same regardless ofthe cerebral hemisphere involved (r=0.72 for lefthemisphere, r=0.74 for right hemisphere).
DiscussionThe quantitative assessment of CT lesion volume
for acute stroke patients provides an objectivemeasure of ischemic cerebral infarction. At 7-10days the mean lesion volume was 55 cm3 or about4x4x3.5cm. Fourteen patients had no detectablelesion at 7-10 days (22%), and 19 patients had avolume of 10 cm3 or less (29%). Mean infarction sizewas only 4.4% of total brain volume (Table 2), and20 of the 65 patients had a lesion size of 1% or lessof total brain volume.
For future stroke therapy trials, comparison ofthe infarction volumes for the treated patients withthose of the control patients could provide objectivemeans of assessment. If a treatment is found effec-tive, the CT measurements in the study could alsoallow comparisons among treated patients to deter-mine any selectivity for that treatment. For exam-ple, analysis may reveal the therapy to be primarilyeffective for patients with lesions below a particularvolume.
The validity of the volumetric method is suggestedby the relation of the infarction volumes to the othermethods of patient assessment. The neurologic def-icit at 7 days correlated highly with the volume ofinfarction measured by CT at 7-10 days (Spearman'srank-order correlation coefficient=0.74). Patient out-come at 3 months also correlated with the CT lesionvolume at 7-10 days (/-=0.54). Of further interest, theneurologic deficit present on admission also corre-lated strongly to the 7-10 day CT lesion volume(r=0.74). This implies that for many stroke patientsthe first neurologic examination could be a predictorof subsequent tissue loss as later shown by CTmeasurement. The clinical deficit-infarction volumecorrelations also provide incentive for further analy-sis and improvement of neurologic examinationscales. For example, examination items that have nocorrelation to CT lesion size could be deleted.
We recognize that infarction location may bemore important for some patients than infarctionvolume in determining the eventual clinical handi-cap. Certain brain regions have classically beenthought more important or "eloquent" than others.12
We might agree, for example, that a given volume
by guest on June 15, 2018http://stroke.ahajournals.org/
Dow
nloaded from
874 Stroke Vol 20, No 7, July 1989
TABLE 3. Lesion Volume Serially in Patients With Positive Baseline Computed Tomography
Time of CT
<48 hours from stroke onset7-10 days from stroke onset3 months from stroke onset
n=26.CT, computed tomography.
Volumerange
0.3-238cm3
0-327cm3
0-291cm3
Meanvolume
33 cm3 (SD 60.4)51 cm3 (SD 76.1)49 cm3 (SD 67.0)
Mean size of infarction(% of brain volume)
2.74.03.5
of cerebellum is less important than the same vol-ume of left perisylvian cortex. However, compari-sons today among most brain regions would bedifficult if not arbitrary. We would rather proceedfrom the assumption that all brain regions are nearlyequal in importance regardless of location but thatsome regions are more difficult to test than others.Volume measurements do not require value judg-ments. More important, perhaps, effective thera-pies for acute cerebral infarction are not likely tochange lesion location. Effective therapies will beeffective by their ability to decrease infarction size.
The results from the categoric method of infarc-tion size measurement did not accurately describeour population. The infarction volume distributionshowed a preponderance of very small lesions witha gradual transition to larger ones. The breakdownof lesion size by categories resulted in few verysmall lesions, with a preponderance of lesions largerthan lacunar size but smaller than one-half lobe insize (Table 1). We suspect a reluctance to label aninfarction "lacunar"; if the lacunar category hadbeen designated as "small, deep infarct," thensmaller infarcts may have been more appropriatelycategorized.
In the setting of acute stroke, analysis of lesionsize as measured by CT has been limited. Correla-tion of aphasia severity and lesion volume13-15 aswell as correlation between nonverbal performanceand lesion volume13 have been demonstrated. Cor-relation between upper limb weakness and lesionvolume (r=0.59) and between presence of a lesionin the corticospinal system and lesion volume(r=0.75) have also been reported.16 Yamaguchi et alestimated infarction size by comparing the area ofCT hypodensity with the area measured by CT ofthe affected cerebral hemisphere, deriving whatthey called an infarct index.17 Infarctions thought tobe embolic were more than twice as large as infarc-
TABLE 4.' Cerebral Infarction Arterial Distribution Measured byComputed Tomography at 7. Days
Arterial distribution
Anterior cerebral arteryMiddle cerebral arteryPosterior cerebral arteryInternal carotid arteryVertebrobasilar
Total positive
i40
143
Positive scans (%)
282286
CT, computed tomography.
tions thought to be thrombotic («=209). The infarctindex was not compared to a detailed neurologicexamination.
As has been reported in previous studies,5-18 wefound CT sensitivity at 7-10 days to be considerablyhigher for infarction (77%) than CT sensitivity atadmission (40%). Not previously reported, this CTsensitivity did not decline at 3 months (78%) asmight have been expected (Table 2). The increase ininfarction size (mean 54%) over the 1st week inthose patients with initially positive scans was not asurprise, but the modest change in size thereafter(25% decrease at 3 months for all patients) wasencouraging. We conclude that the timing for CTsperformed in future therapy studies to detect andmeasure cerebral infarction may involve a generouswindow from 1 week or earlier to 1-3 months.Prospective therapy studies may require only twoCT scans, one at admission to rule out hemorrhageand one at a later date (e.g., 1-2 weeks) for optimalinfarction detection and measurement.
Our study has several limitations. Interrater reli-ability of the CT scan volume measurements wasnot assessed, and the 65 stroke patients may havehad somewhat smaller infarctions and less severeneurologic deficits than the general acute strokepopulation (e.g., our patient mortality at 3 monthswas 8%). All patients received a 24-hour infusion ofnaloxone, which could have affected lesion imaging(we were unable to detect any positive or negativeclinical effects that may have had a bearing onlesion size). Finally, the correlations reported shouldbe interpreted cautiously, given the wide range ofthe CT infarction volumes and the clustering ofpatients with normal CT scans.
Measurements of cerebral infarction will becomeincreasingly important as effective early treatmentoptions are developed. Clinical assessment tech-niques will continue to miss silent cerebral infarc-tions.19"21 Likewise, high-resolution CT scannerswill continue to miss clinically significant cerebralinfarctions.5 With magnetic resonance imaging,greater sensitivity is possible, but imaging may beless specific.22 We suggest that clinical and ana-tomic measures of cerebral infarction are funda-mentally complementary and that neither measure-ment approach can be adequately evaluatedindependent of the other.
AcknowledgmentsThe authors wish to thank Drs. Carlos Kase,
Oscar Reinmuth, and Percy Karanjia for their assis-
by guest on June 15, 2018http://stroke.ahajournals.org/
Dow
nloaded from

Brott et al Measuring Cerebral Infarction 875
TABLE 5. Edema, Mass Effect, and Contrast Enhancement Measured by Computed Tomography
Time of CT
<48 hours from stroke onset7-10 days from stroke onset3 months from stroke onset
n=65.CT, computed tomography.
TABLE 6. Spearman's Rank-Order
Time of CT
<48 hours from stroke onset7-10 days from stroke onset3 months from stroke onset
No. with infarct
264945
Edema
No. (%)
16 (62)29 (59)
1 (2)
Correlation of Infarction Volume
Neurologic exam onadmission
w0.350.78*0.76*
Mass effect
No. (%)
10 (38)23(47)0
(cm3) to Neurologic
Neurologic exam at1 week
M0.28*0.79*0.70*
Contrast enhancement
No. (%)
CTs noncontrast22 (45)2 (4)
Deficit
Neurologic exam at3 months
(r)0.38*0.68*0.62*
CT, computed tomography.*p<0.0001.
tance in design of the CT assessment methods andthe stroke scale (neurologic examination and scale).
References1. Ropper AH: Lateral displacement of the brain and level of
consciousness in patients with an acute hemispheral mass. NEnglJMed 1986;314:953-958
2. Cerebral Embolism Study Group: Cardioembolic stroke,early anticoagulation, and brain hemorrhage. Arch InternMed 1987;147:636-640
3. Lodder J: CT-detected hemorrhagic infarction; relation withthe size of the infarct and the presence of midline shift. AdaNeurol Scand 1984;70:329-335
4. Kinkel WR, Jacobs L: Computerized axial transverse tomog-raphy in cerebrovascular disease. Neurology 1976;26:924-930
5. Tatemichi TK, Mohr JP, Rubinstein LV, Kase CS, NicholsFT, Price TR, Wolf PA: CT findings and clinical course inacute stroke: The NINCDS Pilot Stroke Data Bank (abstract).Stroke 1985;16:138
6. Adams HP Jr, Olinger CP, Barsan WG, Butler MJ, Graff-Radford NR, Brott TG, Biller J, Damasio H, Tomsick T,Goldberg M, Spilker JA, Berlinger E, Dambrosia J, Biros M,Holleran R: A dose escalation study of large doses ofnaloxone for treatment of patients with acute cerebral isch-emia. Stroke 1986;17:404-409
7. Damasio H: Vascular territories denned by computed tomog-raphy, in Wood JH (ed): Cerebral Blood Flow. New York,McGraw-Hill Book Co, 1987
8. Shinar S, Gross CR, Hier DB, Caplan LR, Mohr JP, Price TR,Wolf P, Kase CS, Fishman IG, Barwick JA, Kunitz SC:Interobserver reliability in the interpretation of computed tomo-graphic scans of stroke patients. Arch Neurol 1987;44:149-155
9. Brott T, Adams HP, Olinger CP, Marler JR, Barsan WG,Biller J, Spilker J, Holleran R, Eberle R, Hertzberg V,Rorick M, Moomaw CJ, Walker M: Developing measure-ments of acute cerebral infarction: A clinical examinationscale. Stroke 1989;20:864-870
10. Spence JD, Donner A: Problems in design of stroke treat-ment trials. Stroke 1982;13:94-99
11. Hollander M, Wolfe DA: Nonparametric Statistical Meth-ods. New York, John Wiley & Sons, Inc, 1973, pp 191-192
12. Spetzler RF, Martin NA: A proposed grading system forarteriovenous malformations. JNeurosurg 1986;65:476-483
13. Kertesz A, Harlock W, Coates R: Computer tomographiclocalization, lesion size, and prognosis in aphasia and non-verbal impairment. Brain Lang 1979;8:34-50
14. Naeser MA, Hayward RW, Laughlin SA, Zatz LM: Quan-titative CT scan studies in aphasia. I. Infarct size and CTnumbers. Brain Lang 1981;12:140-164
15. Knopman DS, Seines OA, Niccum N, Rubens AB, Yock D,Larson D: A longitudinal study of speech fluency in aphasia:CT correlates of recovery and persistent nonfluency. Neu-rology 1983;33:1170-1178
16. Knopman DS, Rubens AB: The validity of computed tomo-graphic scan findings for the localization of cerebral func-tions. Arch Neurol 1986;43:328-332
17. Yamaguchi T, Minematsu K, Choki J, Ikeda M: Clinical andneuroradiological analysis of thrombotic and embolic cere-bral infarction. Jpn Circ J 1984;48:50-58
18. Inoue Y, Kazamasa T, Miyamoto T, Yoshikawa N, Tanigu-chi S, Saiwai S, Nishimura Y, Komatsu T: Sequentialcomputed tomography scans in acute cerebral infarction.Radiology 1980;135:655-662
19. Turnbull IW, Bannister CM: CT observations on the naturalhistory of asymptomatic cerebral infarction following tran-sient ischemic attacks. Neurol Res 1985;7:190-193
20. Awad I, Modic M, Little JR, Furlan AJ, Weinstein M: Focalparenchymal lesions in transient ischemic attacks: Correla-tion of computed tomography and magnetic resonance imag-ing. Stroke 1986;17:399-403
21. Berguer R, Sieggreen MY, Lazo A, Hodakowski GT: Thesilent brain infarct in carotid surgery. / Vase Surg 1986;3:442-447
22. DeWitt LD, Kistier JP, Miiier DC, Richardson EP, Buo-nanno FS: NMR-neuropathologic correlation in stroke. Stroke1987;18:342-351
KEY WORDS • cerebral infarction • neurologic examination •tomography, emission computed
by guest on June 15, 2018http://stroke.ahajournals.org/
Dow
nloaded from

Hertzberg and M WalkerT Brott, J R Marler, C P Olinger, H P Adams, Jr, T Tomsick, W G Barsan, J Biller, R Eberle, V
Measurements of acute cerebral infarction: lesion size by computed tomography.
Print ISSN: 0039-2499. Online ISSN: 1524-4628 Copyright © 1989 American Heart Association, Inc. All rights reserved.
is published by the American Heart Association, 7272 Greenville Avenue, Dallas, TX 75231Stroke doi: 10.1161/01.STR.20.7.871
1989;20:871-875Stroke.
http://stroke.ahajournals.org/content/20/7/871World Wide Web at:
The online version of this article, along with updated information and services, is located on the
http://stroke.ahajournals.org//subscriptions/
is online at: Stroke Information about subscribing to Subscriptions:
http://www.lww.com/reprints Information about reprints can be found online at: Reprints:
document. Permissions and Rights Question and Answer available in the
Permissions in the middle column of the Web page under Services. Further information about this process isOnce the online version of the published article for which permission is being requested is located, click Request
can be obtained via RightsLink, a service of the Copyright Clearance Center, not the Editorial Office.Stroke Requests for permissions to reproduce figures, tables, or portions of articles originally published inPermissions:
by guest on June 15, 2018http://stroke.ahajournals.org/
Dow
nloaded from