measurements of pressure fluctuations on the surface of a...
TRANSCRIPT
MINISTRY OF AVIATION
AERONAUTICAL RESEARCH COUNCIL
CURREN J PAPERS
Measurements of Pressure Fluctuations
on the Surface of a Delta Wing
V. Krishnamoorthy
LONDON: HER MAJESTY’S STATIONERY OFFICE
1965
SIX SHILLINGS NET


C-P. No. 767
August, 1963 MEASURF,M.ENTS OF PRESSURE FLUCTUATIONS
ON TEE SURFACE OF A DELTA WING
V. Krishnsmoorthy
Measurements have been made of the r.m.s. levels, spectra and space correlations of the surface pressure fluctuations on a 76O sharp edged delta wmg at lm inoidences. The peak r.m.s. value was found to be 3-7 times that for the O" incidence and occurred under the main vortex at 2O inculenoe. The forms of the spectra were found to be not dissimilar to that for O" incidence. Thu suggests that the fluctuations arise from the boundary l?yer modified by the vortex. semi-span.
The correlation radius was found to be about ?th of the local However, correlation lengths for discrete frequencies oouldbe twice
as large as this.
List of Contents
1.
2.
3.
3.1
3.2
3.3
3.4
4.
Introduction . . . . . . . . . . . .
Experimental Apparatus . . . . . . . . . .
DIscussion of Experiments end Results . . . .
The Nature of the Boundary Lwer used in the Investigation . . . . . . *. . . . .
Measurements of the R.M.S. Value of Fluctuating Pressures on the Wing . . . . . . . . . .
Frequency Spectra of the Pressure Fluctuations
Space Correlation Measurements of the Pressure Fhhmtions . . . . . . 0. . . . .
Conclusions . . . . . . . . . . . .
AcknovJledgements . . . . . . . . . . .O
,
Ljst of symbols . . . . . . . . . . 0.
References . . . . . . . . . . . .
Figures 1-18
. .
.D
.O
a.
.o 2&3
. . 3,4&5
.O ~68~7
.O 7
00 7
. . 8&Y
10 . .
Page No.
2
.
Replaces A.A.S.U. Report No. 246 - A.R.C.25 640.


-l-
1. Introduction
Experiments by T. B. Owen of R.A.E. (unpublished) on a slender delta wing with sharp leading edges showed that appreciable pressure fluctuations were present on the upper surface at low incidences. There was a characteristic increttse in the intensity of pressure fluctuations immediately beneath the vortex and also in the region between the secondary separation line and the leading edge. For low Mach numbers a peak value of about three times the two-dimensional turbulent boundary layer of r.m.s. pressure fluctuations occurred at an angle of incidence of 200 It was also ford that the amplitude of these pressure fluctuations depended on Reynolds number and the method of fixing transition.
The unsteady loading due to the leading-edge vortex and the effects of the boundary-layer noise are of great interest from the fatigue point of view. The response of an aeroplane and its structures to these pressures depends upon the space correlations as well as intensity levels and frequency spectra. The only surface ressure correlation measurements so far reported were made by Judd and Jones P and they covered a wide incidence range starting from 12O up to the vortex breakdown.
The present investigation was undertaken to determine mere accurately the levels and frequency spectra of the fluctuating pressures at the wing surface and to find the correlation areas of the pressures particularly at low incidence.
2. Experimental Apparatus
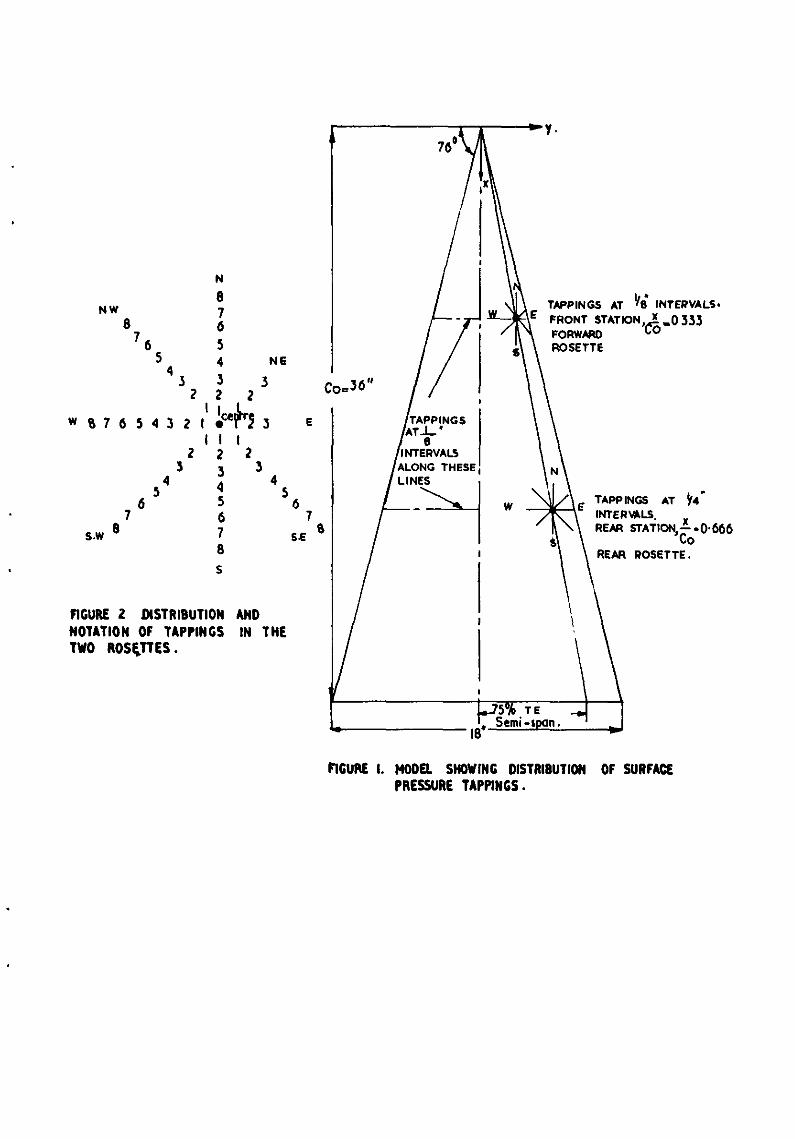
. Measurements were made on a 76 o delta wing in the University of Southampton 7$ ft x 5& ft wind tunnel. The turbulence of the axial velocity component was measured to be &F/h 2: a x I@ The model was a shq edged flat plate wing with a chamfered under-surface. Hypodermic tubes of O-049 in. outside diameter were inserted flush with the upper-surface of the wing but proJecting on the under-side. The distribution of the pressure tappings is shown in Figs. 1 and 2. The fluctuating pressures at the tappings were detected using two matched probe microphones butt-cocnected to the proJectIon and sealed by plastic sleeves. The microphcr,e dimensions and construction are described by Franklin and Archbold and they were built around a one inch Bruel and Kjaer condenser capsule type 4111.
The probes were calibrated by cornparIng their outputs with that of a calibrated standard Bruel and Kjaer microphone when subjected to the same noise scurce - in this case a loud speaker in an anechoic chamber. The loud speaker was fed from a white noise generator. The signals from the transducers were fed to the main microphone amplifiers, which had a gain characteristic rising at +6d~ per octave to compensate for the fall in response of the probes, via pre-amplifiers. The sensititities &the transducers were found to be Il.48 mv/~ bar and 14.10 mv/fl bar respectively with full gain on. Attenuation of gain was possible in steps of 1OdL .The frequency response of
. the probe and microphone amplifier combination was very nearly flat from 50 c/s to 3 000 c/s. The capsule.? of the transducers were designed to work in a region of atmospheric static pressure but tests showed that there was
t negligible effect on their calibrations at the tunnel speed.3 used.
The root-mean-square measurements of the pressure fluctuations were made by a Dawe type true r.m.s. meter. For spectral density measurements, the amplified signals from the pressure transducers were recorded on a Vortexion
tape/
-2-
tape recorder which ha8 a near flat frequency response up to 15 Kc/s. The recOrded signal was analysed by a Muirhead Pamatraaa narrow ban& wave analyser which covered. a frequency range of 20 c/s to 20 KC/S. The effective band width of the analyser was 0*0&i? times the mi&ba& width frequency.
For correlation measurements, the fluctuating pressures at various points on the wing surface were recorded on a twin-channel magnetic tape recorder. The recorder was calxbrated. and it was established that recording and replaying of the signals introduced no time delay in the two channels. The records were later analysed in the University of Southampton correlator3. This is an analogue computer and calculates space, auto and cross-correlation coefficients between any pair of signals. The correlator was calibrated by forming the auto-correlation of sine waves.
3. Discussion of Experiments end Results
3.1 The nature of the boundary layer used in the investigation
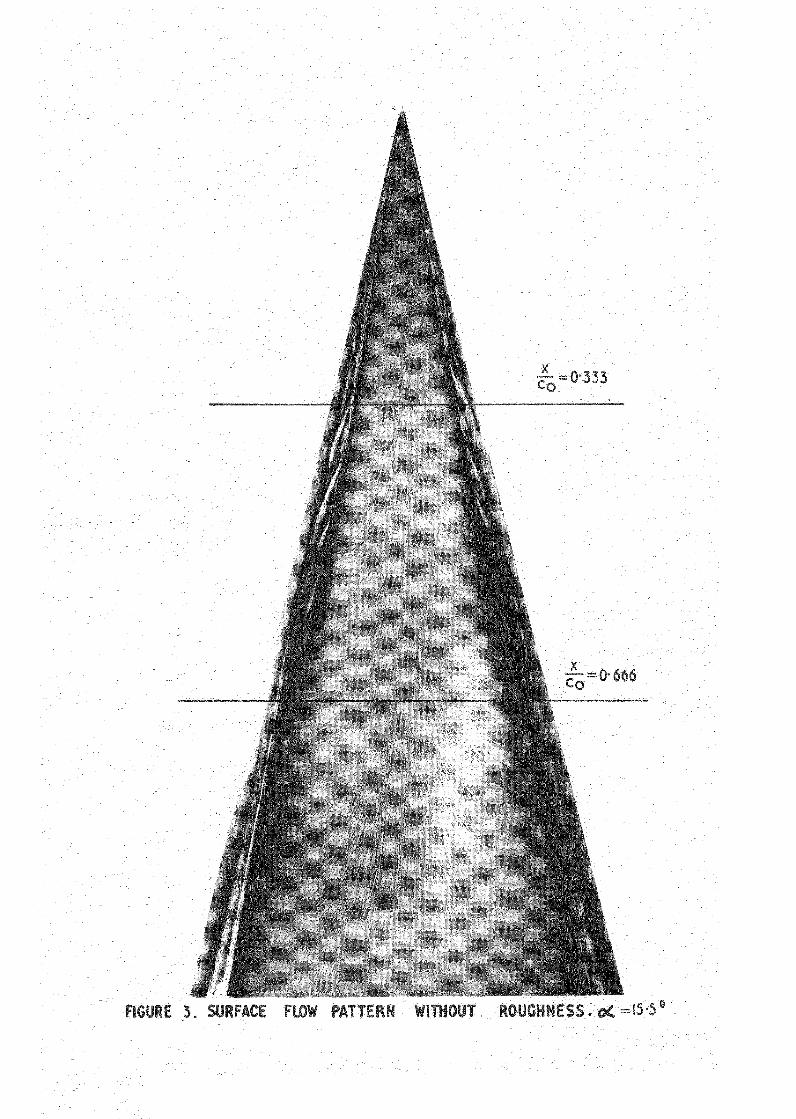
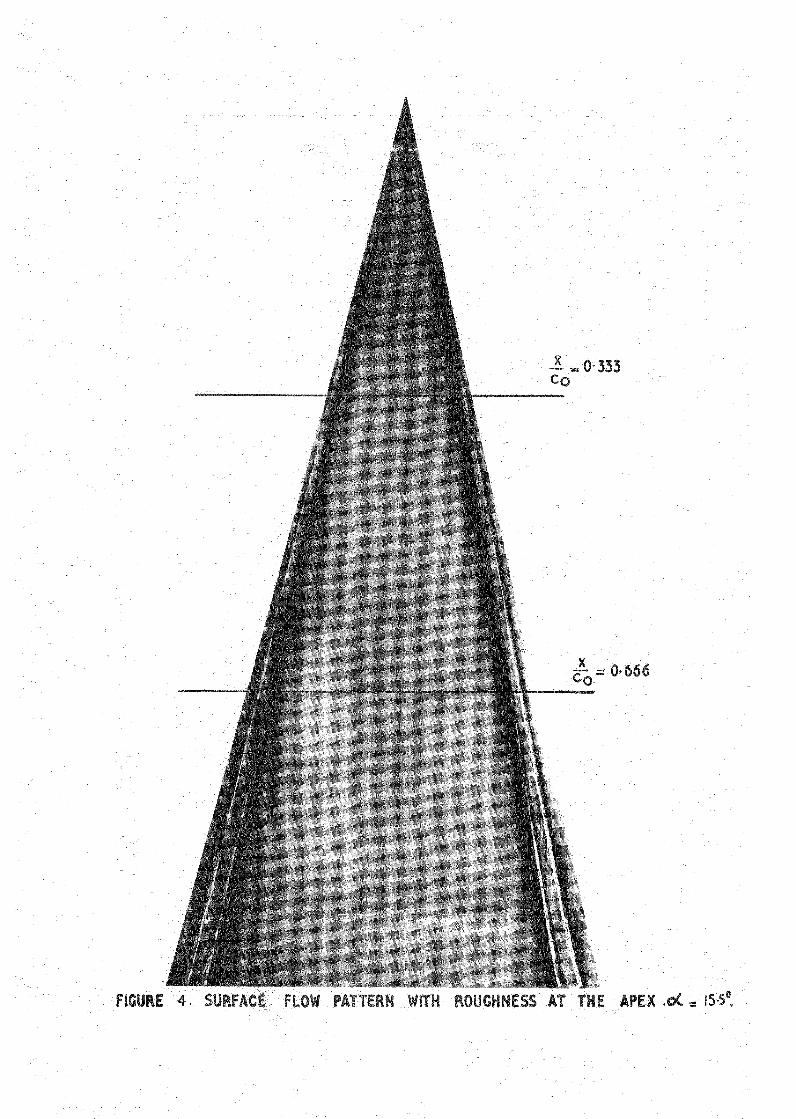
The first problem was to ensure that the boundary lsyer over the wing was fully turbulent, es would be the case for a full-scale wing. The majority of the tests were conducted at a speed of 110 ft/sec. and the Reynolds number based on the wing root chord was 2'2 x IO'. Since natural transItion was occurring over parts of the wing at this Reynolds number, the boundary layer was tripped by applying distributed roughness at the apex of the wing. Carborundum Powder (grade 60) was applied at the 1eadLng edges up to 5% chord. Flow visualisation experiments using the technique& of Saturn Yellow pigment and Ultra-violet light confirmed that the boundary layer was turbulent over the wing for the inoidenoes required. Figs. 3 and 4 show the flow pattern over the wing witho& and with roughness at the apex. Without roughness transition occurred as far back as 35% of the root chord at an incidence of 15-5O. There are pronounced kinks in the secondary separation line suggesting that transition disturbs only the secondary region but not the main vortex flow pattern. With roughness on, the transition point moved forward and occurred at some point close to the apex, the precise location of which was a function of the model incidence.
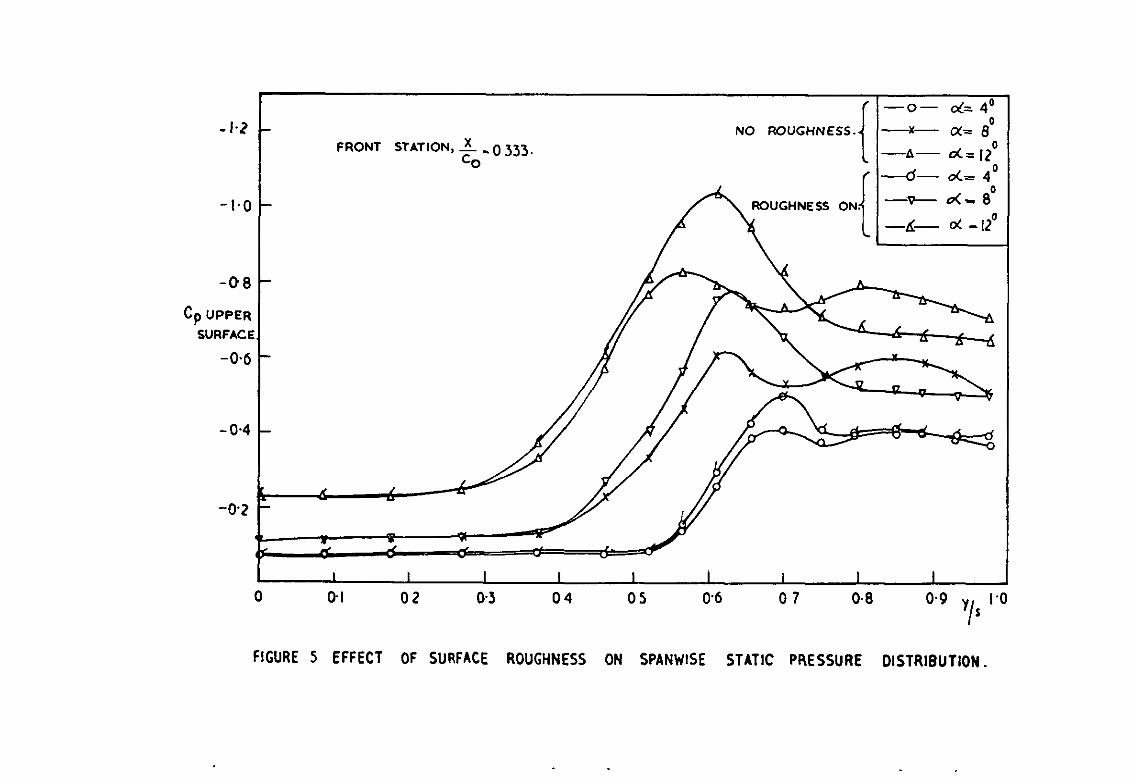
The effect of roughness on the spanwise static pressure distribution for the front station (x/c, = O-333) is shown in Fig. 5. When there is no roughness, a marked double peak corresponding to the main and secondary vortices is found. With roughness, the suction peak under the main vortex increases and the secondary peak tends to become flat. For the rear station (x/c, = O-666) at all incidenoes, the pressure distribution was unaffected by roughness since transxtion had already occurred upstream.
3.2 Measurements of the r.m.s. values of the fluctuating Pressures on the wing
The results for the r.m.s. pressure fluctuations,measured across the wing at various incidences are shown in Figs. 6 and 7 for the two chord- wise positiors. Roughness was used and the results are presented as G/L against spanwise position. The pressure tappings were at close intervals extending as close as practicable to the leading edge.
For/

-3-
For the front station, it is seen from Fig. 6 that at O" incidence the value of Q/L was O-0066 and remained constant up to y/s = 0.75. There was a gradual increase then in level towards the leading
edge. This might be due to the local skin friction coefficient which is a function of the local Reynolds number being higher outboard than for the inboard tappings. Alternatively the wing may not have been at a true O" incidence. At 2O incidence, there was a large rise in pressure fluctuation level and two peaks were observed between the attachment line and the leading edge. These peeks ere probably caused b The absolute peek value reached was value.
q&yg, ggf :~~~~y~,~"~;~";:' With increase in incidence the curves broadened with reduced peak
-.W.h3S. The mein peak moved inwards, but the seoondery peak appeared to settle at y/s = 061 at 60 end beyond this angle there was very little
movement. The trough between the peaks became more pronounced at higher incidences. This is probably because the tappings lie just under the outboard edge of the main vortex. There was better agreement in correlating the main peak r.m.s. level with the point of inflexion of the flow visualisation end static spanwise pressure distribution tests - than for correlating the secondary peak with the secondary separation line.
Fig. 7 shows that at O", G/s, = 0*0068 for the reer station and remains constant up to y/s = 0.79 and then increases at the outer
tappings. At 2O incidence the peak r.m.s . was 090252, 3.7 times the O" value. As before, the two peak levels correspocding to the main end secondary vortices decrease with increasing inoidenoe. The inward movement of the main peak followed the points of inflexion of the stream lines of the main vortex but the secondary peek had only fair agreement with the secondary se eratlon line as seen from the flow visualieation tests. 4/g,
At 8O, the peak had a value slightly higher then twioe the O" level.
To determine the effect of roughness on the fluctuation levels, tests were conducted with no roughness at the apex. The r.m.s. values across the vortex are shown in Fig. 8 for the front station at two angles of incidence. The values in the secondary separation region show a much higher level without roughness than with roughness on.
3.3 Frequency spectra of the pressure fluctuations
The fluctuating pressure on a flat plate is assumed to be a stationary random function of time t and position x, so The x end z axes lie in the plane of the plate, with x increasing in the stream direction. Using the properties of stationery random functions, the correlation or covarience of the pressure is
"PP ( xl,xi*r) =
P(x,s,t) p(x+xI,.s+x3, t+T) . ..(I)
p"(x,e,t) p"(x+xi, z+xa, t+T)
-4-
and the Fourier transform of the auto-correlation of the pressure is defined bY
7 Rpp (O,O,f) = E(o) cos UT do.
O,O,T) 00s w al.
. ..(z)
. ..(3)
E(U) is the power spectral density of the pressure fluctuation as measured by a wave analyser.
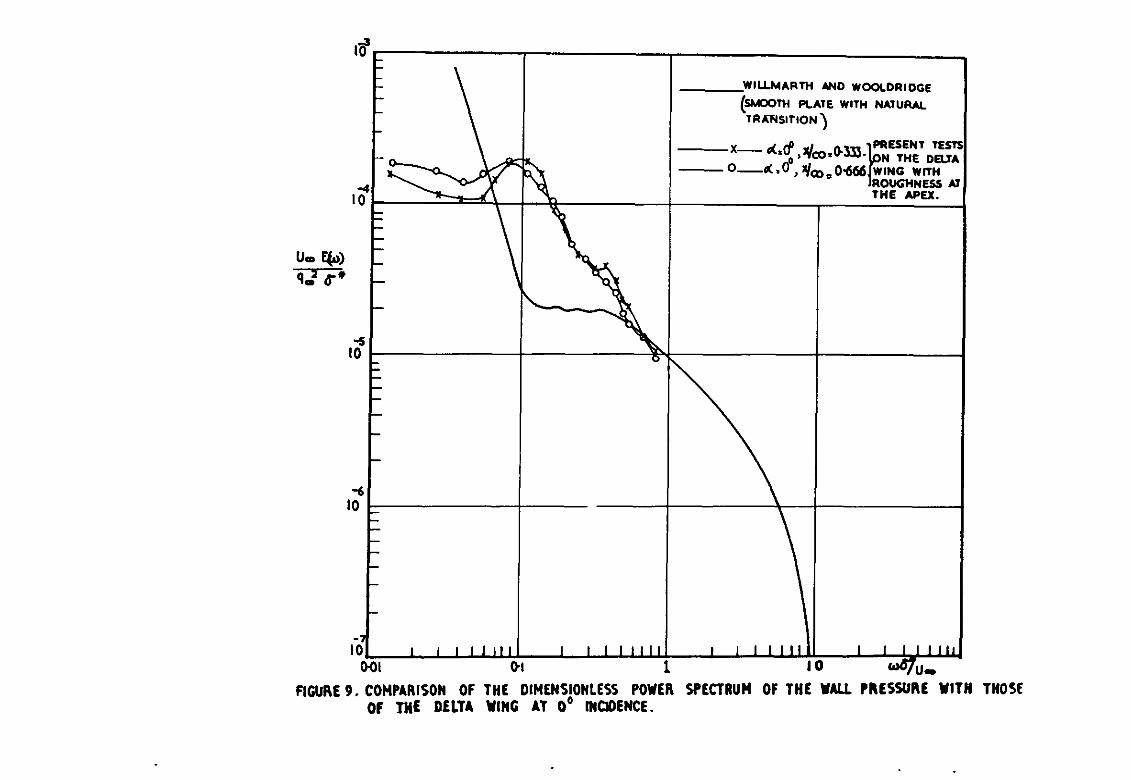
The spectral measurements were made with the same probe microphones as were used for the r.m.s. measurements. At O" incidence the spectra were measured at the centre line of the wing at the front and. rear stations with roughness fixed at the apex. Since there was no flow separation at the leading edge and the flow direction remained chordwise everywhere the boundary layer on the wing could be approximated to a two-dimensional turbulent boundary lwer growing on a flat plate.
The power spectrum of the delta wing at O" incidence is shown in dimensionless form in Fig. 9. The velooity profiles were measured at both stations and the displacement thicknesses calculated. The tests covered a
di* frequency range of O-0136 < - < 0.816. Frequencies higher than this could
UCX3 not be covered because of the limitations of the transducer frequency response characteristics. But it is seen that this range sweeps the main energy content in the spectrum. When the power spectra of the wing are compared with the wall pressure spectrum of Willmarth andWooldridge5 in Fig. 9, it is found that the wing spectra are fairly flat at low frequencies but higher in levels than that ofWill.marth. Willmarth's measurements were made in a thick boundary leyer developed on a smooth surface with natural transition. On a rough plate Willmarth found the r.m.s. levels to be 0.007 and 0.0066 for two wind speeds as against 0.00466 for the smoothwall. Hence the spectrum levels for the rough condition should be higher than the wall power spectruln of Fig. 9. At the upper end of the frequency spectra, the levels for the delta wing tend to fall more rapiXl.y than the wall pressure levels. This may be due to the fall off in sensitivity of the probes at higher frequencies.
The spectral measurements were taken on different occasions and found repeatable. A series of tests were conducted to find the effect on the pressure transducers of extraneous signals such as the sound field in the test section and the support vibrations. To determine the effectiveness of the mounting, the probes were sealed from the boundary-layer pressure fluctuations while the wind was on. The signals produced by the vibration of the mounting amounted to 1% of the r.m.s. wall pressure fluctuations.
To determine the noise level inside the tunnel a Bruel and Kjaer $ in. diameter microphone was installed in a bullet shaped wind shield. The shield had .a band of fine gauze placed along the parallel portion so that the wind was not directly onto the diaphragm. The microphone was facx.ng downstream with its diaphragm norn,al to the flow. The spectrum of the sound field was measured in a frequency band of 50 c/s to 10 000 C/S with a Bruel and Kjaer 2 octave analyser* It IS likely that below 300 c/s the spectra of the surface pressure fluctuations are increased by the tunnel noise;the maln sources of the tunnel noise were the driving fan and the tunnel wall boundary layer.
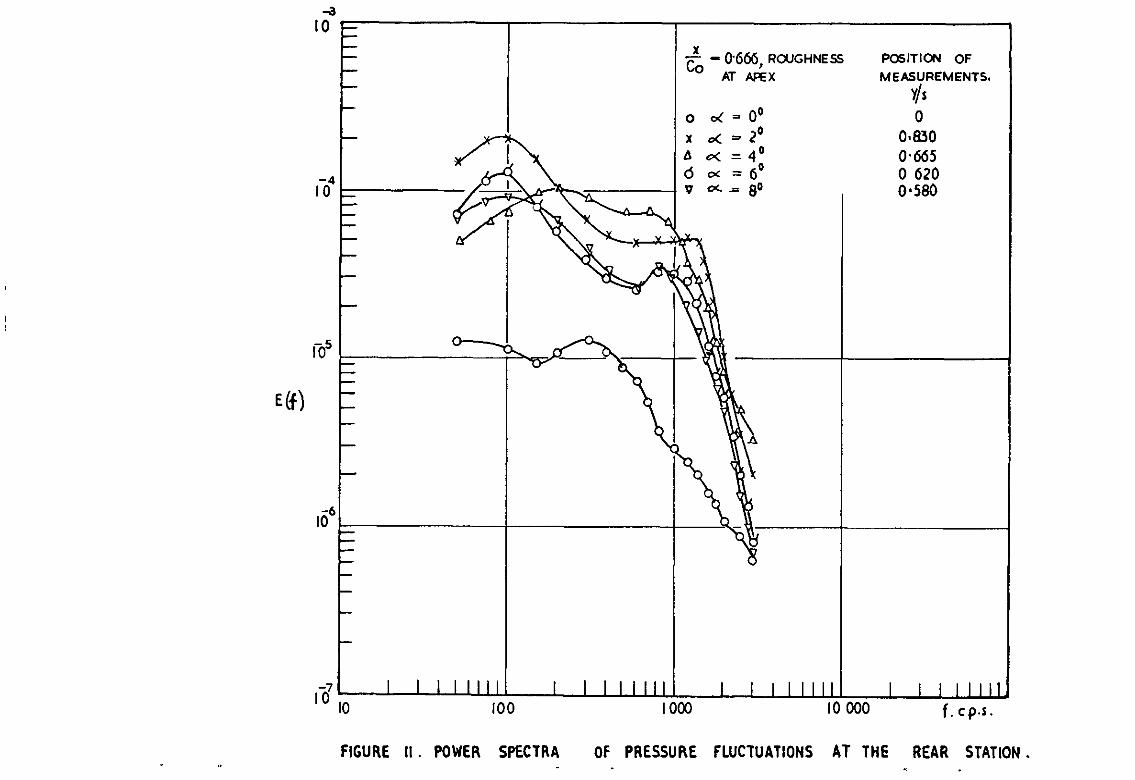
The power spectra E(f) of the pressure fluctuations for various lncidences are shown as a function of frequency in Figs. 10 and 11 for the front and rear stations with roughness on. Most of the spectra were measured at span-wise positions corresponding to the peak r.m.s. levels. The measuring points are shown In the figures. The spectra could not be presented in a dimensionless form because of the three-dimensional nature of the flow the value U h* could not be established.
d At the
incidences other than O", a lea 'ng-eclge vortex was E
ormed and mixed with the boundary layer. The technique used by Owen of presenting the spectra in a non-bmensional form using wing root chord instead of displacement thickness for the frequency parameter 1s not used here. Owen's method has greater utility in examining buffeting excitations. It was thought that the present form of plottzng the spectra could throw more light on the effect of the vortex on the pressure fluctuations on the wmng. The O" plots correspond to the spectrapresented in dxnensionless form in Fig. 9. At other incidences the highest levels occur near 100 c/s and most of the energy in the spectrum is contained below 2 000 c/s.
At incidence apart from the pressure rise and increased energy levels, the shapes of the spectra are not very different fron: those of the O" incidence pressure fluctuations. Therefore it seems possible that the pressure fluctuations arise from the boundary layer on the wing. The differences in spectra can probably be accounted for by the modification of the boundary-layer characteristics by the vortex in increasing the local free stream velocity reducing the thickness of the boundary layer and forming pressure gradients.
It appears that further measurements ought to be made to determine the mean velocities through the boundary layer and the vortex to know the extent of interaction of the vortex with the boundary lsyer. Since the intensity of pressure fluctuations reaches a maximum at 2O incidence, it is possible that the boundary layer and the vortex are merged leaving no clear distinction between them at this incidence.
3.4 Space correlation measurements of the pressure fluctuations
Twin channel magnetic tape recordings of fluctuating pressures . were made for the two rosettes at lncidences O", 2O, 3O, 4O, 60, 8O ad 90.
The measurements were taken from the output of the mIcrophones and simultaneous tape reoortings were made with one microphone fixed at the rosette centre tapping and the second at other points in between.
from/
-6-
From the recordings the distribution of space correlation coefficient R s and filtered space correlation coefficient R sn were obtained. The above correlation coefficients are defined as
1 Rs = TL:/-
I
T fact) fb(t) at
2T -T F, Fb
I R =--
f,(t) fbn(t) sn T-'m 2T
at. F, F,~
. ..(4)
. ..(5)
The integration time T used in practice was 20 seconds.
The correlation length and correlation area used in the disonssion are quite arbitrary. The correlation length is defined to be the distance from a reference point over which the space correlation coefficient,
RS’ has a value greater than +0*4 with respect to the signal at the
reference point. The correlation area is similarly defined as the area over which Rs is greater than 0.4 with respect to the reference sign&
The accuracy of the correlation technique is such that values of Rs
less than about 0.1 and minor fluctuations of Rs can not be regarded as
significant.
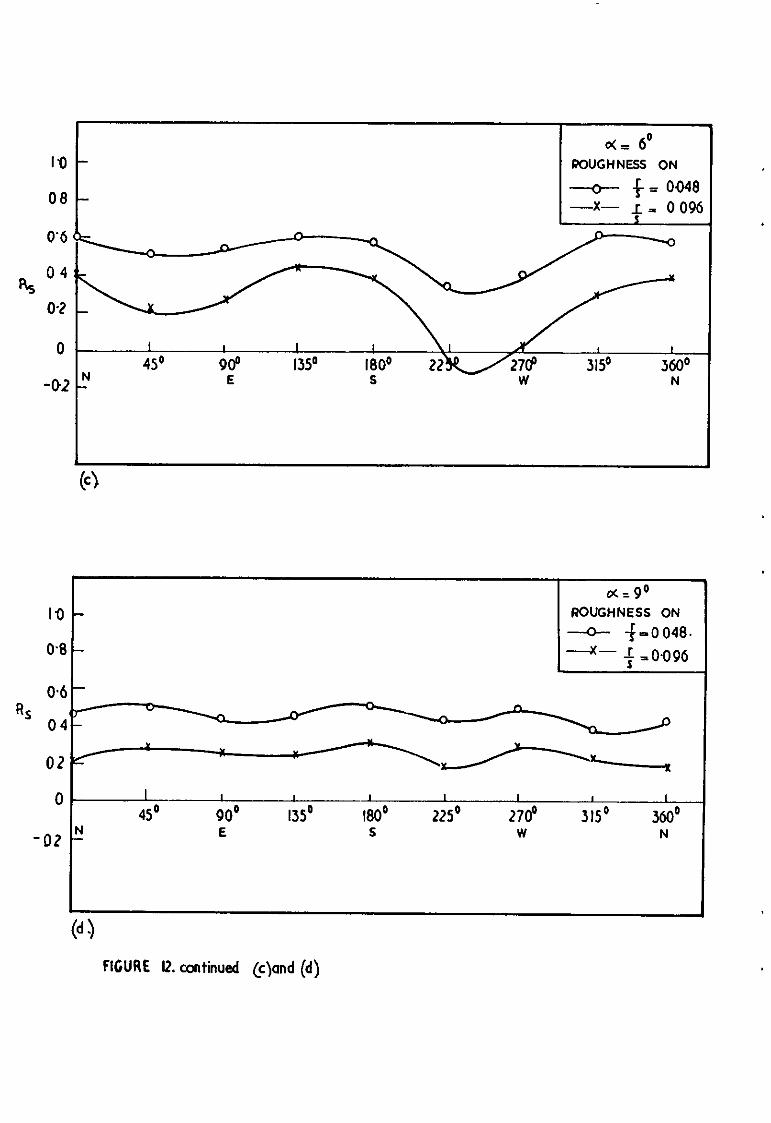
The directional variation of the overall space correlation coefficient 1s shown in Fig. 12 for the forward rosette. At 0°, the correlation coefficient around the inner ring is a maximum in the East- West direction. Around the outer rug a maximum correlation coefficient of 0.5 is reached in the Southern direction, but in all other directioxx the correlation coefficient in this context is too small to be considered.
The effect of increasing the incidence is to increase the correlation area and to smooth out the vsriatior.s with the azimuth. From Fig. 13 it is seen that m the rear rosette, at 0" incidence the variation of Rs is similar to that for O" in the front rosette. At 3O, the variations
are smoothed and thx trend continues for higher incidences as well. It appears that the inner ring of points forms the bouxiary for both the rosettes.
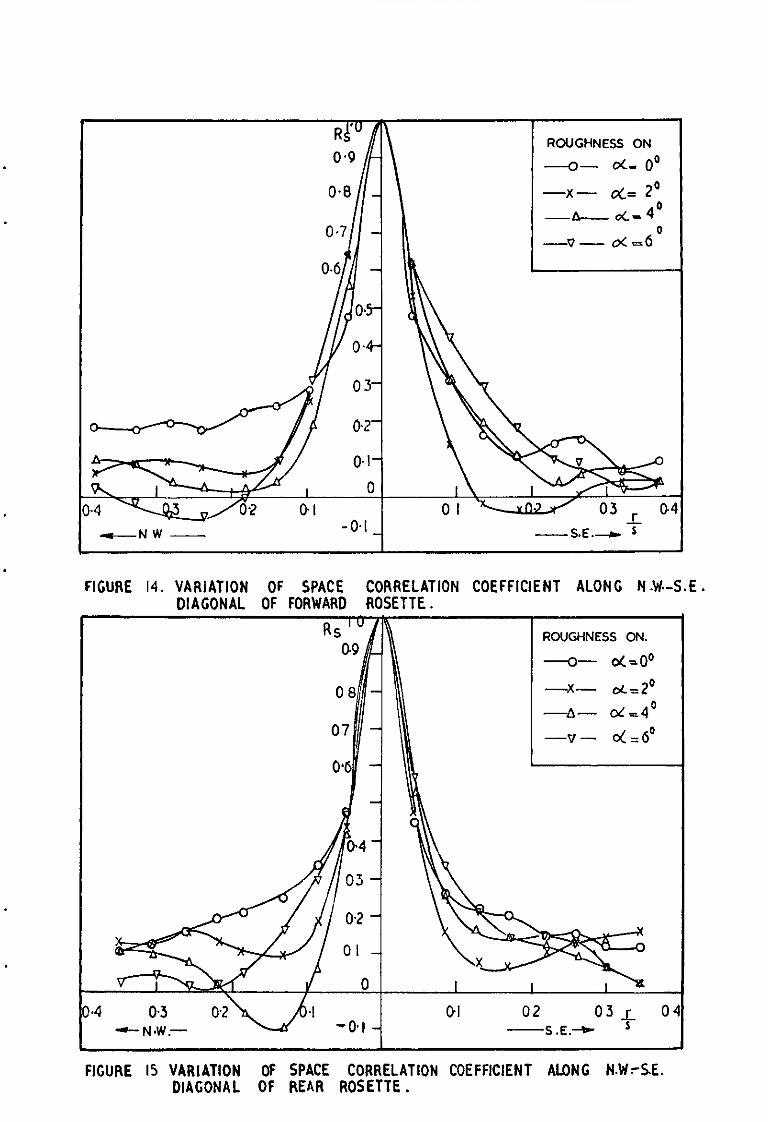
The variation of correlation coefficient in the N.W. - S.E. diagonal with changing incidence is shown in Figs. 14 and 15 for the two rosettes. Ignoring coefficients of less than 0.4, it is seen that increasing the incidence from O" to 60 clauses minor increase in correlation area. The correlation radius is about 1; th of the local semi-span for both the rosettes.
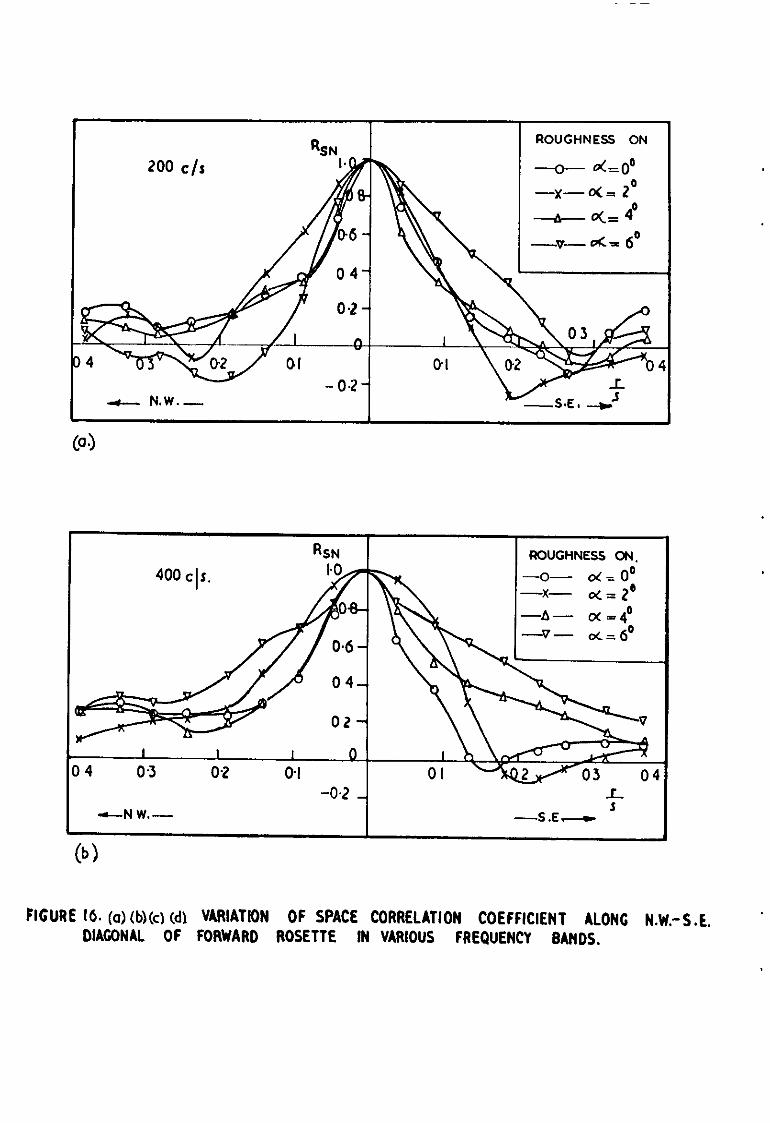
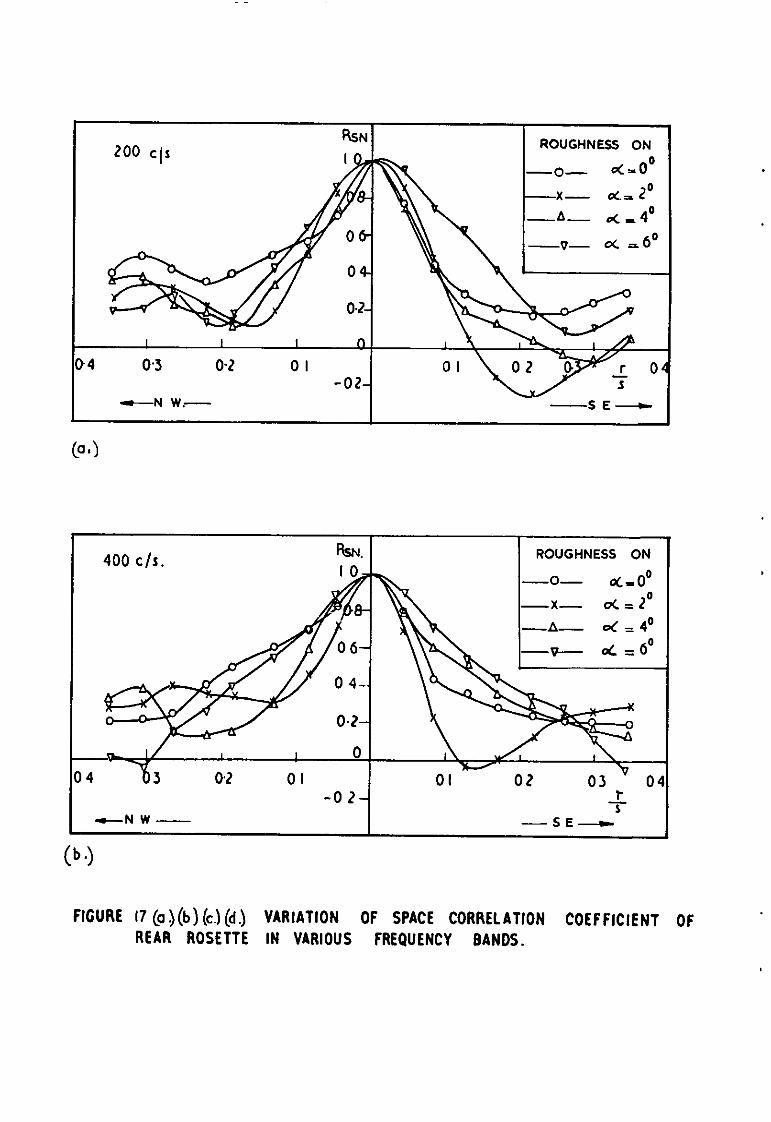
The space correlation along this diagonal for various frequency bands from 200 o/s to 1 000 o/s is shown in Figs. 16 and 17. It ca,n be seen that the fluctuations are well correlated over a larger radius at lm frequencies.
The/
-7-
The effect of roughness on the variation of correlation coefficient for the forward rosette is shown In Fig. 18. At 4O the oorrelatlon coefficients have the same value for the no roughness and roughness on conditions. At higher angles there is a decrease in the values and also the correlation radius is reduced, but not significantly, for the no roughness case0
4. Conclusions
1. R.M.S. levels, frequency spectra and space correlation measurements were obtained using a pair of probe microphones. The corrected r.m.s. level of the boundary-layer pressure fluctuations at zero degree incidence was found to be O-0066 and O-0068 respectively for the two chordwise stations on the wing.
2. The r.m.s. levels across the wing were found to increase at incidence due to the formation of the vortex. Two peaks were observed one under the main vortex and the other in the secondary separation
The highest level was reached at 2O andwas found to be Fg:n=vojj;z;52(3*7 times the 0" level), at the rear station underneath
The peak value reached at the front station for the same angle was 0.019~ (3 times the O" level). These values apply when roughness was used and the flow was turbulent everywhere.
3. Further increase in incidence indicates a fall in peak levels at the two stations, though still higher than the O" level.
4. Roughness has little influence on the r.m.s. levels of the main vortex. The r.m.s. levels in the secondary separation region sre higher wlthout roughness. The degree of roughness used has no influence on the levels provided the flow is made sufficiently turbulent.
5. Most of the energy 1s contained in the low frequency range of the spectra. The peak values occur near 100 o/s. The form of the spectra at incidence apart from the pressure rise and higher energy levels is not disslmi1s.r to the O" case.
6. The correlation radius is found to be about ;tth of the local semi-span for the two stations. The fluotuatlons are well correlated over $,th of the semi-span at lower frequencies.
The origin of the pressure fluctuations at low incidences seems to be a boundary-layer phenomenon. Lllley7,8 following from his work on two-dimensional turbulent boundary-layer pressure fluctuations suggested that at points on the wing surface there should be a linear relationship between the r.m.s. amplitude of the local pressure fluctuations and the local surface shear stress. Wyatt and Owen' have confirmed this in some recent experiments.
Acluwwle&ements
My thanks are due to Dr. J. P. Jones and Dr. M. Judd for their encouragement in this work and to the Commonwealth Scholarship Commission for a fxwncial award to enable me to stsy in England.
List of Symbols/

co cP E(w) f fa fsn fb
a'
fan
Fa
F
'b
Fbn
P
r
R PP
RS
R sn
Re
u m
Uo
-8-
List of Symbols
root chord of the wing.
static pressure coefficient.
power spectrum of static pressure.
frequency.
randomly varying signal at position a.
resultant signal after filtering fa at a particular frequency.
randomly varying signal at position b (=a + 2)
spatial separation between the two measuring points.
resultant signal after filtering fb at a particular frequency.
r.m.s. level of f,*
r.m.s. level of f,,.
r.m.s. level of fb.
r.m.s. level of fbn.
static pressure.
r.m.s. level of the pressure fluctuation.
free stream dynamic pressure.
radial distance measured from the rosette centre.
normslized pressure correlation coefficient.
overall space correlation coefficient.
filtered space correlation coefficient.
Reynolds number.
local semi-span.
time.
integration time.
time delay.
free stream velocity.
velocity at the edge of the boundary-layer.

-v-
Ju?h r.m.s. axial velocity component of the free stream turbulence.
w angular frequency.
x chordwise co-ordinate.
Y spanwise co-ordinate.
z spsnwise distance in the case of flat plate.
"I' “3 spatial separation of pressure transducers in x or z direction
for the flat plate.
sl angle of incidence of the model.
S* duplecement thickness of the boundary--layer.
&.
1
2
3
4
5
6
7
8
Author(s] Title, etc.
M. Judd and J. P. Jones
Surface Pressure Fluctuation Correlation Measurements on a 70° Delta Wing. A.R.C.22 428. December, 1960.
R. E. Franldin and R. B. Archbold
G. A. Allcock, A General Purpose Analogue Computer for the P. L. Tenner end Analysis of Random Noise Signals. K. R. Mdachlan University of Southampton Report. A.A.S.U.205.
R. L. Maltby and R. F. A. Keating
Flow Visualisation in Low-Speed Wind Tunnels: Current British Practice. R.A.E. Tech. Note AFRO 2715. A.R.C.22 373. August, 1960.
W. W. Willmerth and C. E. Wooldridge
T. B. Owen
G. M. Lilley and T. H. Hodgson
G. M. Lilley
9 L. A. Wyatt and T. B. Owen
-lO-
References
A Small-Bore Pick-Up for the Measurement of Fluctuating Pressure. The Aeronautical Quarterly, Vol.XI. November, 1960.
Measurements of the Fluctuating Pressure at the wall beneath a thick Turbulent Boundary Layer. Journal of Fluid Mechanics. vol. 14, pp 187-210. 1962.
Techniques of Pressure Fluctuation Measurements Employed in the R.A.E. Low-Speed Wind-Tunnels. ACARD Report 172. March, 1958.
On the Surface Pressure Fluctuations in Turbulent Boundary Layers. AGARD Report 276. 1960.
Pressure Fluctuations in an Incompressible Turbulent Boundary Layer. College of Aeronautics, Crsnfield. Report No. 133. 1960. A.R.C.22 019. June, 1960.
Preliminary Low-Speed Measurements of Skin-Friction and Surface-Pressure Fluctuations on a Slender Wing at Incidence. R.A.E. Tech. Note Aero.2916. A.R.C.25 436. September, 1963.
DS.
N
8 NW
8
‘b
l
5 5 4 4 N6
3
FIGURE 2 MSTRIBUTION AND NOTATION OF TAPPING IN THE TWO ROSCTTES .
co.26”
TAPPINGS AT vi INTERVALS.
REAR ROSETTE.
RCURE I. MODEL SNOWING DISTRIBUTION OF SURFACE PRESSURE TAPPINGS.
c
- I.2
-1.0
-08
cp UPPER
SURFACE
-0.6
FRONT STATION, $. 0 333, NO ROUGHNESS.
-o- a!=40
_
0 -- 0(=8
-A- CL= ,z”
4- CL= 4O
-v-d-8o
FIGURE 5 EFFECT OF SURFACE ROUGHNESS ON SPANWISE STATIC PRESSURE DISTRIBUTION.

I? -o- c(,oo -x- c&z0 -6 oc=4O
24 :G - 0.333, ROUGHNESS AT APEX d- d -6O -V- dzBO
28x
l-3- -c
0 0'1 02 03 0.4 06 07 0.8 to
FIGURE 6 VARIATION OF R.H.S. PRESSURE FLUCTUATION WITH INCIDENCE AT THE FRONT STATION .

+o= 0.666 . ROUGHNESS AT APEX
- 161 I I
I I I
0 0.1 0.2 o-3 0.4 0.5 06 0.7 0.0 09 I’0
VI
FIGURE 7 VARIATION OF R.M.S. PRESSURE FLUCTUATION WITH INCIDENCE AT THE REAR STATION.

----. iJ .
X NO ROUGHNESS - ,033s. CO
I
24 IWlJGfflESS ON
f- ?
- 16
I2
8
4
I I I I I I
0 0-I 02 03 0.4 05 06 07 0.0
FIGURE 6, EFFECT OF ROUGHNESS ON THE R.H.S. PRESSURE FLUCTUATION AT THE FRONT STATION.
Id
\
WILLMARlH 440 wotxoRloCE
1 SMOOlH PLAlL WITH NATIJAU 1AANSIlION)
ROUtiHNES.5~ THE APEX.
I I I Irrlrl I I 1111111 I II IIIIII
001 @I 1 IO
FIGURE 9. COHPARISOM OF THE DIMENSIONLESS POWER SPECIRUH OF THE WALl PRESSURE WITH THOSE OF THE DELTA WING AT 0’ INCIDENCE.

x ,o 333. ROUGHNESS AT APEX.
-X-
-e<c(440
-V-
-7 IO
IO 100 1000 10000 f cps. FIGURE IO. POWER SPECTRA OF PRESSURE FLUCTUATIONS Al THE FRONT STATION.
to - 0666, ROUGHNESS POSITION OF
AT APEX MEASUREMENTS,
vls
0 04330 0.665 0 620 0*560
I I I IIIII I I I Illll 1000 II
FIGURE II. POWER SPECTRA OF PRESSURE FLUCTUATIONS AT THE REAR STATION.

oC=O" I 0 I ROUGHNESS ON
OYJ- -0-f-0048
06- -x- f-0096.
RS
d= 30 ROUGHNESS ON
-4-f-0048
-x- f -0096
R, o.4
0.2
~
O .I\ 45O 9o" / A0 ISO
/Y-?
-@, 22~U70° 315O 360'
S W N
FIGURE I2 (I) (b)@.(dJ DIRECTIONAL VARIATION OF SPACE CORRELA'IION COEFFICIENT
IN THE FORWARD ROSETTE.
1
o(= 6' IQ - RYJGHNESS ON
08 -
IQ - ~s~UGHNESS 0~
0.8 -
0 I I I I I 1 I I 45O 90° us0 180' 225' 270' 315O 360°
-02 !lJ E S W N
(d3
FIGURE IZ. continued @and (d)

1. 0
0.8
06 RS
04
02
0
- 0.2
ROUGHNESS ON
4Y -
9o" 13S0 le.0 O 225O 270' 31S0 !A E S W
360' N
ROUGHNESS ON
FIGURE 13(a) (b)(c)(d) DlRECTlONAL VARIATION OF SPACE CORRELATION COEFFICIENT IN THE REAR ROSETTE.

to - ROUGHNESS ON
08-
06 - Rs ,)
04-
0 . 450 900 MO 1800 2250 270° 315O 360'
-02-N E S W N
cd = 90 IO- ROUGHNESS ON
08- -o- f zoo43
--x-
06-
+ ,O 086
0 I I I I 1 I I I 45O 900 1350 180° 2250 270° 3150 360°
N E S W -02 -
N
FIGURE I3 (C)and (j ).(contmued )
RCUCHNESS ON
4- d- o”
-,x--- d= 20
-L oc-4O
-0.1 I
NW - -SE.-+ s
FIGURE 14. VARIATION OF SPACE CORRELATION COEFFICIENT ALONG NM-S.E. DIAGONAL OF FORWARD ROSETTE.
FIGURE 15 VARIATION OF SPACE CORRELATION COEFFICIENT ALONG N.WrS.E. DIAGONAL OF REAR ROSETTE.
ROUGHNESS ON
---cc- cd=00
--x-M= z”
-&---o&4° -I~-cJC= 15’
4- N.W.-
I RSN I ROUGHNESS CN
I 400 CIS.
I I I 0 I 04 0.3 02 04 01 -03 04
-0.2 - L -NW.-
S -S.E-
FIGURE 16. (a) (b)(c) (d) VARIATlON OF SPACE CORRELATION COEFFICIENT ALONG N.W.-S.E. DIAGONAL OF FORWARD ROSETTE IN VARIOUS FREQUENCY BANDS.

630 c/s.
-- I. I I n
”
04 03 02 0.1 -02-
- N.W.- --&E.--L
-SE-
FIGURE 16 continued (c)und (dJ
LUU CIS ROUGHNESS ON
r-N W.- -SE-
ROUGHNESS ON
-L cd=4
(b*)
FIGURE 17 [a.)(b)(c.)(d) VARIATION OF SPACE CORRELATION COEFFICIENT REAR ROSETTE IN VARIOUS FREQUENCY BANDS.
OF

ROUGHNESS ON
-A-
-N .W- ---SEA
ROUGHNESS ON
-d-O0
-x- 4 - 2O
-V- ct =r. 6'
-02 -NW--...-
1 - S.E --c +
FIGURE 17 contmued (c)and (d )

-- .s..q’
NO ROUGHNESS.
nGIJRE 18 EFFECT OF ROUGHNESS ON THE SPACE CORRELATION COEFFICIENT ALONG THE N .W.-S.E. DIAGONAL OF FORWARD ROSETTE.

_____________-----------------------------------------------------------------------------------------
A.R.C. C.P. No.767
Awst.1963
v. Krlshnanocrthy
T A.R.C. C.P. No.767
August. I%3
lC3ASUmm OF PRESSURE FtITcNATIoNG lEASO- OF PRESSURE FfJC7UATIowS
CN THE S0P.FAC.E OF A D&T,\ ,,I% ON THE SURFACE OF A CELTA “IM.7
l%?asurements have been made ot the r.m.s. levels. spectra ad space
correlations of the s”Sace preSsWe fluctUatiorS 0” a 76’ sharp edged delta
nlng at low incldences. ‘Ihe peak r.m.s. value was found to be 3'7 times that
for the 0’ incidence and occurred under the main xx-tex at 2’ Incidence. The
Iom of the spectra wePe found to be not dlsslmllar to that for 0’ incidence.
Tins sUggesta that the fluctuations arise tim the bc"m3a-y layer mdllled
by the VOI%..BX. The correlation radius was found to be about +S th of the lccal
SemlSp2n. Hm’,~ver, comlatlon lengths for discrete fiequencles could be
twice as large as this.
I’kesuremmts have been made of the r.m.s. levels, spectra and space
coI-mlatlom of the surface pressure fluctuations on a 76' sharp edged delta
ning at l‘m lncldences. Ihe peak r.m.s. value was found to be 3'7 times tha
for the 0" incidence and occurred under the main vortex at 2’ lncldence. Th
ion,!3 Of the Spectra ~ez’e lomd to be not dissimilar to that for 0’ lncldenc
I’bls suggests that the flucCuat.lons arlse from the boundary layer mcdlfled
by the vortex. The correlation radius was fo”nd to be about & th of the
local semi-span. However, comlatlon lengths for dlscmte frequencies
could be twice as large as this.
A.R.C. C.P. No.767
nugust. 1%3
v. xi-lshn¶oarthp
h?&?SO~ OF PPESSJFS Fl.UClUATIcwS
ON THE SOWACE OF A EELTA WING
Measurements have been made of the r.m.s. levels. spectra and space
con’elatlom of the swface pressure f1uctuatlons on a 76' sharp edged delta
wing at lo,, Imldences. The peak r.m.8. value wz.3 lo”nd to be 3'7 tine.5 that
ior the O* incidence and occurred under the ml,, voIzex at 2’ lncldence. The
loma of the spectra were found to be not dissimilar to that IoF 0' incidence
This suggests that the fluctuations erlse Iran the boundary layer modified
by the vortex. The correlation radius was lound to be about &th of the
local s!mi-span. However. correlation lengths for discrete Irequencles
could be twice as 1-e 88 this.


C.P. No. 767
0 Crown copyrrght 1965
Printed and pubbshed by
HER MAJESTY’S STATIONERY OFFICE
To be purchased from York House, Kmgsway, London w c.2
423 Oxford Street, London w 1 13A Castle Street, Edmburgh 2
109 St. Mary Street, Cardtff 39 Kmg Street, Manchester 2
50 Fatrfax Street, Bristol 1 35 Smallbrook, Ringway, Blcmmgbam 5
80 ChIchester Street, Belfast 1 or through any bookseller
Prmted m England
C.P. No. 767
S.O. Code No. 23-9015-67