measurements of underwater noise during piling at the red funnel terminal, southampton, and...
DESCRIPTION
This report presents the results of monitoring measurements of waterborne noise taken atTown Quay, Southampton, during piling operations at Red Funnel’s Southampton Terminal inSeptember 2003. Simultaneously, observations were made of caged brown trout (Salmotrutta) to determine whether there was any observable effect of the piling on the theirbehaviour.The piling was required as part of a construction project for Red Funnel, installing improvedloading facilities at their Southampton Terminal, illustrated in Fig. 1. The project was requiredto provide infrastructure for improved ferry services, and in particular to allow twin-deckaccess to ferries. As part of this project piling in the water adjacent to the dock wall wasrequired to provide foundations for the new structure. Existing ferries were also modifiedduring the period of construction to allow twin deck access; during this period a temporaryferry was provided.Driving of piles in water have been recorded as generating high levels of underwater noise(Abbott & Bing-Sawyer (2002)), and there was consequently concern by the EnvironmentAgency (EA) and English Nature (EN) who have remits to control construction projects so asto mitigate adverse impacts on fish stocks. Their concern related to the possible effectsconstruction noise might have on local fish populations, and in particular on migration ofsalmon.A consent had previously been given by the Environment Agency for Red Funnel’s contractorsto undertake the piling between the 1st December 2003 and the 31st March 2004, during whichperiod no significant impediment to the migration of salmon through the area and into the Testwas expected. However, due to significant economic and commercial factors connected withthe required timescales for withdrawing the ferries from service, and the need to accomplishthe engineering work outside peak travel periods for passengers, a consent was sought fromEA and EN to bring forward the piling project to commence on the 1st September.Permission was subsequently given for the piling to be brought forward to September 2003,subject to two requirements, namely:1. the mitigation of impact piling noise by use of bubble curtains as required, and2. the work being monitored by means of measurements of underwater noise.In addition, Red Funnel provided some funds for direct visual observation of a tethered cageof fish in order to make direct visual observations of any effect. Owing to the problems ofobtaining salmon for testing, farmed brown trout (Salmo trutta) were used in the tests, beingthe most closely related species with a similar hearing ability.These measures were deemed sufficient to ensure there was no increased likelihood of salmonin Southampton Water and the River Test being affected by the piling.TRANSCRIPT

Submitted to: Submitted by:
Mr. Tom Docherty Dr J NedwellRed Funnel Subacoustech Ltd12 Bugle Street Chase MillSouthampton Winchester RoadHants. SO14 2JY Bishop’s Waltham
Hants. SO32 1AHTel: +44 (0) 1489 891849Fax: +44 (0) 870 513060email: [email protected]: www.subacoustech.com
Measurements of underwater noise during piling at the Red FunnelTerminal, Southampton, and observations of its effect on caged fish.
Report Reference: 558 R 0207
by
Dr Jeremy Nedwell, Dr Andrew Turnpenny*, Mr. John Langworthy & Mr Bryan Edwards
27 October 2003
* Fawley Aquatic Research Ltd, Fawley, UK.
Approved for release: ......... ………….............................................
Contents
1. Introduction. .....................................................................................................................1
1.1. Background to the work.............................................................................................1
1.2 Piling methods.............................................................................................................1
2. The Measurements. ...........................................................................................................3
2.1. Philosophy of measurements; the dBht scale. ...............................................................3
2.2. Location of pile driving and measurement positions. ...................................................3
2.3. Instrumentation and measurement procedure. .............................................................5
3. Analysis of measurements and results. ...............................................................................7
3.1. Vibro driver................................................................................................................7
3.2. Impact driver..............................................................................................................7
4. Observations of fish behaviour...........................................................................................9
4.1. Fish monitoring methods. ...........................................................................................9
4.1.1. Source and preparation of fish. ...........................................................................9
4.1.2. Fish cage design and deployment........................................................................9
4.1.3. Closed-circuit television monitoring....................................................................9
4.1.4. Assessing fish reactions to noise. ......................................................................10
4.1.5. Post-trial treatment of fish. ...............................................................................10
4.2. Fish behavioural reactions.........................................................................................10
4.2.1. Behavioural reactions during vibro-piling...........................................................10
4.2.2. Behavioural reactions during impact piling.........................................................11
4.3. Fish injuries..............................................................................................................11
4.4. Summary of observations on fish. .............................................................................12
5. Conclusions.....................................................................................................................13
References...........................................................................................................................14
Figures.................................................................................................................................15
Appendix 1: Hydrophone calibration certificates..................................................................31

Measurements of underwater noise during piling at the Red Funnel Terminal, Southampton,and observations of its effect on caged fish.
Subacoustech Ltd.Document reference: 558 R 0207
1
1. Introduction.
1.1. Background to the work.
This report presents the results of monitoring measurements of waterborne noise taken atTown Quay, Southampton, during piling operations at Red Funnel’s Southampton Terminal inSeptember 2003. Simultaneously, observations were made of caged brown trout (Salmotrutta) to determine whether there was any observable effect of the piling on the theirbehaviour.
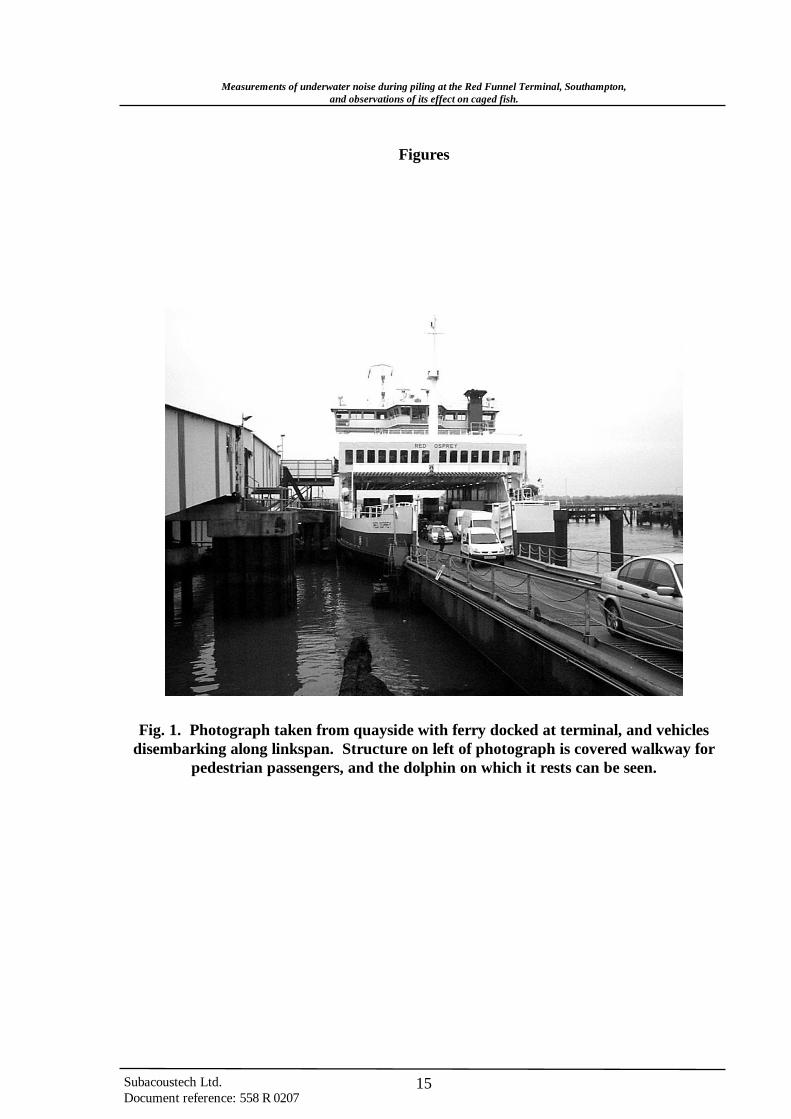
The piling was required as part of a construction project for Red Funnel, installing improvedloading facilities at their Southampton Terminal, illustrated in Fig. 1. The project was requiredto provide infrastructure for improved ferry services, and in particular to allow twin-deckaccess to ferries. As part of this project piling in the water adjacent to the dock wall wasrequired to provide foundations for the new structure. Existing ferries were also modifiedduring the period of construction to allow twin deck access; during this period a temporaryferry was provided.
Driving of piles in water have been recorded as generating high levels of underwater noise(Abbott & Bing-Sawyer (2002)), and there was consequently concern by the EnvironmentAgency (EA) and English Nature (EN) who have remits to control construction projects so asto mitigate adverse impacts on fish stocks. Their concern related to the possible effectsconstruction noise might have on local fish populations, and in particular on migration ofsalmon.
A consent had previously been given by the Environment Agency for Red Funnel’s contractorsto undertake the piling between the 1st December 2003 and the 31st March 2004, during whichperiod no significant impediment to the migration of salmon through the area and into the Testwas expected. However, due to significant economic and commercial factors connected withthe required timescales for withdrawing the ferries from service, and the need to accomplishthe engineering work outside peak travel periods for passengers, a consent was sought fromEA and EN to bring forward the piling project to commence on the 1st September.
Permission was subsequently given for the piling to be brought forward to September 2003,subject to two requirements, namely:
1. the mitigation of impact piling noise by use of bubble curtains as required, and
2. the work being monitored by means of measurements of underwater noise.
In addition, Red Funnel provided some funds for direct visual observation of a tethered cageof fish in order to make direct visual observations of any effect. Owing to the problems ofobtaining salmon for testing, farmed brown trout (Salmo trutta) were used in the tests, beingthe most closely related species with a similar hearing ability.
These measures were deemed sufficient to ensure there was no increased likelihood of salmonin Southampton Water and the River Test being affected by the piling.
1.2 Piling methods.
Two sorts of piling were undertaken on the site, namely vibropiling and impact piling.
Vibratory pile drivers are machines that install piling into the ground by applying a rapidlyalternating force to the pile. This is generally accomplished by rotating eccentric weightsabout shafts. Each rotating eccentric produces a force acting in a single plane and directedtoward the centreline of the shaft. Fig. 2 shows the basic set-up for the rotating eccentric

Measurements of underwater noise during piling at the Red Funnel Terminal, Southampton,and observations of its effect on caged fish.
Subacoustech Ltd.Document reference: 558 R 0207
2
weights used in most current vibratory pile driving/extracting equipment. The weights are setoff-centre of the axis of rotation by the eccentric arm. If only one eccentric is used, in onerevolution a force will be exerted in all directions, giving the system a good deal of lateralwhip. To avoid this problem the eccentrics are paired so the lateral forces cancel each other,leaving only axial force for the pile. Machines can also have several pairs of smaller, identicaleccentrics synchronised to obtain the same effect as one larger pair.
Impact piling is performed using hammers which drive the pile by first inducing downwardvelocity in a metal ram, as shown in Fig. 3. Upon impact with the pile accessory, the ramcreates a force far larger than its weight, which moves the pile an increment into the ground. Most impact hammers have some kind of cushion under the end of the ram which receives thestriking energy of the hammer. This cushion is necessary to protect the striking parts fromdamage; it also modulates the force-time curve of the striking impulse and can be used tomatch the impedance of the hammer to the pile, increasing the efficiency of the blow.
The sediments at the terminal were found to be relatively soft, such that nearly all the piledriving at the Red Funnel was undertaken using vibropiling. Impact piling was only used atthe end of the work, when the final driving of three piles was performed by impact piling fordynamic testing purposes.
Measurements of underwater noise during piling at the Red Funnel Terminal, Southampton,and observations of its effect on caged fish.
Subacoustech Ltd.Document reference: 558 R 0207
3
2. The Measurements.
2.1. Philosophy of measurements; the dBht scale.
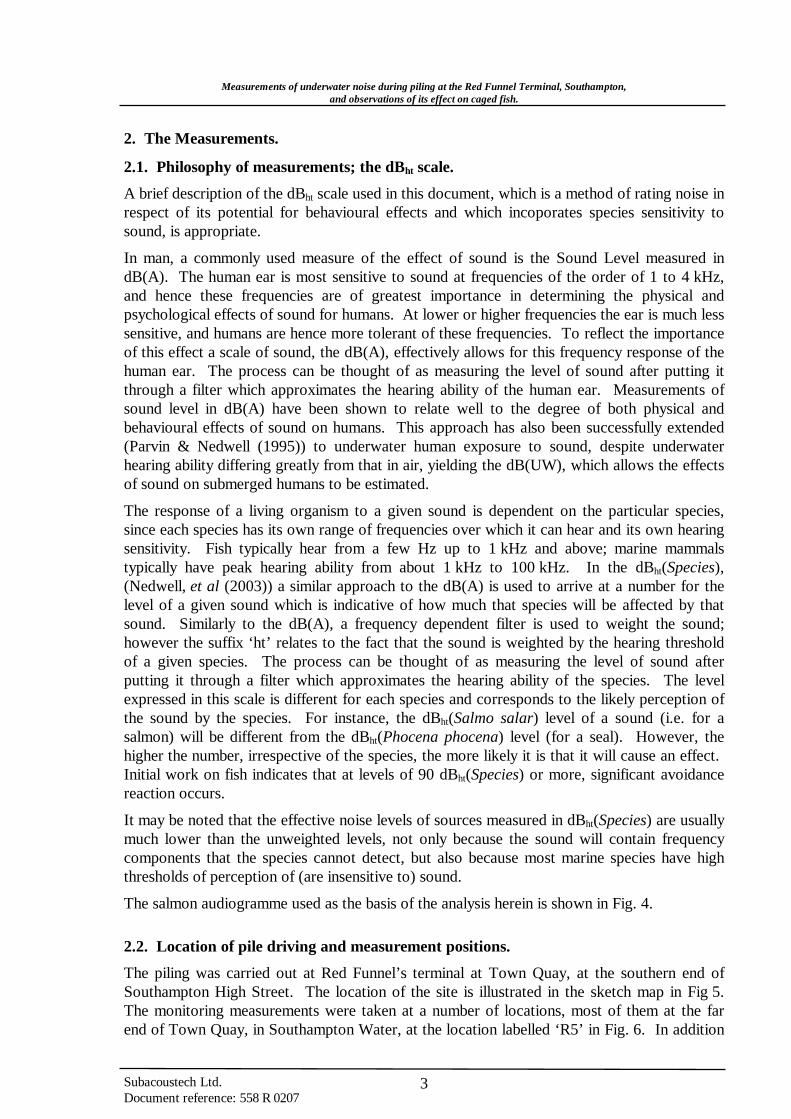
A brief description of the dBht scale used in this document, which is a method of rating noise inrespect of its potential for behavioural effects and which incoporates species sensitivity tosound, is appropriate.
In man, a commonly used measure of the effect of sound is the Sound Level measured indB(A). The human ear is most sensitive to sound at frequencies of the order of 1 to 4 kHz,and hence these frequencies are of greatest importance in determining the physical andpsychological effects of sound for humans. At lower or higher frequencies the ear is much lesssensitive, and humans are hence more tolerant of these frequencies. To reflect the importanceof this effect a scale of sound, the dB(A), effectively allows for this frequency response of thehuman ear. The process can be thought of as measuring the level of sound after putting itthrough a filter which approximates the hearing ability of the human ear. Measurements ofsound level in dB(A) have been shown to relate well to the degree of both physical andbehavioural effects of sound on humans. This approach has also been successfully extended(Parvin & Nedwell (1995)) to underwater human exposure to sound, despite underwaterhearing ability differing greatly from that in air, yielding the dB(UW), which allows the effectsof sound on submerged humans to be estimated.
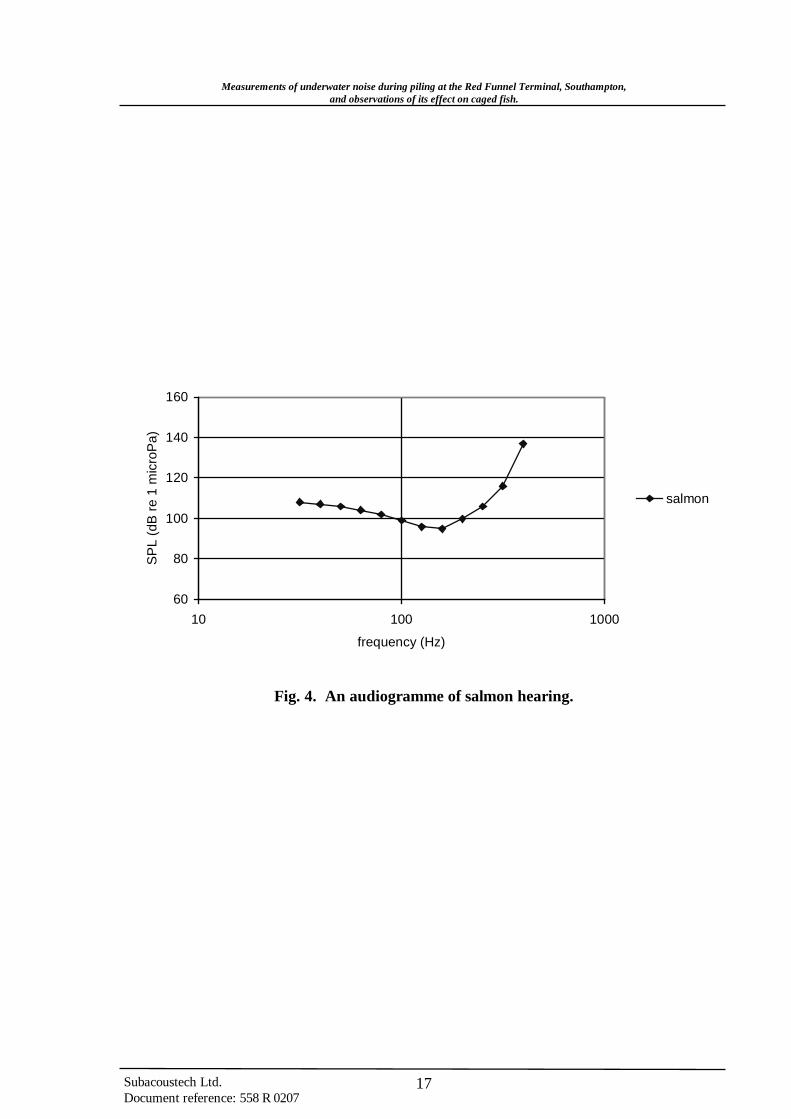
The response of a living organism to a given sound is dependent on the particular species,since each species has its own range of frequencies over which it can hear and its own hearingsensitivity. Fish typically hear from a few Hz up to 1 kHz and above; marine mammalstypically have peak hearing ability from about 1 kHz to 100 kHz. In the dBht(Species),(Nedwell, et al (2003)) a similar approach to the dB(A) is used to arrive at a number for thelevel of a given sound which is indicative of how much that species will be affected by thatsound. Similarly to the dB(A), a frequency dependent filter is used to weight the sound;however the suffix ‘ht’ relates to the fact that the sound is weighted by the hearing thresholdof a given species. The process can be thought of as measuring the level of sound afterputting it through a filter which approximates the hearing ability of the species. The levelexpressed in this scale is different for each species and corresponds to the likely perception ofthe sound by the species. For instance, the dBht(Salmo salar) level of a sound (i.e. for asalmon) will be different from the dBht(Phocena phocena) level (for a seal). However, thehigher the number, irrespective of the species, the more likely it is that it will cause an effect. Initial work on fish indicates that at levels of 90 dBht(Species) or more, significant avoidancereaction occurs.
It may be noted that the effective noise levels of sources measured in dBht(Species) are usuallymuch lower than the unweighted levels, not only because the sound will contain frequencycomponents that the species cannot detect, but also because most marine species have highthresholds of perception of (are insensitive to) sound.
The salmon audiogramme used as the basis of the analysis herein is shown in Fig. 4.
2.2. Location of pile driving and measurement positions.
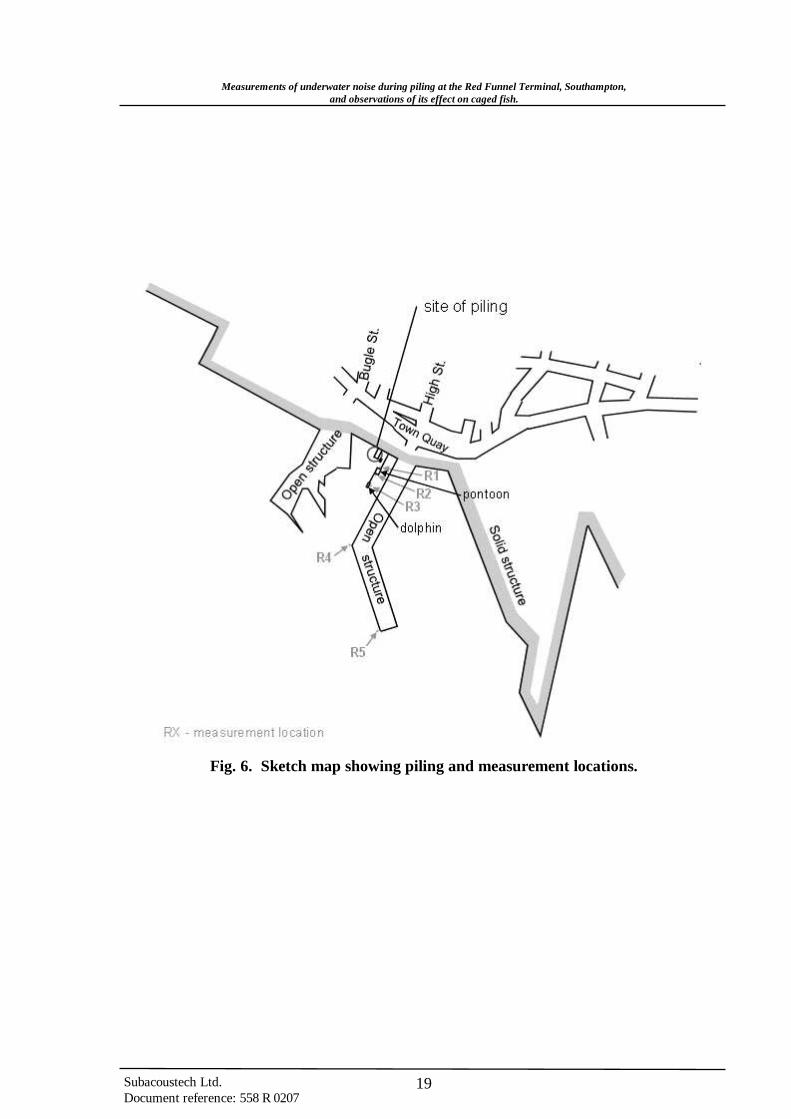
The piling was carried out at Red Funnel’s terminal at Town Quay, at the southern end ofSouthampton High Street. The location of the site is illustrated in the sketch map in Fig 5.The monitoring measurements were taken at a number of locations, most of them at the farend of Town Quay, in Southampton Water, at the location labelled ‘R5’ in Fig. 6. In addition
Measurements of underwater noise during piling at the Red Funnel Terminal, Southampton,and observations of its effect on caged fish.
Subacoustech Ltd.Document reference: 558 R 0207
4
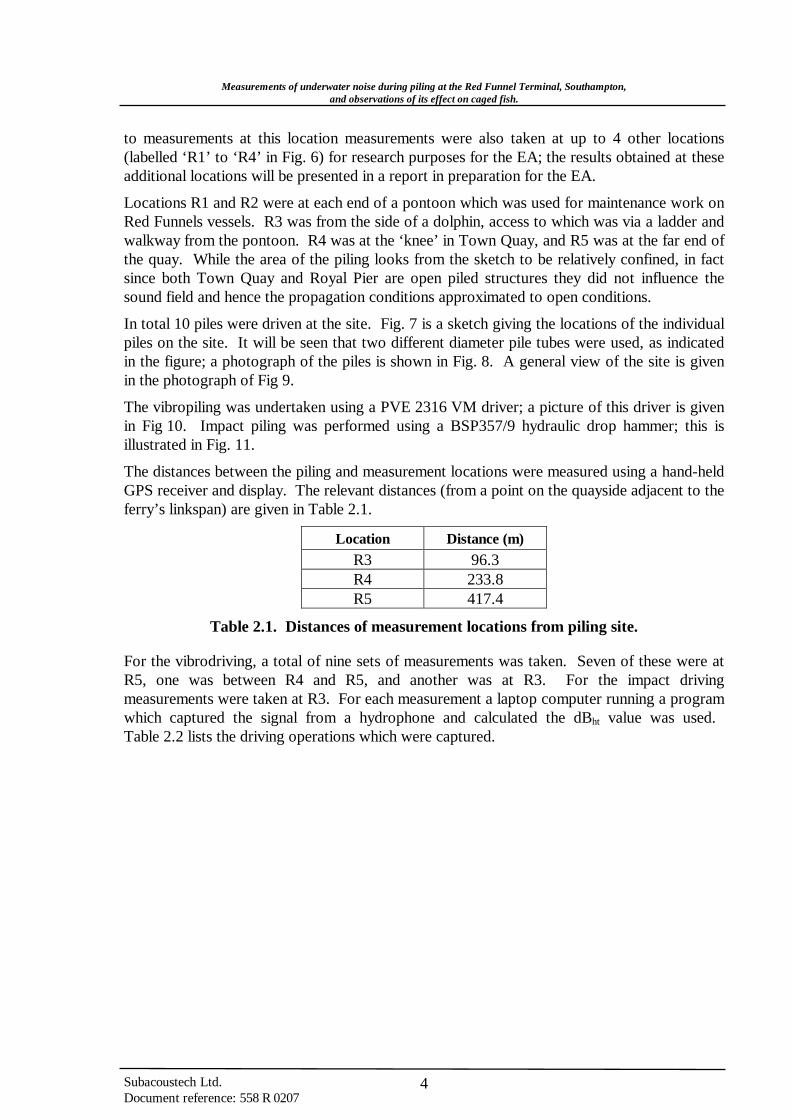
to measurements at this location measurements were also taken at up to 4 other locations(labelled ‘R1’ to ‘R4’ in Fig. 6) for research purposes for the EA; the results obtained at theseadditional locations will be presented in a report in preparation for the EA.
Locations R1 and R2 were at each end of a pontoon which was used for maintenance work onRed Funnels vessels. R3 was from the side of a dolphin, access to which was via a ladder andwalkway from the pontoon. R4 was at the ‘knee’ in Town Quay, and R5 was at the far end ofthe quay. While the area of the piling looks from the sketch to be relatively confined, in factsince both Town Quay and Royal Pier are open piled structures they did not influence thesound field and hence the propagation conditions approximated to open conditions.
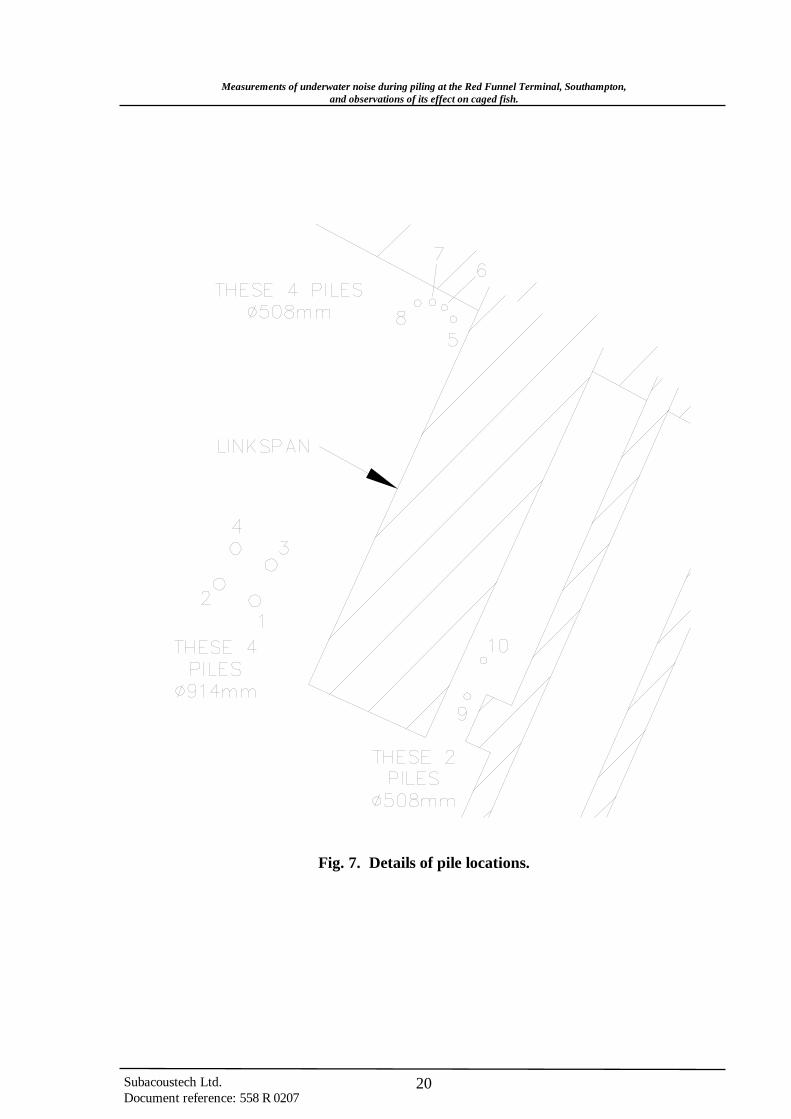
In total 10 piles were driven at the site. Fig. 7 is a sketch giving the locations of the individualpiles on the site. It will be seen that two different diameter pile tubes were used, as indicatedin the figure; a photograph of the piles is shown in Fig. 8. A general view of the site is givenin the photograph of Fig 9.
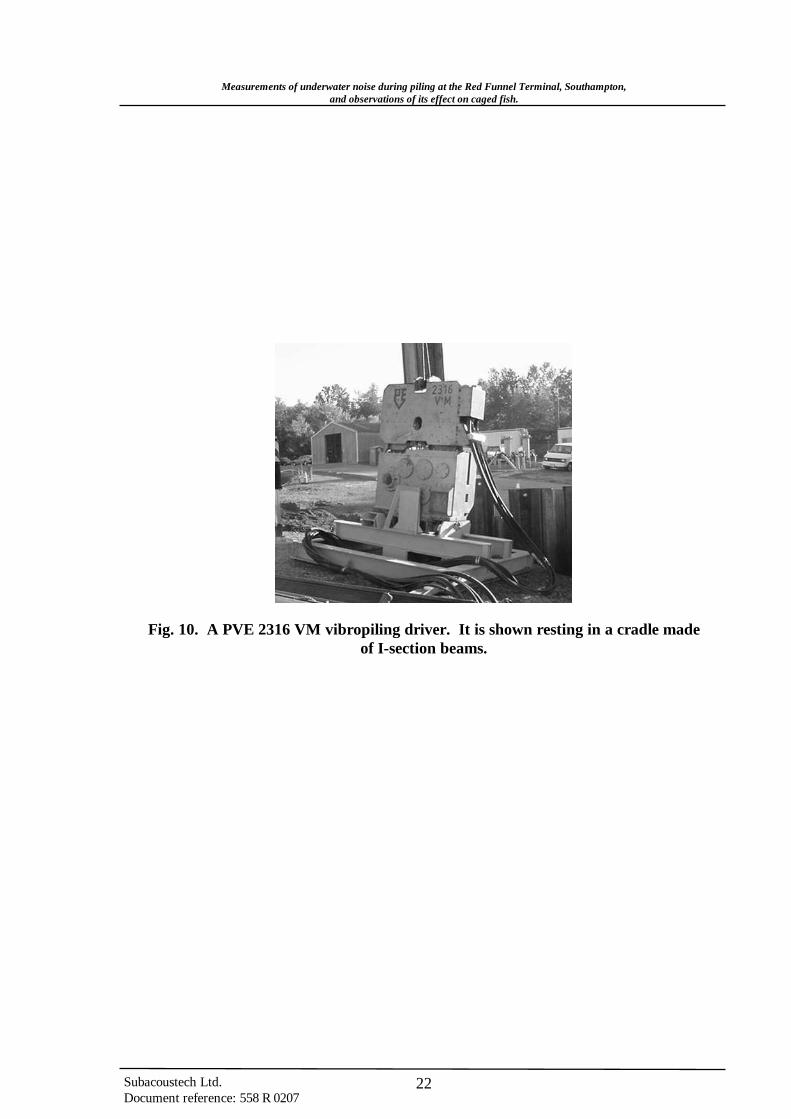
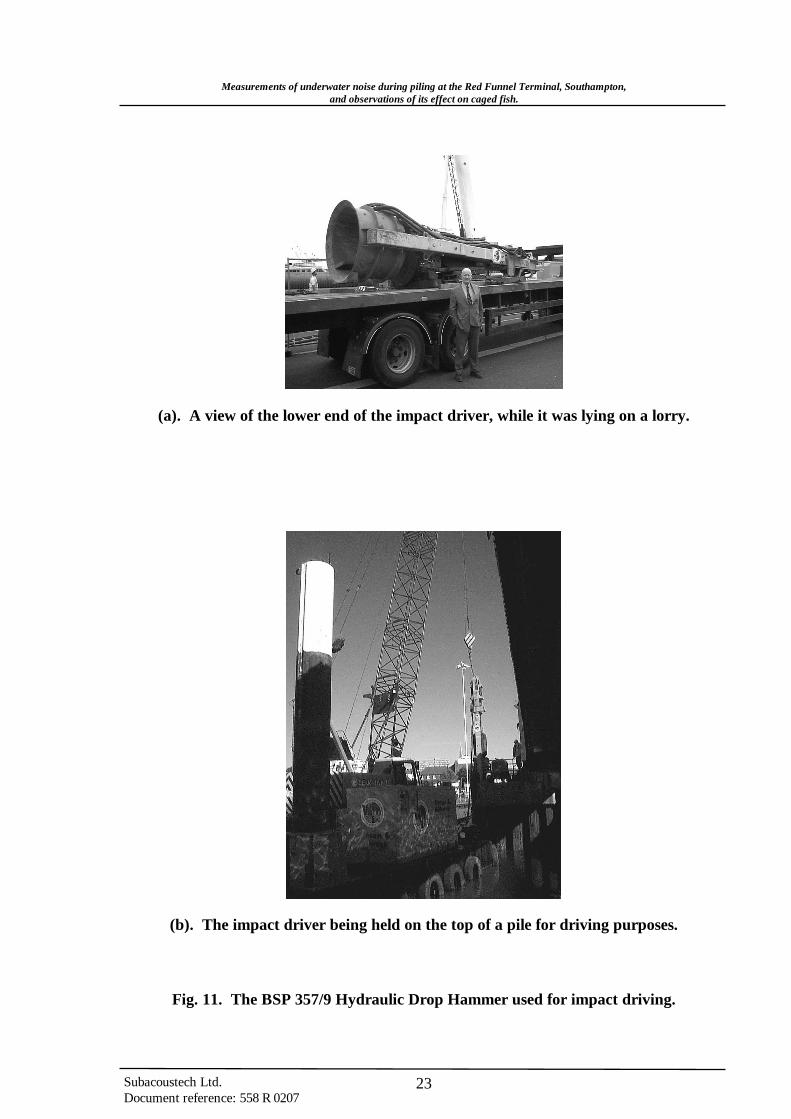
The vibropiling was undertaken using a PVE 2316 VM driver; a picture of this driver is givenin Fig 10. Impact piling was performed using a BSP357/9 hydraulic drop hammer; this isillustrated in Fig. 11.
The distances between the piling and measurement locations were measured using a hand-heldGPS receiver and display. The relevant distances (from a point on the quayside adjacent to theferry’s linkspan) are given in Table 2.1.
Location Distance (m)
R3 96.3R4 233.8R5 417.4
Table 2.1. Distances of measurement locations from piling site.
For the vibrodriving, a total of nine sets of measurements was taken. Seven of these were atR5, one was between R4 and R5, and another was at R3. For the impact drivingmeasurements were taken at R3. For each measurement a laptop computer running a programwhich captured the signal from a hydrophone and calculated the dBht value was used. Table 2.2 lists the driving operations which were captured.
Measurements of underwater noise during piling at the Red Funnel Terminal, Southampton,and observations of its effect on caged fish.
Subacoustech Ltd.Document reference: 558 R 0207
5
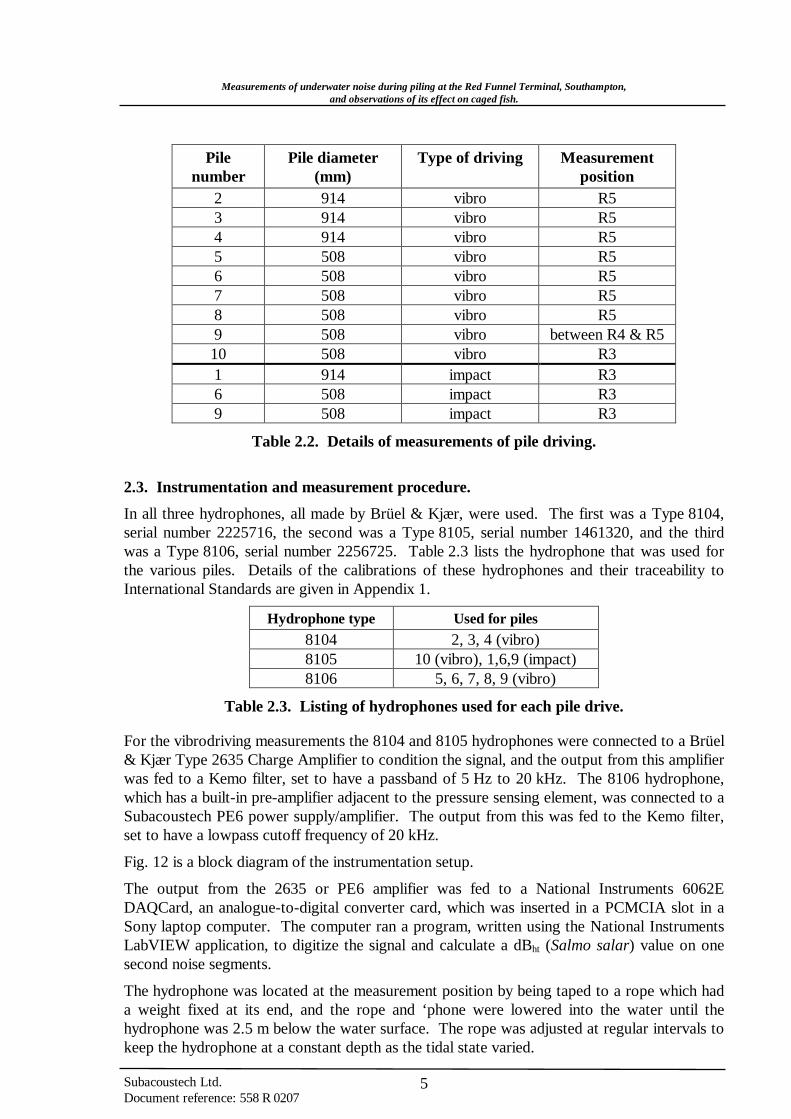
Pilenumber
Pile diameter(mm)
Type of driving Measurementposition
2 914 vibro R53 914 vibro R54 914 vibro R55 508 vibro R56 508 vibro R57 508 vibro R58 508 vibro R59 508 vibro between R4 & R510 508 vibro R31 914 impact R36 508 impact R39 508 impact R3
Table 2.2. Details of measurements of pile driving.
2.3. Instrumentation and measurement procedure.
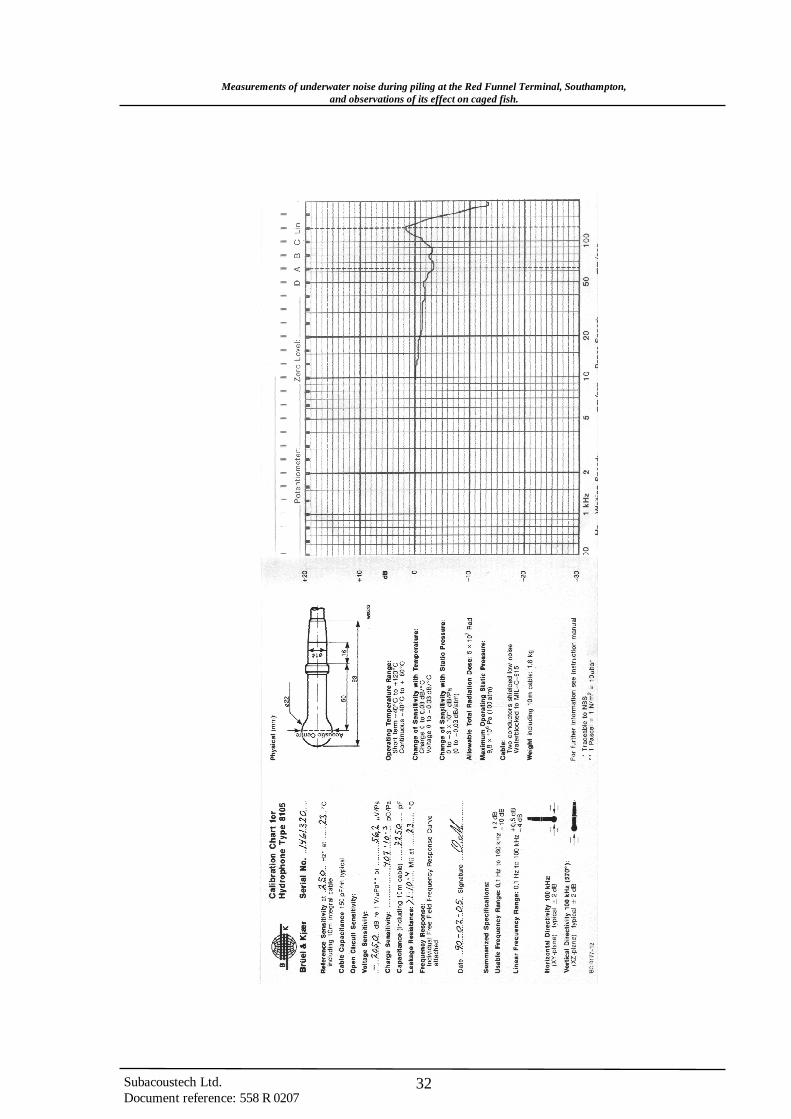
In all three hydrophones, all made by Brüel & Kjær, were used. The first was a Type 8104,serial number 2225716, the second was a Type 8105, serial number 1461320, and the thirdwas a Type 8106, serial number 2256725. Table 2.3 lists the hydrophone that was used forthe various piles. Details of the calibrations of these hydrophones and their traceability toInternational Standards are given in Appendix 1.
Hydrophone type Used for piles
8104 2, 3, 4 (vibro)8105 10 (vibro), 1,6,9 (impact)8106 5, 6, 7, 8, 9 (vibro)
Table 2.3. Listing of hydrophones used for each pile drive.
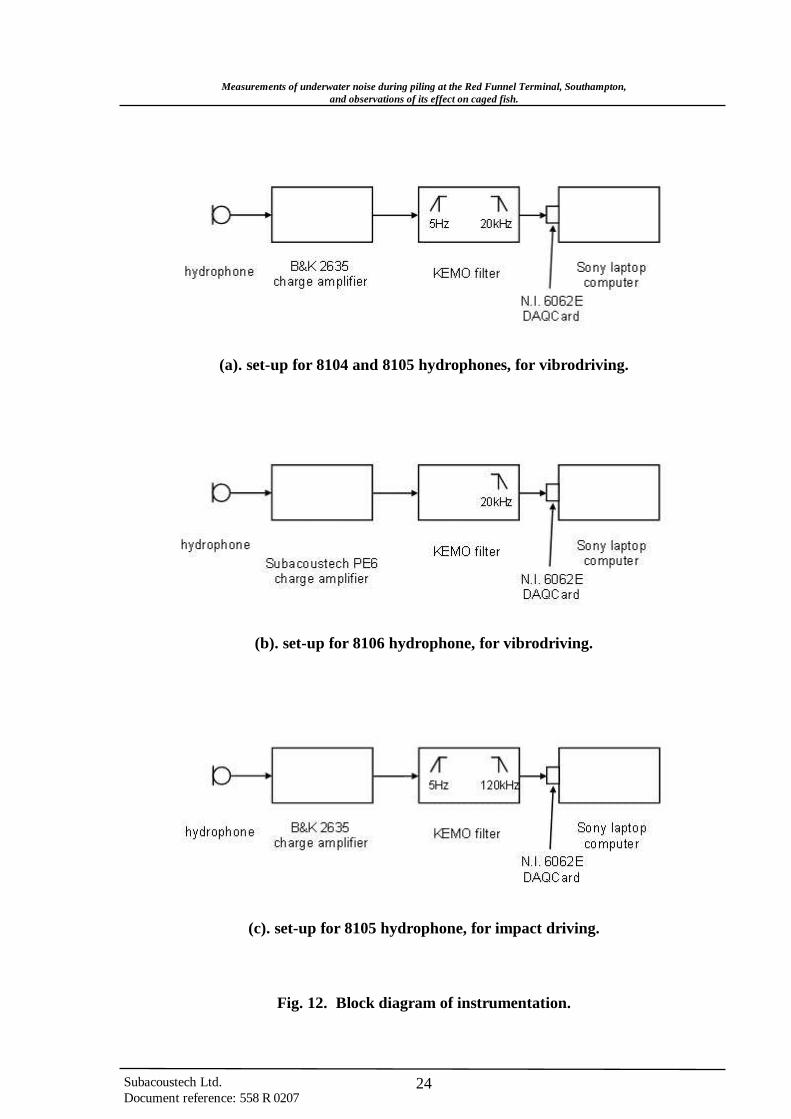
For the vibrodriving measurements the 8104 and 8105 hydrophones were connected to a Brüel& Kjær Type 2635 Charge Amplifier to condition the signal, and the output from this amplifierwas fed to a Kemo filter, set to have a passband of 5 Hz to 20 kHz. The 8106 hydrophone,which has a built-in pre-amplifier adjacent to the pressure sensing element, was connected to aSubacoustech PE6 power supply/amplifier. The output from this was fed to the Kemo filter,set to have a lowpass cutoff frequency of 20 kHz.
Fig. 12 is a block diagram of the instrumentation setup.
The output from the 2635 or PE6 amplifier was fed to a National Instruments 6062EDAQCard, an analogue-to-digital converter card, which was inserted in a PCMCIA slot in aSony laptop computer. The computer ran a program, written using the National InstrumentsLabVIEW application, to digitize the signal and calculate a dBht (Salmo salar) value on onesecond noise segments.
The hydrophone was located at the measurement position by being taped to a rope which hada weight fixed at its end, and the rope and ‘phone were lowered into the water until thehydrophone was 2.5 m below the water surface. The rope was adjusted at regular intervals tokeep the hydrophone at a constant depth as the tidal state varied.

Measurements of underwater noise during piling at the Red Funnel Terminal, Southampton,and observations of its effect on caged fish.
Subacoustech Ltd.Document reference: 558 R 0207
6
After consultation with the Dean & Dyball operatives, and when the pile tube had been readiedand it was clear that the driving operation was about to commence, the computer program wasstarted. Data were captured continuously until the pile tube had been driven to depth, or therewas a lengthy period when no driving was taking place because difficulties had beenencountered.
Measurements of underwater noise during piling at the Red Funnel Terminal, Southampton,and observations of its effect on caged fish.
Subacoustech Ltd.Document reference: 558 R 0207
7
3. Analysis of measurements and results.
3.1. Vibro driver.
Part of a typical sound pressure level vs. time history obtained at position R5 (at the end ofTown Quay, at 417.4 m from the piling) on the 18th September 2003 for the vibro driven pilecase is shown in Fig. 13. The figure illustrates the level of the sound in dB as a function of thetime of day. The upper trace, in blue, indicates the unweighted sound level in dB re 1 µPa,and the lower trace the level in dBht (Salmo salar), i.e., as a frequency weighted level abovethe hearing threshold of salmon. Also marked on the figure are the periods during whichvibropiling was undertaken.
First, looking at the unweighted sound pressure levels, it can be seen that there are periodicshort but relatively large increases in level up to about 150 dB. These are associated with thepassage of vessels along Southampton Water, which is a busy waterway, and the passage offerries into the Red Funnel terminal. Most of these movements were noted at the time of themeasurements, and have been noted on the figure. It is interesting to note that from about15:00 hrs to the end of the recording at 17:00 hrs there is a significant and continuous increasein level over the earlier part of the recording from 14:00 hrs to 15:00 hrs. This is due to noisefrom the dredger Bluefin, which was removing silt from the waterway by suction dredging. The dredger was at a distance of about 200 m from the measurement position.
In respect of the vibropiling, it may be seen that there is no discernible increase of the signalwhen the driving is taking place compared to when it is not; in fact the vibropiling could not bediscerned in the time history. It was noted when listening to the recordings that thebackground noise was completely dominated by other man-made noise, and in particular bythe movement of vessels.
It is interesting to note that there is little difference in the shape of the time histories (i.e. in thelevel variations over time between the dBht (Salmo salar) values and the unweighted dBlevels), other than the dBht (Salmo salar) values being of much lower level. The lower levelresults from salmon being relatively insensitive to sound, and to a lesser degree from theirlimited hearing bandwidth.
Similar results were noted for other recordings made during vibropiling, and in general therewas no discernible difference between recordings of sound pressure level vs. time history madeon days on which vibropiling was being conducted and those on which there was novibropiling.
In summary, it may be concluded that in respect of the vibropiling, at the range at whichmonitoring was conducted of 417 m, there was no discernible contribution from the pilingabove the background noise. It was noted when listening to the recordings that the vibropilingcould not be heard above the background noise caused by the movement of vessels.
3.2. Impact driver
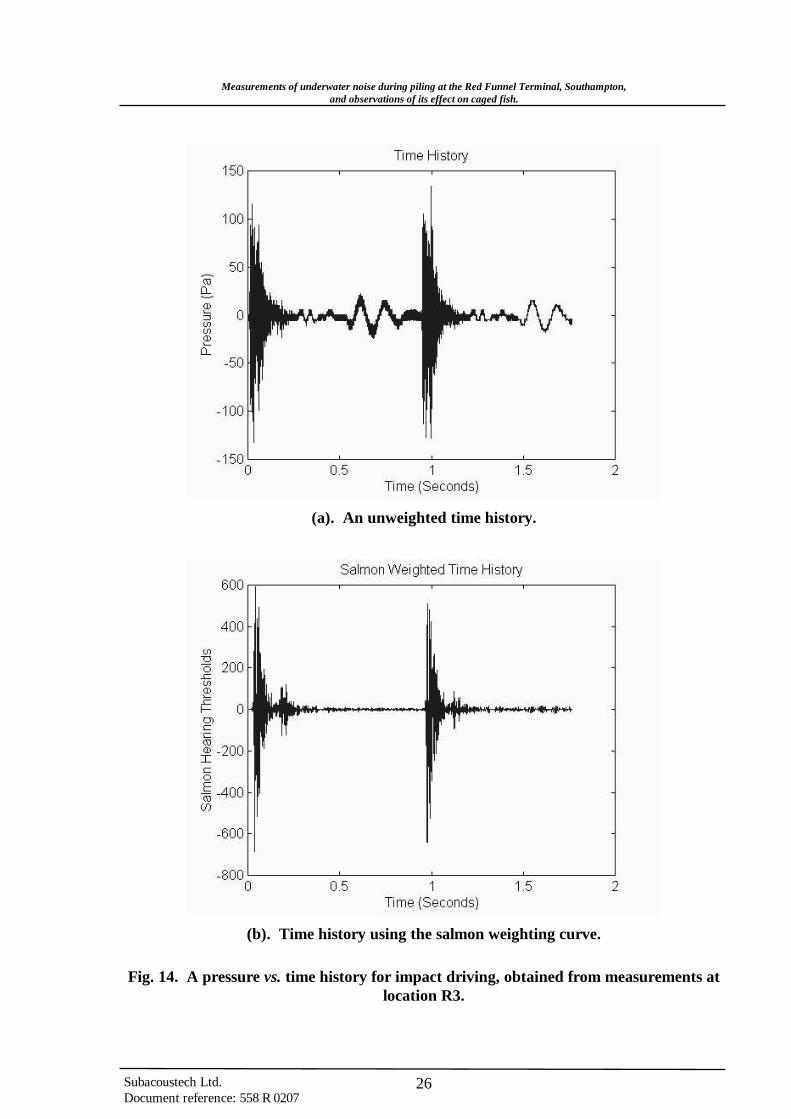
Fig. 14 is a plot of a typical pressure time history recorded at location R3; a section of therecording having two pile driver strikes has been illustrated. Fig. 14 (a) illustrates the soundpressure in linear units, and Fig. 14 (b) illustrates the identical recording, but in units of salmonhearing thresholds. First, looking at the unweighted levels, it may be seen that there is a highlevel of impulsive sound as the pile is struck, having a peak-to-peak pressure of about 200 Paand a roughly exponential decay, with a time constant of about 0.1 sec. There are two laterarrivals, one small arrival occurring at about 0.2 sec after the main arrival, and a further large
Measurements of underwater noise during piling at the Red Funnel Terminal, Southampton,and observations of its effect on caged fish.
Subacoustech Ltd.Document reference: 558 R 0207
8
arrival about 0.5 sec after the main arrival. These are thought to be seismic arrivals carried inthe seabed.
The salmon hearing threshold weighted data of Fig. 14 (b) is generally similar in form to theunweighted data. It is interesting to note, however, that the seismic arrivals, which are at afrequency of about 10 Hz, have disappeared due to the relative insensitivity of salmon to thesefrequencies of sound.
Fig. 15 illustrates the peak-to-peak Sound Pressure Level of the impact piling as a function ofthe range from the piling, for all three piles driven. It may be seen that there is a significantscatter in the levels of noise recorded. It may be noted that although overall there was ageneral fall in noise level with range, there are some points where the noise was significantlyhigher or lower than the general trend. The reason for these is not known, but it is possiblethat it results from partial focussing or defocussing of noise during propagation through thewater and sediments. There is also a significant variation in overall level between the threedifferent piles driven.
In order to generalise measurements to provide an objective assessment of degree of anyenvironmental effect and the range within which it will occur, it is normal to represent thesound in terms of two parameters. These are:-
1. The Source Level (i.e. level of sound) generated by the source, and the
2. Transmission Loss, i.e. the rate at which sound from the source is attenuated as itpropagates.
If a given sound can be represented in terms of these two parameters it allows the sound levelat all distances to be specified. Usually the decrease in sound pressure level (SPL) is modelledas being due to geometric losses, i.e. the sound mainly reduces as a result of being spread overan increasing area. Under these circumstances the (SPL) is modelled as
SPL = SL – Ng log(R)
where SL is the source level of the noise source, Ng is an geometric attenuation constant andR is the range in metres from the source.
However, for the measurements of impact piling at the Red Funnel terminal, the losses in levelwith range were thought to be mainly due to absorption; consequently a reasonable fit is givenby the linear equation
SPL = SL – Na (R)
where the Source Level is about 194 dB re 1 µPa, and the Transmission Loss rate Na is about0.15 dB per metre. At the range at which most of the monitoring was conducted (400 m) theaverage level from the impact piling would thus be 134 dB re 1 µPa
It is interesting to note that the Source Level of 194 dB is slightly higher than that measuredduring previous measurements at Littlehampton (Nedwell & Edwards, (2002)) of 192 dBre 1 µPa. These levels are,however, very much lower than others obtained by the authors forunderwater piling in deep water, where Source Levels of 246 dB re 1 µPa @ 1 metre havebeen recorded, associated with propagation to large distances.

Measurements of underwater noise during piling at the Red Funnel Terminal, Southampton,and observations of its effect on caged fish.
Subacoustech Ltd.Document reference: 558 R 0207
9
4. Observations of fish behaviour.
4.1. Fish monitoring methods.
4.1.1. Source and preparation of fish.
Owing to the problems of obtaining salmon for testing, farmed brown trout (Salmo trutta)were used in the tests, being the most closely related species. These were freshwater trout andwere obtained from Itchen Valley Trout Farm at Alresford. The average size of fish was25.4 cm (range 24.0-28.0 cm).
Prior to experimentation the fish were transported to Fawley Aquatic Research Laboratoriesand acclimated to seawater. This process was carried out gradually over a period of 5 days ormore without any apparent adverse effects on the fish. During this time and during themonitoring they were fed pelleted food.
4.1.2. Fish cage design and deployment.
Cages were purpose built for the project and were based on a nominal 1 m cube design. Theframes were made from mild steel angle and spray-painted. Plastic mesh of about 25 mmsquare aperture was fixed to the outside of the frames using plastic-coated wire. A 20 cm-square flap opening was made in the top of the cage, the edges being reinforced with 25 mmplastic pipe attached to both the flap and the outer edges. These were used for introducing thefish and for removing them at the end of the trials. Cable-ties were used to close the openingsduring the tests. A photograph of a cage is given in Fig. 16.
During the trials the cages were taken to their respective positions suspended from 25 litresurface buoys by four ropes fixed to the top corners of the cage. The rope lengths wereadjusted to put the centre of the cage 2.5 m below the water surface. Although the monitoringfor Red Funnel Ltd required only a cage at 400 m (nominal), cages were also positioned atnominal distances of 25 m (cage 1), 50 m (cage 2), 100 m (cage 3), and 200 m (cage 4) as partof the EA-funded research project; these were as close as possible to the acoustic monitoringpositions, without the hydrophones being able to touch the cages. A further ‘control’ cagewas located in the dock of Fawley Power Station, approximately 10 km from the piling site;this dock was not subject to boat traffic or other significant disturbance during the periodwhen fish were held there.
4.1.3. Closed-circuit television monitoring.
The behaviour of the fish was monitored via underwater closed-circuit television (CCTV)cameras fitted inside each of the fish cages. Aquacam® monochrome underwater cameraswere used, these being waterproof to 10 m depth. Mountings for the cameras were fixed closeto the top corner of the inside of the cage. The cameras were introduced via the openings andattached to the mountings. This allowed the cameras to be aimed across the long diagonal ofthe cage for maximum field of view.
Signals from the cameras were fed into multiplexers and thence into time lapse video cassetterecorders (VCRs) and video monitors. The longest cable run was 180 m and a line amplifierwas used to boost the signal and improve picture quality. The VCRs were run in 3-hour mode(i.e. non-time-lapse) and tapes were changed every 3 hours during the working day. Thismeant that a considerable number of hours of ‘control’ (background) records were made whenthere were numerous disturbances from boat traffic, including the regular arrivals anddepartures of the Red Funnel Isle of Wight ferries, small craft movements and the occasionalocean liner passing. A typical frame from the video recording is shown in Fig. 17.
Measurements of underwater noise during piling at the Red Funnel Terminal, Southampton,and observations of its effect on caged fish.
Subacoustech Ltd.Document reference: 558 R 0207
10
On completion of the field work sequences of images were digitized and transferred to CD-ROMs using a WinTV® digital interface.
4.1.4. Assessing fish reactions to noise.
Video tapes were reviewed after the event to identify any changes in behaviour that mighthave resulted from the piling noise or other local underwater noise events associated with shipmovements in the locality. All reviewing was undertaken ‘blind’ by the operators, i.e. theywere unaware of what sequences correlated with particular events and this information wasonly later added by another operator.
Two types of behaviour were investigated:
Startle reactions: A startle reaction here was defined as the ‘C-start’ behaviour described byBlaxter and Hoss (1981) in response to an underwater sound stimulus, i.e. a sudden C-shapedflexure of the fish’s body, which is quite clearly different from routine swimming activity.
Fish activity level: The second type of behaviour considered was a simple change in activitylevel of the fish. Captive fish that are exposed to irritating stimuli commonly show ‘millingbehaviour’ , in which the fish swim faster and make random turns. This type of behaviour isbelieved to provide a strategy for sampling the environment to expedite the fish’s escape frompotentially harmful conditions.
Activity level was measured by counting the number of times a fish entered the camera’s fieldof view within a two-minute observation period. This was possible because the field of viewwas limited by water clarity, so that the fish moved frequently in and out of vision. For eachtype of event investigated, a two-minute ‘control’ period preceded each two-minute ‘event’period. The control and event activity levels were compared using the non-parametric Mann-Whitney U-test (Campbell (1974)) with the null hypothesis that activity levels were notsignificantly different at a specified probability level.
4.1.5. Post-trial treatment of fish.
Fish were removed from the cages at the end of the trials and returned to the laboratory forfurther analysis. The fish were examined for signs of pressure-related injury(Turnpenny (1998)), e.g. externally for haemorrhaging of the eyes or gas embolisms in theeyes, and internally for swimbladder rupture.
4.2. Fish behavioural reactions.
4.2.1. Behavioural reactions during vibro-piling
The initial cage placed at Location 5 (end of Town Quay, 400 m) to fulfil the Red Funnelmonitoring obligations was put in position 24 h prior to the start of vibropiling but was raidedovernight and the fish stolen. Since cages were in place at the other locations and fish in theseshowed no reaction to vibropiling, the cage at Location 5 was not replenished until 24 hbefore the start of impact piling. Observations are presented here for the cages at Locations 1and 2.
Analysis of startle reactions was based on review of the VCR images at the start-up instant ofeach vibropiling session and for the next 5 seconds. No startle response was seen in any of thevibropiling sequences for any of the piles driven by this method.
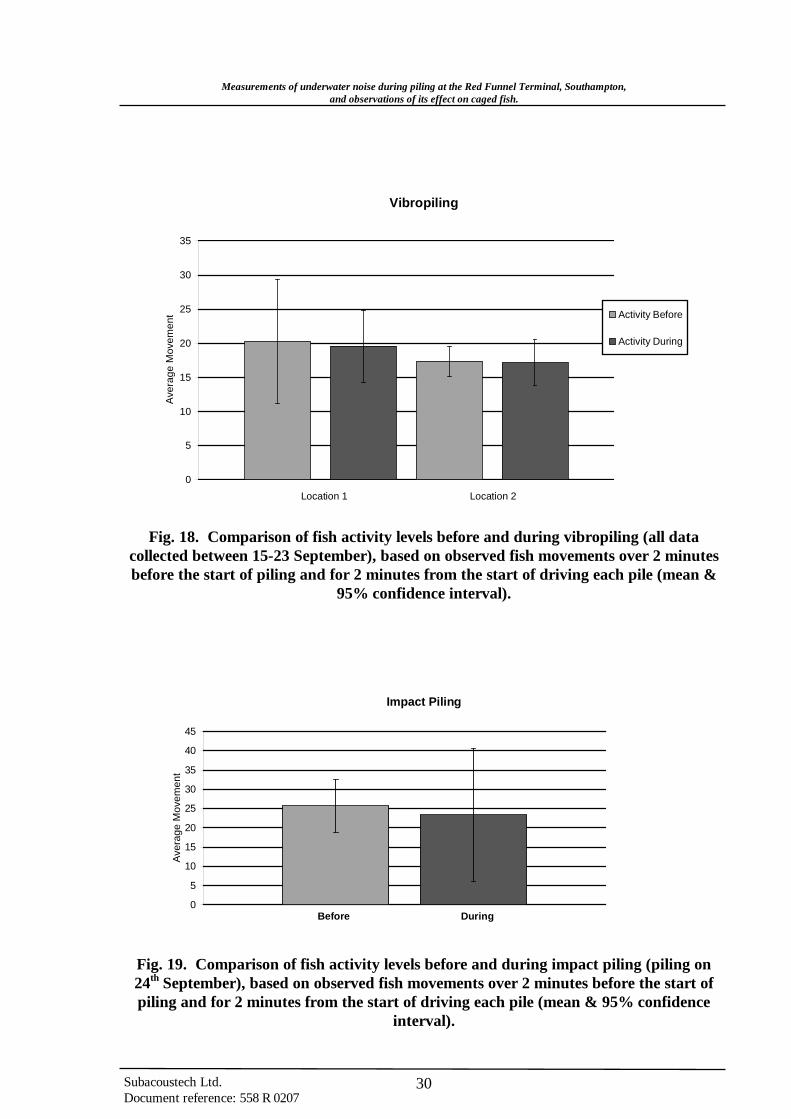
Table 4.1 and Fig. 18 show the activity level observations (number of movements per 2-minuteperiod) for the 2-minute period prior to piling and then for the first 2 minutes duringvibropiling. Activity levels are seen to remain similar before and after the start of piling. The

Measurements of underwater noise during piling at the Red Funnel Terminal, Southampton,and observations of its effect on caged fish.
Subacoustech Ltd.Document reference: 558 R 0207
11
data shown combine the observations for all of the vibropiling operations. The Mann-WhitneyU-test shows that there was no significant difference in activity level following thecommencement of vibropiling (P=0.001).
No. of movements per 2 min period Mann-Whitney U testLocation Before During U Z P
1 147.5 152.5 69.5 0.1443 0.88522 150.5 149.5 71.5 -0.028 0.9769
Table 4.1. Fish activity statistics for vibration piling.
4.2.2. Behavioural reactions during impact piling
Impact piling was carried out on 24th September and data are reported here only forLocation 5. Table 4.2 shows that no startle reaction was recorded for the start of each of thethree piling sessions that took place.
Pile Start Time Startle Reaction ?1 (914 mm) 08.41 no2 (508 mm) 11.11 no3 (505 mm) 11.54 no
Table 4.2. Fish startle reactions.
Activity levels recorded before and during the impact piling sessions are shown in Table 4.3and Fig. 19. These again show no significant difference (P=0.001) between activity levelsbefore and during testing.
No. of movements per 2 min period Mann-Whitney U testLocation Before During U Z P
5 12 9 3 0.654 0.512
Table 4.3. Fish activity statistics for impact piling.
4.3. Fish injuries
Table 4.4 records fish injuries investigated. No evidence of fish injuries was seen in either thefish held at Location 5 or in the Fawley controls.
Frequency (sample size 10 fish per cage)Type of Injury
Location 5 (Town Quay) Control (Fawley Dock)Swimbladder rupture 0 0
Eye haemhorrage 0 0Eye embolisms 0 0
Table 4.4. Fish injury records.
Measurements of underwater noise during piling at the Red Funnel Terminal, Southampton,and observations of its effect on caged fish.
Subacoustech Ltd.Document reference: 558 R 0207
12
4.4. Summary of observations on fish.
The caged trout monitoring revealed:
1. No evidence that trout reacted to impact piling at the regulatory stand-off range of 400 m;
2. No evidence that trout reacted to vibropiling even at close range (<50 m);
3. No evidence of gross physical injury to trout at the monitoring range of 400 m.

Measurements of underwater noise during piling at the Red Funnel Terminal, Southampton,and observations of its effect on caged fish.
Subacoustech Ltd.Document reference: 558 R 0207
13
5. Conclusions
1. Monitoring measurements of the waterborne noise resulting from impact piling andvibropiling were taken at Town Quay, Southampton, during construction operations atRed Funnel’s Southampton Terminal in September 2003. At the same time, the reactionsof caged farmed brown trout (Salmo trutta) was observed on CCTV equipment todetermine whether there was any observable effect of the piling on the their behaviour.
2. In respect of the vibropiling, at the range at which monitoring was conducted of417 metres, the noise could not be detected above background noise, with any noise fromthe vibropiling being drowned by noise from the movement of vessels.
3. The caged trout monitoring revealed no evidence that trout reacted to vibropiling at even aclose range of less than 50 m.
4. The Source Level of the impact piling was about 194 dB re 1 µPa, and the TransmissionLoss rate Na is about 0.15 dB per metre.
5. There was no evidence of gross physical injury or that trout reacted to the impact piling atthe monitoring range of 400 m, at which range the sound level would have been about134 dB re 1 µPa.

Measurements of underwater noise during piling at the Red Funnel Terminal, Southampton,and observations of its effect on caged fish.
Subacoustech Ltd.Document reference: 558 R 0207
14
References
Abbott, R. & Bing-Sawyer, E. (2002). Assessment of pile driving impacts on the Sacramentoblackfish (Othodon microlepidotus). Draft report prepared for Caltrans District 4.
Blaxter, J.H.S. & Hoss, D.E. (1981). Startle responses in herring: the effect of sound stimulusfrequency, size of fish and selective interference with the acousto-lateralis system. Journal ofthe Marine Bioacoustics Association, UK. 61: 871-9.
Campbell, R.C. (1974). Statistics for Biologists. Cambridge University Press, Cambridge.
Nedwell, J.R. & Edwards, B. (2002). Measurements of underwater noise in the Arun Riverduring piling at County Wharf, Littlehampton. Subacoustech Report Reference: 513 R 0104.
Nedwell, J.R, Turnpenny, A.W.H. & Lambert, D. (2003). Objective design of acoustic fishdeflection systems. US EPA Symposium on Cooling Water Intake Systems to Protect AquaticOrganisms.
Parvin, S.J & Nedwell, J,R. (1995). Underwater sound perception and the development of anunderwater noise weighting scale. Journal of the Society for Underwater Technology,21(1): 1.
Turnpenny, A.W.H. (1998). Mechanisms of fish damage in low-head turbines: an experimentalappraisal. In: Fish Migration and Fish Bypasses (Ed. Jungwirth, M., Schmutz, S. andWeiss, S.). Fishing News Books, Oxford, Blackwell: 300-314.
Measurements of underwater noise during piling at the Red Funnel Terminal, Southampton,and observations of its effect on caged fish.
Subacoustech Ltd.Document reference: 558 R 0207
15
Figures
Fig. 1. Photograph taken from quayside with ferry docked at terminal, and vehiclesdisembarking along linkspan. Structure on left of photograph is covered walkway for
pedestrian passengers, and the dolphin on which it rests can be seen.

Measurements of underwater noise during piling at the Red Funnel Terminal, Southampton,and observations of its effect on caged fish.
Subacoustech Ltd.Document reference: 558 R 0207
16
MOTOR
FRAME
ECCENTRIC
IMPACT POINT
JAW GRIPPING PILE
PILE
SPRING
Fig. 2. Sketch to illustrate principle of vibro pile driving.
RAM VELOCITY
RAM
TOP PLATEHAMMER CUSHION
HELMET
PILE
PILE CUSHION(WHEN USED)
Fig. 3. Sketch to illustrate principle of impact piling.
Measurements of underwater noise during piling at the Red Funnel Terminal, Southampton,and observations of its effect on caged fish.
Subacoustech Ltd.Document reference: 558 R 0207
17
60
80
100
120
140
160
10 100 1000
frequency (Hz)
SP
L (d
B r
e 1
mic
roP
a)
salmon
Fig. 4. An audiogramme of salmon hearing.

Measurements of underwater noise during piling at the Red Funnel Terminal, Southampton,and observations of its effect on caged fish.
Subacoustech Ltd.Document reference: 558 R 0207
18
Fig. 5. Sketch map showing location of site in Southampton
Measurements of underwater noise during piling at the Red Funnel Terminal, Southampton,and observations of its effect on caged fish.
Subacoustech Ltd.Document reference: 558 R 0207
19
Fig. 6. Sketch map showing piling and measurement locations.
Measurements of underwater noise during piling at the Red Funnel Terminal, Southampton,and observations of its effect on caged fish.
Subacoustech Ltd.Document reference: 558 R 0207
20
Fig. 7. Details of pile locations.

Measurements of underwater noise during piling at the Red Funnel Terminal, Southampton,and observations of its effect on caged fish.
Subacoustech Ltd.Document reference: 558 R 0207
21
Fig. 8. Photograph of pile tubes being unloaded from lorry.
Fig. 9. Photograph of site during piling operations. The two groups of four piles to oneside of the linkspan can be seen. The other two piles (numbers 9 and 10) are obscured
by the structure (pedestrian walkway) on the right of the photograph. One pile in eachof the groups was left standing proud, for later dynamic testing purposes using the
impact driver.
Measurements of underwater noise during piling at the Red Funnel Terminal, Southampton,and observations of its effect on caged fish.
Subacoustech Ltd.Document reference: 558 R 0207
22
Fig. 10. A PVE 2316 VM vibropiling driver. It is shown resting in a cradle madeof I-section beams.
Measurements of underwater noise during piling at the Red Funnel Terminal, Southampton,and observations of its effect on caged fish.
Subacoustech Ltd.Document reference: 558 R 0207
23
(a). A view of the lower end of the impact driver, while it was lying on a lorry.
(b). The impact driver being held on the top of a pile for driving purposes.
Fig. 11. The BSP 357/9 Hydraulic Drop Hammer used for impact driving.
Measurements of underwater noise during piling at the Red Funnel Terminal, Southampton,and observations of its effect on caged fish.
Subacoustech Ltd.Document reference: 558 R 0207
24
(a). set-up for 8104 and 8105 hydrophones, for vibrodriving.
(b). set-up for 8106 hydrophone, for vibrodriving.
(c). set-up for 8105 hydrophone, for impact driving.
Fig. 12. Block diagram of instrumentation.

Measurements of underwater noise during piling at the Red Funnel Terminal, Southampton,and observations of its effect on caged fish.
Subacoustech Ltd.Document reference: 558 R 0207
25
Fig. 13. A typical sound pressure level vs. time history obtained at the end of TownQuay (location R5) for a vibro-driving case.
Measurements of underwater noise during piling at the Red Funnel Terminal, Southampton,and observations of its effect on caged fish.
Subacoustech Ltd.Document reference: 558 R 0207
26
(a). An unweighted time history.
(b). Time history using the salmon weighting curve.
Fig. 14. A pressure vs. time history for impact driving, obtained from measurements atlocation R3.

Measurements of underwater noise during piling at the Red Funnel Terminal, Southampton,and observations of its effect on caged fish.
Subacoustech Ltd.Document reference: 558 R 0207
27
Fig. 15. Variation of peak-to-peak pressure with distance for impact driving.

Measurements of underwater noise during piling at the Red Funnel Terminal, Southampton,and observations of its effect on caged fish.
Subacoustech Ltd.Document reference: 558 R 0207
28
(a). A general view.
(b). View showing flap opening for introducing and removing the fish.
Fig. 16. A cage used for the fish monitoring.

Measurements of underwater noise during piling at the Red Funnel Terminal, Southampton,and observations of its effect on caged fish.
Subacoustech Ltd.Document reference: 558 R 0207
29
Fig. 17. A clip from the fish monitoring video.
Measurements of underwater noise during piling at the Red Funnel Terminal, Southampton,and observations of its effect on caged fish.
Subacoustech Ltd.Document reference: 558 R 0207
30
Vibropiling
0
5
10
15
20
25
30
35
Ave
rage
Mov
emen
t Activity Before
Activity During
Location 2Location 1
Fig. 18. Comparison of fish activity levels before and during vibropiling (all datacollected between 15-23 September), based on observed fish movements over 2 minutesbefore the start of piling and for 2 minutes from the start of driving each pile (mean &
95% confidence interval).
Impact Piling
0
5
10
15
20
25
30
35
40
45
Ave
rage
Mov
emen
t
Before During
Fig. 19. Comparison of fish activity levels before and during impact piling (piling on24th September), based on observed fish movements over 2 minutes before the start ofpiling and for 2 minutes from the start of driving each pile (mean & 95% confidence
interval).

Measurements of underwater noise during piling at the Red Funnel Terminal, Southampton,and observations of its effect on caged fish.
Subacoustech Ltd.Document reference: 558 R 0207
31
Appendix 1: Hydrophone calibration certificates
Measurements of underwater noise during piling at the Red Funnel Terminal, Southampton,and observations of its effect on caged fish.
Subacoustech Ltd.Document reference: 558 R 0207
32

Measurements of underwater noise during piling at the Red Funnel Terminal, Southampton,and observations of its effect on caged fish.
Subacoustech Ltd.Document reference: 558 R 0207
33