measures of central tendency and …richardoco.weebly.com/uploads/1/9/7/2/19725327/module_10.pdfi....
TRANSCRIPT

I. INTRODUCTION AND FOCUS QUESTIONS
MEASURES OF CENTRAL TENDENCY AND MEASURES OF VARIABILITY
443
Have you ever wondered why a certain size of shoe or brand of shirt is made more available than other sizes?
Have you asked yourself why a certain basketball player gets more playing time than the rest of his team mates?
Have you thought of comparing your academic performance with your classmates? Have you wondered what score you need for each subject area to qualify for honors? Have you, at a certain time, asked yourself how norms and standards are made?

444
Inthismoduleyouwillfindoutthemeasuresofcentraltendencyandmeasuresofvari-ability. Remember to search for the answer to the following question(s):
• HowcanImakeuseoftherepresentationsanddescriptionsofagivensetofdata?• Whatisthebestwaytomeasureagivensetofdata?
In this module, you will examine these questions when you study the following lessons.
II. LESSONS AND COVERAGE
Lesson 1: Measures of Central Tendency of Ungrouped Data Lesson 2: Measures of Variability of Ungrouped Data Lesson 3: Measures of Central Tendency of Grouped Data Lesson 4: Measures of Variability of Grouped Data
Purefoods TJ Giants | 2007-08 PBA Philippine Cup Stats
http://basketball.exchange.ph/2008/03/28/giant-steps-for-purefoods/

445
In these lessons, you will learn to:Lesson Objectives:
1 • Findthemean,median,andmodeofungroupeddata• Describeandillustratethemean,median,andmodeofungroupeddata
2
• Discussthemeaningofvariability• Calculatethedifferentmeasuresofvariabilityofagivenungroupeddata:
range, standard deviation, and variance• Describe and interpret data using measures of central tendency and
measures of variability
3 • Findthemean,median,andmodeofgroupeddata• Describeandillustratethemean,median,andmodeofgroupeddata
4
• Discussthemeaningofvariability• Calculatethedifferentmeasuresofvariabilityofagivengroupeddata:
range, standard deviation, and variance• Describe and interpret datausingmeasuresofcentral tendencyand
measures of variability
Module MapModule Map Here is a simple map of the lessons that will be covered in this module.
Descriptive Statistics
Ungrouped Data
Measures of Central Tendency
Measures of Central Tendency
Measures of Variability
Measures of Variability
Grouped Data
To do well in this module, you will need to remember and do the following:
1. Study each part of the module carefully. 2. Take note of all the formulas given in each lesson.
3. Haveyourownscientificcalculator.Makesureyouarefamiliarwiththekeysandfunctions in your calculator.

446
III. PRE - ASSESSMENT
Findouthowmuchyoualreadyknowaboutthistopic.Onaseparatesheet,writeonly the letter of the choice that you think best answers the question.
1. Whichmeasureofcentraltendencyisgenerallyusedindeterminingthesizeofthe most saleable shoes in a department store?
a. mean c. mode b. median d. range
2. The most reliable measure of variability is _______________ .
a. range c. average deviation b. variance d. standard deviation
3. Forthesetofdataconsistingof8,8,9,10,10,whichstatementistrue?
a. mean = mode c. mean = median b. median = mode d. mean < median
4. Whichmeasureofcentraltendencyisgreatlyaffectedbyextremescores?
a. mean c. mode b. median d. none of the three
5. Margiehasgrades86,68and79inherfirstthreetestsinAlgebra.Whatgrademust she obtain on the fourth test to get an average of 78?
a. 76 c. 78 b. 77 d. 79
6. Whatisthemedianageofagroupofemployeeswhoseagesare36,38,18,1016 and 15 years?
a. 10 c. 16 b. 15 d. 17
7. Nine people gave contributions in pesos 100, 200, 100, 300, 300, 200, 200, 150, 100,and100foradoorprize.Whatisthemediancontribution?
a. Php 100 c. Php 175 b. Php 150 d. Php 200

447
8. If the heights in centimetres of a group of students are 180, 180, 173, 170, and 167, what is the mean height of these students?
a. 170 c. 174 b. 173 d. 180
9. Iftherangeofasetofscoresis14andthelowestscoreis7,whatisthehighestscore?
a. 21 c. 14 b. 24 d. 7
10. Whatisthestandarddeviationofthescores5,4,3,6and2?
a. 2 b. 2.5 c. 3 d. 3.5
11. Whatistheaverageheightofthetwoteamsininches?
a. 76 b. 78 c. 72 d. 75
Ifyouweretojoinanyofthesetwoteams,whichteamwouldyouchoose?Why?
12. Electra Company measures each cable wire as it comes off the product line. The lengthsincentimetersofthefirstbatchoftencablewireswere:10,15,14,11,13,10,10,11,12and13.Findthestandarddeviationoftheselengths.
a. 1.7 b. 1.8 c. 11.9 d. 10.9
13. Whatisthevarianceinitem12?
a. 3.4 b. 3.3 c. 3.24 d. 2.89
For Items 14 – 15.Avideoshopownerwantstofindouttheperformancesalesofhistwobranchstoresforthelastfivemonths.Thetableshowstheirmonthlysalesinthousandsofpesos.
BranchA 20 18 18 19 17Branch B 17 15 25 17 18
4 76611
12 16
Feetand inches 6' 6'1" 6'4" 6'4" 6'6" 5'7" 6' 6'4" 6'4" 7' inches 72 73 76 76 78 67 72 76 76 84
448
14. Whataretheaveragesalesofthetwostores?
a. 18 b. 18.4 c.19 d.19.5
15. Whichstoreisconsistentlyperforming?Why?
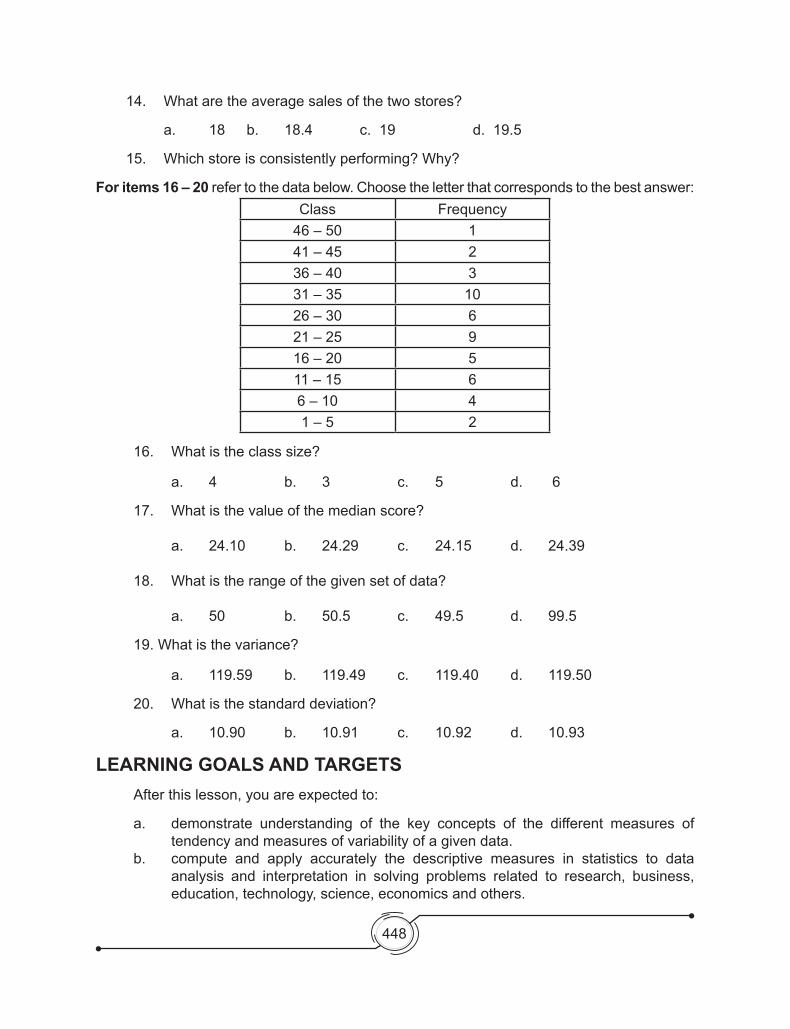
For items 16 – 20 refer to the data below. Choose the letter that corresponds to the best answer:Class Frequency
46 – 50 141 – 45 236 – 40 331 – 35 1026 – 30 621 – 25 916 – 20 511 – 15 66 – 10 41 – 5 2
16. Whatistheclasssize?
a. 4 b. 3 c. 5 d. 6
17. Whatisthevalueofthemedianscore?
a. 24.10 b. 24.29 c. 24.15 d. 24.39 18. Whatistherangeofthegivensetofdata?
a. 50 b. 50.5 c. 49.5 d. 99.5
19.Whatisthevariance?
a. 119.59 b. 119.49 c. 119.40 d. 119.50
20. Whatisthestandarddeviation?
a. 10.90 b. 10.91 c. 10.92 d. 10.93
LEARNING GOALS AND TARGETS Afterthislesson,youareexpectedto:
a. demonstrate understanding of the key concepts of the different measures of tendency and measures of variability of a given data.
b. compute and apply accurately the descriptive measures in statistics to data analysis and interpretation in solving problems related to research, business, education, technology, science, economics and others.

449
What to KnowWhat to Know
Let us begin with exploratory activities that will introduce you to the basic concepts of measures of central tendency and how these concepts are applied in real life.
11Measures of Central
Tendency of Ungrouped Data
Lesson
Activity1containsfamiliarexercisesprovidedtoyouinyourGrade7modules
WHAT’S THE STORY BEHIND?Activity 1
1. Daria bought T-shirts from a department store. She paid an average of Php 74 per shirt. Part of the torn receipt is shown below.
a. How much did she pay for each white shirt? b. Howmuchdidshepayinall?Why?
2. The bar chart shows the number of magazines borrowed from the library last week.

450
a. HowmanymagazineswereborrowedonFriday?Why?b. What is theaveragenumberofmagazinesborrowedperday lastweek?What
doesthisvaluetellyou?Why?`c. Onwhatdayisthemostnumberofmagazinesborrowed?Why?d. DescribethenumberofmagazinesborrowedonaTuesday.Whydoyouthink
so?
3. The graph below shows the percentage of survey respondents reporting that they are satisfiedwiththeircurrentjob.Thehorizontalaxisistheyearsofschoolingfordifferentrespondents.
a. Whatinformationcanbeobtainedfromthegraph?b. Whatconclusioncanbemade?Why?c. Whatmadeyousaythatyourconclusionwascorrect?d. Whatnecessaryadjustmentcouldbemadetoprovideaccurateinformationbased
on the graph?
MEAL DEAL
Activity 2
Tocatertofivehundred(500)studentshavingsnacks all at the same time, your school canteen designed three meal package for the students to choose from. The monitors of each section were tasked to collect the weekly orders of each student.

451
MEAL 3=====================Item PriceHotdog Sandwich ₱10.00FruitSalad ₱7.00FrenchFries₱5.00Juice ₱5.00=====================Cost ₱27.00
MEAL 2=====================Item PriceBaked Mac ₱15.00Garlic Bread ₱5.00Veggie Salad ₱5.00Juice ₱5.00=====================Cost ₱30.00
MEAL 1=====================Item PriceHamburger ₱15.00Spaghetti ₱10.00FrenchFries ₱5.00Juice ₱5.00=====================Cost ₱35.00
Directions: Formyourselvesintogroups.Distributetoeachmemberofthegroupthethreemeal packages. Make a week list of your preferred meal package. Record your group’s order for the week on the sheet of paper below. Discuss with your group mate the answer to the questions below.
Meal Package DAILY MEAL PACKAGE PREFERENCE
1 Monday Tuesday Wednesday Thursday Friday Total Sales23
TotalSales
A. Inyourgroup, 1. what is the most preferred meal package?
2. how much was the canteen’s daily sales from each package? weekly sales?
B. If all the groups will summarize their report,
3. what might be the average weekly sales of the school canteen on each type of package?
4. explain how these will help the canteen manager improve 4.1 the sales of the school canteen. 4.2 the combination of the food in each package.
C. Make a combination of the food package of your choice.
QU
ESTIONS?

452
What to ProcessWhat to Process
Here are some enabling activities/experiences that you will perform to validate your understandingonaveragesintheWhattoKnowphase.
After doing the activities in this section, it is expected that you will be able toanswer the question, “What is the best way to measure a given set of data?”. The understanding gained would erase misconceptions about the different measures of central tendency that you have encountered before.
The activities that you have just accomplished provided you situations where the basic concepts of statistics are applied. In this module, you will do activities that will help you in answering the question “How can I make use of the representations and descriptions of a given set of data?”.
WHICH IS TYPICAL? Activity 3
Directions: Read the statements found at the right column in the table below If you agree with the statement, place a checkmark () in the Before-Lesson-Response column beside it. If you don’t, mark it with (x).
Before Lesson
Response
Statement
24 is typical to the numbers 17, 25 and 306isthetypicalscoreinthesetofdata3,5,8,6,910isatypicalscorein:8,7,9,10,and618istypicalageinworkers’ages17,19,20,17,46,17,185 is typical in the numbers 3, 5, 4, 5, 7, and 5The mean is affected by the size of extreme valuesThe median is affected by the size of extreme values The mode is t affected by the size of extreme valuesThe mean is affected by the number of measuresThe median is affected by number of measuresThe mode is affected by the number of measures
representative
usual
average
normal

453
WATCH THIS!Activity 4
4.1 Agroupofstudentsobtainedthefollowingscoresinamathquiz: 8,7,9,10,8,6,5,4,3 Arrangingthesescoresinincreasingorder:3,4,5,6,7,8,8,9,10,
the mean is 6.7. 3,4,5,6,7,8,8,9,10
the median is 7. 3, 4, 5, 6, 7,8,8,9,10
the mode is 8. 3, 4, 5, 6, 7, 8, 8,9,10
Observehowthemean,medianandmodeofthescoreswereobtained.Makeaguess and complete the statements below.
a. The mean 6.7 was obtained by _________________________________.b. The median 7 is the __________________________________________.c. The mode 8 is the ___________________________________________.
IfyouhavenotdiscoveredhowthevalueswereobtainedproceedtoActivity4.2.
4.2 If the score 5 of another student is included in the list. 3,4,5,5,6,7,8,8,9,10
The mean is 6.5. 3,4,5,5,6,7,8,8,9,10
The median is 6.5 3, 4, 5, 5, 6, 7,8,8,9,10
The mode is 5 and 8. 3, 4, 5, 5, 6, 7, 8, 8,9,10
Mean is also_v_r_g_

454
From these activities, you will see that the values are made to represent or describe a given set of data. You will know more about the characteristics of each type of measures of central tendency in the next activities and discussions.
Let’s take a look at the mean.
The Mean
The mean (also known as the arithmetic mean) is the most commonly used measure of central position. It is used to describe a set of data where the measures cluster or concentrate atapoint.Asthemeasuresclusteraroundeachother,asinglevalueappearstorepresentdistinctively the typical value.
It is the sum of measures x divided by the number N of measures in a variable. It is symbolized as x (read as x bar).Tofindthemean of an ungrouped data, use the formula
x = ∑xN
where ∑x = the summation of x (sum of the measures) and N = number of values of x.
Example: ThegradesinGeometryof10studentsare87,84,85,85,86,90,79,82,78,76.Whatis the average grade of the 10 students?
Solution:
x = ∑xN
x = 87+84+85+85+86+90+79+82+78+7610 = 832
10 x = 83.2 Hence, the average grade of the 10 students is 83.2.
Consider another activity.
Discuss with your groupmates, a. your observation about the values of the mean, the median and the
mode;b. how each value was obtained; andc. your generalizations based on your observations.
QU
ESTIONS?

455
WHO’S REPRESENTING?Activity 5
Sonya’sKitchenreceivedaninvitationforonepersonfromfoodexposition.Theservicecrew seven numbers is very eager to go. To be fair to all, Sonya decided to choose a person whose age falls within the mean age of her seven members.
Sonya’s Kitchen Crew
Cashier
She made a list such as below:
ServiceCrew Age
Manager 47 CookA 21 Cook B 20 Cashier 19 WaiterA 18 WaiterB 18 Waitress 18
a. Whatisthemeanageoftheservicecrew?b. Is there someone in this group who has this age?c. How many persons are older than the mean age? How many are
younger?d. Do you think this is the best measure of central tendency to use?
Explain.
QU
ESTIONS?

456
The middle value here or term in a set of data arranged according to size/magnitude (either increasing or decreasing) is called the median.
Consider another situation in the next activity.
WHO’S IN THE MIDDLE?Activity 6
Fromourpreviousexample,theagesofthecrewaregivenas18,20,18,19,21,18and47.Followthestepsbelow.
a. Arrangetheagesinnumericalorder. b. Whatisthemiddlevalue? c. Is there a crew with this representative age?d. Howmanycrewareyoungerthanthisage?Olderthanthisage?e. WhoisnowtherepresentativeofSonya’sKitchenintheFoodFair?f. Compare the results from the previous discussion (how the mean is
affected by the set of data). Explain.
QU
ESTIONS?
THE NEWLY-HIRED CREWActivity 7
Ifattheendofthemonth,Sonya’sKitchenhiredanothercrewmemberswhoseageis22,thedatanowconsistsofeightages:18,20,18,19,21,18,47and22,anevennumber.How many middle entries are there?
Sonya’s Kitchen Crew
Take note of how the mean is affected by extreme values. Very high or very low values can easily change the value of the mean.
Do the next activity to solve problems encountered.
457
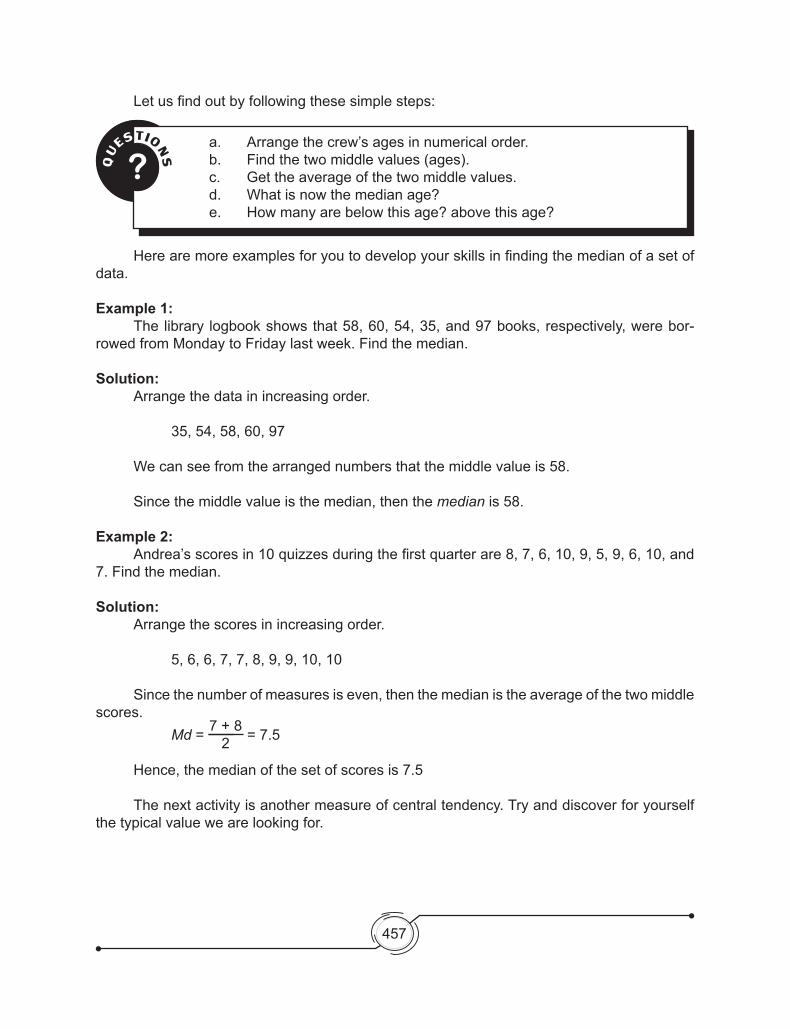
Letusfindoutbyfollowingthesesimplesteps:
a. Arrangethecrew’sagesinnumericalorder.b. Findthetwomiddlevalues(ages).c. Get the average of the two middle values. d. Whatisnowthemedianage?e. How many are below this age? above this age?
QU
ESTIONS?
Herearemoreexamplesforyoutodevelopyourskillsinfindingthemedianofasetofdata.
Example 1: Thelibrary logbookshowsthat58,60,54,35,and97books,respectively,werebor-rowedfromMondaytoFridaylastweek.Findthemedian.
Solution: Arrangethedatainincreasingorder.
35,54,58,60,97
Wecanseefromthearrangednumbersthatthemiddlevalueis58.
Since the middle value is the median, then the median is 58.
Example 2: Andrea’sscoresin10quizzesduringthefirstquarterare8,7,6,10,9,5,9,6,10,and7.Findthemedian.
Solution: Arrangethescoresinincreasingorder.
5,6,6,7,7,8,9,9,10,10
Since the number of measures is even, then the median is the average of the two middle scores. Md = 7 + 8
2 = 7.5
Hence, the median of the set of scores is 7.5
The next activity is another measure of central tendency. Try and discover for yourself the typical value we are looking for.

458
5 6 7 67
THE MOST POPULAR SIZEActivity 8
1. Ashoestorewasabletosell10blackpairofshoesinoneday.Whichshoesizeissaleable? How many of this size were sold for the day?
2. The principal of a school had the number of students posted at the door of each section. Whatsection(s)hasthesamenumberofstudents?Whatisthatnumber?
I-Camia
50 Students
I-Santan
51 Students
I-Rosal
52 Students
I-Tulip
53 Students
I-Lily
50 Students
I-Rose
52 Students
I-Adelfa
53 Students
I-Iris
53 Students
I-Ilang-Ilang
50 Students
6 5 4 5 6
SCHOOL

459
3. Thescoresoffivestudentsinaten-itemtest.Howmanygotsamescore?
Loida 51. b 6. d2. b 7. b3. b 8. b4.c9.d5. b 10. c
Jackie 81. a 6. c2. b 7. b3. b 8. a4.c9.d5. b 10. a
Jen 71. b 6. a2. b 7. b3. b 8. a4.c9.a5. b 10. a
Julie 31. b 6. d2. b 7. b3. c 8. b4.d9.a5. b 10. c
Fe91. a 6. a2. b 7. b3. a 8. a4.c9.d5. b 10. c
Fromthisactivity,whatisthecharacteristicofthisvaluethatwearelookingfor?Thistypical value is what we call the mode.
The next discussion will give you a clearer idea about the mode.
The Mode
The mode is the measure or value which occurs most frequently in a set of data. It is the value with the greatest frequency. Tofindthemode for a set of data:
1. select the measure that appears most often in the set;
2. if two or more measures appear the same number of times, then each of these values is a mode; and
3. if every measure appears the same number of times, then the set of data has no mode.
Try answering these items.
Findthemodeinthegivensetsofscores. 1. {10,12,9,10,13,11,10} 2. {15,20,18,19,18,16,20,18} 3. {5,8,7,9,6,8,5} 4. {7,10,8,5,9,6,4} 5. {12,16,14,15,16,13,14}
460
WHO'S THE CONTENDERActivity 9
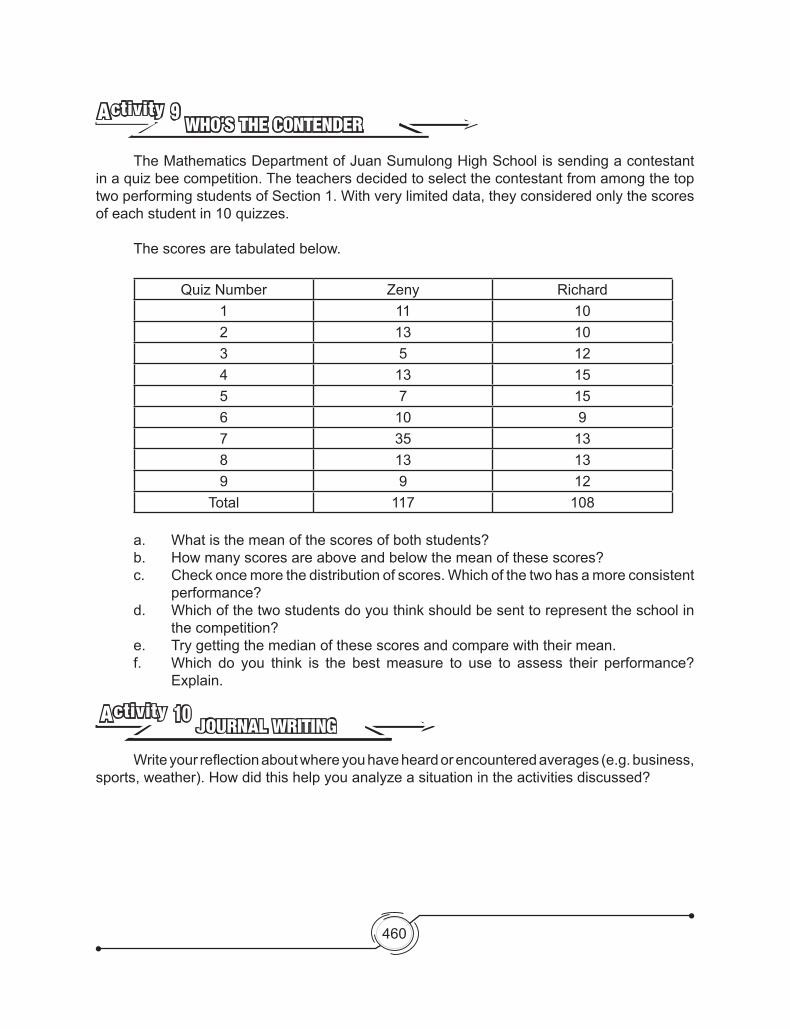
The Mathematics Department of Juan Sumulong High School is sending a contestant in a quiz bee competition. The teachers decided to select the contestant from among the top twoperformingstudentsofSection1.Withverylimiteddata,theyconsideredonlythescoresof each student in 10 quizzes.
The scores are tabulated below.
Quiz Number Zeny Richard1 11 102 13 103 5 124 13 155 7 156 10 97 35 138 13 139 9 12
Total 117 108
a. Whatisthemeanofthescoresofbothstudents?b. How many scores are above and below the mean of these scores?c. Checkoncemorethedistributionofscores.Whichofthetwohasamoreconsistent
performance?d. Whichofthetwostudentsdoyouthinkshouldbesenttorepresenttheschoolin
the competition?e. Try getting the median of these scores and compare with their mean.f. Which do you think is the bestmeasure to use to assess their performance?
Explain.
JOURNAL WRITINGActivity 10
Writeyourreflectionaboutwhereyouhaveheardorencounteredaverages(e.g.business,sports, weather). How did this help you analyze a situation in the activities discussed?
461
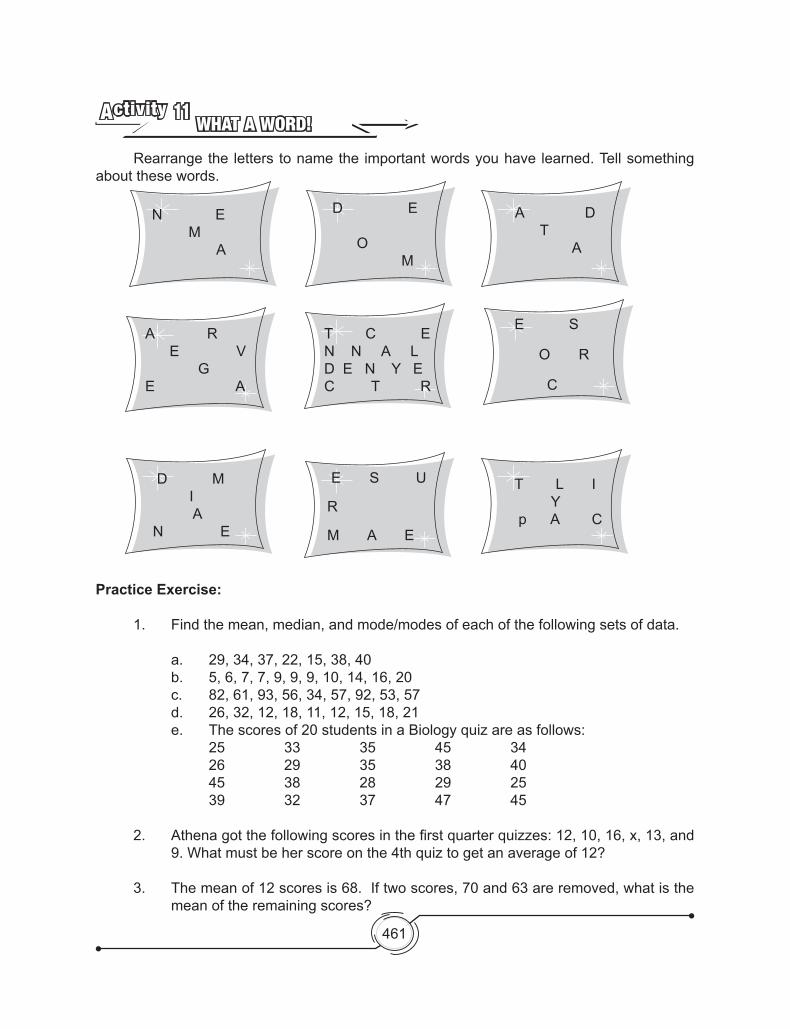
WHAT A WORD!Activity 11
Rearrange the letters to name the important words you have learned. Tell something about these words.
N E MA
D E
O M
AR E V GEA
D M IAN E
E S U
R
MAE
T L I YpAC
T C ENNALD E N Y E C T R
E S
OR
C
AD TA
Practice Exercise:
1. Findthemean,median,andmode/modesofeachofthefollowingsetsofdata.
a. 29,34,37,22,15,38,40 b. 5,6,7,7,9,9,9,10,14,16,20 c. 82,61,93,56,34,57,92,53,57 d. 26, 32, 12, 18, 11, 12, 15, 18, 21 e. The scores of 20 students in a Biology quiz are as follows: 25 33 35 45 34 26 29 35 38 40 45 38 28 29 25 39 32 37 47 45
2. Athenagotthefollowingscoresinthefirstquarterquizzes:12,10,16,x,13,and9.Whatmustbeherscoreonthe4thquiztogetanaverageof12?
3. The mean of 12 scores is 68. If two scores, 70 and 63 are removed, what is the mean of the remaining scores?
462
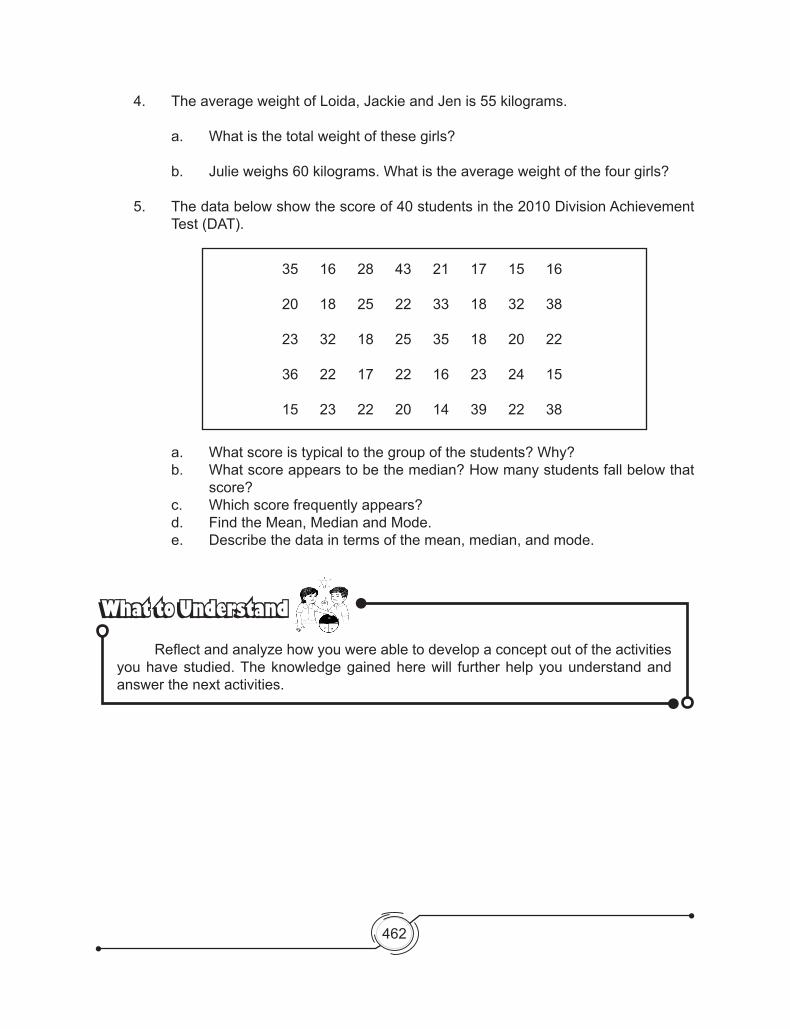
4. The average weight of Loida, Jackie and Jen is 55 kilograms.
a. Whatisthetotalweightofthesegirls?
b. Julieweighs60kilograms.Whatistheaverageweightofthefourgirls?
5. Thedatabelowshowthescoreof40studentsinthe2010DivisionAchievementTest(DAT).
a. Whatscoreistypicaltothegroupofthestudents?Why?b. Whatscoreappearstobethemedian?Howmanystudentsfallbelowthat
score? c. Whichscorefrequentlyappears?d. FindtheMean,MedianandMode.e. Describe the data in terms of the mean, median, and mode.
35 16 28 43 21 17 15 16
20 18 25 22 33 18 32 38
23 32 18 25 35 18 20 22
36 22 17 22 16 23 24 15
15 23 22 20 14 39 22 38
What to UnderstandWhat to Understand
Reflectandanalyzehowyouwereabletodevelopaconceptoutoftheactivitiesyou have studied. The knowledge gained here will further help you understand and answer the next activities.

463
WORK IN PAIRSActivity 12
Analyze the following situations and answer the questions that follow. Make thenecessaryjustificationsifpossible.
1. Thefirstthreetestscoresofeachofthefourstudentsareshown.Eachstudenthopestomaintainanaverageof85.Findthescoreneededbyeachstudentonthefourth test to have an average of 85, or explain why such average is not possible.
a. Lisa:78,80,100 c. Lina:79,80,81 b. Mary:90,92,95 d. Willie:65,80,80
2. Theweeklysalariesinpesosof6workersofaconstructionfirmare2400,2450,2450, 2500, 2500 and 4200.
a. Compute for the mean, the median, and the mode
b. If negotiations for new salaries are to be proposed, and you represent the management, which measure of central tendency will you use in the negotiation? Explain your answer.
c. If you represent the labor union, which measure of central tendency will you use in the negotiation? Explain your answer.
3. Themonthly salaries of the employees ofABCCorporation are as follows:
Manager: Php 100 000 Cashier: Php 20 000
Clerk(9): Php15000UtilityWorkers(2): Php8500
In the manager’s yearly report, the average salary of the employees is Php 20 923.08.TheaccountantclaimedthattheaveragemonthlysalaryisPhp15000. Both employees are correct since the average indicates the typical value of the data. Whichofthetwosalariesistheaveragesalaryoftheemployees?Justifyyour answer.

464
WHICH IS TYPICAL?Activity 13
Direction: Read the statements found at the right column in the table below. If you agree with the statement, place a checkmark () in the After-Lesson-Responsecolumn beside it. If you don’t, mark it with (x).
Statement After-Lesson Response
24 is typical to the numbers 17, 25 and 306isthetypicalscoreinthesetofdata3,5,8,6,910isatypicalscorein:8,7,9,10,and618istypicalageinworkers’ages17,19,20,17,46,17,185 is typical in the numbers 3, 5, 4, 5, 7, and 5The mean is affected by the size of extreme valuesThe median is affected by the size of extreme values The mode is affected by the size of extreme valuesThe mean is affected by the number of measuresThe median is affected by number of measuresThe mode is affected by the number of measures
LET”S SUMMARIZE!Activity 14
WhoamI?
I am a typical value and I am in three forms.
I am the most commonly used
measure of position.
I am the middle value in a set of data arranged in numerical order
I appear the most number of
times.
The three measures of central tendency that you have learned in the previous module donot giveanadequatedescriptionof thedata.Weneed to knowhow theobservationsspread out from the average or mean.

465
Lesson 22 Measures of Variability
What to KnowWhat to Know
Let’s begin with interesting and exploratory activities that would lead to the basic concepts of measures of variability. You will learn to interpret, draw conclusions and make recommendations.
Aftertheseactivities,thelearnersshallbeabletoanswerthequestion, “How can I make use of the representations and descriptions of a given set of data in real-life situations?”.
The lesson on measures of variability will tell you how the values are scattered or clustered about the typical value.
It is quite possible to have two sets of observations with the same mean or median that differs in the amount of spread about the mean. Do the following activity.
Ahousewifesurveyedcannedhamforaspecialfamilyaffair.She picked 5 cans each from two boxes packed by companyAand company B. Both boxes have l the same weight. Consider the following weights in kilograms of the canned Ham packed by the two companies(sampleAandsampleB). SampleA:0.97,1.00,0.94,1.03,1.11 SampleB:1.06,1.01.0.88,0.90,1.14
Help the housewife choose the best sample by doing the following procedure.
WHICH TASTES BETTER?Activity 1
QU
ESTIONS?
a. Arrangetheweightsinnumericalorder.b. Findthemeanweightofeachsample.c. Analyzethespreadoftheweightsofeachsamplefromthemean.d. Whichsamplehasweightsclosertothemean?e. If you are to choose from these two samples, which would you
prefer?Why?f. Wasyourchoiceaffectedbytheweightorthetaste?Explain.

466
Measures other than the mean may provide additional information about the same data. These are the measures of dispersion.
Measures of dispersion or variability refer to the spread of the values about the mean. These are important quantities used by statisticians in evaluation. Smaller dispersion of scores arising from the comparison often indicates more consistency and more reliability.
The most commonly used measures of dispersion are the range, the average deviation, the standard deviation, and the variance.
The Range
The range is the simplest measure of variability. It is the difference between the largest value and the smallest value.
R = H – L
where R = Range, H = Highest value, L = Lowest value
Testscoresof10,8,9,7,5,and3,willgiveusarangeof7from10–3=7.
Let us consider this situation.
The following are the daily wages of 8 factory workers of twogarmentfactories.FactoryAandfactoryB.Findtherangeof salaries in peso (Php).
FactoryA:400,450,520,380,482,495,575,450. FactoryB:450,400,450,480,450,450,400,672
Workersofbothfactorieshavemeanwage=469
What to ProcessWhat to Process
Here you will be provided with enabling activities that you have to go through to validateyourunderstandingonmeasuresof variabilityafter theactivities in theWhatto Know phase. These would answer the question “How can I make use of the representations and descriptions of given set of data in real-life situations?”.

467
Findingtherangeofwages:Range=Highestwage–Lowestwage
RangeA=575–380=195 Range B = 672 – 350 = 322
Comparing the two wages, you will note that wages of workers of factory B have a higher rangethanwagesofworkersoffactoryA.TheserangestellusthatthewagesofworkersoffactoryBaremorescatteredthanthewagesofworkersoffactoryA.
Look closely at wages of workers of factory B. You will see that except for 672 the highestwage,thewagesoftheworkersaremoreconsistentthanthewagesinA.Withoutthehighestwageof672therangewouldbe80from480–400=80.Whereas,ifyouexcludethehighestwage575inA,therangewouldbe140from520–380=140.
Can you now say that the wages of workers of factory B are more scattered or variable thanthewagesofworkersoffactoryA?
The range tells us that it is not a stable measure of variability because its value can fluctuategreatlyevenwithachangeinjustasinglevalue,eitherthehighestorlowest.
1. TheIQsof5membersof2familiesAandBare:
FamilyA:108,112,127,118and113 FamilyB:120,110,118,120and110
a. FindthemeanIQofthetwofamilies. b. FindtherangeoftheIQofbothfamilies. c. WhichofthetwofamilieshasconsistentIQ?
2. The range of each of the set of scores of the three students is as follows:
Ana H=98,L=92,R=98–92=6Josie H=97,L=90,R=97–90=7Lina H=98,L=89,R=98–89=7
a. Whathaveyouobservedabouttherangeofthescoresofthethreestudents? b. Whatdoesittellyou?
WHO IS SMARTER?Activity 2
468
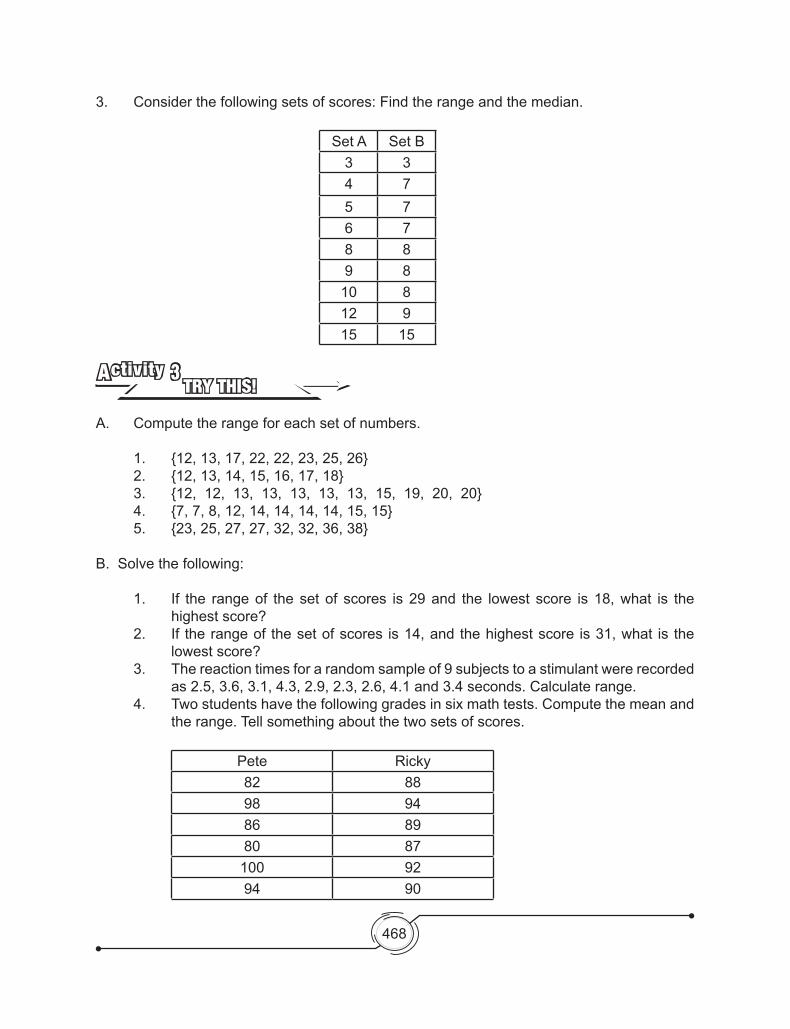
3. Considerthefollowingsetsofscores:Findtherangeandthemedian.
SetA Set B3 34 75 76 78 89 8
10 812 915 15
A. Computetherangeforeachsetofnumbers.
1. {12,13,17,22,22,23,25,26}2. {12,13,14,15,16,17,18}3. {12,12,13,13,13,13,13,15,19,20,20}4. {7,7,8,12,14,14,14,14,15,15}5. {23,25,27,27,32,32,36,38}
B. Solve the following:
1. If the rangeof the setof scores is29and the lowest score is18,what is thehighest score?
2. If the range of the set of scores is 14, and the highest score is 31, what is the lowest score?
3. Thereactiontimesforarandomsampleof9subjectstoastimulantwererecordedas2.5,3.6,3.1,4.3,2.9,2.3,2.6,4.1and3.4seconds.Calculaterange.
4. Two students have the following grades in six math tests. Compute the mean and the range. Tell something about the two sets of scores.
Pete Ricky82 8898 9486 8980 87
100 9294 90
TRY THIS!Activity 3

469
The Average Deviation The dispersion of a set of data about the average of these data is the average deviation or mean deviation.
To compute the average deviation of an ungrouped data, we use the formula:
A.D.=∑|x-x|N
whereA.D.istheaveragedeviation; x is the individual score; x is the mean; and N is the number of scores. |x-x| is the absolute value of the deviation from the mean.
Procedure in computing the average deviation: 1. Findthemeanforallthecases. 2. Findtheabsolutedifferencebetweeneachscoreandthemean. 3. FindthesumofthedifferenceanddividebyN.
Example: Findtheaveragedeviationofthefollowingdata:12,17,13,18,18,15,14,17,11
1. Findthemean(x).
x = ∑xN =
12 + 17 + 13 + 18 + 18 + 15 + 14 + 17 + 119
x = 1359 = 15
2. Findtheabsolutedifferencebetweeneachscoreandthemean. |x-x|=|12−15|=3 =|17−15|=2 =|13−15|=2 =|18−15|=3 =|18−15|=3 =|15−15|=0 =|14−15|=1 =|17−15|=2 =|11−15| =4 3.Findthesumoftheabsolutedifference∑|x-x|. |x-x| =|12−15|=3 =|17−15|=2 =|13−15|=2 =|18−15|=3

470
=|18−15|=3 =|15−15|=0 =|14−15|=1 =|17−15|=2 =|11−15| =4 ------------------------------------------- ∑|x-x| = 20
This can be represented in tabular form as shown below.
x x |x-x|12 15 317 15 213 15 218 15 318 15 315 15 014 15 117 15 211 15 4
∑|x-x| = 20
4. Solve for the average deviation by dividing the result in step 3 by N.
A.D.=∑|x-x|N = 20
9 = 2.22
Solve the average deviation of the following:
1. Scienceachievementtestscores:60,75,80,85,90,952. The weights in kilogram of 10 students: 52, 55, 50, 55, 43, 45, 40, 48, 45, 47. 3. The diameter (in cm) of balls: 12, 13, 15, 15, 15, 16, 18.4. Pricesofbooks(inpesos):85,99,99,99,105,105,120,150,200,200.5. Cholesterollevelofmiddle-agedpersons:147,154,172,195,195,209,218,241,
283, 336. The average deviation gives a better approximation than the range. However, it does not lend itself readily to mathematical treatment for deeper analysis.
Let us do another activity to discover another measure of dispersion, the standard deviation.
TRY THIS!Activity 4

471
The Standard Deviation
Computethestandarddeviationofthesetoftestscores:{39,10,24,16,19,26,29,30,5}.
a. Findthemean. b. Findthedeviationfromthemean(x-x). c. Square the deviations (x-x)2. d. Addallthesquareddeviations.∑(x-x)2 e. Tabulate the results obtained:
x x-x (x-x)2
51016192426293039
∑(x-x)2
f. Compute the standard deviation (SD) using the formula
SD = ∑(x-x)2
N
g. Summarize the procedure in computing the standard deviation.
Fromtheactivity,youhavelearnedhowtocomputeforthestandarddeviation.
Like the average deviation, standard deviation differentiates sets of scores with equal averages. But the advantage of standard deviation over mean deviation is that it has several applications in inferential statistics
To compute for the standard deviation of an ungrouped data, we use the formula:
WORKING IN PAIRSActivity 5

472
SD = ∑(x-x)2
N
WhereSDisthestandarddeviation; x is the individual score; x is the mean; and N is the number of scores.
In the next discussion, you will learn more about the importance of using the standard deviation.
Let us consider this example.
Compare the standard deviation of the scores of the three students in their Mathematics quizzes.
StudentA 97,92,96,95,90Student B 94,94,92,94,96Students C 95,94,93,96,92
Solution:
StudentA:
Step 1. Compute the mean score.
x = ∑xN =
92+92+96+95+905 =94
Step 2. Complete the table below.x x-x (x-x)2
97 3 992 -2 496 2 495 1 190 4 16
∑(x-x)2 = 34
Step 3. Compute the standard deviation.
SD = ∑(x-x)2
N = 345 = 6.8 = 26

473
Student B:
Step 1. Compute the mean score.
x = ∑xN =
92+92+96+95+905 =94
Step 2. Complete the table below.x x-x (x-x)2
94 0 094 0 092 -2 494 0 096 2 4
∑(x-x)2 = 8
Step 3. Compute the standard deviation.
SD = ∑(x-x)2
N = 85 = 1.6 = 1.3
Student C:
Step 1. Compute the mean score.
x = ∑xN =
95+94+93+96+925 =94
Step 2. Complete the table below.x x-x (x-x)2
95 1 194 0 093 -1 196 2 492 -2 4
∑(x-x)2 = 10
Step 3. Compute the standard deviation.
SD = ∑(x-x)2
N = 105 = 2 = 1.4

474
The result of the computation of the standard deviation of the scores of the three students can be summarized as:
SD(A)=2.6 SD (B) = 1.3 SD (C) = 1.4
The standard deviation of the scores can be illustrated below by plotting the scores on the number line.
Graphically, a standard deviation of 2.6 means most of the scores are within 2.6 units from the mean.AStandarddeviationof1.3and1.4suggestthatmostofthescoresarewithin1.3 and 1.4 units from the mean.
The scores of Student B is clustered closer to the mean. This shows that the score of Student B is the most consistent among the three sets of scores.
The concept of standard deviation is especially valuable because it enables us to comparedatapointsfromdifferentsetsofdata.Whentwogroupsarecompared,thegrouphaving a smaller standard deviation is less varied.

475
WORKING IN PAIRSActivity 6
A. Computethestandarddeviationforeachsetofnumbers. 1. (12, 13, 14, 15, 16, 17, 18) 2. (7, 7, 8, 12, 14, 14, 14, 14, 15, 15) 3. (12,12,13,13,13,13,13,15,19,20,20) 4. (12, 13, 17, 22, 22, 23, 25, 26) 5. (23, 25, 27, 27, 32, 32, 36, 38)
B. The reaction times for a random sample of nine subjects to a stimulant were recorded as 2.5,3.6,3.1,4.3,2.9,2.3,2.6,4.1and3.4seconds.Calculatetherangeandstandarddeviation.
C. Supposetwoclassesachievedthefollowinggradesonamathtest,findtherangeandthe standard deviation.
Class1:64,70,73,77,85,90,94Class2:74,75,75,76,79,80,94
Youmayuseascientificcalculatortosolveforthestandarddeviation.
WORKING IN PAIRSActivity 7
Thegradesofastudentinninequizzes:78,80,80,82,85,85,85,88,90.Calculateforthemeanandstandarddeviationusingascientificcalculator.
Press the following keys:
ProcedureProcedure
Shift Mode (Setup) 4 (Stat)
Mode 3 (Stat) 1 (1-var)
1(ON)

476
AC
AC
4 (var)
4 (var)
2(x)
2(xσn)
Shift 1(Stat)
Shift 1(Stat)
x f(x)123
x f(x)1 78 1 2 80 23 82 14 85 35 88 16 90 1
Is displayed. Input values of x.
The displayed output.
78 = 80 = 82 = 85 = 88 = 90 =
1 = 2 = 1 = 3 = 1 = 1
=
=
Answer:Mean≈ 83.67
Answer:SD≈ 3.74
In the next discussion, you will learn about another measure of variability.
The Variance The variance (∂2) of a data is equal to
1N . The sum of their squares minus the square of
their mean. It is virtually the square of the standard deviation.
∂2 = ∑(x-x)2
N where ∂2 is the variance; N is the total number of observations; x is the raw score; and x is the mean of the data. Variance is not only useful, it can be computed with ease and it can also be broken into two or more component sums of squares that yield useful information.

477
Activity 8
The table shows the daily sales in peso of two sari-sari stores near a school.
StoreA Store B300 300310 120290 500301 100299 490295 110305 300300 480
Compute for the Variance and interpret.
What to UnderstandWhat to Understand
Youwillbeprovidedwithactivitiesthatwillallowyoutoreflect,revisit,reviseandrethink about a variety of experiences in life. Moreover, you will be able to express your understanding on the concept of measures of variability that would engage you in multidirectional self-assessment.
ANSWER THE FOLLOWING.Activity 9
1. Findtherangeforeachsetofdata.a. scoresonquizzes:10,9,6,6,7,8,8,8,8,9 b. Number of points per game: 16, 18, 10, 20, 15, 7, 16, 24 c. Number of VCR’s sold per week: 8, 10, 12, 13, 15, 7, 6, 14, 18, 20
2. Given the scores of two students in a series of test StudentA:60,55,40,48,52,36,52,50 StudentB:62,48,50,46,38,48,43,39
a. Findthemeanscoreofeachstudent? b. Compute the range. c. Interpret the result.
ANSWER THE FOLLOWING.

478
3. Theminimumdistances(infeet)abatterhastohittheballdownthecenterofthefieldto get a home run in 8 different stadiums is 410, 420, 406, 400, 440, 421, 402 and 425 ft. Compute for the standard deviation.
4. The scores received by Jean and Jack in ten math quizzes are as follows: Jean: 4, 5, 3, 2, 2, 5, 5, 3, 5, 0 Jack: 5, 4, 4, 3, 3, 1, 4, 0, 5, 5
a. Compute for the standard deviation. b. Whichstudenthadthebettergradepointaverage? c. Whichstudenthasthemostconsistentscore?
479
33Measures of Central
Tendency of Grouped Data
Lesson
What to KnowWhat to Know
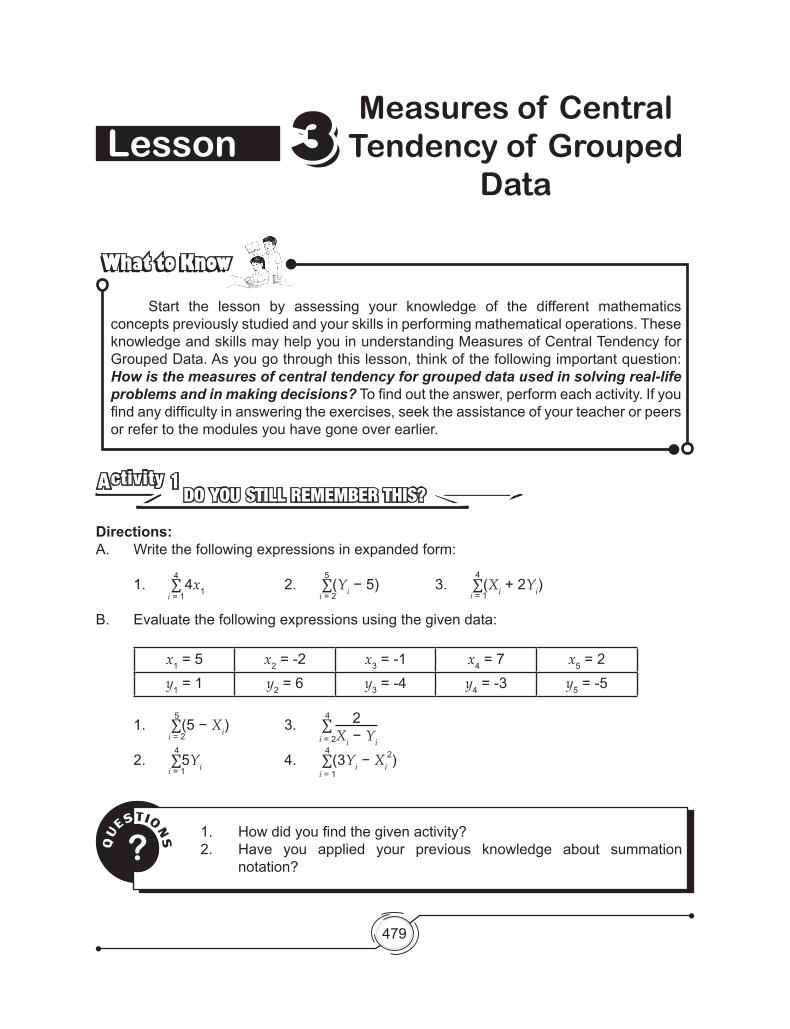
Start the lesson by assessing your knowledge of the different mathematics concepts previously studied and your skills in performing mathematical operations. These knowledge and skills may help you in understanding Measures of Central Tendency for GroupedData.Asyougothroughthislesson,thinkofthefollowingimportantquestion:How is the measures of central tendency for grouped data used in solving real-life problems and in making decisions?Tofindouttheanswer,performeachactivity.Ifyoufindanydifficultyinansweringtheexercises,seektheassistanceofyourteacherorpeersor refer to the modules you have gone over earlier.
DO YOU STILL REMEMBER THIS?Activity 1
Directions: A. Writethefollowingexpressionsinexpandedform: 1. ∑ 4x1 2. ∑(Yi−5) 3. ∑(Xi + 2Yi)
B. Evaluate the following expressions using the given data:
x1 = 5 x2 = -2 x3 = -1 x4 = 7 x5 = 2y1 = 1 y2 = 6 y3 = -4 y4 = -3 y5 = -5
1. ∑(5−Xi) 3. ∑ 2Xi−Yi
2. ∑5Yi 4. ∑(3Yi−Xi2)
i = 1
4
i = 2
5
i = 2
i = 1
i = 2
i = 1
5
4
4
4
QU
ESTIONS?
1. Howdidyoufindthegivenactivity?2. Have you applied your previous knowledge about summation
notation?
i = 1
4
480
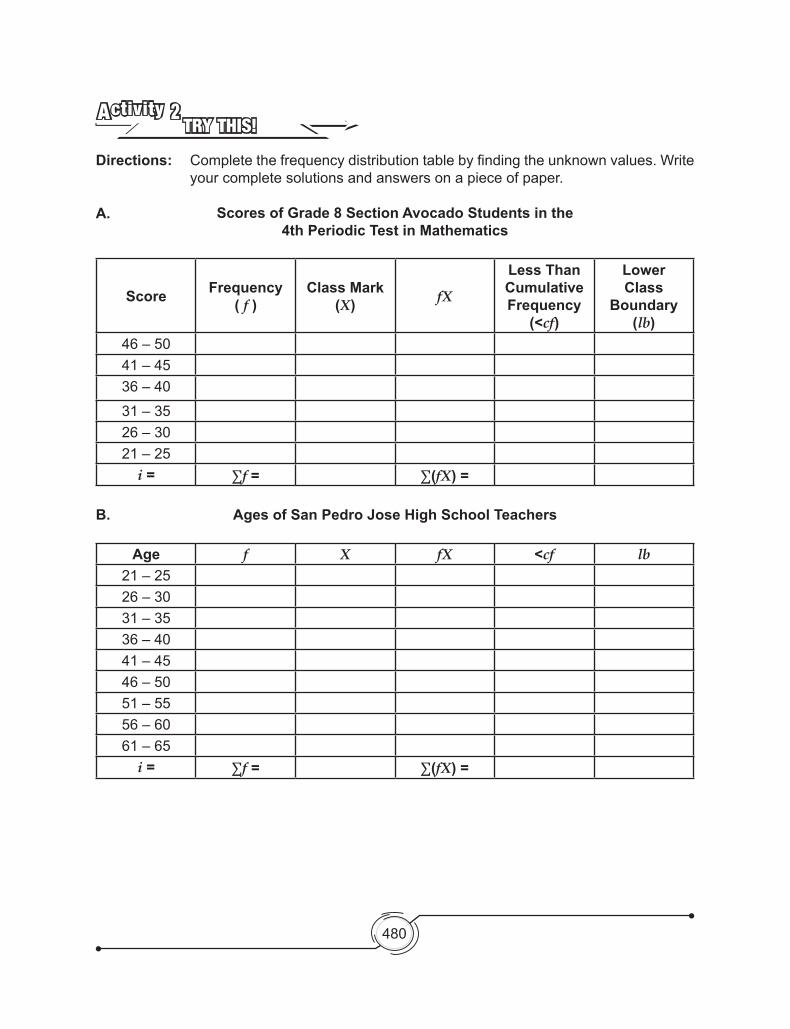
Directions: Completethefrequencydistributiontablebyfindingtheunknownvalues.Writeyour complete solutions and answers on a piece of paper.
Scores of Grade 8 Section Avocado Students in the
4th Periodic Test in Mathematics
Score Frequency( f )
Class Mark (X) fX
Less Than Cumulative Frequency
(<cf)
LowerClass
Boundary(lb)
46 – 5041 – 4536 – 40
31 – 3526 – 3021 – 25
i = ∑f = ∑(fX) =
TRY THIS!Activity 2
A.
Ages of San Pedro Jose High School Teachers
Age f X fX <cf lb21 – 2526 – 3031 – 3536 – 4041 – 4546 – 5051 – 5556 – 6061 – 65
i = ∑f = ∑(fX) =
B.
481
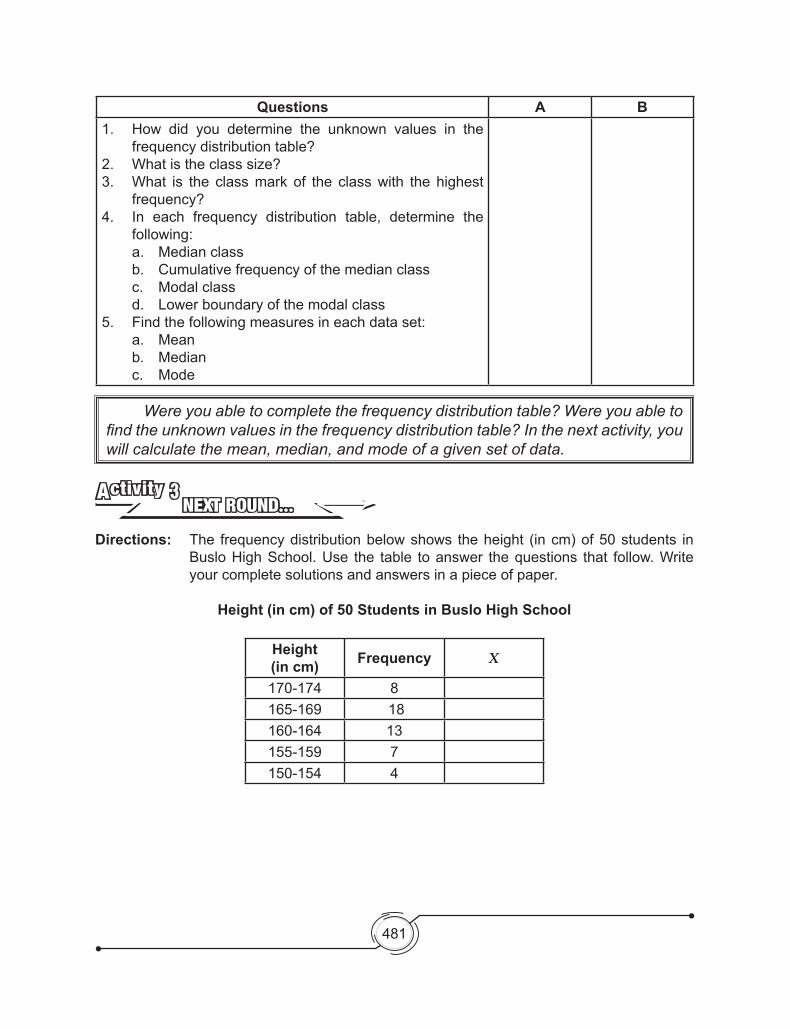
Questions A B1. How did you determine the unknown values in the
frequency distribution table?2. Whatistheclasssize?3. What is the classmark of the classwith thehighest
frequency?4. In each frequency distribution table, determine the
following: a. Median class b. Cumulative frequency of the median class c. Modal class d. Lower boundary of the modal class5. Findthefollowingmeasuresineachdataset: a. Mean b. Median c. Mode
Were you able to complete the frequency distribution table? Were you able to find the unknown values in the frequency distribution table? In the next activity, you will calculate the mean, median, and mode of a given set of data.
NEXT ROUND…Activity 3
Directions: The frequency distribution below shows the height (in cm) of 50 students in BusloHighSchool.Use the table toanswer thequestions that follow.Writeyour complete solutions and answers in a piece of paper.
Height (in cm) of 50 Students in Buslo High School
Height (in cm) Frequency X
170-174 8165-169 18160-164 13155-159 7150-154 4

482
QU
ESTIONS?
1. Whatisthetotalfrequencyofthegivendataset?2. Completethefrequencydistributiontable.Whatis∑fX? 3. Howwouldyoufindthemeanofthegivendataset?4. Findthemeanofthesetofdata.5. Determine the following. Explain your answer.
a. Median class b. Modal class c. Lower boundary of the median classd. Lower boundary of the modal class
6. Findthemedianandthemeanofthesetofdata?7. How do the mean, median, and the mode of the set of data compare?
What to ProcessWhat to Process
Howdidyoufindthepreviousactivity?Wereyouabletofindtheunknownmeasures/values?Areyoureadytoperformthenextactivity?Willyoubeabletofindthemean,median and the mode of a set of data such as the ages, grades, or test scores of your classmates?Beforeproceedingto theseactivities, readfirstsome importantnotesonhow to calculate the mean, median and mode for grouped data.
Beforeweproceedinfindingthemean,medianandmodeofgroupeddata,letusrecallthe concepts about Summation Notation:
Summation Notation It is denoted by the symbol using the Greek letter ∑ (a capital sigma) which means “the summation of”.
The summation notation can be expressed as:
∑Xi = X1 + X2 + X3 + ... + Xn
and it can be read as “the summation of X sub i where i starts from 1 to n.
Illustrative Example:1. Writetheexpressioninexpandedform:
a. ∑2Xi = 2X1 + 2X2 + 2X3 + 2X4 + 2X5
= 2(X1 + X2 + X3 + X4 + X5)
b. ∑ (2Xi −Yi) = (2X2 −Y2) + (2X3 −Y3) + (2X4 −Y4)
i = 1
n
i = 1
5
i = 2
4

483
Tofindthemean,medianandmodeforgroupeddata,takenoteofthefollowing:
1. Mean for Grouped Data When the number of items in a set of data is too big, items are grouped forconvenience.Tofindthemeanofgroupeddatausingclassmarks,thefollowingformulacan be used: Mean = ∑(fX)
∑f
where: f is the frequency of each class X is the class mark of class
Illustrative Example:Directions:CalculatethemeanoftheMid-yearTestscoresofStudentsinFilipino.
Mid-year Test Scores of Students in Filipino
Score Frequency41 – 45 136 – 40 831 – 35 826 – 30 1421 – 25 716 – 20 2
Solutions:
Score Frequency( f )
Class Mark(X) fX
41 – 45 1 43 4336 – 40 8 38 30431 – 35 8 33 26426 – 30 14 28 39221 – 25 7 23 16116 – 20 2 18 36
i = 5 ∑f = 40 ∑(fX) = 1,200
Mean = ∑(fX)∑f =
1,20040 = 30
Therefore, the mean of mid-year test is 30.

484
There is an alternative formula for computing the mean of grouped data and this makes use of coded deviation
Mean = A.M + ∑(fd)
∑f i
where:A.M.istheassumedmean; f is the frequency of each class;
disthecodeddeviationfromA.M.;and i is the class interval
Anyclassmarkcanbeconsideredastheassumedmean.Butitisconvenienttochoosethe class mark with the highest frequency to facilitate computation. The class chosen to containastheA.M.hasnodeviationfromitselfandso0isassignedtoit.
Subsequently, similar on a number line or Cartesian coordinate system, consecutive positive integers are assigned to the classes upward and negative integers to the classes downward.
LetusfindthemeanofthegivenillustrativeexampleabouttheMid-yeartestscoresofStudentsinFilipinousingcodeddeviation.
Illustrative Example:
Mid-year Test Scores of Students in FilipinoScore Frequency
41 – 45 136 – 40 831 – 35 826 – 30 1421 – 25 716 – 20 2
Solutions:Score f X d fd
41 – 45 1 43 3 336 – 40 8 38 2 1631 – 35 8 33 1 826 – 30 14 28 0 021 – 25 7 23 -1 -716 – 20 2 18 -2 -4
i = 5 ∑f = 40 ∑fd = 16

485
Mean = A.M + ∑(fd)
∑f i
Mean = 28 + 1640 5
Mean = 28 + 16(5)40
Mean = 28 + 8040
Mean = 28 + 2
Mean = 30
Therefore, the mean of mid-year test is 30.
Whathaveyouobserved?Itimpliesthatevenyouuseclassmarksorcodeddeviationthe results that you will get are the same.
2. Median for Grouped Data The median is the middle value in a set of quantities. It separates an ordered set of data into two equal parts. Half of the quantities is located above the median and the other half is found below it, whenever the quantities are arranged according to magnitude (from highest to lowest.)
In computing for the median of grouped data, the following formula is used:
Median = lbmc + ∑f2 −<cf
fmc
i
where: lbmc is the lower boundary of the median class; f is the frequency of each class; <cf is the cumulative frequency of the lower class next to the median class; fmc is the frequency of the median class; and i is the class interval.
The median class is the class that contains the ∑f2 th quantity. The computed median
must be within the median class.
A.M.=28∑f = 40∑fd =16 i = 5

486
Illustrative Example:Directions:CalculatethemedianoftheMid-yearTestScoresofstudentsinFilipino.
Mid-year Test Scores of Students in FilipinoScore Frequency
41 – 45 136 – 40 831 – 35 826 – 30 1421 – 25 716 – 20 2
Solutions:Score Frequency lb <cf
41 – 45 1 40.5 4036 – 40 8 35.5 3931 – 35 8 30.5 3126 – 30 14 25.5 2321 – 25 7 20.5 916 – 20 2 15.5 2
i = 5 ∑f = 40
Median = lbmc + ∑f2 −<cf
fmc
i
a. ∑f2 =
402 = 20
The 20th score is contained in the class 26-30. This means that the median falls within the class boundaries of 26-30. That is, 25.5-30.5
b. <cf=9 c. fmc = 14 d. lbmc = 25.5 e. i = 5
Solutions:
Median = lbmc + ∑f2 −<cf
fmc
i
Median = 25.5 + 202 −9
14 5
Median Class

487
Median = 25.5 + 10−914 5
Median = 25.5 + 14 5
Median = 25.5 + 514 5
Median = 25.5 + 0.38
Median = 25.88
Therefore, the median of the mid-year test scores is 25.88.
(Note: The median 25.88 falls within the class boundaries of 26-30 which is 25.5-30.5)
3. Mode for Grouped Data The mode of grouped data can be approximated using the following formula:
Mode = lbmo + D1
D1 + D2 i
where: lbmo is the lower boundary of the modal class;D1 is the difference between the frequencies of the modal class and the next
upper class;D2 is the difference between the frequencies of the modal class and the next
lower class; and i is the class interval.
The modal class is the class with the highest frequency.
Illustrative Example:Directions:CalculatethemodeoftheMid-yearTestScoresofstudentsinFilipino.
Mid-year Test Scores of Students in Filipino
Score Frequency41 – 45 136 – 40 831 – 35 826 – 30 1421 – 25 716 – 20 2

488
Solutions:Score Frequency lb
41 – 45 1 40.536 – 40 8 35.531 – 35 8 30.526 – 30 14 25.521 – 25 7 20.516 – 20 2 15.5
Since class 26-30 has the highest frequency, therefore the modal class is 26-30.
lbmo = 25.5D1 = 14 – 8 = 6D2 = 14 – 7 = 7
i = 5
Mode = 25.5 + D1
D1 + D2 i
Mode = 25.5 + 76 + 7 5
Mode = 25.5 + 713 5
Mode = 25.5 + 3513
Mode=25.5+2.69
Mode = 28.19
Therefore, the mode of the mid-year test is 28.19.
If there are two or more classes having the same highest frequency, the formula to be used is:
Mode = 3(Median) − 2(Mean)
Modal Class

489
Illustrative Example:
Height of Nursing Students in Our Lady of Piat CollegeHeight (cm) Frequency
170-174 7165-169 10160-164 11155-159 11150-154 10
(Note:Thegivendatahastwoclasseswiththehighestfrequency;therefore,thefirstformula in solving the mode is not applicable.)
Solutions: a. Mean = ∑(fX)
∑f = 8,075
50
Mean = 161.5
b. Median
∑f2 =
502 = 25
The 25th score is contained in the class 160-164. This means that the median fallswithintheclassboundariesof160-164.Thatis,159.5-164.5<cf = 21fmc = 11lbmc=159.5i = 5
Median = lbmc + ∑f2 −<cf
fmc
i
Median=159.5 + 25 −2111 i
Median=159.5 + 411 5
Median=159.5 + 4(5)11
Median=159.5 + 2011
Median=159.5 + 1.82
Median = 161.32

490
c. Mode Mode=3(Median)−2(Mean) Mode=3(161.32)−2(161.5) Mode=483.96−323 Mode = 160.36
Therefore, the mode of the given data is 160.36.
Were you able to learn different formulas in solving the mean, median and mode of grouped data? In the next activity, try to apply those important notes in getting the value of mean, median and mode of grouped data.
LET’S SOLVE IT… Activity 4
Directions: Calculatethemean,medianandmodeoftheweightof IV-2Students.Writeyour complete solutions and answers in a sheet of paper.
Weight of IV-2 Students
Weightinkg Frequency75–79 170 – 74 465–69 1060 – 64 1455–59 2150 – 54 1545–69 1440 – 44 1
Mean = _______________________ Median = _______________________ Mode = _______________________
QU
ESTIONS?
1. Howdidyoufindthemean,median,andmodeofthedataset?2. Whatcomparisonscanyoumakeaboutthethreemeasuresobtained?3. Whathaveyoulearnedandrealizedwhiledoingtheactivity?

491
Have you solved the mean, median, and mode easily with your partner? Were you able to apply the notes on how to calculate the mean, median and mode? Do the next activity by yourself.
ONE MORE TRY…Activity 5
Directions: Calculate the mean, median and mode of the given grouped data.
Pledges for the Victims of Typhoon PabloPledges in Pesos Frequency9,000–9,999 48,000–8,999 127,000–7,999 136,000–6,999 155,000–5,999 194,000–4,999 303,000–3,999 212,000–2,999 411,000–1,999 31
0–999 14
QU
ESTIONS?
1. Whatistheclassintervalofthegivenfrequencydistributiontable?2. How many pledges are there for the victims of typhoon?3. Determine the following: a. Class mark of the pledges having the highest number of donors b. Median class c. Modal class4. How did you determine the mean, median, and the mode of the given
data set? How about the lower boundary of the median class of the pledges?5. What is the lower boundary of themedian class of the pledges in
pesos?6. Whatisthelowerboundaryofthemodalclass?7. Whatisthemodalscoreofthepledgesinpesos?

492
What to UnderstandWhat to Understand
Reflect how you were able to develop a concept out of the activities you have studied. The knowledge gained here will further help you understand and answer the next activities. After doing the following activities, you should be able to answer the following question: How is the measures of central tendency for grouped data used in solving real-life problems and in making decisions?
WE CAN DO IT…Activity 6
1. Below are the scores of 65 students in Mathematics Test
Score f X d fd <cf55 – 58 251 – 54 447 – 50 543 – 46 639–42 1035 – 38 1331 – 34 827 – 30 623 – 26 619–22 215 – 18 211 – 14 1
a. Complete the tablebyfilling in thevaluesofX (the class marks or midpoints), d(deviation), fd and <cf (cumulative frequency). Explain how you arrived at your answer.
b. Findthemean,median,andthemodeofthesetofdata.c. How would you compare the mean, median, and the mode of the set of data?d. Whichmeasurebestrepresentstheaverageofthesetofdata?Why?
2. Is the median the most appropriate measure of averages (central tendency) for grouped data?Why?Howaboutthemean?mode?Explainyouranswer.
3. Isitalwaysnecessarytogroupasetofdatawhenfindingitsmean,median,ormode?Why?

493
What new insights do you have about solving measures of central tendency of grouped data? What do you realize after learning and doing different activities?
Let’s extend your understanding. This time, apply what you have learned in real life by doing the tasks in the next section.
What to TransferWhat to Transfer
Your goal in this section is to apply your learning to real-life situations. You will be given a practical task which will demonstrate your understanding of solving measures of central tendency of grouped data.
LET’S APPLY IT….Activity 7
Prepare some power saving measures. Gather data from your classmates or peers which may include the following: electric bills, electric appliances and the estimated time of usage. Use the data and different statistical measures obtained for analysis and coming up with the power-saving measures.
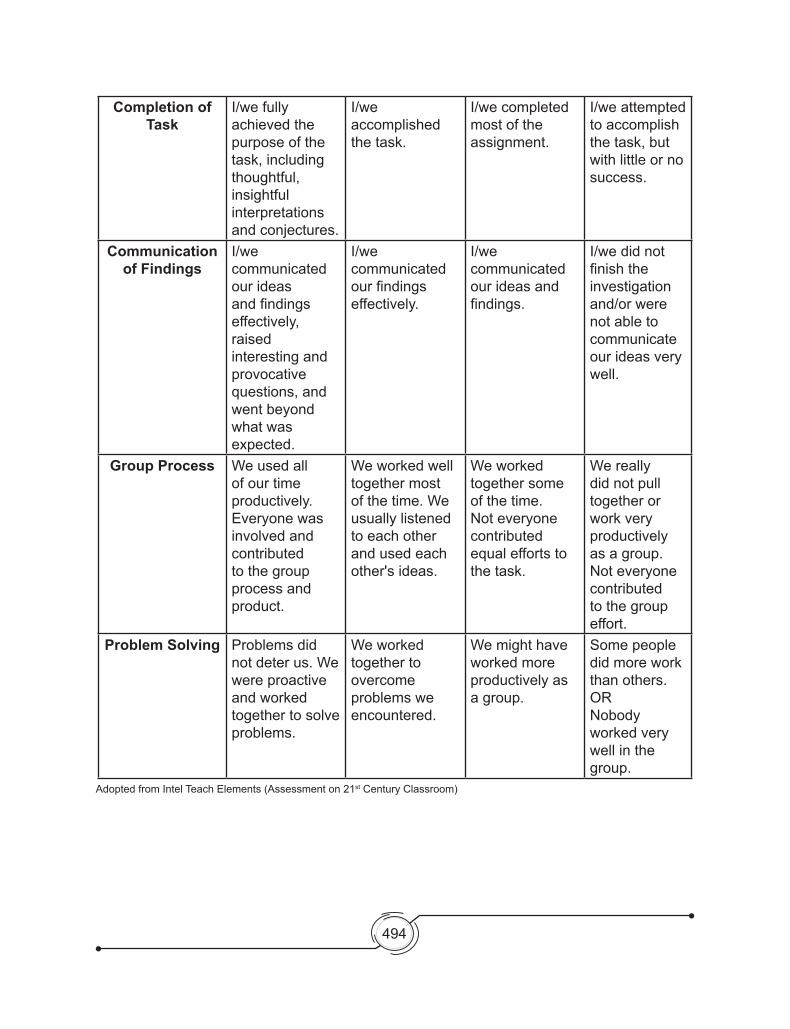
RUBRIC ON GROUP TASK
4 3 2 1Understanding
of TaskI/we demonstrated an in-depth understanding of the content, processes, and demands of the task.
I/we demonstrated substantial understanding of the content and task, even though some supporting ideas or details may be overlooked or misunderstood.
I/we demonstrated gaps in our understanding of the content and task.
I/we demonstrated minimal understanding of the content.
494
Completion of Task
I/we fully achieved the purpose of the task, including thoughtful, insightful interpretations and conjectures.
I/we accomplished the task.
I/we completed most of the assignment.
I/we attempted to accomplish the task, but with little or no success.
Communication of Findings
I/we communicated our ideas andfindingseffectively, raised interesting and provocative questions, and went beyond what was expected.
I/we communicated ourfindingseffectively.
I/we communicated our ideas and findings.
I/we did not finishtheinvestigation and/or were not able to communicate our ideas very well.
Group Process Weusedallof our time productively. Everyone was involved and contributed to the group process and product.
Weworkedwelltogether most ofthetime.Weusually listened to each other and used each other's ideas.
Weworkedtogether some of the time. Not everyone contributed equal efforts to the task.
Wereallydid not pull together or work very productively as a group. Not everyone contributed to the group effort.
Problem Solving Problems did notdeterus.Wewere proactive and worked together to solve problems.
Weworkedtogether to overcome problems we encountered.
Wemighthaveworked more productively as a group.
Some people did more work than others.ORNobody worked very well in the group.
AdoptedfromIntelTeachElements(Assessmenton21st Century Classroom)

495
In this section, your tasks were to cite real-life situations and formulate and solve problems involving measures of central tendency of grouped data
How did you find the performance task? How did the task help you see the real world application of measures of central tendency of grouped data?
SUMMARY/SYNTHESIS/GENERALIZATION:
This lesson was about measures of central tendency of grouped data. The lesson provided you opportunities to describe on how to solve mean, median and mode of the given grouped data. Moreover, you were given the chance to apply the given important notes on how to solve the mean, median and mode of the given grouped data and to demonstrate your understanding of the lesson by doing a practical task.
496
44Measures of Variability of
Grouped DataLesson
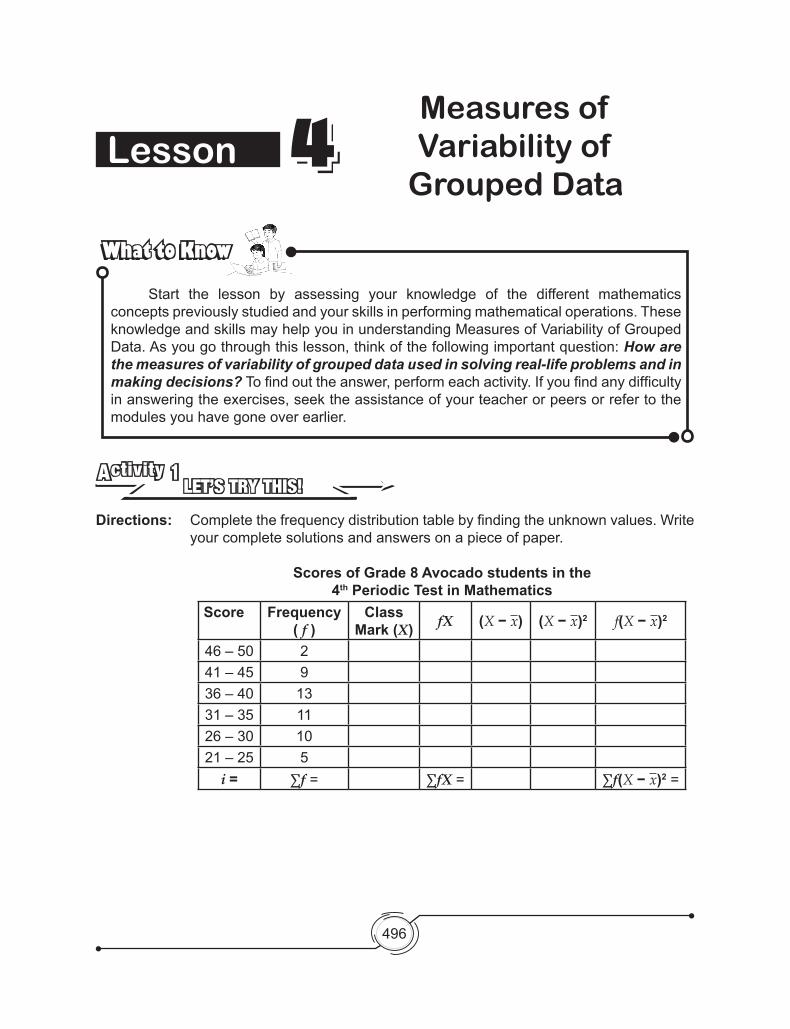
What to KnowWhat to Know
Start the lesson by assessing your knowledge of the different mathematics concepts previously studied and your skills in performing mathematical operations. These knowledge and skills may help you in understanding Measures of Variability of Grouped Data.Asyougothroughthislesson,thinkofthefollowingimportantquestion: How are the measures of variability of grouped data used in solving real-life problems and in making decisions? Tofindouttheanswer,performeachactivity.Ifyoufindanydifficultyin answering the exercises, seek the assistance of your teacher or peers or refer to the modules you have gone over earlier.
LET’S TRY THIS!Activity 1
Directions: Completethefrequencydistributiontablebyfindingtheunknownvalues.Writeyour complete solutions and answers on a piece of paper.
Scores of Grade 8 Avocado students in the4th Periodic Test in Mathematics
Score Frequency( f )
Class Mark (X) fX (X − x) (X − x)2 f(X − x)2
46 – 50 241 – 45 936 – 40 1331 – 35 1126 – 30 1021 – 25 5
i = ∑f = ∑fX = ∑f(X − x)2 =
497
QU
ESTIONS?
1. How did you determine the unknown values in the frequency distribution table?
2. Whatistheclasssize?3. Whatisthe∑fX?4. Whatisthevalueofthemeaninthegivendistributiontable?5. Whatistheupperclassboundaryofthetopinterval?Whataboutthe
lower class boundary of the bottom interval?6. Whatistherange?7. Whatisthevarianceofthegivendistributiontable?8. Howwouldyoufindthevariance?9. Whatisthestandarddeviation?10. How would you solve for the standard deviation?
Were you able to complete the frequency distribution table? Were you able to find the unknown values in the frequency distribution table? In the next activity, you will calculate the range, variance and standard deviation of a given data set.
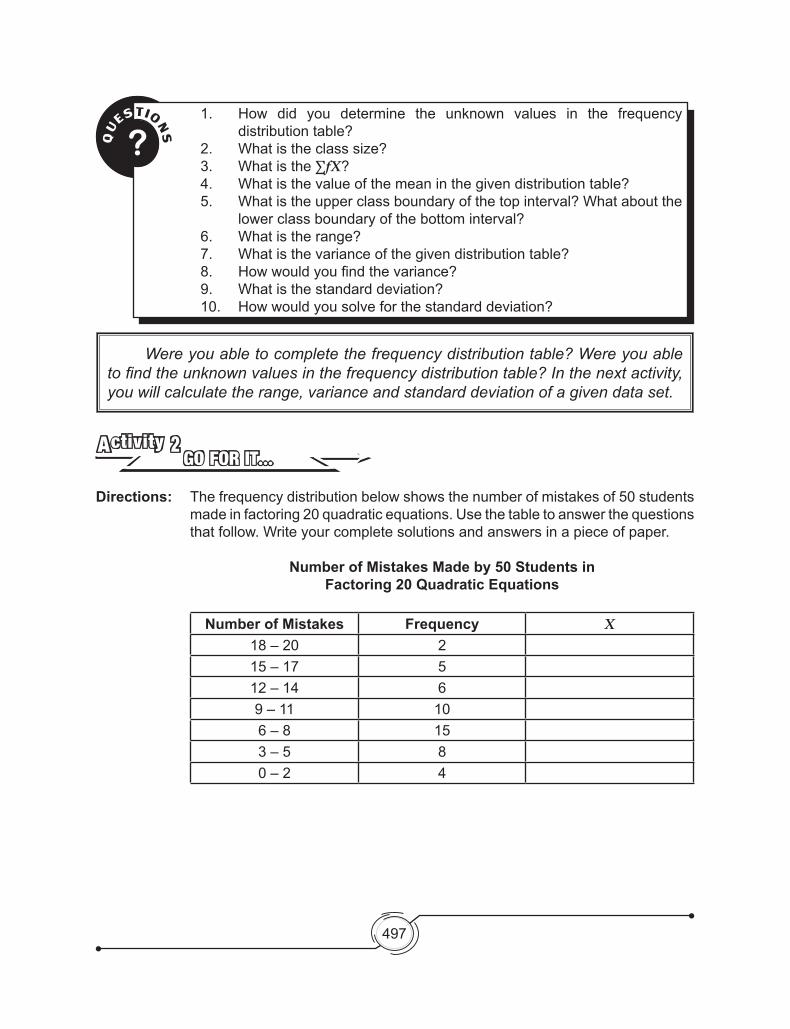
GO FOR IT…Activity 2
Directions: The frequency distribution below shows the number of mistakes of 50 students made in factoring 20 quadratic equations. Use the table to answer the questions thatfollow.Writeyourcompletesolutionsandanswersinapieceofpaper.
Number of Mistakes Made by 50 Students inFactoring 20 Quadratic Equations
Number of Mistakes Frequency X18 – 20 215 – 17 512 – 14 69–11 106 – 8 153 – 5 80 – 2 4

498
QU
ESTIONS?
1. Whatisthetotalfrequencyofthegivendataset?2. Completethefrequencydistributiontable.Whatis∑fX?3. Howwouldyoufindthemeanofthegivendataset?4. Whatisthemeanofthesetofdata?5. Whatistheupperclassboundaryofthetopinterval?6. Whatisthelowerclassboundaryofthebottominterval?7. Whatistherange?8. Findthevarianceandstandarddeviationofthesetofdata9. Howdotherange,varianceandstandarddeviationusedininterpreting
the set of data?
What to ProcessWhat to Process
How did you find the previous activity? Were you able to find the unknownmeasures/values?Areyoureadytoperformthenextactivity?Willyoubeabletofindthemean, range, variance and standard deviation of a set of data such as the grades, or test scores?Beforeproceedingtotheseactivities,readfirstsomeimportantnotesonhowtocalculate the range, variance and standard deviation of grouped data.
Tofindtherange,varianceandstandarddeviationofgroupeddata, takenoteof thefollowing:
1. Range of Grouped Data
The range is the simplest measure of variability. The range of a frequency distribution is simply the difference between the upper class boundary of the top interval and the lower class boundary of the bottom interval.
Range = Upper Class Boundary – Lower Class Boundary of the Highest Interval of the Lowest Interval
Illustrative Example:Solve for range:
Scores in Second Periodical Test ofI–FaithinMathematicsI
Scores Frequency46 – 50 141 – 45 1036 – 40 1031 – 35 1626 – 30 921 – 25 4

499
Solutions: Upper Class Limit of the Highest Interval = 50 Upper Class Boundary of the Highest Interval = 50 + 0.5 = 50.5 Lower Class Limit of the Lowest Interval = 21 Lower Class Boundary of the Lowest Interval=21−0.5=20.5
Range = Upper Class Boundary of the – Lower Class Boundary of the Highest Interval Lowest Interval Range = 50.5 – 20.5 Range = 30
Therefore, the range of the given data set is 30.
2. Variance of Grouped Data (σ2)
Varianceistheaverageofthesquaredeviationfromthemean.Forlargequantities,the variance is computed using frequency distribution with columns for the midpoint value, the product of the frequency and midpoint value for each interval; the deviation and its square; and the product of the frequency and the squared deviation.
Tofindvarianceofagroupeddata,usetheformula:
σ2 = ∑f(X − x)2
∑f − 1
where; f = class frequency X = class mark x = class mean ∑f = total number of frequency
In calculating the variance, do the following steps:
1. Prepare a frequency distribution with appropriate class intervals and write the corresponding frequency ( f ).
2. Get the midpoint (X) of each class interval in column 2.3. Multiply frequency ( f ) and midpoint (X) of each class interval to get fX.4. AddfX of each interval to get ∑fX.
5. Compute the mean using x = ∑fX∑f .
6. Calculate the deviation (X − x ) by subtracting the mean from each midpoint.7. Square the deviation of each interval to get (X − x )2.8. Multiply frequency ( f ) and (X − x )2.Findthesumofeachproducttoget∑fX(X − x)f.9. Calculatethestandarddeviationusingtheformula
σ2 = ∑f(X − x)2
∑f − 1

500
Illustrative Example: Findthevarianceofthegivendataset:
Scores in Second Periodical Test ofI–FaithinMathematicsIScores Frequency46 – 50 141 – 45 1036 – 40 1031 – 35 1626 – 30 921– 25 4
Solutions:
Scores Frequency(f)
Class Mark (X) fX (X − x) (X − x)2 f (X − x)2
46 – 50 1 48 48 13.4 179.56 179.5641 – 45 10 43 430 8.4 70.56 705.636 – 40 10 38 380 3.4 11.56 115.631 – 35 16 33 528 -1.6 2.56 40.9626 – 30 9 28 252 -6.6 43.56 392.0421 – 25 4 23 92 -11.6 134.56 538.24
i = 5 ∑f = 50 ∑fX = 1,730 ∑f(X − x)2= 1,972
Mean (x) = ∑fX∑f =
1,73050 = 34.60
σ2 = ∑f(X −x)2
∑f −1
σ2 = 1,97250−1
σ2 = 1,97249 = 40.2448~40.24
Therefore, the variance(σ2) is 40.24.

501
3. Standard Deviation (s)
The standard deviation is considered the best indicator of the degree of dispersion among the measures of variability because it represents an average variability of the distribution. Given the set of data, the smaller the range, the smaller the standard deviation, the less spread is the distribution. To get the value of the standard deviation (s), just simply get the square root of the variance (σ2):
s = √σ2
Illustrative Example: Refer to the given previous example. Get the square root of the given value of variance:
s = √σ2
s = √40.24s = 6.34
Therefore, the standard deviation of the Scores in SecondPeriodicalTestofI–FaithinMathematicsIis6.34.
Were you able to learn different formulas in solving the range, variance, and standard deviation of grouped data? In the next activity, try to apply those important notes in getting the value of range, variance, and standard deviation of grouped data.
LET’S APPLY IT…Activity 3
Directions: Calculatetherange,varianceandstandarddeviationoftheWeeklyAllowanceofStudentsinBinagoSchoolofFisheries.Writeyourcompletesolutionsandanswers on a sheet of paper.
Weekly Allowance of Students in Binago School of Fisheries
WeeklyAllowance(in Pesos) Frequency
500-549 2450-499 3400-449 1350-399 3300-349 4250-299 14200-249 12150-199 21100-149 10
Range = ____________________________Variance (σ2) = ________________________Standard Deviation (s) = _________________

502
QU
ESTIONS?
1. Howdidyoufindtherange,varianceandstandarddeviation?2. Whatyoucansayaboutthevalueofrangeandvariance?3. Whatyoucansayaboutthestandarddeviation?4. Whathaveyoulearnedandrealizedwhiledoingtheactivity?
Were you able to solve the range, variance and standard deviation easily with your seatmate? Were you able to apply the notes on how to calculate the range, variance and standard deviation? Do the next activity by yourself.
CHALLENGE PART…Activity 4
Directions: Calculate the range, variance and standard deviation of the given grouped data.
Pledges for the Victims of Typhoon PabloPledges in Pesos Frequency9,000–9,999 48,000–8,999 127,000–7,999 136,000–6,999 155,000–5,999 194,000–4,999 303,000–3,999 212,000–2,999 411,000–1,999 31
0–999 14
QU
ESTIONS?
1. Whatisthe∑fX?2. Whatisthevalueofthemeaninthegivendistributiontable?3. Whatistheupperclassboundaryofthetopinterval?Whataboutthe
lower class boundary of the bottom interval?4. Whatistherange?5. Whatisthevarianceofthegivendistributiontable?6. Howwouldyoufindthevariance?7. Whatisthestandarddeviation?8. How would you solve for the standard deviation?9. Whathaveyoulearnedfromthegivenactivity?

503
What to UnderstandWhat to Understand
Reflect how you were able to develop a concept out of the activities you have studied. The knowledge gained here will further help you understand and answer the next activities. After doing the following activities, you should be able to answer the following question: How are the measures of variability of grouped data used in solving real-life problems and in making decisions?
LET’S CHECK YOUR UNDERSTANDING…Activity 5
1. Below are the scores of 65 students in a Mathematics testScore f X fX (X − x) (X − x)2 f (X − x)2
55 – 58 251 – 54 447 – 50 543 – 46 639–42 1035 – 38 1331 – 34 827 – 30 623 – 26 619–22 215 – 18 211 – 14 1
a. CompletethetablebyfillinginthevaluesofX (the class marks or midpoints), (X − x), (X − x)2 and f(X − x)2. Explain how you arrived at your answer.
b. Findtherange,varianceandstandarddeviationofthesetofdata.c. Whatyoucansayaboutthestandarddeviation?d. Whichmeasureisconsideredunreliable?Why?
2. Istherangethemostappropriatemeasureofdispersionforgroupeddata?Why?Howabout the variance? standard deviation? Explain your answer.
3. Is it always necessary to group a set of data when finding its range, variance andstandarddeviation?Why?

504
What new insights do you have about solving measures of variability ofgroupeddata?Whatdoyourealizeafterlearninganddoingdifferentactivities? Now, you can extend your understanding by doing the tasks in the next section.
G: Make a criteria for a scholarship grant based on monthly family income and scholastic performance.
R: BarangaySocialWorkerA: LocalNGOS: AnNGOin the localitywillgrantscholarship toqualifiedanddeserving
scholarsP: CriteriaS: Justification,Accuracyofdata,ClarityofPresentation
Create a scenario of the task in paragraph form incorporatingGRASP:Goal, Role,Audience,Situation,Product/Performance,Standards.
What to TransferWhat to Transfer
Demonstrate your understanding on measures of central tendency and measures ofvariabilitythroughproductsthatreflectmeaningfulandrelevantproblems/situations.

505
SUMMARY/SYNTHESIS/GENERALIZATION:
This lesson was about measures of variability of grouped data. The lesson provided you opportunities to describe on how to solve range, variance and standard deviation of the given grouped data. Moreover, you were given the chance to apply the given important notes on how to solve the range, variance and standard deviation of the given grouped data and to demonstrate your understanding of the lesson by doing a practical task.
Glossary
Measure of Central Tendency - The score or value is where all the other values in a distribu-tion tend to cluster.
Mean - The sum of measures x divided by the number n of measures in a variable. It is sym-bolized as (read as x bar).
Median - The middle entry or term in a set of data arranged in numerical order (either increas-ing or decreasing).
Mode - The measure or value which occurs most frequently in a set of data. It is the value with the greatest frequency.
Measure of Dispersion – The measure of spread of a data about the average of these data.
Range - The simplest measure of variability. It is the difference between the largest value and the smallest value.
Average Deviation or Mean Deviation - The dispersion of a set of data about the average of these data.
Standard Deviation - The most important measure of dispersion. It differentiates sets of scores with equal averages.
The variance (∂2) of a data is equal to 1N the sum of their squares minus the square of their
mean. It is virtually the square of the standard deviation.
References:
Canonigo,A.(2012)Statistics,K–12FacilitatorsGuideMathIV,ProjectEASEAmsco_IntegratedAlgebra,StatisticsJavier,S.CASIOFX–991ESPLUSHandbookPogoso, C., Montana, R, Introductory Statistics

506
http://www.picturesof.net/search_term_pages/meat.htmlhttp://www.stockfresh.com/image/289009/cartoon-kidshttp://www.fotosearch.com/photos-images/garment-factory.htmlhttp://www.equinoxlab.com/http://www.themall.ph/thumbs/images/2012/10/25/get1017125146/1_13511564701025145x217.JPGhttp://media3.picsearch.com/is?tqgS6MH-ZoNLoIkQZGJu2Qhkc_04U6Jd88KruCCxpz4http://cdn7.fotosearch.com/bthumb/CSP/CSP428/k4285733.jpg