measuring amines in norwegian niva: norway’s leading
TRANSCRIPT

REPORT SNO 6781-2015
Measuring amines in Norwegiansurface waters
Gaustadalléen 21 • NO-0349 Oslo, NorwayTelephone: +47 22 18 51 00 • Fax: 22 18 52 00www.niva.no • [email protected]
NIVA: Norway’s leading centre of competence in aquatic environments
NIVA provides government, business and the public with a basis forpreferred water management through its contracted research, reports and development work. A characteristic of NIVA is its broad scope ofprofessional disciplines and extensive contact network in Norway andabroad. Our solid professionalism, interdisciplinary working methods and holistic approach are key elements that make us an excellent advisor for government and society.

Norwegian Institute for Water Research – an institute in the Environmental Research Alliance of Norway REPORTMain Office Regional Office, Sørlandet Regional Office, Østlandet Regional Office, Vestlandet
Gaustadalléen 21 Jon Lilletuns vei 3 Sandvikaveien 59 Thormøhlens gate 53 D NO-0349 Oslo, Norway NO-4879 Grimstad, Norway NO-2312 Ottestad, Norway NO-5006 Bergen Norway Phone (47) 22 18 51 00 Phone (47) 22 18 51 00 Phone (47) 22 18 51 00 Phone (47) 22 18 51 00 Telefax (47) 22 18 52 00 Telefax (47) 37 04 45 13 Telefax (47) 62 57 66 53 Telefax (47) 55 31 22 14 Internet: www.niva.no
Title
Measuring amines in Norwegian surface waters Report No..
6781-2015
Project No.
O-12357
Date
20/01-2015
Pages Price
35
Author(s)
Amanda Poste Merete Grung Richard Frederic Wright
Topic group
Geographical area
Norway
Distribution
Public
Printed
NIVA
Client(s)
CLIMIT Client ref.
221244
Abstract
In summer 2012 we carried out a survey of amine concentrations in 21 Norwegian lakes with the aim of assessing the prevalence of amines in Norwegian lakes and identifying the main factors affecting concentrations of these compounds. The lakes were chosen to cover a range of lake types, water chemistry, catchment land use, and influence of anthropogenic pollution. As intended, the sites chosen covered a wide range in major component water chemistry and spanned gradients in the influence of several natural and anthropogenic drivers, including eutrophication, prevalence of wetlands in the catchment, and acidification.
The lack of available data on amines in surface waters is in part due to the analytical challenges associated with analysis of amines in complex environmental matrices, including surface waters. Due to analytical challenges, uncertainty surrounding the measured amine concentrations, and further development of analytical methods, several iterations of the method have been employed by NILU during this study and over the course of NIVA’s collaborative amine work with NILU. Due to this uncertainty in analyzed amine concentrations, we are unfortunately not able to report robust and quality assured data from amine analyses in the current study, nor are we able to assess seasonality in amine concentrations for samples collected for the seasonal study.
4 keywords, Norwegian 4 keywords, English
1. CO2 fangst 1. CO2 capture2. amin 2. amine3. innsjøer 3. lakes4. forurensing 4. pollution
Merete Grung Elisabeth Lie Thorjørn LarssenProject Manager Research Manager Senior Adviser
978‐82‐577‐6516‐3

Measuring amines in Norwegian surface waters

NIVA 6781‐2015
4
Preface
This survey of amine concentrations in Norwegian lakes was carried out by NIVA (Norwegian Institute for Water Research) in cooperation with NILU (Norwegian Institute for Air Research), where amine analyses were carried out. The personnel involved in the project are outlined in Appendix 8.2, and are thanked for their important contributions to this study.
This study was perfomed with financial support from Statoil and the CLIMIT programme, and we thank the funding sources for their support and input throughout the project.
Oslo, December 2014
Amanda Poste

NIVA 6781‐2015
5
TABLE OF CONTENTS
Preface ............................................................................................................. 4
1. Summary ...................................................................................................... 6
2. Norsk sammendrag ...................................................................................... 7
3. Introduction ................................................................................................. 8
4. Materials and methods ............................................................................... 10
4.1 Study Sites 10
4.2 Sample collection 12
4.3 Chemical analysis 14 4.3.1 General water chemistry 14 4.3.2 Amines 15
5. Results and Discussion ................................................................................ 16
5.1 General site chemistry 16 5.1.1 Na, Cl and SO4 18 5.1.2 Organic matter 19 5.1.3 Acidification 20 5.1.4 Eutrophication 21
5.2 Relationships between water chemistry parameters 24
5.3 Amines in Norwegian lakes 26 5.3.1 Amines in surface waters: Methodological approaches 26 5.3.2 Amine results from the current study 26 5.3.3 Relationships between amines and environmental parameters 31
6. Conclusions ................................................................................................ 32
7. References ................................................................................................. 33
8. Appendices ................................................................................................. 34
8.1 Abbreviations 34
8.2 Personnel 35

NIVA 6781‐2015
6
1. Summary
Amine‐based CO2 capture is one of the most promising technologies for emissions reductions from stack gases from fossil‐fuel power plant and other industrial waste gases. Amines are widespread in the environment and have many natural as well as industrial sources. Organisms can produce and release amines to the environment, and many precursors to amines (including amino acids) are released by aquatic organisms either while alive, or during decomposition of deceased plants and animals. Other potential natural sources of amines (and amine precursors) to freshwaters include runoff from the terrestrial environment as well as sea birds and other migratory wildlife. However, globally there are few data available regarding concentrations of amines in natural surface waters.
In summer 2012 we carried out a survey of amine concentrations in 21 Norwegian lakes with the aim of assessing the prevalence of amines in Norwegian lakes and identifying the main factors affecting concentrations of these compounds. The lakes were chosen to cover a range of lake types, water chemistry, catchment land use, and influence of anthropogenic pollution. Samples were collected from the lake outlets. Water samples for amine determination were delivered to the Norwegian Institute for Air Research (NILU) within 48 hours of collection, derivatized, and then detected by reversed phase liquid chromatography coupled with mass spectrometry. Seven amines were determined (methylamine: MA; ethylamine: EA; dimethylamine: DMA; diethylamine: DEA; monoethanolamine: MEA; 2‐amino‐2‐methyl‐propanol: AMP; and piperazine: PIP). Water samples were also delivered to the NIVA laboratory for determination of several water chemistry parameters, including: TOC, pH, TP, TN, SO4, NO3, Cl and Na, as well as chlorophyll a (as a measure of phytoplankton biomass).
As intended, the sites chosen covered a wide range in major component water chemistry and spanned gradients in the influence of several natural and anthropogenic drivers, including eutrophication, prevalence of wetlands in the catchment, and acidification.
The lack of available data on amines in surface waters is in part due to the analytical challenges associated with analysis of amines in complex environmental matrices, including surface waters. Due to analytical challenges, uncertainty surrounding the measured amine concentrations, and further development of analytical methods, several iterations of the method have been employed by NILU during this study and over the course of NIVA’s collaborative amine work with NILU (including a baseline study (Grung et al. 2012), monitoring of TCM activities, and the current study). This has strongly complicated the interpretation and comparison of measured amine concentrations for these studies.
Due to this uncertainty in analyzed amine concentrations, we are unfortunately not able to report robust and quality assured data from amine analyses in the current study, nor are we able to assess seasonality in amine concentrations for samples collected for the seasonal study. Future work should entail resolving analytical uncertainty. In particular, it would be useful to carry out an inter‐lab comparison for analysis of amines in water samples. The challenges we have encountered with obtaining reliable data on amine concentrations in water samples are extremely unfortunate, given that the this study was designed to yield key insights into the determinants of natural amine concentrations in surface waters, and of potential external and internal sources of amines to lakes. This information is critical for the robust assessment of the importance and potential impact of future increases in amine loading to boreal lakes (e.g. due to amine‐based CO2 capture).

NIVA 6781‐2015
7
2. Norsk sammendrag
Aminbasert CO2‐fangst er en av de ledende teknikkene for å redusere utslipp av denne klimagassen fra industrielle avgasser, både fra kullfyrte og oljefyrte energikilder. Aminer finnes overalt i miljøet, og har ulike naturlige så vel som industrielle kilder. Organismer kan produsere og avgi aminer til miljøet. Mange forløpere til aminer (bl.a. aminosyrer) stammer fra akvatiske organismer, enten mens de er i live, eller ved nedbrytning av plantemateriale eller døde organismer. Andre naturlige kilder til aminer i ferskvann er tilsig fra terrestrisk miljø, samt avføring fra fugler eller dyr. Det er imidlertid få undersøkelser av miljøkonsentrasjoner av aminer i naturlig overflatevann. Sommeren 2012 gjennomførte vi en undersøkelse av aminkonsentrasjoner i 21 norske innsjøer. Målet var å finne ut hvilke nivåer av aminer som var vanlige, samt å identifisere hvilke faktorer som bidro til de observerte nivåene. Innsjøene ble valgt for å omfattte ulike typer innsjøer, blant annet når det gjelder vannkjemi, arealbruk i nedbørsfeltet og grad av menneskelig påvirkning. Vannprøver ble samlet fra utløpet av innsjøen. Vannprøver til bestemmelse av aminer ble levert til Norsk institutt for luftforskning (NILU) senest 48 timer etter prøvetakning. Etter mottak ble prøvene derivatisert, og aminer ble målt ved hjelp av reversert fase væskekromatografi koblet til et massespektrometer. Syv aminer ble bestemt: metylamin (MA), etylamin (EA), dimetylamin (DMA), dietylamin (DEA), monoetanolamin (MEA), 2‐amino‐2‐metylpropanol (AMP) og piperazin (PIP). Deteksjonsgrensene varierte fra 10‐100 ng/L. Vannprøver ble også levert til NIVAs laboratorium for bestemmelse av ulike kjemiske vannparametre: totalt organisk karbon (TOC), pH, totalt fosfor (TP), totalt nitrogen (TN), ammonium (SO4), nitrat (NO3), Cl, og klorofyll a (som et mål på biomassen av planktonalger). Analysen av vannkjemien viste at vi hadde lyktes med å velge innsjøer med et bredt spekter av parameterne vi analyserte, både med henblikk på naturlig og menneskelig påvirkning. Dette inkluderer eutrofiering, graden av myrområder i nedbørsfeltet og forsuring. Mangelen på målte konsentrasjoner av aminer i naturlig overflatevann skyldes delvis analytiske utfordringer knyttet til aminer i komplekse miljøprøver. På grunn av de analytiske utfordringene og usikkerhet knyttet til de målte konsentrasjonene av aminer, har NILU kontinuerlig videreutviklet analysemetodene som er benyttet til dette formålet. Dette gjelder tre studier som NIVA i samarbeid med NILU har gjennomført: baselineundersøkelsen (Grung et al. 2012), overvåking av TCM og denne undersøkelsen. Videreutvikling og forbedring av analysemetodene har vanskeliggjort tolkning og sammenligning av målte aminkonsentrasjoner i de tre undersøkelsene.
På grunn av usikkerheten knyttet til amin‐analysene er det dessverre ikke mulig å rapportere robuste og kvalitetssikrede data for aminkonsentrasjoner i denne studien. Det betyr også at det ikke er mulig å rapportere årstidsvariasjoner for de prøvene som ble samlet inn til dette formålet. Vi håper fremtidig metodeutvikling vil løse de utfordringene som gjenstår. Spesielt vil det være nyttig med en ringtest for analyse av aminer i overflatevann.
Utfordingene knyttet til å måle aminkonsentrasjoner i overflatevann er svært uheldig, spesielt med tanke på at denne studien kunne ha gitt viktig informasjon knyttet til natrulig aminkonsentrasjoner i overflatevann og hvilke kilder dette kan knyttes til. Denne informasjonen er kritisk for en vurdering av mulige påvirkninger av aminkonsentrasjoner som eventuelt kan knyttes til amin‐basert CO2‐fangst.

NIVA 6781‐2015
8
3. Introduction
Technologies designed to capture and store CO2 from combustion flue gases (post combustion capture: PCC) are increasingly being considered for use in reducing CO2 emissions, particularly at sites where electricity is being produced using fossil fuels. Aqueous amines are the most common solvents for PCC and have long been used as solvents in CO2 removal (“sweetening”) processes for natural gas (Reynolds et al. 2012). PCC activities are known to result in a loss of amines from the absorber column, and as such, may represent a potential source of amines and amine degradation products (including nitrosamines and nitramines) to the environment (Reynolds et al. 2012), which is of concern with respect to potential toxic effects on aquatic ecosystems (Veltman et al. 2010). CO2 capture and storage has been proposed for Norwegian gas‐fired power plants (Kårstø and Mongstad) as a means of reducing CO2 emissions to the atmosphere, and amine‐based PCC technology will be tested in Norway at Test Centre Mongstad (TCM). In 2011, in conjunction with TCM and the Norwegian Institute for Forest and Landscape (Skog og Landskap), NIVA carried out a baseline survey of concentrations of several amines in the Mongstad region (Grung et al. 2011). Amines are widespread in the environment and have many natural as well as industrial sources (Poste et al. 2014). Biogenic amines can be formed through decarboxylation of amino acids (often through microbial processes), or by amination of ketones and aldehydes (Santos 1996). In the aquatic environment, many aquatic organisms are capable of producing and releasing amines (both primary amines as well as more complex compounds) to the surrounding environment. In the aquatic environment, studies in marine systems have indicated that aliphatic amines (such as methylamine, dimethylamine and diethylamine) often originate from biological sources (Facchini et al. 2008, Müller et al. 2009). Furthermore, many precursors to amines (including amino acids) are released by aquatic organisms while they are alive, or during decomposition of deceased plants and animals. These processes are likely to represent an important in situ source of amines to aquatic ecosystems. Amines and amine precursors may also be delivered to freshwaters from their terrestrial catchments (while catchment export of both nitrate and nitrite may be of important in determining the potential for formation of nitrosamines and nitramines). Other potential natural sources of amines (and amine precursors) to freshwaters include sea birds and other migratory wildlife. These organisms could deliver amine and amine‐related compounds to aquatic ecosystems through their faeces and urine both directly in the water and in the catchment. Furthermore, these organisms may be sources of both nitrates and nitrites, which may be of importance with respect to nitrosamine and nitramine formation. There is a remarkably broad and complex range of potential sources of amines to the aquatic environment, including both natural as well as anthropogenic sources. This suggests that, in order to identify the potential for changes in delivery of these compounds (e.g. through amine‐based CO2 capture activities) and the resultant implications for aquatic ecosystem and human health, there is a strong need to identify the sources that are most prevalent and most important to determining eventual concentrations of these compounds in freshwaters. This survey of amine concentrations in Norwegian lakes was designed to meet the following objectives:

NIVA 6781‐2015
9
1. To characterize amine concentrations in a diverse set of lakes, in order to gain insight into the range of concentrations encountered in Norwegian lakes. Lakes were selected to achieve gradients in water chemistry, the relative influence of various human activities, and other factors.
2. To identify potential determinants of amine concentrations in Norwegian freshwaters.

NIVA 6781‐2015
10
4. Materials and methods
4.1 Study Sites
We selected a set of 21 study lakes across southern Norway (Table 1, Figure 1) and one seawater site, which was included as a marine reference. The study lakes were chosen to represent the range of conditions that exist in southern Norwegian lakes. Many of the lakes included in the current study have been a part of monitoring programs at NIVA for many years (often decades), and as such, for several of the study lakes there are many existing data that can be used to contextualize the results of the current study. Three of the lakes included in the current study were also included in the 2011 baseline study carried out in the Mongstad region (Fonnebostvatnet (A7; M11 in 2011 study), Langevatnet (A8; M16 in 2011 study) and Storavatnet (A9; M52 in 2011 study)), in order to allow for temporal comparison of results. Table 1. General characteristics of study lakes.
Site Code
Lake County Area (km2)
Elevation (m a.s.l.)
Latitude (°)
Longitude (°)
NVEnr
A1 Spiradammen Akershus 0.03 13 59.84 10.50 80670A2 Lille Hovvatnet Aust‐Agder 0.22 503 58.61 8.04 10069A3 Langtjern Buskerud 0.23 516 60.37 9.73 7272 A4 Steinsfjorden Buskerud 13.81 63 60.08 10.32 67985A5 Atnsjøen Hedmark 5.01 701 61.89 10.14 126 A6 Mjøsa Hedmark 369.0 123 60.90 10.69 118 A7 Fonnebostvatnet Hordaland 0.06 23 60.75 5.18 26234A8 Langevatnet Hordaland 0.05 16 60.77 4.71 26190A9 Storavatnet Hordaland 0.14 24 60.18 5.05 26964A10 Litlevatnet Møre og Romsdal 0.02 123 62.40 5.61 30910A11 Svartdalsvatnet Oppland 0.59 1018 62.28 8.84 34660A12 Breidsjøen Oslo 0.21 248 60.00 11.03 2514 A13 Østensjøvatnet Oslo 0.33 107 59.89 10.83 2513 A14 Tunevatnet Østfold 2.36 40 59.31 11.10 3451 A15 Vansjø Østfold 35.62 25 59.38 10.86 291 A16 Frøylandsvatnet Rogaland 4.69 24 58.74 5.67 1552 A17 Måkevann Rogaland 0.28 272 58.32 6.38 21729A18 Røyravatnet Rogaland 0.43 231 59.54 6.03 22548A19 Nystølsvatnet Sogn og Fjordane 1.27 715 61.34 6.46 1651 A20 Skjervatjern Sogn og Fjordane 0.02 136 61.43 6.04 28412A21 Akersvatnet Vestfold 2.39 16 59.24 10.33 314 S1 Fedje Seawater Rogaland ~ 0 60.78 4.70 ~

NIVA 6781‐2015
11
Figure 1. Map showing locations of study lakes. Sites in this map (and in all others that follow) are labeled with the codes defined in Table 1. The set of lakes that we selected are diverse; they differ in their water chemistry and their exposure to various human activities, as well as several other factors (see Table 2). In particular, in our lake selection we have aimed to achieve the following gradients:
A broad geographic distribution in southern Norway
A range in lake elevation, lake area, lake depth and catchment area
Differences in the prevalence of agriculture (both grain and animal), urbanization, and forested areas in lake catchments
Differences in lake trophic status (including several eutrophic lakes)
Differences in marine influence (i.e. proximity to the sea)
Differences in humic content (lake colour) and pH
Differences in macrophyte abundance
Differences in the influence of seabirds
NIVA 6781‐2015
12
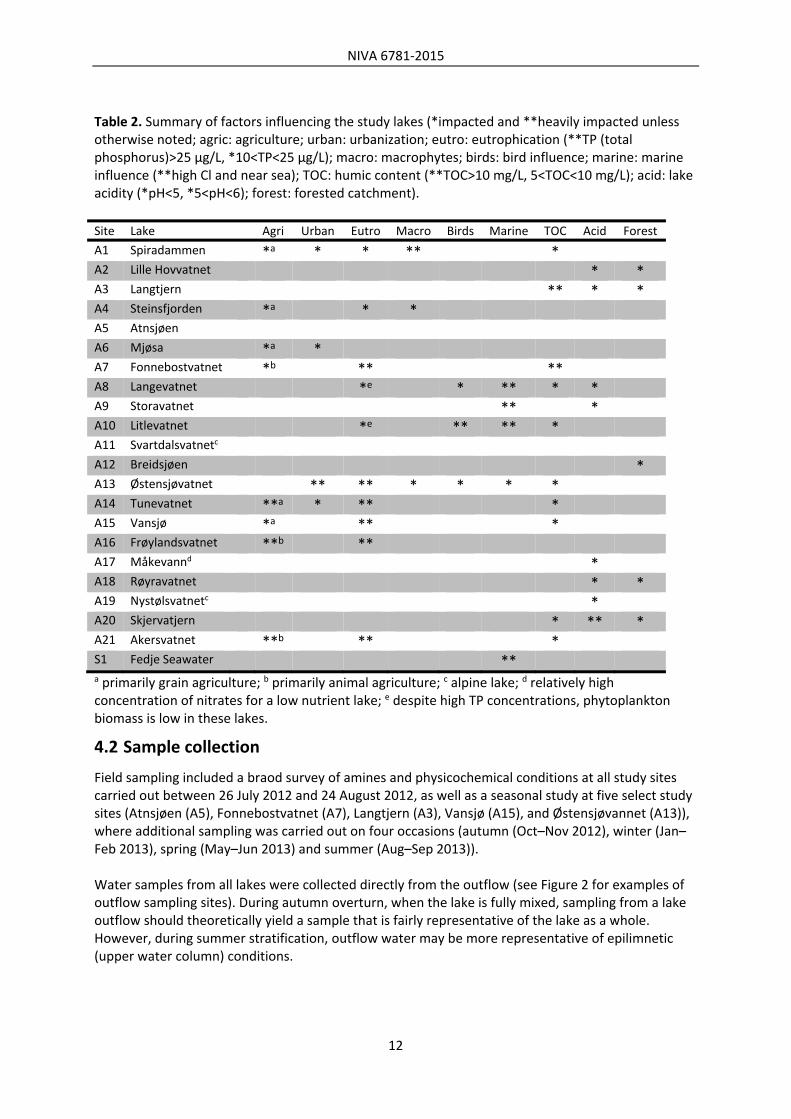
Table 2. Summary of factors influencing the study lakes (*impacted and **heavily impacted unless otherwise noted; agric: agriculture; urban: urbanization; eutro: eutrophication (**TP (total phosphorus)>25 µg/L, *10<TP<25 µg/L); macro: macrophytes; birds: bird influence; marine: marine influence (**high Cl and near sea); TOC: humic content (**TOC>10 mg/L, 5<TOC<10 mg/L); acid: lake acidity (*pH<5, *5<pH<6); forest: forested catchment).
Site Lake Agri Urban Eutro Macro Birds Marine TOC Acid Forest
A1 Spiradammen *a * * ** * A2 Lille Hovvatnet * * A3 Langtjern ** * * A4 Steinsfjorden *a * * A5 Atnsjøen A6 Mjøsa *a * A7 Fonnebostvatnet *b ** ** A8 Langevatnet *e * ** * * A9 Storavatnet ** * A10 Litlevatnet *e ** ** * A11 Svartdalsvatnetc A12 Breidsjøen * A13 Østensjøvatnet ** ** * * * * A14 Tunevatnet **a * ** * A15 Vansjø *a ** * A16 Frøylandsvatnet **b ** A17 Måkevannd * A18 Røyravatnet * * A19 Nystølsvatnetc * A20 Skjervatjern * ** * A21 Akersvatnet **b ** * S1 Fedje Seawater ** a primarily grain agriculture; b primarily animal agriculture; c alpine lake; d relatively high concentration of nitrates for a low nutrient lake; e despite high TP concentrations, phytoplankton biomass is low in these lakes.
4.2 Sample collection
Field sampling included a braod survey of amines and physicochemical conditions at all study sites carried out between 26 July 2012 and 24 August 2012, as well as a seasonal study at five select study sites (Atnsjøen (A5), Fonnebostvatnet (A7), Langtjern (A3), Vansjø (A15), and Østensjøvannet (A13)), where additional sampling was carried out on four occasions (autumn (Oct–Nov 2012), winter (Jan–Feb 2013), spring (May–Jun 2013) and summer (Aug–Sep 2013)). Water samples from all lakes were collected directly from the outflow (see Figure 2 for examples of outflow sampling sites). During autumn overturn, when the lake is fully mixed, sampling from a lake outflow should theoretically yield a sample that is fairly representative of the lake as a whole. However, during summer stratification, outflow water may be more representative of epilimnetic (upper water column) conditions.

NIVA 6781‐2015
13
Figure 2. Examples of lake outflow sampling sites (a. Nystølsvatnet (A19), b. Måkevann (A17), c. Fonnebostvatnet (A7), and d. Svartdalsvatnet (A11)). Water was collected using an acetone‐cleaned stainless steel bucket, and transferred to sample containers (dark 1 L polyethylene bottles for chlorophyll a analysis, regular 1 L polyethylene bottles for analysis of major chemical components, and 2.5 L dark glass bottles for analysis of amines). Water samples were kept in a dark and cold (~4–10 °C) environment during transport, and water samples for analysis of amines were delivered to NILU within 48 hours of collection. Meanwhile, within 12 hours of sampling, water for chlorophyll a analysis was filtered onto GF/C filters (nominal pore size of 0.7 µm) which were frozen until analysis.
a. b.
c. d.

NIVA 6781‐2015
14
4.3 Chemical analysis
4.3.1 General water chemistry
Analysis of major chemical components (TOC, pH, TP, TN, SO4, NO3, Cl and Na) and chlorophyll a (as a measure of phytoplankton biomass) was carried out at NIVA (see Table 3 for a summary of analytical methods and limits of detection). These parameters were included in order to characterize both the general water chemistry (including nutrient concentrations, humic matter/water colour, acidity and major ion concentrations) as well as trophic status of the study lakes. Table 3. Summary of analytical methods and limits of detection (LOD) for surface water chemical analyses at NIVA.
Code Parameter Analytical method LOD Unit
pH pH Potentiometry ~ ~
TOC Total organic carbon UV/persulphate oxidation to CO2
+ IR‐detection 0.10 mg C L‐1
TN Total nitrogen Automated photometry 10 µg N L‐1
TP Total phosphorus Automated photometry 1 µg P L‐1 NO3 Nitrate Ion chromatography 1 µg N L‐1 Na Sodium Ion chromatography 0.02 mg L‐1
Cl Chloride Ion chromatography 0.03 mg L‐1 SO4 Sulphate Ion chromatography 0.04 mg L‐1
Chl a Chlorophyll a Acetone extraction + spectophotometry
0.31 µg L‐1

NIVA 6781‐2015
15
4.3.2 Amines
Analysis of seven amines of interest (methylamine, ethylamine, dimethylamine, diethylamine, monoethanolamine, 2‐amino‐2‐methyl‐propanol, and piperazine) was carried out at NILU. These seven amines are the same compounds that were measured in the 2011 baseline survey (Grung et al. 2012). These analyses were performed using NILU’s in‐house validated methods, which are based on using derivatization to improve the analyte behavior towards reversed phase chromatography (see Table 4 for a summary of general methodological approaches). Aliquots of the water samples were prepared by adding a buffer solution and the derivatizing agent (either dansyl chloride or benzene sulphonylchloride). After a defined reaction time, sample analysis was carried out on either Insrument 1 or 2 (Table 4). Due to analytical challenges, uncertainty surrounding the measured amine concentrations, and further development of analytical methods, several iterations of the method (with differing limits of detection) were employed by NILU during the course of this project (Table 4), with some samples undergoing re‐analysis using updated methods (Table 5). We also sent samples from a small number of lakes (collected in April 2014, including three from the current study and three from the baseline study (Grung et al. 2012)) to an independent lab for analysis of several amines in order to assess the reproducibility of measured amine concentrations, however, we are not entitled to report these results at this time (Table 5). In method 4, three different blanks were included for quality control: one with only derivatization reagents and internal standards (which contain milliQ water and acetonitrile), one which was additionally diluted with milliQ water (to resemble a real sample) and one with reagents and HPLC‐grade bottled water. The standard based on milliQ water showed high values of amines while the undiluted sample showed lower amines values. The latter was used for blank corrections. Table 4. Summary of general approaches for the various methods used by NILU (based on personal communication from NILU).
NILU Method Number
General approach
1 Derivitizing agent: dansyl chloride; Instrument 1 (HPLC‐ToF‐MS)2 Derivitizing agent: unknown; Instrument 2 (UHPLC‐ToF‐MS)3 Derivitizing agent: unknown; Instrument 2; reagent corrected
4 Derivitizing agent: benzene sulphonylchloride; Instrument 2; New internal standards
Table 5. Summary of location of analysis and methods used for various sample sets (baseline study data are reported by Grung et al. 2012).
Sample set Location of anlaysis and method number
Baseline study Analyzed once at NILU using “Method 1”2012 survey Analyzed twice at NILU using “Methods 2 and 3”Seasonal study Analyzed once at NILU using “Method 3”2014 follow‐up sampling Analyzed at NILU using “Method 4” and at external independent lab

NIVA 6781‐2015
16
5. Results and Discussion
5.1 General site chemistry
Based on the results of analysis of general water chemistry (Table 6) for samples collected from the 21 study lakes in the 2012 survey, we found that the sites chosen covered a wide range in major component water chemistry and spanned several gradients in the influence of both natural and anthropogenic drivers including eutrophication, prevalence of wetlands in the catchment, and acidification. Table 6. Results from analysis of major chemical components and chlorophyll a (as a measure of phytoplankton biomass) in water from the study sites for the 2012 survey.
Site pH TP (ug/L)
TN (ug/L)
NO3
(ug/L)
TOC (mg/L)
Na (mg/L)
Cl (mg/L)
SO4
(mg/L) Chl a (ug/L)
A1 7.97 13 450 1 5.9 7.6 8.4 17.8 1.8A2 5.41 5 320 25 4.3 1.19 1.72 1.02 0.78A3 5.24 5 270 1 11.7 0.51 0.38 0.55 1.40A4 7.61 11 305 12 3.5 4.01 5.17 6.16 4.9A5 6.61 4 103 11 1.3 0.36 0.25 0.71 2.5A6 7.36 4 440 270 2.1 1.13 1.61 3.92 3.1A7 6.32 33 605 <1 11.2 6.1 8.97 4 2.6A8 5.06 16 255 1 5.2 19.3 35.1 4.99 1.5A9 5.98 5 185 1 3 12.1 21.9 3.32 1.2A10 6.93 18 370 1 7.8 21.4 37.9 3.61 1.8A11 6.43 1 70 21 0.33 0.33 0.36 0.51 0.61A12 7.37 3 215 23 3.1 1.76 1.83 2.73 1.30A13 7.48 131 1140 6 7.5 23.7 38.8 9.78 80A14 6.64 31 490 <1 5.3 10.1 15.5 5.71 12A15 6.88 29 760 260 8.3 8.14 12.8 5.74 10A16 7.55 25 950 380 4.4 10.3 18.2 6.52 18A17 5.92 5 380 185 1.8 6.41 11.1 5.04 1.3A18 5.92 2 165 47 2.1 1.62 2.33 0.94 0.7A19 5.90 1 77 34 0.34 1 1.67 0.54 <0.31A20 4.74 5 225 1 7.3 3.6 7.14 0.88 2.2A21 7.59 56 1410 625 6.7 13.1 20.5 10.7 26S1 8.09 10 195 2 2 2200 15900 2200 1.1
NIVA 6781‐2015
17
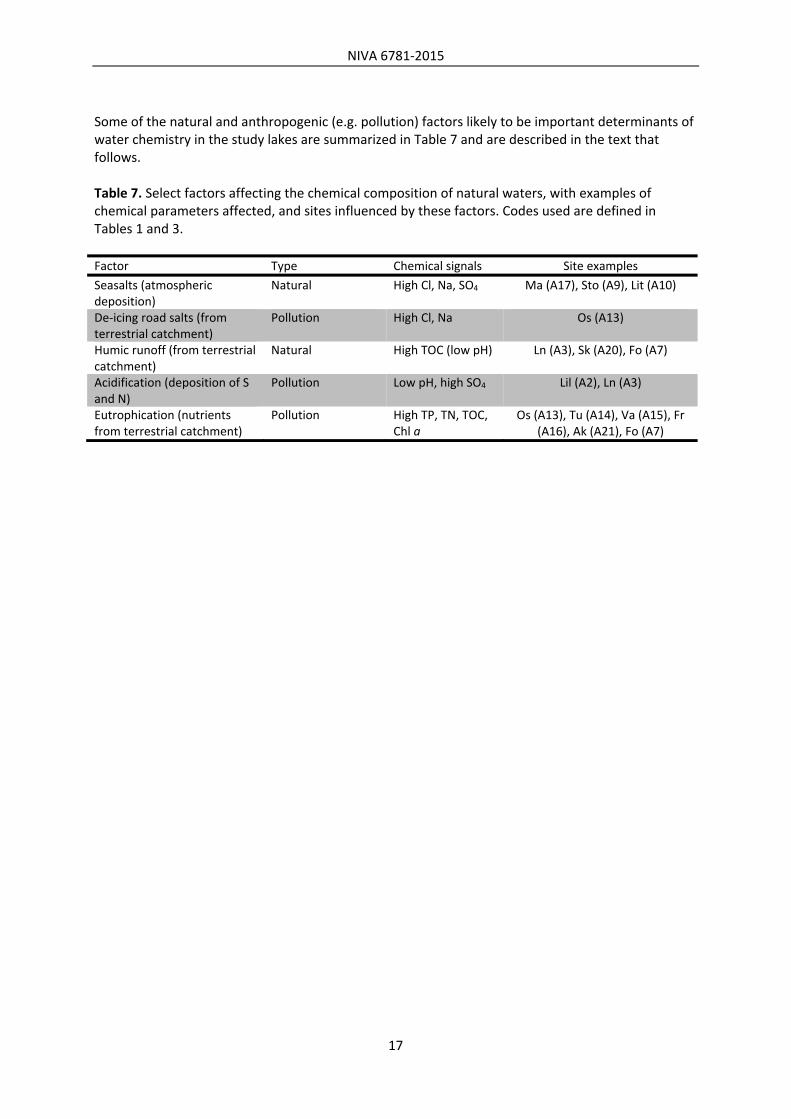
Some of the natural and anthropogenic (e.g. pollution) factors likely to be important determinants of water chemistry in the study lakes are summarized in Table 7 and are described in the text that follows. Table 7. Select factors affecting the chemical composition of natural waters, with examples of chemical parameters affected, and sites influenced by these factors. Codes used are defined in Tables 1 and 3.
Factor Type Chemical signals Site examples
Seasalts (atmospheric deposition)
Natural High Cl, Na, SO4 Ma (A17), Sto (A9), Lit (A10)
De‐icing road salts (from terrestrial catchment)
Pollution High Cl, Na Os (A13)
Humic runoff (from terrestrial catchment)
Natural High TOC (low pH) Ln (A3), Sk (A20), Fo (A7)
Acidification (deposition of S and N)
Pollution Low pH, high SO4 Lil (A2), Ln (A3)
Eutrophication (nutrients from terrestrial catchment)
Pollution High TP, TN, TOC, Chl a
Os (A13), Tu (A14), Va (A15), Fr (A16), Ak (A21), Fo (A7)

NIVA 6781‐2015
18
5.1.1 Na, Cl and SO4
Lakes near the coast usually have high concentrations of chloride (Cl) and sodium (Na), as well as elevated concentrations of both magnesium (Mg) and sulphate (SO4). This is due to natural seaspray that is entrained into the atmosphere, transported to the land and deposited in wet and dry deposition. In Norway the seasalt influence decreases with distance from the coast and is minor after 10‐20 km inland. In the current study, several of the coastal study lakes had particularly high Na, Cl and SO4 concentrations (Table 6, Figure 3). Østensjøvatnet (A13) also had very high Na and Cl concentrations, despite having less of a marine influence than many of the coastal lakes. This is likely due to localized application of road salts, given that Østensjøvatnet is an urban lake (within Oslo) that is bordered by a large road.
Figure 3. Na concentrations in the study lakes.

NIVA 6781‐2015
19
5.1.2 Organic matter
Organic matter in lakes can come from several natural or anthropogenic sources. Particularly important sources of organic matter to lakes includes humic‐rich runoff from natural forests or peatlands (allochthonous carbon), or organic matter produced within the lake by algae (autochthonous carbon). High levels of dissolved organic matter are characterized by high concentrations of TOC as well as other nutrients such as TN. The dissolved organic matter in humic‐rich runoff contains organic acids, which can act to lower the pH in highly coloured waters. In the current study, TOC concentrations ranged from 0.33 to 11.7 mg/L (Table 6, Figure 4), with the highest concentrations occurring in lakes that have either substantial wetland areas in their catchment (e.g. Langtjern (A3) or Skjervatjern (A20)) or high levels of phytoplankton productivity (e.g. Østensjøvatnet (A13) and Vansjø (A15)).
Figure 4. TOC concentrations in the study lakes.
NIVA 6781‐2015
20
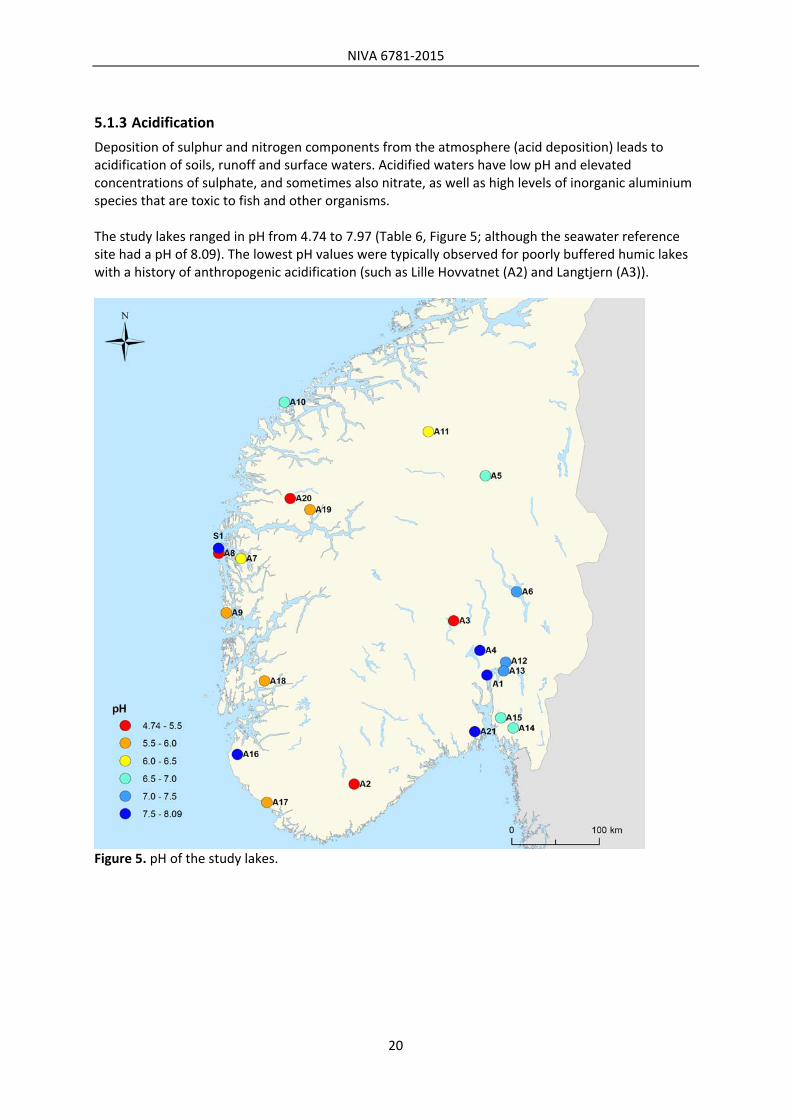
5.1.3 Acidification
Deposition of sulphur and nitrogen components from the atmosphere (acid deposition) leads to acidification of soils, runoff and surface waters. Acidified waters have low pH and elevated concentrations of sulphate, and sometimes also nitrate, as well as high levels of inorganic aluminium species that are toxic to fish and other organisms. The study lakes ranged in pH from 4.74 to 7.97 (Table 6, Figure 5; although the seawater reference site had a pH of 8.09). The lowest pH values were typically observed for poorly buffered humic lakes with a history of anthropogenic acidification (such as Lille Hovvatnet (A2) and Langtjern (A3)).
Figure 5. pH of the study lakes.

NIVA 6781‐2015
21
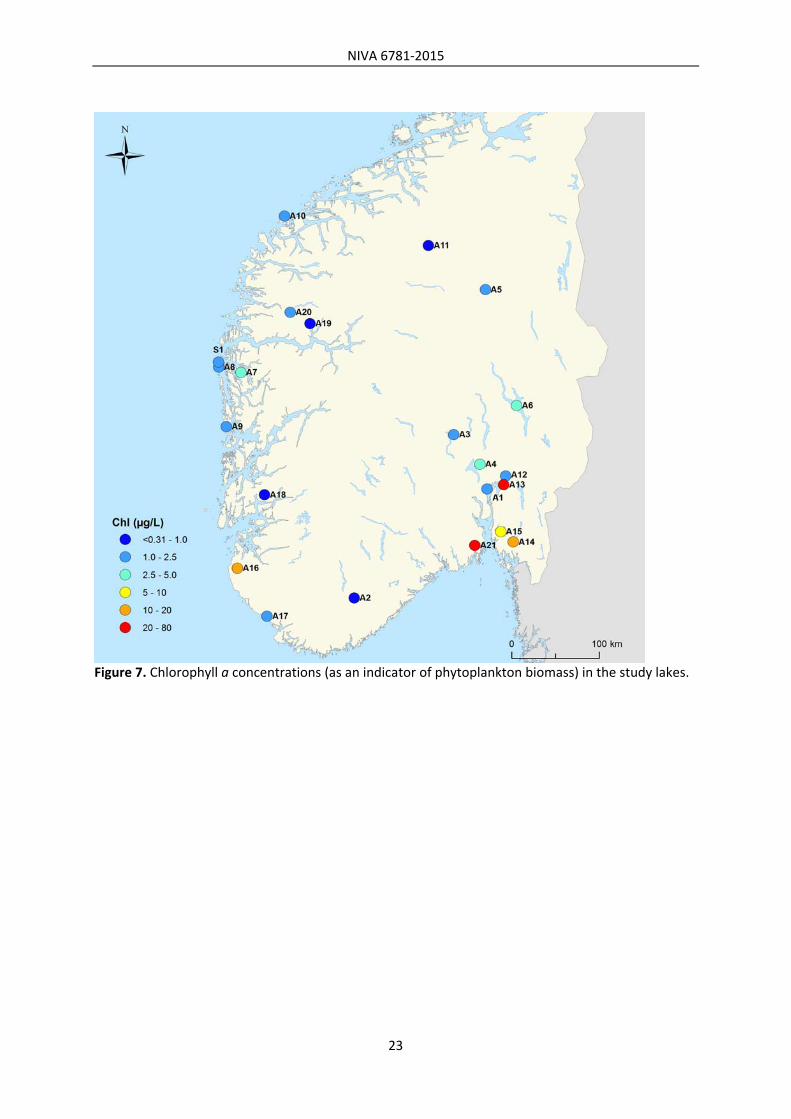
5.1.4 Eutrophication
Pollution by nutrients from agriculture and human wastewaters leads to elevated concentrations of phosphorus and nitrogen. Primary production in most Norwegian lakes is limited by phosphorus, and lakes with high concentrations of phosphorus typically have high biomasses of phytoplankton (reflected in concentrations of the pigment chlorophyll a) and /or higher aquatic plants (macrophytes). The high biomasses of primary producers can also lead to high TOC in these lakes. Lakes are often categorized based on their trophic status (or productivity) based on their nutrient or chlorophyll a concentrations. “Oligotrophic” lakes are typically clear, unproductive lakes with low nutrient concentrations and phytoplankton biomass (often defined as a lake where TP < 10 µg/L and/or Chl a < 2.5 µg/L), “mesotrophic” lakes are intermediately productive (10 < TP < 35 µg/L and/or 2.5 < Chl a < 8 µg/L), “eutrophic” lakes are often defined as have TP concentrations between 35–100 µg/L and/or chlorophyll a concentrations between 8–25 µg/L. Lakes with TP and/or chlorophyll a concentrations in excess of these ranges are defined as “hypereutrophic”. Of the sites included in the current study, based on TP and chlorophyll a concentrations concentrations, more than half of the study lakes can be classified as oligotrophic (Table 6, Figures 6, 7), while only a small subset of the lakes were eutrophic or hypereutrophic (e.g. Østensjøvatnet (A13) and Akersvatnet (A21)). The remaining sites can be classified as mesotrophic. In particular, lakes heavily influenced by urbanization and/or agriculture tended to have the highest nutrient (TN, TP) and chlorophyll a concentrations (see Table 2 for a summary of agricultural and urban influences on the study lakes and their catchments). Meanwhile, the lowest concentrations were observed in dilute and remote lakes without significant inputs of organic matter (or nutrients) from their catchments, such as the alpine lakes Svartdalsvatnet (A11) and Nystølsvatnet (A19).

NIVA 6781‐2015
22
Figure 6. TP concentrations in the study lakes.
NIVA 6781‐2015
23
Figure 7. Chlorophyll a concentrations (as an indicator of phytoplankton biomass) in the study lakes.

NIVA 6781‐2015
24
5.2 Relationships between water chemistry parameters
Among the water chemistry parameters measured, there were significant positive correlations (Table 8) between chlorophyll a concentrations and total phosphorus and nitrogen concentrations (Figure 8a, b), with higher nutrient concentrations supporting higher biomasses of phytoplankton. Concentrations of TP, TN and chlorophyll a were also positively related to concentrations of marine derived ions and negatively related to elevation (Figure 8c). This is likely due to the fact that lowland and coastal lakes in southern Norway are often situated in an agricultural landscape with higher population densities, thus are more prone to increases in nutrient loading and trophic status. There were also significant positive correlations (Table 8) between Na, Cl and SO4 concentrations, driven by the co‐occurrence of these ions in water influenced by deposition of marine derived ions (from seaspray). We also found strong negative correlations between these three ions and elevation (Figure 8d), which can also be attributed to differences in marine influence between low‐lying coastal areas and higher elevation lakes (which were typically further inland). Table 8. Pearson’s correlation coefficients (r) for correlations between water chemistry parameters for freshwater samples. Correlations shown are significant at the P<0.05 level. Values marked with an asterisk are significant at the P<0.01 level.
pH TP TN NO3 TOC Na Cl SO4 Chl a
pH 1 TP 1 TN 0.47 *0.89 1 NO3 1 TOC *0.64 *0.58 ‐0.45 1 Na *0.79 *0.69 1 Cl *0.74 *0.66 *0.99 1 SO4 *0.65 *0.78 *0.79 *0.81 *0.77 1 Chl a *0.55 *0.87 *0.72 *0.57 0.53 *0.66 1Elevation *‐0.71 *‐0.67 *‐0.80 *‐0.77 *‐0.82 ‐0.52

NIVA 6781‐2015
25
Figure 8. Select correlations between water chemistry parameters: a) chlorophyll a vs. TP, b) chlorophyll a vs. TN, c) TP vs. elevation, and d) Na vs. elevation. See Table 8 for Pearson’s correlation coefficients.
1 2 5 10 20 50 100
0.5
2.0
5.0
20.
050
.0
A12
A13
A14A15
A16
A17
A18
A21
A2
A1A3
A4
A19
A20A8
A7
A9A10
A11
A5A6
a)
TP (µg/L)
Chl
a (
µg/
L)
100 200 500 10000
.52.
05.
02
0.0
50.0
A12
A13
A14A15
A16
A17
A18
A21
A2
A1A3
A4
A19
A20A8
A7
A9A10
A11
A5A6
b)
TN (µg/L)
Chl
a (
µg/
L)
20 50 100 200 500
12
510
2050
100
A12
A13
A14A15A16
A17
A18
A21
A2
A1
A3
A4
A19
A20
A8
A7
A9
A10
A11
A5A6
c)
Elevation (m.a.s.l.)
TP
(µg
/L)
20 50 100 200 500
0.5
1.0
2.0
5.0
10.0
A12
A13
A14A15A16
A17
A18
A21
A2
A1
A3
A4
A19
A20
A8
A7
A9
A10
A11A5
A6
d)
Elevation (m.a.s.l.)
Na
(m
g/L
)

NIVA 6781‐2015
26
5.3 Amines in Norwegian lakes
5.3.1 Amines in surface waters: Methodological approaches
There are very few reported concentrations of amines in surface waters in the scientific literature, and as such, the current study was designed in order to provide critical information about the prevalence of amines in lakes. In particular, several remote lakes with low levels of human impact were included in order to provide an estimate of the range of background amine concentrations that exist in Norwegian freshwaters. Furthermore, we sought to test for relationships between lake characteristics, human and natural influences and amine concentrations through the pairing of analysis for select amines with characterization of general water chemistry and primary productivity. The lack of available data on amines in surface waters is in part due to the analytical challenges associated with analysis of amines in complex environmental matrices, including surface waters. Several analytical approaches for the detection of amines have been presented in the literature, typically based on chemical derivatization followed by extraction of derivatives and detection (e.g. Sacher et al. 1997, Cai et al. 2003, Chang et al. 2012, Fu et al. 2012). These methods use a variety of derivatizing reagents as well as different methods for extraction (e.g. chemical or solid phase extraction), separation (e.g. gas chromatography (GC), liquid chromatography (LC) or electrophoresis) and detection (e.g. mass spectrometry (MS), fluorescence or laser‐induced fluorescence). Chemical analysis of amines in environmental samples is particularly challenging due to low environmental concentrations, high volatility, low molecular weight, high polarity, instability and lack of chromophores (Chang et al. 2012).
5.3.2 Amine results from the current study
NILU sought to measure seven different amines in water from all study sites: methylamine (MA), ethylamine (EA), monoethanolamine (MEA), dimethylamine (DMA), diethylamine (DEA), 2‐amino‐2‐methyl‐propanol (AMP) and piperazine (PIP). Due to analytical challenges, uncertainty surrounding the measured amine concentrations, and development of analytical methods, as outlined in Section 4.3.2, several different methods were used at NILU for analysis of amines during the course of NIVA’s collaborative amine work with NILU (including the baseline study (Grung et al. 2012), monitoring of TCM activities, and the current study). This has complicated the interpretation and comparison of measured amine concentrations for these studies. The methodology employed at NILU for the amine‐analyses was a combination of liquid chromatography (LC), which separates the compounds based on their inherent properties, followed by detection by mass spectrometry (MS). There are therefore two main factors that will influence the uncertainty in the instrumental aspect of the analysis; a) the ability of the chromatography to separate the compounds in time before the detection, and b) the ability of the mass spectrometer to distinguish between the mass to charge ratio (m/z) of the compounds of interest and interfering compounds. When analysing compounds that are small or not so volatile, derivatisation of functional groups is often used to improve the chromatographic properties and/or to facilitate the volatility of the compound. For amine analyses, derivatisation was employed to improve the chromatographic separation, and to increase the m/z ratio for the amines, thereby increasing the specificity of the signal. The analytical challenge analyzing amines is that for most of these substances, the masses are so low that they are not particularly specific. The masses employed for detection can therefore have the same mass as fragmentation products of other compounds containing the same set of functional groups, and will therefore not be distinguishable from one another.

NIVA 6781‐2015
27
The methodology of amine analyses employed by NILU has evolved quite rapidly during the years since the first studies commenced (baseline study, Grung et al. 2012), and the method has improved substantially since then. Three major changes to the method employed for analysing amines have been the result of method development and a change of instrument.
In an early phase, dansyl chloride was used as the derivatisation agent. Later, this was
changed to benzenesulfonylchloride, which has shown to ease the process of derivatisation,
increase the reaction product and produce more stable ions. All in all, this means that the
sensitivity and specificity of the method has increased. The change of derivatisation agent
meant that the m/z values measured had to be changed, and this seems to have minimised
the tendency to analyse artefacts as part of the amines results.
The LC part of the instrument was changed from a regular HPLC to a UHPLC (ultra‐high
performance liquid chromatography), which enabled improved chromatographic separation
and therefore improved specificity of the method. At the same time, this allowed for a
substantial reduction in the amount of time needed for analysis.
The LC was coupled with a time‐of‐flight (ToF) mass spectrometer. The technique was
developed decades ago, and although MS technology has not changed much during this
time, recent rapid development of the electronic equipment used in the instrumentation has
led to an improvement of the technique. The ToF instruments of today have a much better
mass resolution (separation of one m/z from a nearby m/z) as well as mass accuracy
(deviation from theroretical mass) than just a few years ago.
In an early phase of the amine‐analyses at NILU (baseline study, Grung et al. 2012), the old HPLC instrument with ToF MS detection was used, along with dansyl chlorid as a derivatisation agent. In subsequent years, the method underwent several improvements (Table 4). The new LC/MS instrument with better sensitivity and chromatographic and mass resolution has improved the specificity of the method. The most current analytical method (since spring 2014) is theoretically therefore less hampered by the detection of artefacts than the earlier method. However, there is a high degree of uncertainty associated with the results of these amine analyses, and due to the wide variety of methods employed in the determination of amines at NILU, it is highly challenging to compare the results of different studies and different analytical techniques. In particular, the high amine concentrations observed in the baseline study as well as the current study may be driven by concurrent analysis of amine and artefact. The likely overestimation of these amine concentrations in the baseline and current study is also supported by recent results from our 2014 subset of samples (analyzed by both NILU and an independent lab), where amine levels were generally below detection. Blank values are available for methods 2 and 4. Results from analysis of blanks revealed high concentrations of several amines, with the two methods yielding quite different results with respect to which amines were present at high concentrations (Table 9). The reasons for these elevated blank values are currently unclear and these challenges with obtaining low blank values adds to the uncertainty in the results of amine analyses in the current study,

NIVA 6781‐2015
28
Table 9. Concentrations (mean ± s.d. in ng/L) of amines blank samples (for method 4, blanks reported were run on 27 June 2014). MA EA MEA DMA DEA AMP PIP
Method 2 MilliQ Water 911 ± 46 <40 993 ± 109 8718 ± 959 98 ± 22 <100 589 ± 71 Tap Water 725 ± 36 <40 1048 ± 105 3154 ± 284 <50 <100 712 ± 85 Method 4 MilliQ Water <10 160 140 200 1260 1280 <40 HPLC Water <10 180 <130 210 1620 2320 <40 Reagents <10 240 200 400 1460 <100 60
Due to this uncertainty in analyzed amine concentrations, we are unfortunately not able to report robust and quality assured data from amine analyses in the current study, nor are we able to assess seasonality in amine concentrations for samples collected for the seasonal study. However, in order to illustrate the challenges and changes in amine concentrations determined using the various analytical methods, we present data from the summer 2012 survey as analyzed using two different methods (Figure 9), and data from two of the survey lakes (A3 and A6) and four additional lakes that were sampled at several time‐points and analyzed using multiple methods (Figure 10).

NIVA 6781‐2015
29
Figure 9. Concentrations of measured amines in samples collected during the summer 2012 survey using methods 2 and 3 (re‐analysis of the same samples). EA and AMP concentrations were always below detection limits (<0.02 and <0.05 µg/L respectively). Concentrations are not blank corrected.
Method 2Method 3
DE
A (
µg
/L)
0
0.2
0.4
0.6
0.8
1.0
DM
A (
µg
/L)
0
5
10
15
20
25
MA
(µ
g/L
)
0
1
2
3
4
5
ME
A (
µg/
L)
0
1
2
3
4
5
PIP
(µ
g/L
)
0
0.2
0.4
0.6
0.8
Sampling Site
A1 A10 A11 A12 A13 A14 A15 A16 A17 A18 A19 A2 A20 A21 A3 A4 A5 A6 A7 A8 A9

NIVA 6781‐2015
30
Figure 10. Concentrations of measured amines in samples collected from a subset of sites (including two sites from the 2012 survey, and four additional lakes). For A3 and A6, data for Methods 2 and 3 were from one re‐analyzed sample from the summer 2012 survey. For Lakes 1–4, data for Method 1 are from samples collected in the baseline survey (Grung et al. 2012), while data for Method 3 are from samples collected in November 2013. All data for Method 4 are from samples collected in April 2014. Asterisks indicate that concentrations were below method detection limits. For method 4, detection limits for DEA, DMA, MA, MEA and PIP were 980, 270, 50, 130 and 40 ng/L respectively. Concentrations for methods 1 and 4 are blank corrected.
Method 1Method 2Method 3Method 4
* ** * * ** *
DE
A (
ng
/L)
0
100
200
300
400
500
600
* * * ** *
DM
A (
ng
/L)
0
5000
10000
15000
20000
25000
* **
MA
(n
g/L
)
0
1000
2000
3000
4000
5000
** ** *
ME
A (
ng/L
)
0
500
1000
1500
2000
2500
3000
***** * **** ** * * *
PIP
(n
g/L
)
0
200
400
600
Sampling Site
A3 A6 Lake 1 Lake 2 Lake 3 Lake 4

NIVA 6781‐2015
31
5.3.3 Relationships between amines and environmental parameters
We tested for relationships between concentrations of the seven measured amines and the water chemistry parameters included in the current study. We tested for relationships across all of the study lakes included in the summer 2012 survey to see whether these environmental parameters could explain the between‐lake variability in concentrations of the measured amines. We also tested for relationships between environmental parameters and amine concentrations within the seasonal study lakes to assess whether seasonal variability in amine concentrations could be linked to seasonal changes in environmental conditions in these lakes. We found some very interesting results through these analyses (including evidence that concentrations of several amines were positively correlated to TOC concentrations, suggesting that catchment inputs of amines or amine precursors could be important in determining natural amine concentrations). However, due to the high degree of uncertainty surrounding the measured amine concentrations, we are not able to assess the validity of these observed relationships and seasonal patterns, and as such, they are not presented in this report. This is particularly unfortunate given the lack of such information in the literature and the strong need for knowledge on natural levels of amines in the aquatic environment, and potential environmental determinants of the presence of these compounds.

NIVA 6781‐2015
32
6. Conclusions
The study lakes chosen for analysis of amine concentrations were a good representation of the diverse range of conditions that exist in Norwegian lakes in terms of their water chemistry, exposure to various human activities and catchment land cover. The lakes provided gradients in several parameters, including: pH, trophic status, impact of acidification, and amount of humic matter (TOC). These gradients were used to assess the factors that influence amine concentrations in Norwegian lakes. Despite a study design that would have provided key insight into some of the environmental and human factors that influence amine concentrations in lakes, our ability to draw conclusions regarding our questions of interest was strongly hampered by difficulties with the analytical methodology. Amines are particularly difficult to analyse in environmental samples, and these analytical challenges led to a high degree of uncertainty associated with the measured amine concentrations. Over the course of NIVA’s collaborative amine work with NILU (including the baseline study (Grung et al. 2012), monitoring of TCM activities, and the current study), the rapid development of analytical methods at NILU has led to several different methods being used for analysis of amines over the course of these studies, complicating the interpretation and comparison of measured amine concentrations. Given the challenges associated with developing robust methodology for analysis of amines in complex environmental samples, including surface waters, future work should focus on improvement and validation of analytical methods. In particular, it would be useful to carry out an inter‐lab comparison for analysis of amines in water samples. The challenges we have encountered with obtaining reliable data on amine concentrations in water samples are extremely unfortunate, given that the data that this study aimed to provide would fill an important gap in the scientific literature and in our understanding of the determinants of natural background amine concentrations in surface waters, and of potential external and internal sources of amines to lakes. This information is particularly important for informing future work in the assessment of the importance and potential impact of future increases in amine loading to boreal lakes (e.g. due to amine‐based CO2 capture).

NIVA 6781‐2015
33
7. References
Cai, L., Y. Zhao, S. Gong, L. Dong, and C. Wu. 2003. Use of a novel sol–gel dibenzo‐18‐crown‐6 solid‐phase microextraction fiber and a new derivatizing reagent for determination of aliphatic amines in lake water and human urine. Chromatographia 58:615–621.
Chang, W., Wang, C., Jan J., Lo Y., Wu C. 2012. Vortex‐assisted liquid‐liquid microextraction coupled with derivatization for the fluorometric determination of aliphatic amines. Journal of Chromatography A 1248:41–47.
Facchini, M. C., S. Decesari, M. Rinaldi, C. Carbone, E. Finessi, M. Mircea, S. Fuzzi, F. Moretti, E. Tagliavini, D. Ceburnis, and C. D. O’Dowd. 2008. Important Source of Marine Secondary Organic Aerosol from Biogenic Amines. Environmental Science and Technology 42:9116–9121.
Fu, N., Zhang, H., Wang, H. Analysis of short‐chain aliphatic amines in food and water samples using a near infrared cyanine 1‐(ε‐succinimydyl‐hexanoate)‐1′‐methyl‐ 3,3,3′,3′‐tetramethyl‐indocarbocyanine‐5,5′‐disulfonate potassium with CE‐LIF detection. Electrophoresis 33:3002–7.
Grung, M., S. Ranneklev, Ø. Garmo, R. F. Wright, T. Myking, E. Heegaard, B.‐H. Øyen, F. Høistad Schei, and H. H. Blom. 2012. Terrestrial and aquatic baseline study and monitoring programme for CO2 Technology Centre Mongstad. NIVA report 6311‐2012.
Gerecke, A. C., and D. L. Sedlak. 2003. Precursors of N‐nitrosodimethylamine in natural waters. Environmental Science and Technology 37:1331–1336.
Müller, C., Y. Iinuma, J. Karstensen, D. Van Pinxteren, S. Lehmann, T. Gnauk, and H. Herrmann. 2009. Seasonal variation of aliphatic amines in marine sub‐micrometer particles at the Cape Verde islands. Atmospheric Chemistry and Physics 9:9587–9597.
Poste, A., M. Grung, R. Wright. 2014. Amines and amine‐related compounds in surface waters: A review of sources, concentrations and aquatic toxicity. Science of the Total Environment 481:274–279.
Reynolds, A. J., T. V. Verheyen, S. B. Adeloju, E. Meuleman, and P. Feron. 2012. Towards Commercial Scale Postcombustion Capture of CO2 with Monoethanolamine Solvent: Key Considerations for Solvent Management and Environmental Impacts. Environmental Science and Technology 46:3643–3654.
Sacher, F., Lenz, S., Brauch, H. Analysis of primary and secondary aliphatic amines in waste water and surface water by gas chromatography‐mass spectrometry after derivatization with 2,4‐dinitrofluorobenzene or benzenesulfonyl chloride. 1997. Journal of Chromatography A 764:85–93.
Santos, M. H. S. 1996. Biogenic amines: their importance in foods. International Journal of Food Microbiology 29:213–231.
Veltman, K., B. Singh, and E. G. Hertwich. 2010. Human and Environmental Impact Assessment of Postcombustion CO 2Capture Focusing on Emissions from Amine‐Based Scrubbing Solvents to Air. Environmental Science and Technology 44:1496–1502.
Wang, W., S. Ren, H. Zhang, J. Yu, W. An, J. Hu, and M. Yang. 2011. Occurrence of nine nitrosamines and secondary amines in source water and drinking water: Potential of secondary amines as nitrosamine precursors. Water Research 45:4930–4938.

NIVA 6781‐2015
34
8. Appendices
8.1 Abbreviations
AMP 2‐amino‐2‐methyl‐propanol Chl a chlorophyll a Cl chloride DEA diethylamine DMA dimethylamine EA ethylamine LOD limit of detection MA methylamine MEA (mono)ethanolamine Na sodium NILU Norwegian Institute for Air Research NIVA Norwegian Institute for Water Research NO3 nitrate PIP piperazine SO4 sulphate TCM CO2 Technology Centre Mongstad TOC total organic carbon TN total nitrogen TP total phosphorus

NIVA 6781‐2015
35
8.2 Personnel
The following people at NIVA participated in the project:
Merete Grung, PhD – environmental toxicologist. Dr. Grung is a senior scientist with over 20 years of experience in analytical chemistry, environmental chemistry and environmental toxicology. Acted as the project leader.
Richard Wright, PhD – environmental chemist. Dr. Wright is a senior research scientist with over 35 years of experience in hydrochemical research, including field studies, catchment‐scale experiments and modelling. Acted as a senior advisor and provided quality assurance for the project.
Amanda Poste, PhD – limnologist. Co‐ordinated and carried out fieldwork, preparations for laboratory analysis, data analysis and played a central role in writing progress and final reports.
Espen Lund, MSc – ecologist. Created maps related to the project, and collected background physicochemical data for lake selection.
Linda Marie Skryseth, MSc – ecotoxicologist. Assisted with field sampling.
Tomas Adler Blakseth, MSc – chemist. Blakseth is the acting research leader for the section for chemical analysis at NIVA and, along with colleagues in the NIVA lab, carried out chemical analysis and provided final data for major chemical components and chlorophyll a concentrations.
Andrew Harvey, BA – assisted with fieldwork, and took the photos included in this report. Amine analysis methods 1‐4 were carried out at NILU, in the department for Environmental Chemistry (MILK). Analyses using NILU method 4 were carried out by Pawel Rostkowski (PhD).

Gaustadalléen 21 • NO-0349 Oslo, NorwayTelephone: +47 22 18 51 00 • Fax: 22 18 52 00www.niva.no • [email protected]
NIVA: Norway’s leading centre of competence in aquatic environments
NIVA provides government, business and the public with a basis forpreferred water management through its contracted research, reports and development work. A characteristic of NIVA is its broad scope ofprofessional disciplines and extensive contact network in Norway andabroad. Our solid professionalism, interdisciplinary working methods and holistic approach are key elements that make us an excellent advisor for government and society.