measuring and assessing investment risk in the second ... · 3 investment risk in the...
TRANSCRIPT
www.theicct.org
DECEMBER 2013WHITE PAPER
BEIJING | BERLIN | BRUSSELS | SAN FRANCISCO | WASHINGTON
MEASURING AND ADDRESSING INVESTMENT RISK IN THE SECOND-GENERATION BIOFUELS INDUSTRYAUTHORS: Nathan Miller (Castalia Strategic Advisors), Adam Christensen, Ji Eun Park
(Johns Hopkins University), Anil Baral, Chris Malins, and Stephanie Searle (International
Council on Clean Transportation)

© 2013 International Council on Clean Transportation
1225 I Street NW, Suite 900 Washington, DC 20005
www.theicct.org | [email protected]
i
TABLE OF CONTENTS
Executive summary ....................................................................................................................1
Introduction ............................................................................................................................... 3
The Renewable Fuel Standard ............................................................................................................ 3
Current status of the second-generation biofuel industry ...................................................... 5
Existing regulatory and tax incentives ................................................................................... 7
RIN pricing .................................................................................................................................................. 7
Cellulosic waiver credits ........................................................................................................................ 9
State-level regulatory incentives for biofuels ..............................................................................12
Second-generation biofuel producer tax credit .........................................................................12
Risk estimates .......................................................................................................................... 14
Firm-level analysis ..................................................................................................................................14
Market conditions ................................................................................................................................. 20
Barriers to commercialization ................................................................................................21
Blend wall ...................................................................................................................................................21
Forward contracting .............................................................................................................................23
Oil prices ...................................................................................................................................................25
Political uncertainty .............................................................................................................................25
Financial mechanisms to reduce risk in the advanced biofuel industry .........................27
Introduction to tax credits .................................................................................................................27
Proposed changes to the tax code .................................................................................................28
Pros and cons of tax credits ..............................................................................................................29
Conclusions ...............................................................................................................................31
References ................................................................................................................................33
Appendix A: RIN generation ..................................................................................................36
Appendix B: Financial data for biofuel companies ........................................................... 40
Appendix C: Proposed changes to 26 U.S.C. § 48(a) ........................................................42
Appendix D: Proposed changes to ARRA Section 1603 .................................................. 46

1
INVESTMENT RISK IN THE SECOND-GENERATION BIOFUELS INDUSTRY
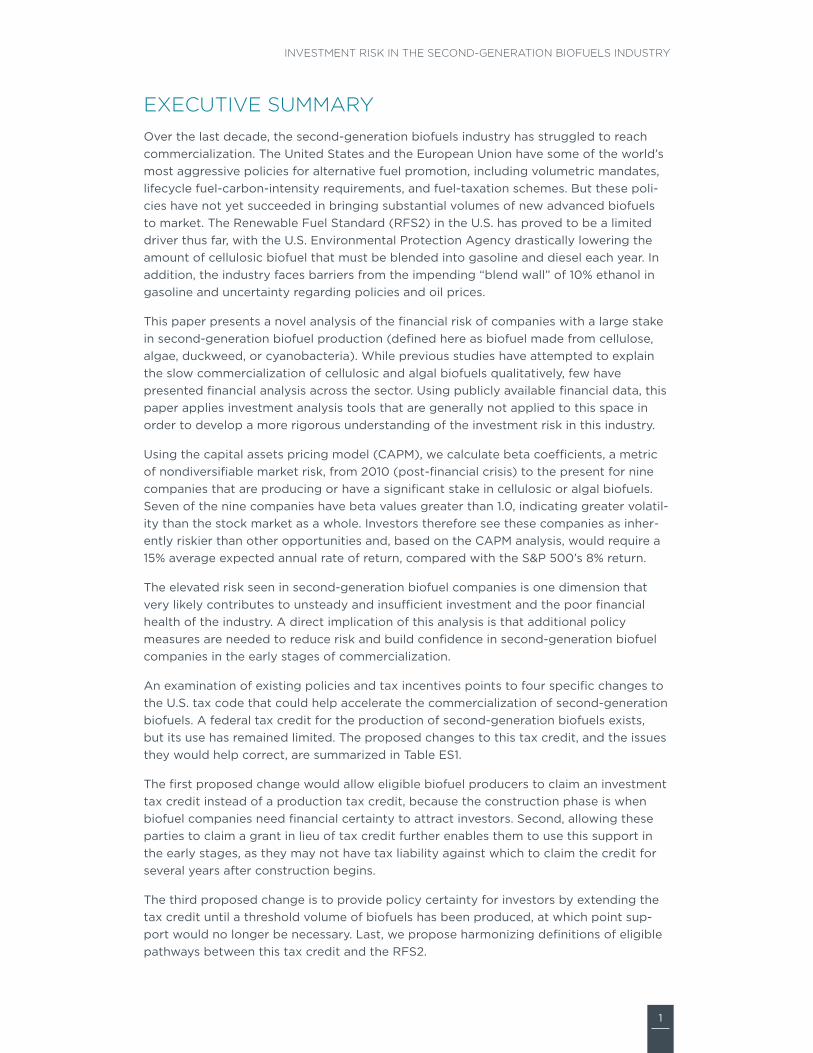
EXECUTIVE SUMMARYOver the last decade, the second-generation biofuels industry has struggled to reach commercialization. The United States and the European Union have some of the world’s most aggressive policies for alternative fuel promotion, including volumetric mandates, lifecycle fuel-carbon-intensity requirements, and fuel-taxation schemes. But these poli-cies have not yet succeeded in bringing substantial volumes of new advanced biofuels to market. The Renewable Fuel Standard (RFS2) in the U.S. has proved to be a limited driver thus far, with the U.S. Environmental Protection Agency drastically lowering the amount of cellulosic biofuel that must be blended into gasoline and diesel each year. In addition, the industry faces barriers from the impending “blend wall” of 10% ethanol in gasoline and uncertainty regarding policies and oil prices.
This paper presents a novel analysis of the financial risk of companies with a large stake in second-generation biofuel production (defined here as biofuel made from cellulose, algae, duckweed, or cyanobacteria). While previous studies have attempted to explain the slow commercialization of cellulosic and algal biofuels qualitatively, few have presented financial analysis across the sector. Using publicly available financial data, this paper applies investment analysis tools that are generally not applied to this space in order to develop a more rigorous understanding of the investment risk in this industry.
Using the capital assets pricing model (CAPM), we calculate beta coe!cients, a metric of nondiversifiable market risk, from 2010 (post-financial crisis) to the present for nine companies that are producing or have a significant stake in cellulosic or algal biofuels. Seven of the nine companies have beta values greater than 1.0, indicating greater volatil-ity than the stock market as a whole. Investors therefore see these companies as inher-ently riskier than other opportunities and, based on the CAPM analysis, would require a 15% average expected annual rate of return, compared with the S&P 500’s 8% return.
The elevated risk seen in second-generation biofuel companies is one dimension that very likely contributes to unsteady and insu!cient investment and the poor financial health of the industry. A direct implication of this analysis is that additional policy measures are needed to reduce risk and build confidence in second-generation biofuel companies in the early stages of commercialization.
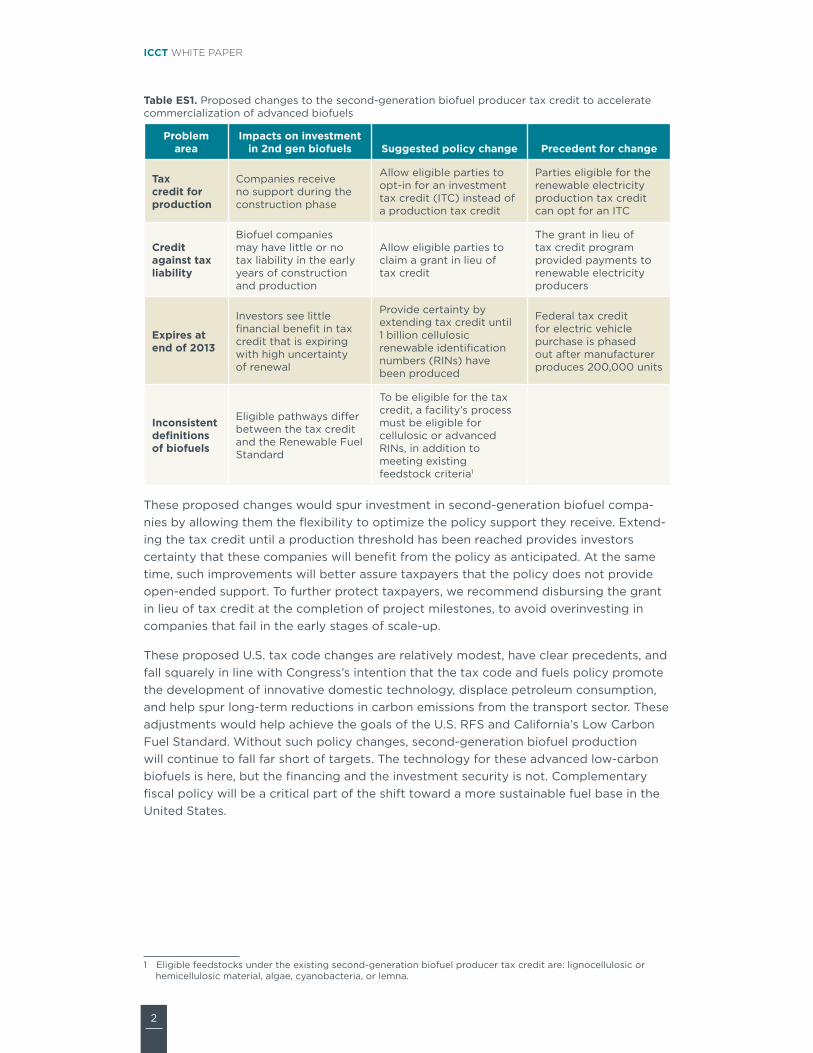
An examination of existing policies and tax incentives points to four specific changes to the U.S. tax code that could help accelerate the commercialization of second-generation biofuels. A federal tax credit for the production of second-generation biofuels exists, but its use has remained limited. The proposed changes to this tax credit, and the issues they would help correct, are summarized in Table ES1.
The first proposed change would allow eligible biofuel producers to claim an investment tax credit instead of a production tax credit, because the construction phase is when biofuel companies need financial certainty to attract investors. Second, allowing these parties to claim a grant in lieu of tax credit further enables them to use this support in the early stages, as they may not have tax liability against which to claim the credit for several years after construction begins.
The third proposed change is to provide policy certainty for investors by extending the tax credit until a threshold volume of biofuels has been produced, at which point sup-port would no longer be necessary. Last, we propose harmonizing definitions of eligible pathways between this tax credit and the RFS2.
2
ICCT WHITE PAPER
Table ES1. Proposed changes to the second-generation biofuel producer tax credit to accelerate commercialization of advanced biofuels
Problem area
Impacts on investment in 2nd gen biofuels Suggested policy change Precedent for change
Tax credit for production
Companies receive no support during the construction phase
Allow eligible parties to opt-in for an investment tax credit (ITC) instead of a production tax credit
Parties eligible for the renewable electricity production tax credit can opt for an ITC
Credit against tax liability
Biofuel companies may have little or no tax liability in the early years of construction and production
Allow eligible parties to claim a grant in lieu of tax credit
The grant in lieu of tax credit program provided payments to renewable electricity producers
Expires at end of 2013
Investors see little financial benefit in tax credit that is expiring with high uncertainty of renewal
Provide certainty by extending tax credit until 1 billion cellulosic renewable identification numbers (RINs) have been produced
Federal tax credit for electric vehicle purchase is phased out after manufacturer produces 200,000 units
Inconsistent definitions of biofuels
Eligible pathways di"er between the tax credit and the Renewable Fuel Standard
To be eligible for the tax credit, a facility’s process must be eligible for cellulosic or advanced RINs, in addition to meeting existing feedstock criteria1
These proposed changes would spur investment in second-generation biofuel compa-nies by allowing them the flexibility to optimize the policy support they receive. Extend-ing the tax credit until a production threshold has been reached provides investors certainty that these companies will benefit from the policy as anticipated. At the same time, such improvements will better assure taxpayers that the policy does not provide open-ended support. To further protect taxpayers, we recommend disbursing the grant in lieu of tax credit at the completion of project milestones, to avoid overinvesting in companies that fail in the early stages of scale-up.1
These proposed U.S. tax code changes are relatively modest, have clear precedents, and fall squarely in line with Congress’s intention that the tax code and fuels policy promote the development of innovative domestic technology, displace petroleum consumption, and help spur long-term reductions in carbon emissions from the transport sector. These adjustments would help achieve the goals of the U.S. RFS and California’s Low Carbon Fuel Standard. Without such policy changes, second-generation biofuel production will continue to fall far short of targets. The technology for these advanced low-carbon biofuels is here, but the financing and the investment security is not. Complementary fiscal policy will be a critical part of the shift toward a more sustainable fuel base in the United States.
1#Eligible feedstocks under the existing second-generation biofuel producer tax credit are: lignocellulosic or hemicellulosic material, algae, cyanobacteria, or lemna.

3
INVESTMENT RISK IN THE SECOND-GENERATION BIOFUELS INDUSTRY
INTRODUCTIONThis paper aims to assess the financial risk of second-generation biofuel companies, identify other barriers to commercialization of the industry, and suggest ways to ad-dress these issues. First, this introduction explains the Renewable Fuel Standard and outlines the current status of the industry. The next section describes existing regulatory incentives for second-generation biofuel production. This is followed by an analysis of financial volatility and risk in second-generation biofuel companies and how they and other factors may limit investment. Last, this paper presents recommendations for revising existing financial incentives to reduce financial risk and spur investment in second-generation biofuel companies, to help bring them through the valley of death and into successful and sustainable commercial operation.
THE RENEWABLE FUEL STANDARDThe Renewable Fuel Standard (RFS) supports U.S. consumption of biofuels by mandating the volume of biofuels that must be blended into transportation fuel each year from 2006 through 2022. The program was legislated by the Energy Policy Act (EPAct) of 2005 and heavily revised by the Energy Independence and Security Act (EISA) in 2007, thus becoming RFS2. The RFS2 comprises four nonexclusive submandates that are defined by feedstock and lifecycle greenhouse gas (GHG) savings compared with petroleum:
» Renewable fuels (at least 20% GHG savings)
» Advanced fuels (at least 50% GHG savings2)
» Biomass-based diesel (at least 50% GHG savings)
» Cellulosic biofuel (at least 60% GHG savings)
Volumes of these categories are mandated to increase over time to 2022, when the RFS2 targets 36 billion gallons of biofuels to be blended into transportation fuels.
Mandated volumes for all categories other than cellulosic fuel have been met every year. Cellulosic volumes have been revised downward in each year due to low availability. As illustrated in Figure 1 (EPA, 2013b) cellulosic fuel widely missed its original RFS2 target in 2012, by almost 500 million gallons, and, as Table 1 shows, even missed its dramatically reduced target by over 8 million gallons. Production of cellulosic fuel has consistently undershot the targets due to slower than expected commercialization of the industry; indeed the first cellulosic renewable identification numbers (RINs) were not issued until 2012 (Appendix A; Hart Energy, 2012).
2#Advanced biofuel cannot be ethanol made from corn starch.
4
ICCT WHITE PAPER
0
2
12
14
Cellulosic Biomass-based diesel Other Advanced Other Renewable
RFS2 requirement Production
Bill
ion
gallo
ns
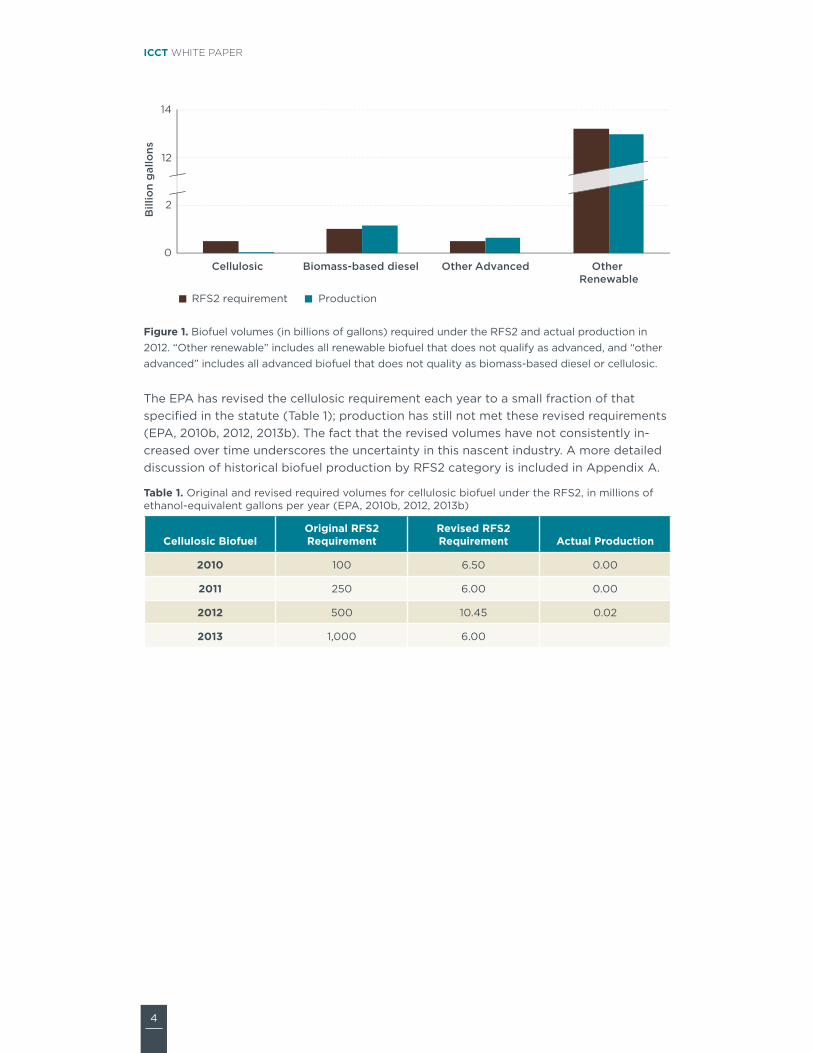
Figure 1. Biofuel volumes (in billions of gallons) required under the RFS2 and actual production in 2012. “Other renewable” includes all renewable biofuel that does not qualify as advanced, and “other advanced” includes all advanced biofuel that does not quality as biomass-based diesel or cellulosic.
The EPA has revised the cellulosic requirement each year to a small fraction of that specified in the statute (Table 1); production has still not met these revised requirements (EPA, 2010b, 2012, 2013b). The fact that the revised volumes have not consistently in-creased over time underscores the uncertainty in this nascent industry. A more detailed discussion of historical biofuel production by RFS2 category is included in Appendix A.
Table 1. Original and revised required volumes for cellulosic biofuel under the RFS2, in millions of ethanol-equivalent gallons per year (EPA, 2010b, 2012, 2013b)
Cellulosic BiofuelOriginal RFS2 Requirement
Revised RFS2 Requirement Actual Production
2010 100 6.50 0.00
2011 250 6.00 0.00
2012 500 10.45 0.02
2013 1,000 6.00

5
INVESTMENT RISK IN THE SECOND-GENERATION BIOFUELS INDUSTRY
CURRENT STATUS OF THE SECOND-GENERATION BIOFUEL INDUSTRYFor the purposes of this paper, we define “second-generation biofuels” as biofuels produced from non-food feedstocks. These include cellulosic biofuel—which can be made from crop residues, wood, grass, or any other type of plant material—and biofuels made from algae, cyanobacteria, or lemna (duckweed).
While the RFS2 called for ramping up the deployment of cellulosic fuels starting in 2010, securing financing was di!cult in the aftermath of the financial crisis. Tax equity markets (where large lending institutions finance projects in exchange for partial ownership of a company and access to tax credits) disappeared, and banks became less willing to invest in isecond-generation biofuel projects. Some second-generation biofuel plants did receive sizeable investments from venture capital firms such as Khosla Ventures and Mohr Davidow Ventures, the oil industry (Curtis, 2010), and programs created by the American Recovery and Reinvestment Act (Curtis, 2010). A number of airlines also raised the profile of algal biofuels with well-publicized demonstration flights.3 Despite these successes, the second-generation biofuel industry has encountered numerous setbacks, and many companies are still far from commercial development.
In developing innovative technologies such as second-generation biofuel production, many businesses fail as they attempt to move from R&D and demonstration to com-mercialization. This di!cult transition is often referred to as the “valley of death.” Even though many cellulosic and algal processes have been successfully demonstrated in pilot plants, few have been able to attract su!cient financing for commercial-scale facilities.
Indeed, since 2007 several cellulosic biofuel companies have struggled or foreclosed as they attempted to cross the valley of death, and several second-generation biofuel companies have lost significant value since they went public (Figure 2). For example, Range Fuels began construction of a cellulosic ethanol plant in 2007 but shut down in 2011 without having produced any fuel (Range Fuels, 2007; Carney, 2011). On April 14, 2012, KL Energy Corp. produced the first RFS2 cellulosic RINs for a batch of 20,069 gallons of ethanol made from sugarcane bagasse at a pilot facility (Hart Energy, 2012). After changing its name to Blue Sugars, however, the company filed for bankruptcy in 2013. Algal biofuels have been slow to commercialize as well; no autotrophic4 algal biofuel facilities have produced significant quantities.
At the time of this report, only two commercial-scale second-generation biofuel facility facilities exist in the United States: INEOS Bio in Florida, producing ethanol from waste (Biofuels Digest, 2013), and KiOR in Mississippi, producing drop-in gasoline, diesel, and fuel oil blendstocks from wood.
3# For example, Continental Airlines in 2009 conducted a successful test flight powered partly by fuel derived from algae and jatropha.
4# “Autotrophic” refers to plants or algae that harvest their energy from the sun. “Heterotrophic” algae harvest their energy from other plants or algae; for example, in Solazyme’s process sugar is fed to algae that then produce oils.

6
ICCT WHITE PAPER
-100% -90% -80% -70% -60% -50% -40% -30% -20% -10% 0%
Amyris (Sep 2010)
Gevo (Feb 2011)
Green Plains Renewable (Mar 2006)
Kior (Jun 2011)
Lignol (Jan 2007)
Rentech, Inc (Apr 2000)
Solazyme (May 2011)
Verenium (Feb 2000)
Change in stock price (%)
Figure 2. Change in stock price from initial public o"ering date to September 4, 2013. IPO price was not available for Rentech, Inc and Lignol; price change shown is based on oldest available closing price.
7
INVESTMENT RISK IN THE SECOND-GENERATION BIOFUELS INDUSTRY
EXISTING REGULATORY AND TAX INCENTIVES
RIN PRICINGThe RFS2 provides a form of price support and certainty through the RIN system. Biofuel producers registered with the EPA generate RINs for each gallon of fuel they produce. Obligated parties (refiners and importers of gasoline and diesel fuels) must demonstrate compliance with the RFS2 by acquiring su!cient RINs to meet their individual renewable volume obligations (RVOs). RINs remain attached to a given batch of fuel until the fuel is blended into a finished product. Upon blending, the RINs become separable and the owner of the RINs is allowed to keep them for compliance or sell them to another party. The value of the separated RINs can be considered the “core value” of the RIN. Obligated parties can meet their RFS2 mandates by purchasing and blending biofuels or by purchasing already separated RINs, and then submitting the RINs to the EPA for compliance.
Obligated parties might want to purchase and blend more biofuel than they are man-dated to use, either to sell the surplus RINs on the RIN market or to bank extra credits and thus mitigate risk of compliance in future years. There is a cap on how many RINs can be carried forward.5
Figure 3 provides a theoretical illustration of how the core value of a RIN is determined. The green line shows a hypothetical price-supply relationship for a given category of biofuel. If producers can charge a higher price, they will produce more, hence supply will increase. As the supply increases, we move along the supply curve to introduce more expensive processes, increasing price. The light blue line shows the comparable price-demand relationship. On the demand side, if the price charged to consumers increases, they will purchase less fuel, hence demand is reduced. The flip side is that as the price drops, the demand goes up. At the point where the price is such that supply matches demand, the system is in balance; this is referred to as the equilibrium price and quantity of a good.
The RFS2 is a policy intervention that changes this relationship. It mandates that a certain quantity of biofuels be used; in other words, it aims to raise demand beyond the equilibrium level supported by the market. At this quantity, there is a gap between the price at which the supplier can a"ord to sell the fuel (Ps) and what the consumer is willing to pay for it (Pd). The RIN adds value to the biofuel for the producer (forcing the consumer, the obligated party, to pay more than the value of the fuel alone) to close this price gap. Thus, as shown in Figure 3, the RIN core value is represented by Ps minus Pd.
5# The limit is 20% of the next year’s mandated volume. Obligated parties can also run a deficit, but strict limitations govern this scenario.

8
ICCT WHITE PAPER
Biofuels market with a binding mandate
Price
Quantity
RIN core value
S
D
Qe
Pd
Pe
Ps
RFS2
S = Supply curve.D = Demand curve.RFS2 = The mandated quantity.Qe = The equilibrium quantity without the mandate.Pe = The equilibrium price without the mandate. Ps = The supply price for biofuels at mandated quantity. Pd = The demand price for biofuels at mandated quantity.RIN = Renewable Identification Number.
Figure 3. How RINs support biofuel prices. Figure redrawn from McPhail, Westcott, & Lutman (2011).
In other words, when Congress created the RFS2, it expected that biofuels would be more expensive to produce than fossil fuels, and thus the targeted volumes of biofuels would not be blended for market reasons alone. The RFS2 adds value through RINs to make biofuels cost-competitive. Congress also expected that cellulosic fuels would be even more expensive to produce than other renewable fuels and thus would require a stronger policy signal to bring them to market in the desired quantities. Creating sepa-rate categories for cellulosic RINs allows the core value of the cellulosic RIN to be higher than the core values of RINs for other renewable fuels.
In principle, minimum biofuel quantities are mandated, so the RIN core value should float to the level necessary to make it economically viable to produce as much biofuel as required. The exception is the cellulosic RIN core value, which can be limited under certain circumstances (see “Cellulosic waiver credits,” below). Over the short term, insu!cient supply of RINs can cause prices to rise rapidly as obligated parties scramble for compliance; this is discussed further in the “Barriers to commercialization” section below. Prices in RIN markets may also include a speculative component, as RINs can be bought and traded for profit as well as for compliance.
RINs are di"erentiated by biofuel type in the same way as the main categories for the RFS2 mandated volumes. Table 2 defines the types of RINs that qualify under the RFS2, and the volume categories for which they qualify.
9
INVESTMENT RISK IN THE SECOND-GENERATION BIOFUELS INDUSTRY
Table 2. Renewable Identification Number (RIN) types.
RIN type Biofuel type RFS2 qualifying categories
D3 Cellulosic biofuel (�60% GHG savings) Cellulosic, Advanced or Renewable
D4 Biomass-based diesel (�50% GHG savings)
Biomass-based diesel, Advanced or Renewable
D5 Advanced biofuel (�50% GHG savings) Advanced or Renewable
D6 Renewable fuel (�20% GHG savings) Renewable fuel
D7 Cellulosic diesel (�60% GHG savings) Cellulosic biofuel or Advanced, Biomass-based diesel, or Renewable
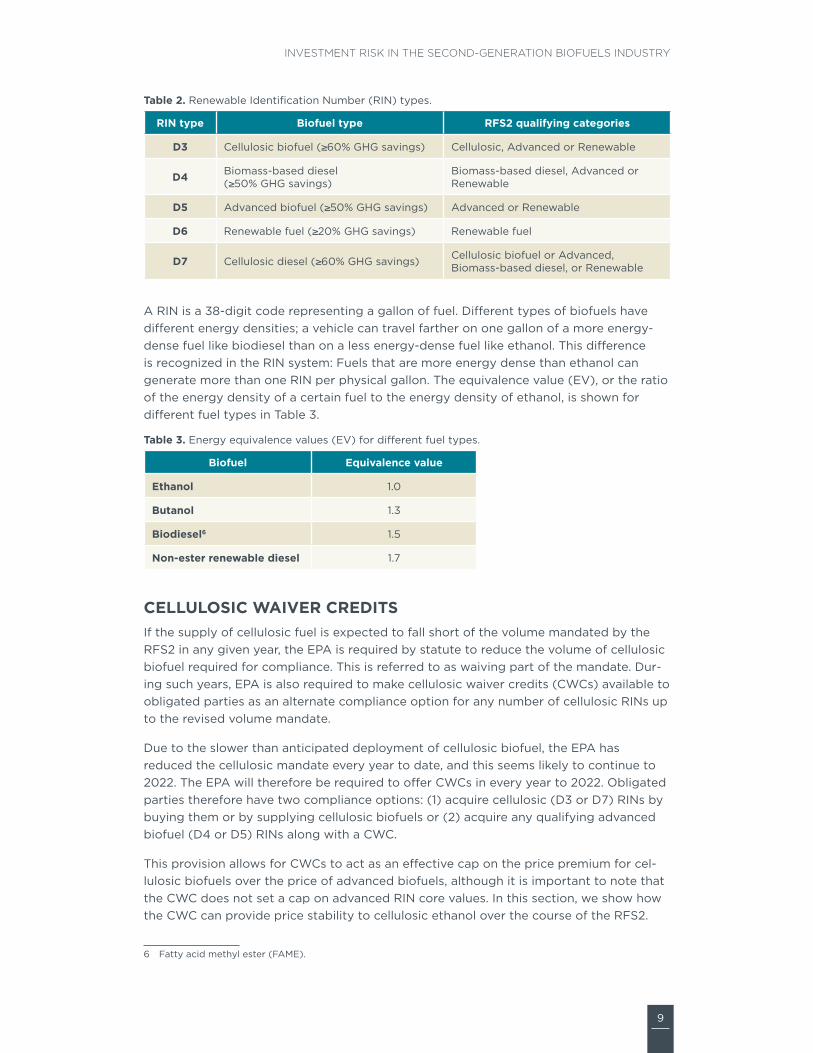
A RIN is a 38-digit code representing a gallon of fuel. Di"erent types of biofuels have di"erent energy densities; a vehicle can travel farther on one gallon of a more energy-dense fuel like biodiesel than on a less energy-dense fuel like ethanol. This di"erence is recognized in the RIN system: Fuels that are more energy dense than ethanol can generate more than one RIN per physical gallon. The equivalence value (EV), or the ratio of the energy density of a certain fuel to the energy density of ethanol, is shown for di"erent fuel types in Table 3.
Table 3. Energy equivalence values (EV) for di"erent fuel types.6
Biofuel Equivalence value
Ethanol 1.0
Butanol 1.3
Biodiesel6 1.5
Non-ester renewable diesel 1.7
CELLULOSIC WAIVER CREDITSIf the supply of cellulosic fuel is expected to fall short of the volume mandated by the RFS2 in any given year, the EPA is required by statute to reduce the volume of cellulosic biofuel required for compliance. This is referred to as waiving part of the mandate. Dur-ing such years, EPA is also required to make cellulosic waiver credits (CWCs) available to obligated parties as an alternate compliance option for any number of cellulosic RINs up to the revised volume mandate.
Due to the slower than anticipated deployment of cellulosic biofuel, the EPA has reduced the cellulosic mandate every year to date, and this seems likely to continue to 2022. The EPA will therefore be required to o"er CWCs in every year to 2022. Obligated parties therefore have two compliance options: (1) acquire cellulosic (D3 or D7) RINs by buying them or by supplying cellulosic biofuels or (2) acquire any qualifying advanced biofuel (D4 or D5) RINs along with a CWC.
This provision allows for CWCs to act as an e"ective cap on the price premium for cel-lulosic biofuels over the price of advanced biofuels, although it is important to note that the CWC does not set a cap on advanced RIN core values. In this section, we show how the CWC can provide price stability to cellulosic ethanol over the course of the RFS2.
6#Fatty acid methyl ester (FAME).
10
ICCT WHITE PAPER
Under the RFS2, the price of CWCs is determined by the following formula:
CWC = max{$3 – Pgasoline,$0.25} Equation 1
Where Pgasoline represents the wholesale price of one gallon of gasoline. In other words, the price of a CWC is inversely related to the price of gasoline until gasoline reaches $3/gallon, at which point CWCs remain at $0.25. The expected price of cellulosic biofuel can thus be expressed as
Pce = Padv + max{$3 – Pgasoline,$0.25} Equation 2
Where Pce is the price to the blender of one gallon of cellulosic biofuel and Padv that of the lowest-cost advanced biofuel.
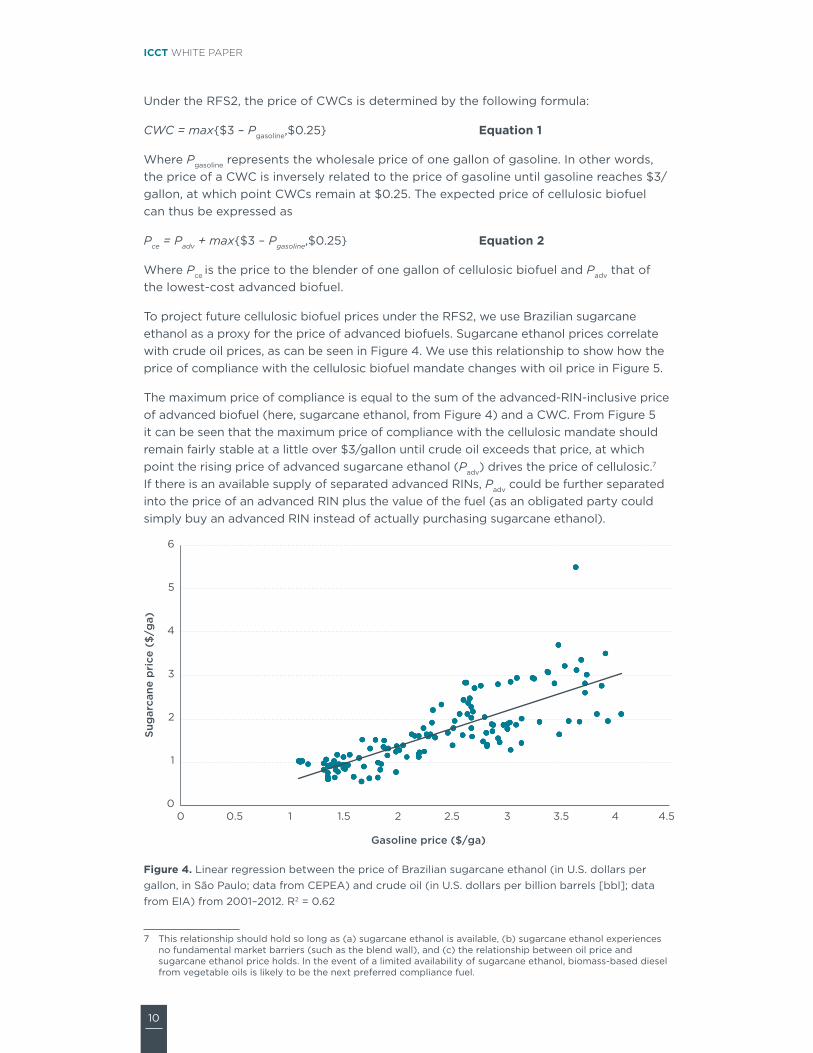
To project future cellulosic biofuel prices under the RFS2, we use Brazilian sugarcane ethanol as a proxy for the price of advanced biofuels. Sugarcane ethanol prices correlate with crude oil prices, as can be seen in Figure 4. We use this relationship to show how the price of compliance with the cellulosic biofuel mandate changes with oil price in Figure 5.
The maximum price of compliance is equal to the sum of the advanced-RIN-inclusive price of advanced biofuel (here, sugarcane ethanol, from Figure 4) and a CWC. From Figure 5 it can be seen that the maximum price of compliance with the cellulosic mandate should remain fairly stable at a little over $3/gallon until crude oil exceeds that price, at which point the rising price of advanced sugarcane ethanol (Padv) drives the price of cellulosic.7 If there is an available supply of separated advanced RINs, Padv could be further separated into the price of an advanced RIN plus the value of the fuel (as an obligated party could simply buy an advanced RIN instead of actually purchasing sugarcane ethanol).
0
1
2
3
4
5
6
0 0.5 1 1.5 2 2.5 3 3.5 4 4.5
Suga
rcan
e pr
ice
($/g
a)
Gasoline price ($/ga)
Figure 4. Linear regression between the price of Brazilian sugarcane ethanol (in U.S. dollars per gallon, in São Paulo; data from CEPEA) and crude oil (in U.S. dollars per billion barrels [bbl]; data from EIA) from 2001–2012. R2 = 0.62
7# This relationship should hold so long as (a) sugarcane ethanol is available, (b) sugarcane ethanol experiences no fundamental market barriers (such as the blend wall), and (c) the relationship between oil price and sugarcane ethanol price holds. In the event of a limited availability of sugarcane ethanol, biomass-based diesel from vegetable oils is likely to be the next preferred compliance fuel.
11
INVESTMENT RISK IN THE SECOND-GENERATION BIOFUELS INDUSTRY
0
0.5
1
1.5
2
2.5
3
3.5
4
4.5
5
1 1.5 2 2.5 3 3.5 4
Pric
e ($
/ga)
Gasoline ($/ga)
Cellulosic Waiver Credits (CWCs) Cellulosic Biofuel Brazilian Sugarcane Ethanol
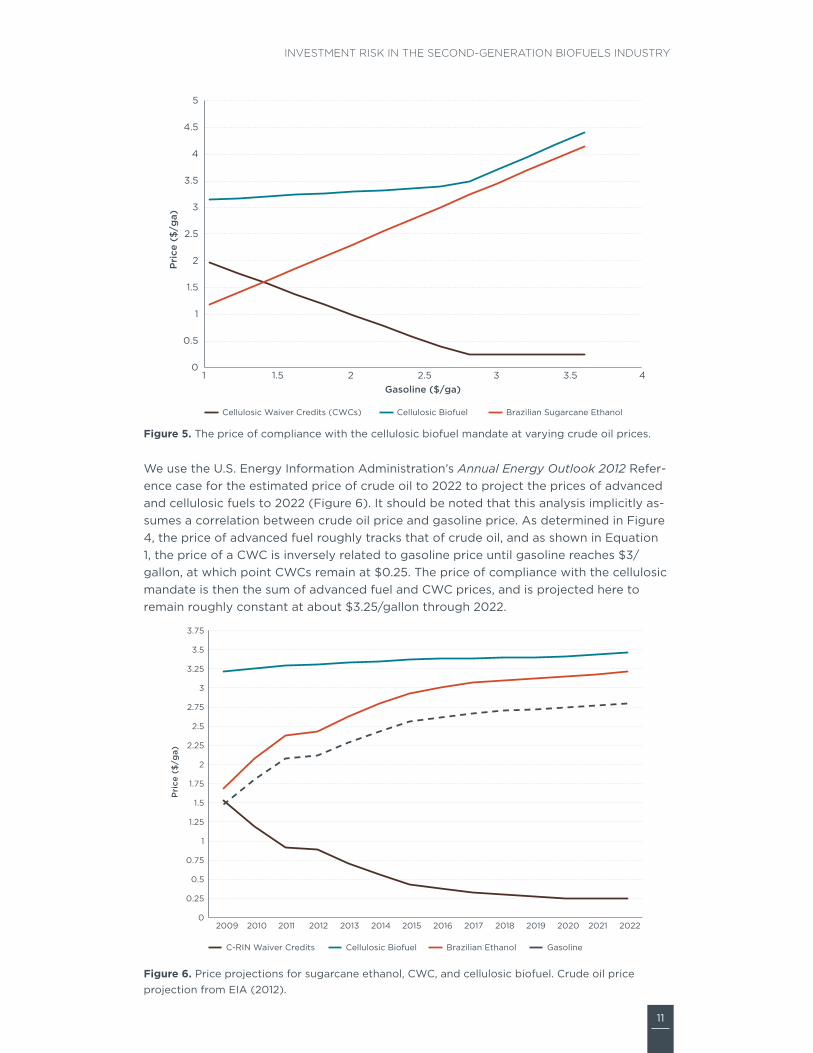
Figure 5. The price of compliance with the cellulosic biofuel mandate at varying crude oil prices.
We use the U.S. Energy Information Administration’s Annual Energy Outlook 2012 Refer-ence case for the estimated price of crude oil to 2022 to project the prices of advanced and cellulosic fuels to 2022 (Figure 6). It should be noted that this analysis implicitly as-sumes a correlation between crude oil price and gasoline price. As determined in Figure 4, the price of advanced fuel roughly tracks that of crude oil, and as shown in Equation 1, the price of a CWC is inversely related to gasoline price until gasoline reaches $3/gallon, at which point CWCs remain at $0.25. The price of compliance with the cellulosic mandate is then the sum of advanced fuel and CWC prices, and is projected here to remain roughly constant at about $3.25/gallon through 2022.
0
0.25
0.5
0.75
1
1.25
1.5
1.75
2
2.25
2.5
2.75
3
3.25
3.5
3.75
2009 2010 2011 2012 2013 2014 2015 2016 2017 2018 2019 2020 2021 2022
Pric
e ($
/ga)
C-RIN Waiver Credits Cellulosic Biofuel Brazilian Ethanol Gasoline
Figure 6. Price projections for sugarcane ethanol, CWC, and cellulosic biofuel. Crude oil price projection from EIA (2012).

12
ICCT WHITE PAPER
This means that cellulosic biofuel producers can have a degree of confidence that their product will sell competitively at $3.25 until at least 2022; if they can reliably produce biofuel for less than this price, they can expect positive revenue for several years. This price expectation should serve to lower the risk of investing in this nascent industry, but clearly to date it has not been su!cient to drive the desired level of investment. In prac-tice, it is important to note that actual cellulosic fuel and RIN prices will still be subject to some variation due to external factors including volatility in oil prices, advanced RIN supply, speculative activity and so forth.
While the design of RFS2 should provide confidence in the market value of cellulosic fuels, as the RFS2 has ramped up it has been met with a barrage of threats to repeal or reform it. The uncertainty about whether RFS2 will exist next year, and whether it will have the same value, has dampened the incentive to invest in the biofuels industry. Political uncertainty is an important reason that RIN values have not yet been e"ective at supporting the development and scale-up of new advanced biofuel pathways, and it is discussed below in the “Barriers to commercialization” section.
STATE-LEVEL REGULATORY INCENTIVES FOR BIOFUELSSome states have mandates or other incentives for consumption of biofuels beyond the RFS2. The most notable is California’s Low Carbon Fuel Standard (LCFS), which was enacted in 2007 and requires a 10% reduction in the greenhouse gas intensity of road fuel by 2020 (CARB, 2009). This standard is technology neutral: The GHG reduction of the fuel mix can be achieved with any fuels assessed by California’s Air Resources Board to have a lower GHG intensity than gasoline or diesel. California’s LCFS has survived multiple court challenges. Under the LCFS, fuels with a carbon intensity lower than gasoline or diesel are awarded credits that can be traded or used to show compliance. For example, the carbon reduction potential of one gallon of switchgrass ethanol would have been worth about $0.11 given the 2012 value of LCFS credits.8 This price support for low-carbon technologies will likely help attract investment in second-generation biofuels.
SECOND-GENERATION BIOFUEL PRODUCER TAX CREDITA second mechanism supporting the economics of cellulosic biofuel production exists in the Federal second-generation biofuel producer tax credit (26 USC §40(b)(6)). Some state-level tax incentives for biofuels exist but are not discussed here. The federal provision allows producers of second-generation biofuel who are registered with the IRS to claim a tax credit up to $1.01 per gallon. For the purposes of this tax credit, “second-generation biofuel” is defined as any liquid biofuel derived from lignocellulosic or hemicellulosic material available on a recurring basis, cultivated algae, cyanobacteria, or lemna (duckweed). If the second-generation biofuel also qualifies for alcohol fuel tax credits, the second-generation biofuel tax credit is reduced such that the sum of credits does not exceed $1.01/gallon.
Tax credits reduce the amount of taxes a producer is required to pay the IRS; they are di"erent from tax deductions, which reduce the income on which tax is calculated. But during the first few years of construction and production, cellulosic biofuel startups
8# Using the average 2012 LCFS price of $13.50 per metric ton of CO2e avoided (Yeh, Witcover, & Kessler 2013), EPA’s life cycle assessment GHG savings of 108 kgCO2e/MMBtu for switchgrass ethanol (there is no LCFS lookup value for switchgrass ethanol at this time), and a value of 21.3 MJ/L for ethanol. Note that 2013 LCFS credit prices have been rather higher, up to $65 per metric ton of CO2e in August.

13
INVESTMENT RISK IN THE SECOND-GENERATION BIOFUELS INDUSTRY
often have little or no net income or tax liability and therefore may not be able to take advantage of tax credits or deductions. While the second-generation biofuel producer tax credit can be carried forward to years when a producer does have tax liability, the credit provides little immediate benefit in the early stages when financial help is most needed. Potential financiers recognize that this tax credit does not significantly reduce the risk that a cellulosic biofuel company will fail in the first few years of production (in which case the credit value would never be realized).
The tax credit is allocable among company owners on a pro rata basis (Cornell University Law School, 2013a). Thus a biofuel company can share the tax credit with equity investors, who can claim the credit on their tax return. This may lower risk for some investors, as they are guaranteed some return (in the form of lower personal tax liability), as long as the biofuel company remains in production. But this benefit is only significant for investors holding a large share of equity, and it does not reduce the risk that a company will fail.
Finally, the future of this tax credit is highly uncertain. Originally introduced in 2009, it expired at the end of 2012 and was renewed at the last minute at the start of 2013. Thus cellulosic biofuel companies producing fuel in 2012 were eligible to claim the tax credit, but because it was set to expire at the end of the year, it did nothing to attract new investment. The tax credit is currently set to expire at the end of 2013; renewal is uncertain. Cellulosic biofuel companies therefore cannot rely on the tax credit in their financial projections, which makes it more di!cult to attract investors. In order to attract investors, a tax incentive must be reasonably expected to continue for several years.

14
ICCT WHITE PAPER
RISK ESTIMATESThe success of second-generation biofuel companies depends significantly on their ability to attract necessary financing. The sources of financing can generally be divided into two categories: debt and equity. In order to attract either type of financing, it is crucial for firms to establish sound risk-management practices. Below some di"erent types of risks and barriers to investment in the second-generation biofuel industry are presented. While systematic risk, the risk inherent in the market, cannot be avoided,9 price risk, or the risk of a decline in the value of a security or portfolio, can be minimized at a firm level through diversification.
» Firm level
» Credit (default) risk
» Price risk
» Resource availability and supply risk
» Operational risk
» Macroeconomic level
» Regulatory policy measures
» Exchange rate risk
» Interest rate risk
» Political uncertainty
The following method attempts to estimate risks and returns for investments in advanced biofuel companies, using a combination of firm-level analysis and macroeco-nomic analysis. The firm-level analysis calculates each firm’s (1) beta coe!cient based on the capital assets pricing model (CAPM) value and (2) current capital structure. In simple terms, a company’s beta coe!cient indicates the nondiversifiable market risk of its stock. The macroeconomic analysis presents economy-wide variables that have a"ected historical stock prices of these firms as well as the stock market in general, using the S&P 500 as an index.
FIRM-LEVEL ANALYSIS
Beta analysisThis analysis uses the CAPM to determine the theoretically required rate of return on second-generation biofuel stocks, based on their beta coe!cient and expected market returns. Beta is a measure of the volatility of a stock relative to the volatility of the market. A beta above 1.0 indicates a stock is more volatile than the market; a beta less than 1.0 indicates that the stock price swings less than the market. The CAPM defines the beta coe!cient as the covariance of the industry returns with the market returns, or to what degree industry and market returns are synchronized, normalized by the vari-ance of the market returns:
ћi = cov(i,market)
var(market) Equation 3
9#According to modern portfolio theory.
15
INVESTMENT RISK IN THE SECOND-GENERATION BIOFUELS INDUSTRY
Here ћi is the beta coe!cient of security i, cov(i,market) is the covariance of the returns of security i with the returns of the market, and var(market) is the variance of the market’s returns.
The beta coe!cients of U.S. advanced biofuel companies thus represent the expected changes in the rate of return of a given equity for each 1% change in the total portfolio return of the U.S. market. The value of a company with ћ = 0.8 will, on average, increase by 0.8% when the U.S. market moves up by 1%.
Investors can reduce the volatility of their portfolio by diversifying their investments; the volatility in stock prices resulting from factors unique to a given company or industry is expected to be o"set by volatility from similar sources in other stocks. The price volatil-ity that fundamentally results from broad correlation with the entire market, however, cannot be reduced by diversification, so the beta value measures the systematic risk of any given equity by its observed exposure to the market as a whole.
Investors require di"erent rates of return for di"erent investments, depending on the risk involved in each. For established industries that have well-distributed investment information and su!cient price history, the required rate of return for a given equity can be expressed with the CAPM as a linear function of the risk-free rate, the equity’s beta value, and the risk premium (the additional return over the risk-free rate that is o"ered by the market). The required rate of return using the CAPM is expressed as follows:
ri = rf + ћi (rm - rf) Equation 4
Here ri is the required rate of return on security i, rf is the risk-free rate on government debt, ћi is the beta of security i, and rm is the expected future return of the market. The CAPM expected returns for each equity in Table 4 are calculated using a risk-free rate (rf) of 1.9% and expected future market returns (rm) of 8%. The CAPM required rates of return are estimates of how each stock should generally perform, given the beta value of each stock and assuming that the market will perform according to the expected rate.
A fundamental challenge to the use of the CAPM in evaluating the prospects of advanced biofuel companies is that beta coe!cients are not directly comparable when calculated based on price histories of varying lengths. For example, the beta of compa-nies that went public recently, such as Solazyme (ticker: SZYM) and KiOR (ticker: KIOR), with only two years of stock prices, may reflect recent market conditions better than a beta based on 10 years of stock prices, such as Verenium’s (ticker: VRNM).
In order to overcome this challenge, the beta coe!cients shown in Table 4 have been calculated based on historical prices for the three years starting January 1, 2010. This time frame is a strategic choice because it renders the most up-to-date trends while filtering out extremities—including the impact of the 2008 financial crisis—that may obfuscate the results, while retaining common uncertainty and volatility in the market. Furthermore, the Renewable Fuel Standard, enacted under EPAct in 2005 and expanded under EISA in 2007, encouraged a number of advanced biofuel companies to launch their IPOs at that time. The analysis captures the latest performance of these firms, after their stock prices stabilized following their IPOs.
Because this analysis is based on a company’s value in the stock market, the selection of companies reported here was constrained to those that are publicly traded. Relatively few companies that only produce cellulosic or algal biofuel are traded on the stock

16
ICCT WHITE PAPER
market (such as KiOR). Therefore we included companies (such as Solazyme) that produce or are developing second-generation biofuels but also sell other products, and first-generation biofuel companies with a large stake in a second-generation project (for example, Green Plains Renewable Energy produces corn ethanol and partially owns BioProcess Algae). Verenium sells enzymes for cellulosic biofuel production and once opened a cellulosic biofuel production facility that later failed; it is included here due to its close connection to second-generation biofuel production.
Table 4 lists the rate of return these advanced biofuel companies must o"er in order to attract investments. The calculations show that the CAPM return for these companies averages 15% (the range is from -4% to 27%). All of the publicly traded advanced biofuel companies except KiOR have beta coe!cients larger than 1, which suggests that these companies’ stock prices are more volatile than the market, on average. High beta values, up to 4 in the case of these second-generation biofuel companies, indicate substantially higher volatility and risk than most industries.
Table 4. Beta coe!cients and expected return on investment for second-generation biofuel companies.
Company Ticker Symbol Beta Required Return
Amyris AMRS 1.4 10.60%
Gevo GEVO 4.1 26.70%
Green Plains Renewable Energy GPRE 1.3 9.60%
KiOR KIOR -0.9 -3.60%
Lignol Energy Corp. LEC.V 1.4 10.30%
Pacific Ethanol PEIX 3.2 21.20%
Rentech Inc. RTK 3.4 22.70%
Solazyme SZYM 2.4 16.50%
Verenium VRNM 0.6 5.60%
KiOR’s negative beta indicates an inverse relationship to market volatility. However, given the limited data associated with KiOR’s stock value, the root cause of this inverse relationship is di!cult to ascertain. At this time, the true risk associated with KiOR may not be well represented by volatility in stock price, because the company’s price history covers the same period as its commercial facility expansion.10 This makes the stock price particularly sensitive to the phase of the expansion rather than the overall market performance. During its IPO phase, KiOR aggressively issued shares to expand its commercial production facility by the first quarter of 2011, and it received financial support from the state of Mississippi and was o"ered additional support from the U.S. Department of Energy.11 With this support, investor expectations were high. Despite this financial support, however, KiOR continuously recorded negative retained earnings. This can be seen in the loss of KiOR’s equity volume from 2011 to 2012 while KiOR resorted to more debt financing. It is possible that investors lost confidence as a result of these negative retained earnings values and pulled out of their stock investments.
10 KiOR’s IPO registration was in April 2011 and its price history is available starting June 2011.11# KiOR received its term sheet for the DOE Loan Guarantee Program but ultimately did not take advantage of
this financing. http://investor.kior.com/releasedetail.cfm?ReleaseID=586362

17
INVESTMENT RISK IN THE SECOND-GENERATION BIOFUELS INDUSTRY
Another challenge to accurate assessment of risks and returns stems from short stock price histories from the advanced biofuel companies, many of which recently launched their IPOs. For example, Gevo (ticker: GEVO), KiOR, and Solazyme have stock price history only since 2011; Aymris (ticker: AMRS) has data dating back to September 2010. Due to the limited number of observations that exist for these companies, this analysis introduces beta values calculated based on weekly price intervals to compare with the original betas based on monthly intervals.
Although the primary reason for introducing the new sampling interval is to compen-sate for the lack of available data, this analysis is more e"ective using weekly intervals compared to daily sampling intervals. Daily intervals will yield the highest number of observations for firms with short price histories, but they may result in a downward bias in betas estimated for low trade volumes. This bias is particularly noteworthy for the firms mentioned above because they lack established trading practices and thus experience days without active trading. Moreover, Fama famously claims that the power of macroeconomic variables in explaining stock prices increases with the length of the observed time period. Fama’s model shows that the proportion of the variation in returns due to information about production is captured better when longer horizon returns are regressed on future production growth rates (Fama, 1990). Thus beta analysis usually depends on monthly intervals despite the lower number of observations compared with weekly intervals. The use of weekly intervals reduces the bias shown in daily intervals, but similar sources of bias may appear if there are many noise traders, who trade stocks for nonfundamental reasons, or other anomalies such as infrequent trading. When used discretely, however, weekly intervals can provide valuable insights, as in Figure 7.
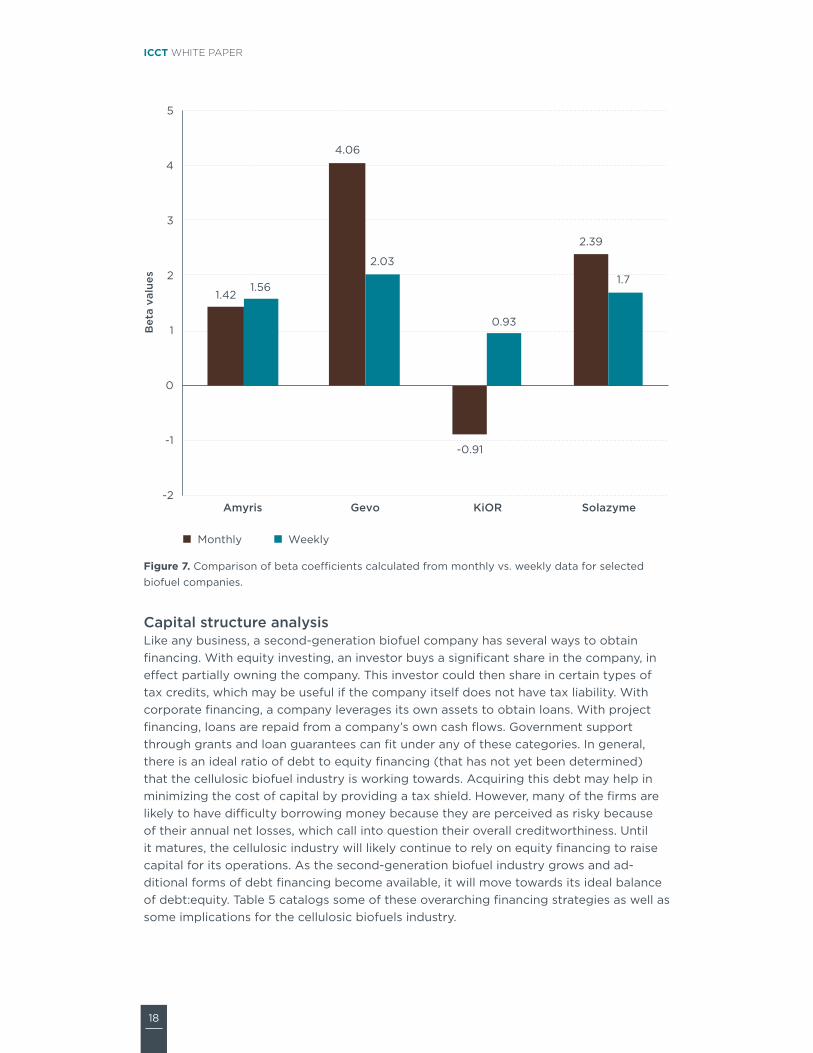
Figure 7 compares the beta values of the selected firms with relatively short price histories, indicating beta values calculated at monthly and weekly intervals. If the nontrading bias holds, the weekly betas must yield lower values compared with the monthly betas, as in the cases of Solazyme and Gevo. Two of these companies, how-ever, display weekly betas greater than monthly betas. Amyris has a slightly greater weekly beta.
KiOR is a unique case. When monthly intervals are assessed, KiOR moves inversely to the market, but the beta assessed with weekly intervals indicates that KIOR moves in the same direction as the market. The CAPM estimates returns in terms of changes in opening and closing prices, but it does not include incidents in between. The case of KiOR shows that the weekly beta is able to capture what was missed by the monthly beta, as its volatility pattern changes as the interval becomes longer than a week.
18
ICCT WHITE PAPER
1.42
4.06
-0.91
2.39
1.56
2.03
0.93
1.7
-2
-1
0
1
2
3
4
5
Amyris Gevo KiOR Solazyme
Bet
a va
lues
Monthly Weekly
Figure 7. Comparison of beta coe!cients calculated from monthly vs. weekly data for selected biofuel companies.
Capital structure analysisLike any business, a second-generation biofuel company has several ways to obtain financing. With equity investing, an investor buys a significant share in the company, in e"ect partially owning the company. This investor could then share in certain types of tax credits, which may be useful if the company itself does not have tax liability. With corporate financing, a company leverages its own assets to obtain loans. With project financing, loans are repaid from a company’s own cash flows. Government support through grants and loan guarantees can fit under any of these categories. In general, there is an ideal ratio of debt to equity financing (that has not yet been determined) that the cellulosic biofuel industry is working towards. Acquiring this debt may help in minimizing the cost of capital by providing a tax shield. However, many of the firms are likely to have di!culty borrowing money because they are perceived as risky because of their annual net losses, which call into question their overall creditworthiness. Until it matures, the cellulosic industry will likely continue to rely on equity financing to raise capital for its operations. As the second-generation biofuel industry grows and ad-ditional forms of debt financing become available, it will move towards its ideal balance of debt:equity. Table 5 catalogs some of these overarching financing strategies as well as some implications for the cellulosic biofuels industry.
19
INVESTMENT RISK IN THE SECOND-GENERATION BIOFUELS INDUSTRY
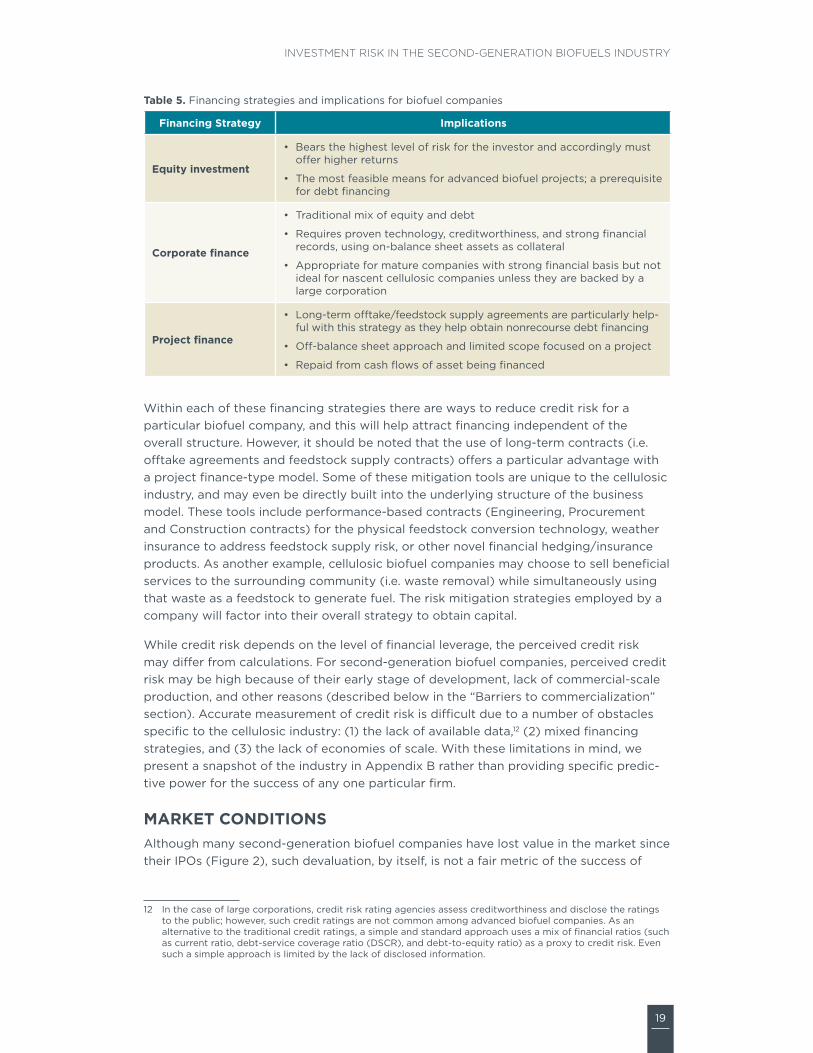
Table 5. Financing strategies and implications for biofuel companies
Financing Strategy Implications
Equity investment
• Bears the highest level of risk for the investor and accordingly must o"er higher returns
• The most feasible means for advanced biofuel projects; a prerequisite for debt financing
Corporate finance
• Traditional mix of equity and debt
• Requires proven technology, creditworthiness, and strong financial records, using on-balance sheet assets as collateral
• Appropriate for mature companies with strong financial basis but not ideal for nascent cellulosic companies unless they are backed by a large corporation
Project finance
• Long-term o"take/feedstock supply agreements are particularly help-ful with this strategy as they help obtain nonrecourse debt financing
• O"-balance sheet approach and limited scope focused on a project
• Repaid from cash flows of asset being financed
Within each of these financing strategies there are ways to reduce credit risk for a particular biofuel company, and this will help attract financing independent of the overall structure. However, it should be noted that the use of long-term contracts (i.e. o"take agreements and feedstock supply contracts) o"ers a particular advantage with a project finance-type model. Some of these mitigation tools are unique to the cellulosic industry, and may even be directly built into the underlying structure of the business model. These tools include performance-based contracts (Engineering, Procurement and Construction contracts) for the physical feedstock conversion technology, weather insurance to address feedstock supply risk, or other novel financial hedging/insurance products. As another example, cellulosic biofuel companies may choose to sell beneficial services to the surrounding community (i.e. waste removal) while simultaneously using that waste as a feedstock to generate fuel. The risk mitigation strategies employed by a company will factor into their overall strategy to obtain capital.
While credit risk depends on the level of financial leverage, the perceived credit risk may di"er from calculations. For second-generation biofuel companies, perceived credit risk may be high because of their early stage of development, lack of commercial-scale production, and other reasons (described below in the “Barriers to commercialization” section). Accurate measurement of credit risk is di!cult due to a number of obstacles specific to the cellulosic industry: (1) the lack of available data,12 (2) mixed financing strategies, and (3) the lack of economies of scale. With these limitations in mind, we present a snapshot of the industry in Appendix B rather than providing specific predic-tive power for the success of any one particular firm.
MARKET CONDITIONSAlthough many second-generation biofuel companies have lost value in the market since their IPOs (Figure 2), such devaluation, by itself, is not a fair metric of the success of
12# In the case of large corporations, credit risk rating agencies assess creditworthiness and disclose the ratings to the public; however, such credit ratings are not common among advanced biofuel companies. As an alternative to the traditional credit ratings, a simple and standard approach uses a mix of financial ratios (such as current ratio, debt-service coverage ratio (DSCR), and debt-to-equity ratio) as a proxy to credit risk. Even such a simple approach is limited by the lack of disclosed information.
20
ICCT WHITE PAPER
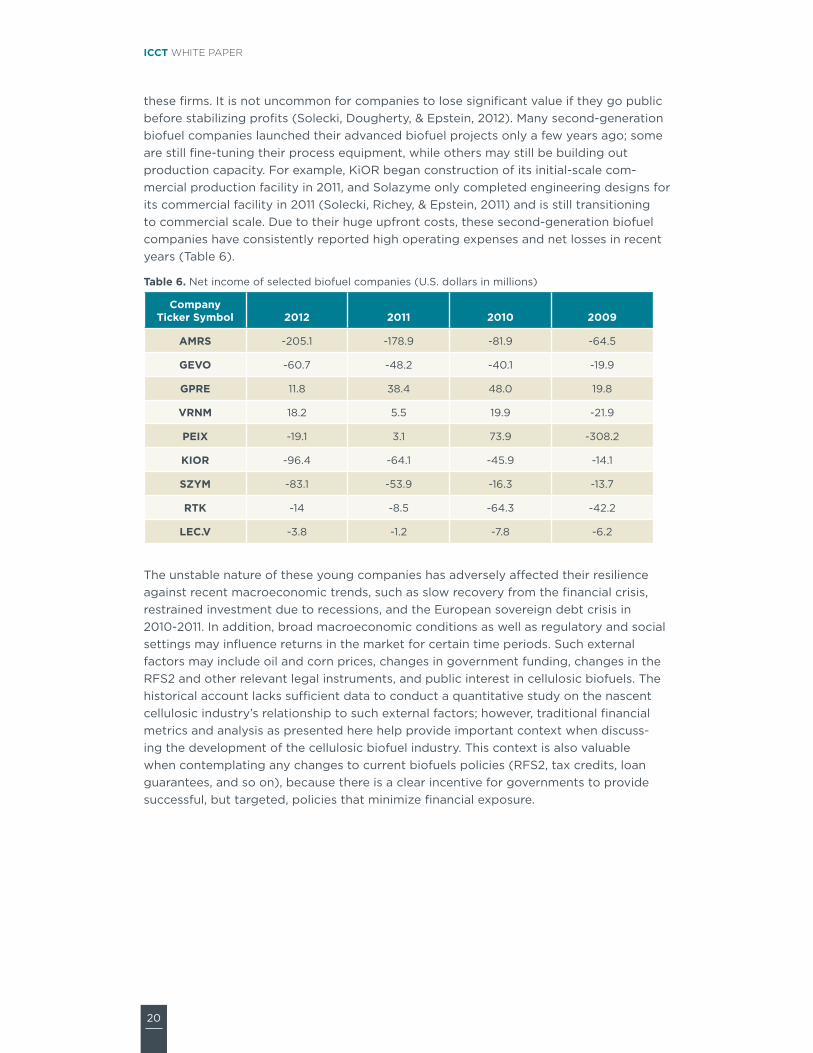
these firms. It is not uncommon for companies to lose significant value if they go public before stabilizing profits (Solecki, Dougherty, & Epstein, 2012). Many second-generation biofuel companies launched their advanced biofuel projects only a few years ago; some are still fine-tuning their process equipment, while others may still be building out production capacity. For example, KiOR began construction of its initial-scale com-mercial production facility in 2011, and Solazyme only completed engineering designs for its commercial facility in 2011 (Solecki, Richey, & Epstein, 2011) and is still transitioning to commercial scale. Due to their huge upfront costs, these second-generation biofuel companies have consistently reported high operating expenses and net losses in recent years (Table 6).
Table 6. Net income of selected biofuel companies (U.S. dollars in millions)
Company Ticker Symbol 2012 2011 2010 2009
AMRS -205.1 -178.9 -81.9 -64.5
GEVO -60.7 -48.2 -40.1 -19.9
GPRE 11.8 38.4 48.0 19.8
VRNM 18.2 5.5 19.9 -21.9
PEIX -19.1 3.1 73.9 -308.2
KIOR -96.4 -64.1 -45.9 -14.1
SZYM -83.1 -53.9 -16.3 -13.7
RTK -14 -8.5 -64.3 -42.2
LEC.V -3.8 -1.2 -7.8 -6.2
The unstable nature of these young companies has adversely a"ected their resilience against recent macroeconomic trends, such as slow recovery from the financial crisis, restrained investment due to recessions, and the European sovereign debt crisis in 2010-2011. In addition, broad macroeconomic conditions as well as regulatory and social settings may influence returns in the market for certain time periods. Such external factors may include oil and corn prices, changes in government funding, changes in the RFS2 and other relevant legal instruments, and public interest in cellulosic biofuels. The historical account lacks su!cient data to conduct a quantitative study on the nascent cellulosic industry’s relationship to such external factors; however, traditional financial metrics and analysis as presented here help provide important context when discuss-ing the development of the cellulosic biofuel industry. This context is also valuable when contemplating any changes to current biofuels policies (RFS2, tax credits, loan guarantees, and so on), because there is a clear incentive for governments to provide successful, but targeted, policies that minimize financial exposure.

21
INVESTMENT RISK IN THE SECOND-GENERATION BIOFUELS INDUSTRY
BARRIERS TO COMMERCIALIZATIONThe reasons for setbacks in commercialization of the advanced biofuel industry are complex and in many cases specific to a company; however, some common barriers contribute to the risk profile of these companies.
BLEND WALLVehicle engines manufactured to run on gasoline can accept some ethanol, but the percentage is limited. Similarly, diesel engines can burn a small fraction of biodiesel. Prior to 2010, the allowed percentages in the U.S. were 10% ethanol in gasoline (EPA, 2010a) and 5% biodiesel in diesel13 (DieselNet, 2013). This maximum blend of biofuel is referred to as the “blend wall.” Once all gasoline in the U.S. is 10% ethanol (E10), any additional gallons of ethanol produced cannot be readily consumed without introducing new vehicles to the fleet or amending existing standards.
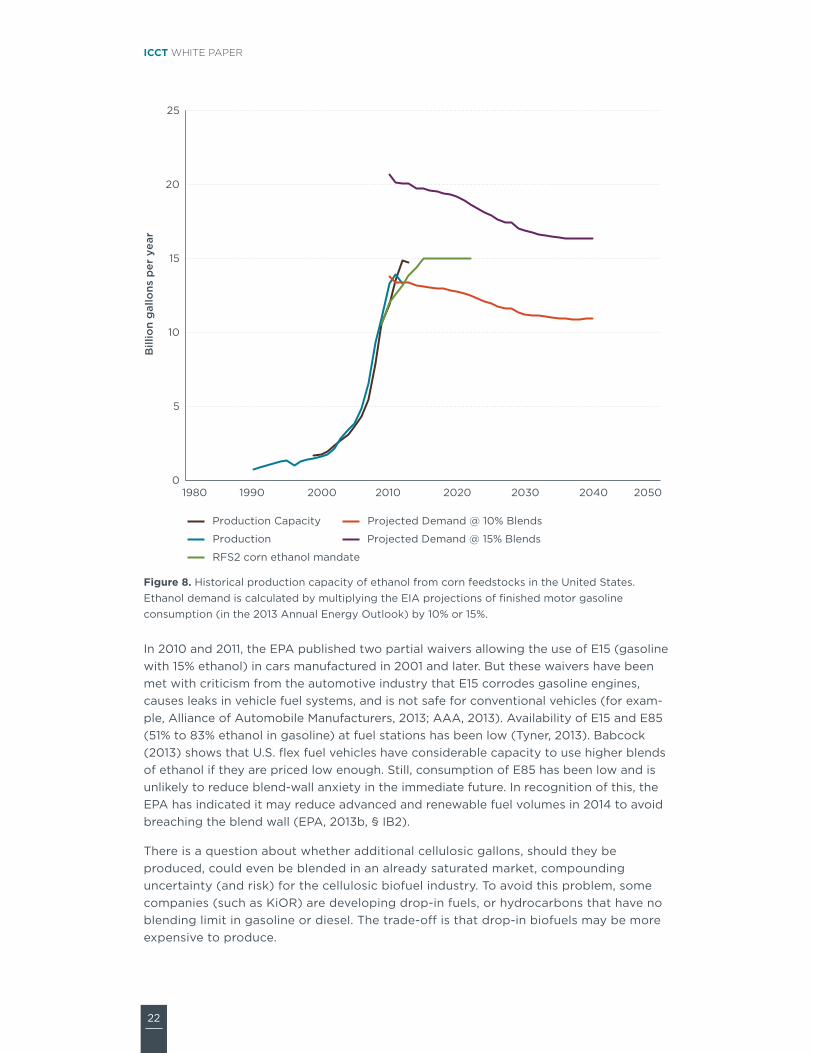
When Congress created the RFS2 in 2007, it anticipated the mandated volumes of etha-nol could readily be absorbed in the increasing U.S. consumption of gasoline for several years, and/or a significant portion of the RFS2 would be met with drop-in fuels. In response, the corn ethanol industry rapidly expanded. Since then, the EPA finalized the new Corporate Average Fuel Economy (CAFE) standards,14 which require new vehicles to be increasingly energy e!cient over time. Resulting fuel e!ciency improvements in new cars, combined with a decline in vehicle miles traveled since 2007, has lowered gasoline consumption in the U.S. and accelerated the onset of the ethanol blend wall. While biodiesel still represents only about 1% of diesel on average, the ethanol blend wall was e"ectively reached this year. Figure 8 shows that in the United States, ethanol production capacity is currently higher than demand for ethanol at a 10% gasoline blend. According to the EPA, the U.S. gasoline pool must be at least 9.7% ethanol on average in 2013 (EPA, 2013b), and we can see that the ethanol mandate is expected to exceed E10 demand in future years (Figure 8).
13#5% is still the biodiesel blend limit allowed in unlabeled diesel fuel.14#http://www.nhtsa.gov/fuel-economy/
22
ICCT WHITE PAPER
0
5
10
15
20
25
1980 1990 2000 2010 2020 2030 2040 2050
Bill
ion
gallo
ns p
er y
ear
Production Capacity
Production
Projected Demand @ 10% Blends
Projected Demand @ 15% Blends
RFS2 corn ethanol mandate
Figure 8. Historical production capacity of ethanol from corn feedstocks in the United States. Ethanol demand is calculated by multiplying the EIA projections of finished motor gasoline consumption (in the 2013 Annual Energy Outlook) by 10% or 15%.
In 2010 and 2011, the EPA published two partial waivers allowing the use of E15 (gasoline with 15% ethanol) in cars manufactured in 2001 and later. But these waivers have been met with criticism from the automotive industry that E15 corrodes gasoline engines, causes leaks in vehicle fuel systems, and is not safe for conventional vehicles (for exam-ple, Alliance of Automobile Manufacturers, 2013; AAA, 2013). Availability of E15 and E85 (51% to 83% ethanol in gasoline) at fuel stations has been low (Tyner, 2013). Babcock (2013) shows that U.S. flex fuel vehicles have considerable capacity to use higher blends of ethanol if they are priced low enough. Still, consumption of E85 has been low and is unlikely to reduce blend-wall anxiety in the immediate future. In recognition of this, the EPA has indicated it may reduce advanced and renewable fuel volumes in 2014 to avoid breaching the blend wall (EPA, 2013b, § IB2).
There is a question about whether additional cellulosic gallons, should they be produced, could even be blended in an already saturated market, compounding uncertainty (and risk) for the cellulosic biofuel industry. To avoid this problem, some companies (such as KiOR) are developing drop-in fuels, or hydrocarbons that have no blending limit in gasoline or diesel. The trade-o" is that drop-in biofuels may be more expensive to produce.
23
INVESTMENT RISK IN THE SECOND-GENERATION BIOFUELS INDUSTRY
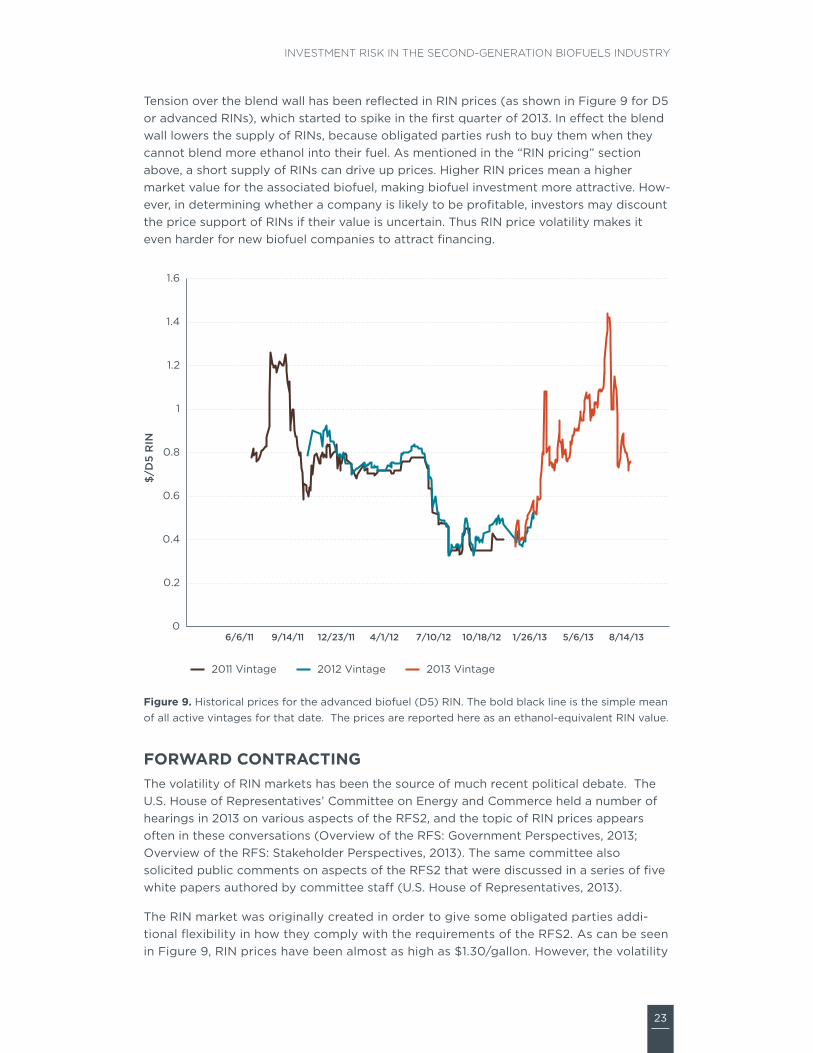
Tension over the blend wall has been reflected in RIN prices (as shown in Figure 9 for D5 or advanced RINs), which started to spike in the first quarter of 2013. In e"ect the blend wall lowers the supply of RINs, because obligated parties rush to buy them when they cannot blend more ethanol into their fuel. As mentioned in the “RIN pricing” section above, a short supply of RINs can drive up prices. Higher RIN prices mean a higher market value for the associated biofuel, making biofuel investment more attractive. How-ever, in determining whether a company is likely to be profitable, investors may discount the price support of RINs if their value is uncertain. Thus RIN price volatility makes it even harder for new biofuel companies to attract financing.
0
0.2
0.4
0.6
0.8
1
1.2
1.4
1.6
6/6/11 9/14/11 12/23/11 4/1/12 7/10/12 10/18/12 1/26/13 5/6/13 8/14/13
$/D
5 R
IN
2011 Vintage 2012 Vintage 2013 Vintage
Figure 9. Historical prices for the advanced biofuel (D5) RIN. The bold black line is the simple mean of all active vintages for that date. The prices are reported here as an ethanol-equivalent RIN value.
FORWARD CONTRACTINGThe volatility of RIN markets has been the source of much recent political debate. The U.S. House of Representatives’ Committee on Energy and Commerce held a number of hearings in 2013 on various aspects of the RFS2, and the topic of RIN prices appears often in these conversations (Overview of the RFS: Government Perspectives, 2013; Overview of the RFS: Stakeholder Perspectives, 2013). The same committee also solicited public comments on aspects of the RFS2 that were discussed in a series of five white papers authored by committee sta" (U.S. House of Representatives, 2013).
The RIN market was originally created in order to give some obligated parties addi-tional flexibility in how they comply with the requirements of the RFS2. As can be seen in Figure 9, RIN prices have been almost as high as $1.30/gallon. However, the volatility

24
ICCT WHITE PAPER
in the market makes this source of revenue unreliable. This price volatility means that if a biofuel producer were seeking new project financing, the revenue stream from RINs would be heavily discounted, perhaps by 50% or more15. In order to manage some of the market risks associated with RINs, the Chicago Mercantile Exchange (CME) and the IntercontinentalExchange (ICE) have created forward contracts for RINs.16 A summary of the key contract details is provided in Table 7.
Table 7. Standardized forward contract details
Contract Detail CME Group ICE Futures
Launch May 13, 2013 April 29, 2013
Settlement Financial (cash) Financial (cash)
Contract size 50,000 RINs 10,000 RINs
Floating price Argus RIN index Platts RIN index
Floating price methodology
Argus (volume-weighted price): D6 RINs reflect the price per RIN from typical trade volumes of 1,000,000 RINs.
D4 RINs reflect the price per RIN from typical trade volumes of 250,000 RINs.
D5 RINs reflect the price per RIN from typical trade volumes of 100,000 RINs.
Platts: (volume-weighted price): D6 RINs reflect the price per RIN from typical trade volumes of 500,000 RINs.
D4 RINs reflect the price per RIN from typical trade volumes of 250,000 RINs.
D5 RINs reflect the price per RIN from typical trade volumes of 100,000 RINs.
At the time of this report, trading of these futures contracts has been light,17 but as these markets develop, the use of futures contracts could be a valuable tool to help reduce some of the volatility in the spot market for RINs. If spot markets for RINs become less volatile, RINs might not be so heavily discounted when companies apply for debt financing.
As a general rule, three conditions must exist in a spot market to incentivize active trading in futures:
1. Commercial buyers and sellers of the commodity must see a need for hedging (in other words, they must be willing to substitute future contracts for contracts signed on the spot market).
2. A workable infrastructure to grade, transport, and distribute the commodity being traded must exist. Delivery terms, months, and locations must all closely conform to commercial movement of the commodity. If any of these elements are missing or weak, a futures market may not function e!ciently, or at all.
3. The spot market must be large enough, meaning that su!cient money is involved in trading a particular commodity and a broad class of buyers and sellers is active in trading. The involvement of many traders keeps the contract terms under continuous surveillance, which keeps the market honest.
15#According to personal correspondence with Tim Zenk, Vice President of corporate a"airs, Sapphire Energy.16#These forward contracts are financially settled only; they do not involve physical trading of RINs.17# First trade with the ICE was on May 7, 2013, for 10,000 D5 (advanced biofuel) RINs at $0.88/RIN (http://
www.reuters.com/article/2013/05/07/ice-rin-first-trade-idUSL2N0DO2BR20130507). The first trade with the CME was on May 17, 2013, for 50,000 D6 (renewable fuel) RINs at $0.80/RIN (http://www.reuters.com/article/2013/05/17/cme-rins-trade-idUSL2N0DY1NX20130517).

25
INVESTMENT RISK IN THE SECOND-GENERATION BIOFUELS INDUSTRY
On the surface, all three conditions seem to be met for an active RIN futures market, with the possible exception of su!cient size and trading volume. Estimates of the size of the RIN market reveal that it could be a $16 billion18 market in 2013; this should grow as more biofuels are required to be blended with petroleum fuels. While this may appear to be a large market, when compared with petroleum-based fuels this market is only a fraction of the size. Even when compared with ethanol markets, the market for RINs may still be considered small. However, the economics of the blend wall may move the RIN market toward adoption of futures contracts to mitigate certain financial risks.
OIL PRICESAn additional market barrier for cellulosic biofuels originates from uncertainty and volatil-ity in oil prices. Because petroleum-derived fuels and biofuels are substitutable to some extent (at low blend levels), oil markets and biofuels markets are intimately linked, and volatility in one market creates a moving target for price competitiveness in the other.
POLITICAL UNCERTAINTY As alluded to throughout this paper, the political landscape for renewable fuels can change quickly. This uncertainty includes direct attacks on the RFS2, uncertain renewal of tax incentives, and questions about implementation of the RFS2.
The conversation about the blend wall and high RIN prices during the Subcommittee on Energy and Power hearings led a number of lawmakers to propose changes to the basic structure of the RFS2, while other lawmakers have proposed that the RFS2 be eliminated entirely. Table 8 lists the relevant bills introduced in the 113th Congress:
Table 8. Bills to amend or appeal the RFS during the 113th Congress
Bill Number Title Sponsor
S. 1195 Renewable Fuel Standard Repeal Act Sen. Barrasso (R-WY)
H.R. 1482 Renewable Fuel Standard Amendments Act Rep. Womack (R-AR)
H.R. 1461 Renewable Fuel Standard Elimination Act Rep. Goodlatte (R-VA)
S. 977 Foreign Fuels Reduction Act Sen. Corker (R-TN)
In addition, a number of other bills were introduced in the 112th Congress, but they are no longer under active consideration by lawmakers. Despite the numerous attempts to repeal or modify the RFS2, it is still active law and therefore must be complied with. However, the attempts to reform the RFS2 have the indirect e"ect of eroding market confidence for all fuels that fall under the standard. The e"ect is particularly strong for companies that invest in second-generation fuels (cellulosic and other advanced fuels). These second-generation plants rely heavily on market confidence to access and reduce the price of debt financing for plant expansions as they move to commercialize their technologies.
A number of other policies work with the RFS2 to incentivize the production of biofuels. Specifically, a complicated system of tax incentives for alcohol fuels, biodiesels, and so
18# This assumes a RIN value of $1/RIN and a yearly requirement of 16.55 billion RINs.
26
ICCT WHITE PAPER
forth helps drive down the expenses of biofuel producers or otherwise incentivize the use of these alternative fuels (see the “Second-generation biofuel producer tax credit” section above). These tax incentives, while helpful to the industry, have introduced another dimension of political risk.
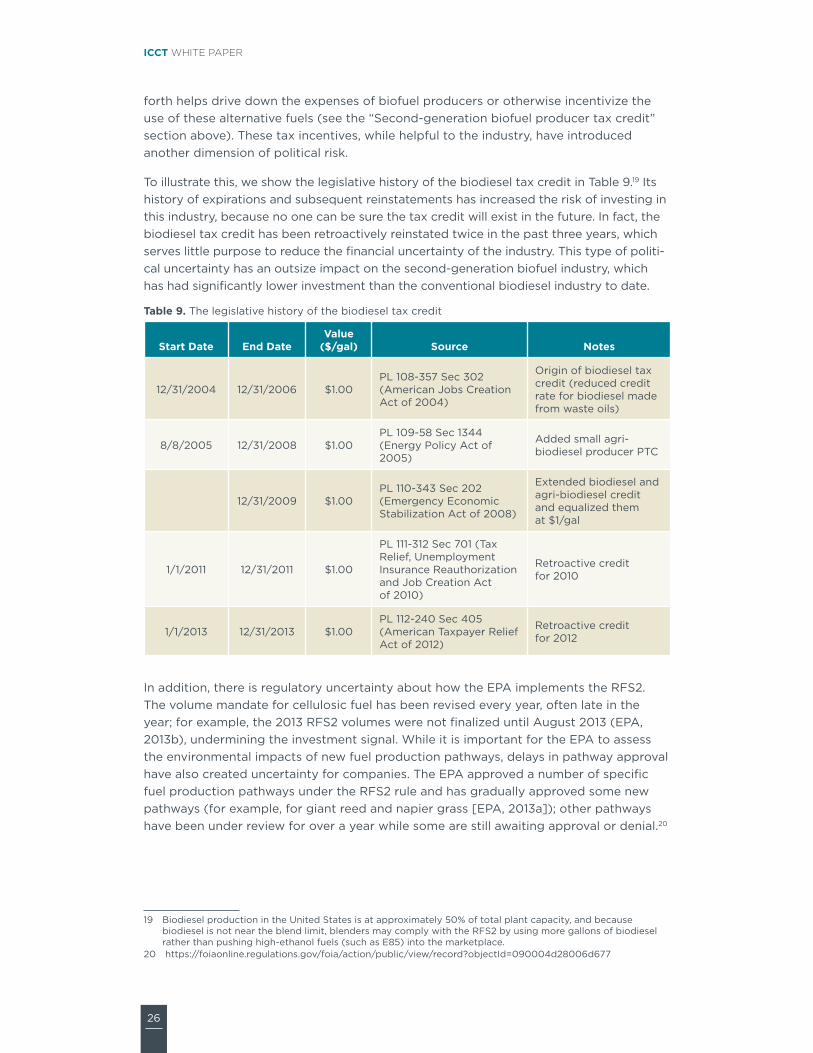
To illustrate this, we show the legislative history of the biodiesel tax credit in Table 9.19 Its history of expirations and subsequent reinstatements has increased the risk of investing in this industry, because no one can be sure the tax credit will exist in the future. In fact, the biodiesel tax credit has been retroactively reinstated twice in the past three years, which serves little purpose to reduce the financial uncertainty of the industry. This type of politi-cal uncertainty has an outsize impact on the second-generation biofuel industry, which has had significantly lower investment than the conventional biodiesel industry to date.
Table 9. The legislative history of the biodiesel tax credit
Start Date End DateValue
($/gal) Source Notes
12/31/2004 12/31/2006 $1.00PL 108-357 Sec 302 (American Jobs Creation Act of 2004)
Origin of biodiesel tax credit (reduced credit rate for biodiesel made from waste oils)
8/8/2005 12/31/2008 $1.00PL 109-58 Sec 1344 (Energy Policy Act of 2005)
Added small agri-biodiesel producer PTC
12/31/2009 $1.00PL 110-343 Sec 202 (Emergency Economic Stabilization Act of 2008)
Extended biodiesel and agri-biodiesel credit and equalized them at $1/gal
1/1/2011 12/31/2011 $1.00
PL 111-312 Sec 701 (Tax Relief, Unemployment Insurance Reauthorization and Job Creation Act of 2010)
Retroactive credit for 2010
1/1/2013 12/31/2013 $1.00PL 112-240 Sec 405 (American Taxpayer Relief Act of 2012)
Retroactive credit for 2012
In addition, there is regulatory uncertainty about how the EPA implements the RFS2. The volume mandate for cellulosic fuel has been revised every year, often late in the year; for example, the 2013 RFS2 volumes were not finalized until August 2013 (EPA, 2013b), undermining the investment signal. While it is important for the EPA to assess the environmental impacts of new fuel production pathways, delays in pathway approval have also created uncertainty for companies. The EPA approved a number of specific fuel production pathways under the RFS2 rule and has gradually approved some new pathways (for example, for giant reed and napier grass [EPA, 2013a]); other pathways have been under review for over a year while some are still awaiting approval or denial.20
19# Biodiesel production in the United States is at approximately 50% of total plant capacity, and because biodiesel is not near the blend limit, blenders may comply with the RFS2 by using more gallons of biodiesel rather than pushing high-ethanol fuels (such as E85) into the marketplace.
20#https://foiaonline.regulations.gov/foia/action/public/view/record?objectId=090004d28006d677
27
INVESTMENT RISK IN THE SECOND-GENERATION BIOFUELS INDUSTRY
FINANCIAL MECHANISMS TO REDUCE RISK IN THE ADVANCED BIOFUEL INDUSTRYCurrent policy mechanisms, weakened by political uncertainty, have not been enough to support a fledgling industry that already faces high hurdles in the road to commer-cialization. The RFS2 creates some price support for biofuels, but the cellulosic waiver credit mechanism limits the price at which cellulosic biofuel can compete. The second-generation biofuel producer tax credit o"ers financial support to producers of cellulosic, algal, and similar biofuels, but it can only be claimed under limited circumstances. Moreover, investors cannot be certain these support mechanisms will exist in the future. With this limited policy support for second-generation biofuels, investment has been slow and producers have been struggling (Figure 2).
Stronger policy support is necessary to reduce investment risk and accelerate the expansion of the second-generation biofuels industry. This is in line with the California Air Resources Board’s updated scoping plan for the California Global Warming Solutions Act (AB32), which identifies a need to “invest in and support growing markets for…low carbon transportation fuels” and “support development of large-scale renewable and low carbon fuel production facilities” (CARB, 2013). Not only can increased policy support directly inject confidence into young second-generation biofuel companies by improving their balance sheets, but it can also generally boost market confidence by showing the government’s commitment.
The following sections describe specific and minor changes that could be made to the existing second-generation biofuel producer tax credit to make it more widely available to cellulosic or algal biofuel start-up companies struggling to attract investment in the early stages of scaling up production. These proposed changes support the intent of the original tax credit while expanding its e!cacy.
INTRODUCTION TO TAX CREDITSIn the next section we propose specific changes that could be made to the tax code to more e"ectively promote the commercialization of cellulosic biofuel. Here we introduce some of the relevant terms.
» Tax credit: an amount of money that is subtracted from a taxpayer’s total tax liability. This di"ers from a tax deduction, which is an amount subtracted from a taxpayer’s taxable income.
» Production tax credit: a tax credit that is calculated based on the amount of a good produced in a tax year.
» Investment tax credit: a tax credit that is calculated based on the amount invested in business property, including equipment and other fixed assets.
» Allocable tax credit: a tax credit that can be shared among multiple owners of a business. These credits are usually allocated pro rata, based on the owners’ financial stake in the business.
» Refundable tax credit: a credit that can be claimed as cash from the Treasury Department instead of subtracting it from the taxpayer’s tax liability for that year.
» Transferable tax credit: a tax credit that can be sold (usually at a discount) to another party.
28
ICCT WHITE PAPER
» Grant in lieu of tax credit: a credit that can be claimed as cash from the Treasury Department. This is similar to a refundable tax credit, but a grant in lieu of tax credit is more flexible than a refundable tax credit in when and how it can be claimed, but it may be subject to a discount factor.
PROPOSED CHANGES TO THE TAX CODEThe most e"ective measures to increase the success rate of second-generation biofuel start-up companies would deliver financial aid in the early stages of commercialization. For example, an investment tax credit based on the purchase of equipment would provide benefits sooner than a production tax credit, which can’t be claimed until goods are actually produced. To deliver financial benefits immediately, such measures would also need to have a mechanism to deliver the value of a tax credit to a biofuel company even in the absence of tax liability.
Similar measures were taken to support renewable electricity producers in the 2009 American Recovery and Reinvestment Act (ARRA SEC 1102). The tax code (26 U.S.C. §48) was amended to allow taxpayers eligible for the renewable electricity production tax credit (§45) to opt instead for the federal business energy investment tax credit. Eligible taxpayers can claim up to 30% of expenditures on property used in the produc-tion of specified forms of renewable electricity (DOE, 2013; DSIRE, 2013; Cornell Law, 2013b). ARRA further allowed eligible taxpayers to opt for a grant in lieu of tax credit; the grant would be in the form of a payment from the Treasury Department (DOE, 2013); this provision expired in 2011. The renewable electricity production tax credit was also extended to the end of 2013, and eligibility was widened from facilities placed in service before the deadline to those under construction by December 31, 2013 (DOE, 2013).
Similar measures would likely help promote the second-generation biofuel industry. Allowing these companies to claim the equivalent of their current tax credit up front, while in the construction phase, would significantly improve the financial health of these companies and help them bridge “the valley of death,” or the di!cult period between demonstrating a successful process and making a business profitable.
Extending the second-generation biofuel producer tax credit beyond 2013 is also impor-tant. Ideally, this tax credit should be available until the second-generation biofuel industry has exceeded a certain production volume, after which production is likely to be profitable without tax support. This would be similar to the federal subsidy for electric vehicles, which begins to phase out after a manufacturer produces 200,000 qualifying vehicles (AFDC, 2013), limiting the cost to taxpayers. These measures would improve confidence in the cellulosic biofuel industry and would thereby aid in attracting investors.
We propose the following changes be made to the tax code. Actual proposed changes to the tax code are shown in Appendices C and D.
» Allow taxpayers eligible for the second-generation biofuel producer tax credit to opt instead for the business energy investment tax credit (ITC), worth 30%21 of expenditures on new property used in the production of second-generation biofuel or in new or retrofitted facilities. (Taxpayers would not be eligible to claim both tax credits.) This would be similar to the provision allowing eligible taxpayers to opt for an ITC instead of claiming the renewable electricity production tax credit.
21# Investment and production tax credits were reduced by 7.6% and cash grants by 8.7% by the federal budget sequestration cuts; thus, the e"ective value of the tax credit would be 27.4%-27.7%.

29
INVESTMENT RISK IN THE SECOND-GENERATION BIOFUELS INDUSTRY
To protect taxpayers from large investments in failed plants, the ITC should be portioned out according to certain milestones in the construction of a facility.
» Allow one of the following options under the business energy ITC for producers of second-generation biofuel:
» Grant in lieu of tax credit, allowing eligible taxpayers to receive a grant from the Treasury Department equal to the amount of the business energy ITC to which they are entitled. This option is further described in Appendix C.
» Make the business energy ITC refundable for producers of second-generation biofuel.
» Make the business energy ITC transferable for producers of second-generation biofuel.
» Extend the second-generation biofuel producers tax credit until 1 billion cellulosic RINs have been produced.
» Require that second-generation biofuel producers’ fuel must qualify for advanced RINs under the RFS2 in order to opt to claim the business energy ITC. Eligible pathways under the second-generation biofuel producer tax credit include all pathways eligible for cellulosic RINs but not all pathways eligible for advanced RINS: the credit covers biofuels made from lignocellulose, algae, lemna, or cyanobacteria, but does not cover conventional biodiesel from food or waste-based feedstocks. Some algal-based pathways may qualify for cellulosic RINs if they use algal cellulose as a feedstock.
PROS AND CONS OF TAX CREDITSThe proposed changes above would certainly expand the options for second-generation biofuel companies that want to claim tax incentives earlier in the commercialization process than is currently possible. The changes would allow flexibility in how the credits are redeemed and how long the program runs. If the second-generation biofuel industry scales up faster than expected, the tax credit would expire relatively soon; if scale-up is slow, the tax credit would remain available longer.
By capping the credit at a certain volume of production across the industry, these proposed changes would limit the size of the subsidy from the federal government. At the same time, investors in the second-generation biofuels industry could have confi-dence that their investments will have federal support until the industry is strong enough to be profitable on its own, at which point the next plant would have lower risk and costs. These proposed tax changes are also flexible in that they do not select specific companies; any qualifying biofuel company that has succeeded in attracting enough investment to construct a facility can claim the tax credit.
The most important downside of these changes is that extending the second-generation biofuel producer tax credit will cost the federal government some amount of tax revenue. We calculate that extending the tax credit would cost approximately $370 million annually over five years if the credit is claimed primarily as an investment tax
30
ICCT WHITE PAPER
credit,22 compared with $1 billion if it is claimed as a production tax credit alone.23 This subsidy compares favorably to government expenditures of about $4 billion per year in direct subsidies to oil and gas companies and $6 billion per year for the volumetric ethanol excise tax credit (VEETC) (CBO, 2012; Nakamura, 2012; UCS, 2010). Additionally, supporting this nascent industry will add tax revenue from these companies in the long run, as they become profitable.
While directly providing the value of the tax credit to second-generation biofuel compa-nies (through the grant in lieu of tax credit program) would be more e"ective than other means, the grant program may be politically more di!cult to enact. On the other hand, reviving it requires the fewest changes to existing tax law. The grant in lieu of tax credit option is described in Appendix C.
Expanding the grants and loan guarantee programs under the Department of Energy and the Department of Agriculture for second-generation biofuels could achieve similar aims as the tax amendments proposed above in enhancing the financial viability of cel-lulosic biofuel start-ups. Several companies (such as Abengoa, Sapphire, and Ineos [DOE Biomass Conference, 2013]) have indicated that the grants or loans they have received from the DOE and USDA have been crucial for their success. Continued funds for these programs, as well as advanced biofuel research and development, may be allocated in a new Farm Bill24 and 2014 appropriations bill,25 but likely at lower levels than 2013. How-ever, these programs, especially the DOE’s loan guarantee program, have faced criticism for their selection of companies, among other reasons (Leonnig & Stephens, 2013).
22# This is calculated based on capital costs reported by the DOE (http://www.iogen.ca/news_events/press_releases/2007_02_28_biorefineries_press_release.pdf), which indicates that each cellulosic biofuel plant requires $200 million in capital for 21.7 million gallons of annual capacity. This calculation assumes one such plant is constructed in the first year, and total capacity of the market doubles each year for five years until 1 billion gallons have been produced. Total tax credits awarded for 30% of the capital costs for 31 such plants would amount to $1.86 billion. This calculation does not account for biofuels produced from algal oils.
23#$1.01 tax credit per gallon * 1 billion gallons (after which the tax credit expires) = $1.01 billion.24#http://www.biofuelsdigest.com/bdigest/2013/07/14/the-farm-bill-your-2013-5-minute-guide/2/25# http://www.biofuelsdigest.com/bdigest/2013/06/19/house-appropriations-committee-bill-for-energy-and-
water-cuts-doe-renewable-energy-funding-39/
31
INVESTMENT RISK IN THE SECOND-GENERATION BIOFUELS INDUSTRY
CONCLUSIONSThe technology of converting cellulose and algae to biofuel has taken many years to develop, and new processes are still undergoing research. The most significant barriers to the commercial deployment of cellulosic biofuels, however, are not technological but economic. Acquiring the necessary investment capital to build the first generation of commercial-scale cellulosic biofuels plants is the greatest challenge facing this emerging industry. The analysis presented in this paper shows that second-generation biofuel companies pose significant risks for investors and may have di!culty generating adequate returns to attract investment under current policy and market conditions. Successfully overcoming this hurdle will require firms to use a variety of risk mitigation tools to lower the investment risks in their first commercial projects.
Policy also has an important role to help reduce the risk of new second-generation biofuel companies and to revise existing incentives to drive investment more e"ectively. Based on this analysis of the investment risk of the second-generation biofuel industry, we identify changes that could be made to existing law to provide stronger support to new second-generation biofuel facilities. These changes, and the issues that they would help correct, are summarized in Table 10.
The first proposed change would allow eligible biofuel producers to claim an investment tax credit instead of a production tax credit, as the construction phase is when biofuel companies have the greatest need for financial certainty to attract investors. Allowing these parties to claim a grant in lieu of tax credit would further enable them to use this support in the early stages, as they may not have tax liability against which to claim the credit for several years after construction begins.
The next proposed change is to provide policy certainty for investors by extending the tax credit until a threshold volume of biofuels has been produced, at which point support should no longer be necessary. Finally, we propose taking steps to harmonize definitions of eligible pathways between this tax credit and the RFS2.

32
ICCT WHITE PAPER
Table 10. Proposed changes to the second-generation biofuel producer tax credit
Problem areaImpacts on investment
in 2nd gen biofuelsSuggested policy
change Precedent for change
Tax credit for production
Companies receive no support during the construction phase
Allow eligible parties to opt in for an investment tax credit (ITC) instead of a production tax credit
Parties eligible for the renewable electricity production tax credit can opt for an ITC
Credit against tax liability
Biofuel companies may have little or no tax liability in the early years of construction and production
Allow eligible parties to claim a grant in lieu of tax credit
The grant in lieu of tax credit program provided payments to renewable electricity producers
Expires at end of 2013
Investors see little financial benefit in tax credit that is expiring with high uncertainty of renewal
Provide certainty by extending tax credit until 1 billion cellulosic RINs have been produced
Federal tax credit for electric vehicle purchase is phased out after manufacturer produces 200,000 units
Inconsistent definitions of biofuels
Eligible pathways di"er between the tax credit and the Renewable Fuel Standard
To be eligible for the tax credit, a facility’s process must be eligible for cellulosic or advanced RINs, in addition to meeting existing feedstock criteria
These proposed U.S. tax code changes are relatively modest, and they fall squarely in line with Congress’s intention that the tax code and fuels policy promote the develop-ment of innovative domestic technology, displace petroleum consumption, and help spur long-term reduction of carbon emissions from the transport sector. The cost of these changes would be modest compared with the amount of money spent annually to support the fossil fuel and biodiesel industries. Without such policy changes, the production of these biofuels will continue to fall far short of the RFS2 targets. The technology for these advanced low-carbon biofuels is here, but the financing and the investment security is not. Complementary fiscal policy will be a critical part of the shift toward a more sustainable fuel base in the United States.
33
INVESTMENT RISK IN THE SECOND-GENERATION BIOFUELS INDUSTRY
REFERENCESAAA. Overview of the Renewable Fuel Standard: Stakeholder perspectives: Hearings
before the U.S. House of Representatives Energy and Power Subcommittee, 113th Cong. (2013) (testimony of Robert Darbelnet). Retrieved from http://energycommerce.house.gov/hearing/overview-renewable-fuel-standard-stakeholder-perspectives
Alliance of Automobile Manufacturers. Overview of the Renewable Fuel Standard: Stakeholder perspectives: Hearings before the U.S. House of Representatives Energy and Power Subcommittee, 113th Cong. (2013) (testimony of Shane Karr). Retrieved from http://energycommerce.house.gov/hearing/overview-renewable-fuel-standard-stakeholder-perspectives
Alternative Fuels Data Center (AFDC). (2013). U.S. Department of Energy: Qualified Plug-In Electric Drive Motor Vehicle Tax Credit. Retrieved from http://www.afdc.energy.gov/laws/law/US/409
Babcock, B.A., & Pouliot, S. (2013). Price It and They Will Buy: How E85 Can Break the Blend Wall. Retrieved from: http://www.card.iastate.edu/policy_briefs/display.aspx?id=1187
Biofuels Digest. (2013). Ineos Bio produces cellulosic ethanol from waste, at commercial scale. Retrieved from http://www.biofuelsdigest.com/bdigest/2013/08/01/ineos-bio-produces-cellulosic-ethanol-from-waste-at-commercial-scale/
California Air Resources Board (CARB). (2009). Final Regulation Order: Low Carbon Fuel Standard. Retrieved from http://www.arb.ca.gov/regact/2009/lcfs09/lcfscombofinal.pdf
California Air Resources Board (CARB). (2013). Climate Change Scoping Plan: First Update (p. 90). Retrieved from http://www.arb.ca.gov/cc/scopingplan/2013_update/discussion_draft.pdf
Carney, T. (2011). Green-energy plant sucks up subsidies, then goes bust. Washington Examiner. Retrieved from http://washingtonexaminer.com/green-energy-plant-sucks-up-subsidies-then-goes-bust/article/110267
Cornell University Law School Legal Information Institute. (2013a). Retrieved from http://www.law.cornell.edu/uscode/text/26/40
Cornell University Law School Legal Information Institute. (2013b). Retrieved http://www.law.cornell.edu/uscode/text/26/48
Congressional Budget O!ce (CBO). (2012). Federal financial support for the development and production of fuels and energy technologies (Issue Brief). Retrieved from http://www.cbo.gov/sites/default/files/cbofiles/attachments/03-06-FuelsandEnergy_Brief.pdf
Curtis, B. (2010). 2008-2009 Review U.S. Biofuels Industry: Mind the Gap. Concentric Energies & Resource Group Inc. Retrieved from http://www1.eere.energy.gov/bioen-ergy/pdfs/us_biofuels_industry_report.pdf
Department of Energy (DOE). (2013). Renewable electricity production tax credit. Re-trieved from http://energy.gov/savings/renewable-electricity-production-tax-credit-ptc
Department of Energy (DOE) Biomass Conference. (2013). Biomass 2013: How the Ad-vanced Bioindustry is Reshaping American Energy. July 31-Aug 1, 2013: Washington, DC.
Database of State Incentives for Renewables & E!ciency (DSIRE). (2013). Business energy investment tax credit (ITC). Retrieved from http://www.dsireusa.org/incen-tives/incentive.cfm?Incentive_Code=US02F

34
ICCT WHITE PAPER
DieselNet. (2013). Fuels Regulations, United States, Biodiesel Fuel. Retrieved from http://www.dieselnet.com/standards/us/fuel_biodiesel.php
Energy Information Administration (EIA). (2012). Annual Energy Outlook 2012, with projec-tions to 2035. Retrieved from http://www.eia.gov/forecasts/aeo/pdf/0383(2012).pdf
Environmental Protection Agency (EPA). (2010a). Partial grant and partial denial of Clean Air Act waiver application submitted by Growth Energy to increase the allow-able ethanol content of gasoline to 15 percent; decision of the administrator; notice. EPA-HQ-OAR-2009-0211. Retrieved from http://www.gpo.gov/fdsys/pkg/FR-2010-11-04/pdf/2010-27432.pdf
Environmental Protection Agency (EPA). (2010b). Regulation of Fuels and Fuel Additives: 2011 Renewable Fuel Standards. EPA-HQ-OAR-2010-0133.
Environmental Protection Agency (EPA). (2012). Regulation of Fuels and Fuel Additives: 2012 Renewable Fuel Standards. EPA-HQ-OAR-2010-0133.
Environmental Protection Agency (EPA). (2013a). Final Rule for Additional Qualifying Renewable Fuel Pathways under the Renewable Fuel Standard (RFS) Program. EPA-HQ-OAR-2011-0542..
Environmental Protection Agency (EPA). (2013b). Regulation of Fuels and Fuel Additives: 2013 Renewable Fuel Standards. EPA-HQ-OAR-2012-0546.
Fama, E. (1990). Stock returns, expected returns, and real activity. The Journal of Finance, 45(4), 1089-1108. Retrieved from http://www.jstor.org/stable/2328716
Hart Energy. (2012). Flash report: First cellulosic-based ethanol volumes registered to EMTS.
Leonnig, C.D. & Stephens, J. (2013). E-mails about clean-energy loans provide new details on White House involvement. Washington Post. Retrieved from http://www.washingtonpost.com/politics/energy-dept-e-mails-on-solyndra-provide-new-details-on-white-house-involvement/2012/08/08/668dc042-e162-11e1-a25e-15067bb31849_story.html
McPhail, L., Westcott, P., & Lutman, H. (2011). The Renewable Identification Number System and U.S. Biofuel Mandates. U.S. Department of Agriculture. Retrieved from http://www.ers.usda.gov/media/138383/bio03.pdf
Overview of the Renewable Fuel Standard: Government Perspectives: Hearings before the Subcommittee on Energy and Power, of the House Committee on Energy and Commerce, 113th Cong. (2013). Retrieved from http://energycommerce.house.gov/hearing/overview-renewable-fuel-standard-government-perspectives
Overview of the Renewable Fuel Standard: Stakeholder Perspectives: Hearings before the Subcommittee on Energy and Power, of the House Committee on Energy and Commerce, 113th Cong. (2013). Retrieved from http://energycommerce.house.gov/hearing/overview-renewable-fuel-standard-stakeholder-perspectives
Nakamura, D. (2012). Obama calls on Congress to repeal federal subsidies for oil industry. Washington Post. Retrieved from http://www.washingtonpost.com/politics/obama-calls-on-congress-to-repeal-federal-subsidies-for-oil-industry/2012/03/01/gIQArDU2kR_story.html
Range Fuels. (2007). Range Fuels awarded permit to construct the nation’s first com-mercial cellulosic ethanol plant (press release). Retrieved from http://web.archive.org/web/20071012155610/http://www.rangefuels.com/Range-Fuels-awarded-permit-to-construct-the-nations-first-commercial-cellulosic-ethanol-plant
35
INVESTMENT RISK IN THE SECOND-GENERATION BIOFUELS INDUSTRY
Solecki, M., Dougherty, A., & Epstein, B. (2012). Advanced Biofuel Market Report 2012: Meeting U.S. Fuel Standards (p. 11). Environmental Entrepreneurs. Retrieved from http://www.e2.org/ext/doc/E2AdvancedBiofuelMarketReport2012.pdf
Solecki, M., Richey, D., & Epstein, B. (2011). Advanced Biofuel Market Report 2011: Meeting the California LCFS (p. 9). Environment Entrepreneurs. Retrieved from http://www.e2.org/ext/doc/E2%20Advanced%20Biofuel%20Mkt%20Report%202011.pdf
Tyner, W. (2013, August 12). “The Biofuels Renewable Fuel Standard—EPA to the Rescue.” Retrieved from http://www.pennenergy.com/index/blogs/energy-and-environmental-economics/2013/08/the_biofuels_renewab.html
Union of Concerned Scientists. (2010). FAQ: Current Ethanol Tax Credits and Our Clean Fuel Future. Retrieved from: http://www.ucsusa.org/clean_vehicles/smart-transporta-tion-solutions/vehicle-policy/past-policy-and-legislation/volumetric-ethanol-excise-tax-credit-faqs.html
U.S. House of Representatives, Committee on Energy and Commerce. (2013). “Reviewing the Renewable Fuel Standard.” Retrieved from http://energycommerce.house.gov/rfs
Yeh, S., Witcover, J., & Kessler, J. (2013). Status Review of California’s Low Carbon Fuel Standard (Research Report No. UCD-ITS-RR-13-06). Davis, California: Institute of Transportation Studies, University of California, Davis.
36
ICCT WHITE PAPER
APPENDIX A: RIN GENERATIONWhile a full discussion of the pricing dynamics for D4 and D5 RINs (for biomass-based diesel and advanced biofuel, respectively) is beyond the scope of this paper, it is useful to show exactly how the RFS2 is being complied with. Figures 10-12 show compliance with three of the four mandates (biomass-based diesel, advanced fuel, and renewable fuel). Cellulosic RINs are not discussed because their production is limited and obligated parties have had to purchase cellulosic waiver credits instead of physical gallons in order to demonstrate compliance with the cellulosic mandate.
First, for biomass-based diesel, two types of RINs can be used to show compliance with this mandate: the D4 RIN and the D7 RIN (cellulosic diesel).26 To date only a small num-ber of cellulosic diesel fuel gallons have been generated (<26,000 gallons).27 Therefore the overwhelming majority of fuel that qualifies as biomass-based diesel has been given a D4 RIN; this can be seen in Figure 10. To clarify, not all D4 RINs are generated from the same fuel. In fact, biodiesel and several types of non-ester renewable diesel28 are all eli-gible to produce a D4 RIN. Figure 11 shows generation of advanced RINs, which includes D3 (cellulosic biofuel), D4, D5, and D7 RINs, while Figure 12 shows generation of renew-able RINs (D3-D7, including all advanced RINs plus renewable fuels like corn ethanol). Table 11 breaks down the various types of RINs into percentages produced from each type of fuel. As can be seen, D4 RINs are primarily generated by biodiesel (produced through transesterification), D5 RINs are primarily generated by sugarcane ethanol,29 and D6 (renewable fuel) RINs are primarily generated by non-cellulosic ethanol.30
As can be seen in Table 11, new gallons of non-ester renewable diesel have been generat-ing D6 RINs in 2013. Due to the combined e"ects of the high value of the D6 RIN and the blend wall, producers that might not have met the 50% GHG reduction requirement for a D4/D5 RIN now only have to meet the 20% GHG reduction required to generate a D6 RIN. This example helps illustrate how the RIN market mechanism introduces interesting complexities; there may be discrete times when certain fuels would be incentivized as a result of the current RIN price.
26#A D7 RIN is generated for cellulosic diesel fuel.27# According to the EPA’s EMTS system (http://www.epa.gov/otaq/fuels/rfsdata/2013emts.htm), accessed
August 16, 2013.28#With equivalence values (EVs) ranging from 1.5-1.7.29#In this case, sugarcane based ethanol that is imported from Brazil30#In this case, corn based ethanol produced domestically

37
INVESTMENT RISK IN THE SECOND-GENERATION BIOFUELS INDUSTRY
Table 11. Distribution of RIN production by fuel type. Data from 2010 includes the months of July through December, as the transition between RFS1 and RFS2 was occurring, because reporting requirements di"ered during this time. Reporting guidance can be found in the RFS2 Final Rule (75 FR 14670). Data is current as of July 7, 2013.
RIN Year% biodiesel
(EV=1.5)
% non-ester renewable
diesel (EV=1.7)
% non-ester renewable
diesel (EV=1.6)
% non-ester renewable
diesel (EV=1.5)
D4
2010 99.50% 0.38% 0.12% 0.00%
2011 95.54% 3.04% 1.41% 0.01%
2012 91.21% 7.84% 0.86% 0.08%
2013 89.60% 9.76% 0.62% 0.03%
D5
Year
% non-cellulosic ethanol (EV=1)
% heating oil (EV=1.6)
% non-ester renewable
diesel (EV=1.7)
% non-ester renewable
diesel (EV=1.6) % biogas
2010 14.13% 41.23% 15.70% 28.94% 0.00%
2011 84.77% 2.70% 3.37% 8.53% 0.62%
2012 96.24% 0.03% 2.72% 0.55% 0.46%
2013 91.54% 0.00% 6.85% 0.00% 1.61%
D6
Year
% non-cellulosic ethanol (EV=1)
% biodiesel (EV=1.5)
% non-ester renewable
diesel (EV=1.7)
2010 99.72% 0.28% 0.00%
2011 99.95% 0.05% 0.00%
2012 99.99% 0.01% 0.00%
2013 99.44% 0.01% 0.55%

38
ICCT WHITE PAPER
RIN
s (b
illio
n ga
llons
)
D4 D7
0
0.5
1
1.5
2
2.5
2011 2012 2013 2014
RFS Mandate
Figure 10. Cumulative production of RINs that can be used to satisfy the biomass-based diesel mandate under the RFS2. Only D4 and D7 RINs are eligible (40 CFR 80.1427). This graph does not include the e"ects of banking RINs.
RIN
s (b
illio
n ga
llons
)
20140
0.5
1
1.5
2
2.5
3
2011 2012 2013
RFS Advanced mandate Total D3 D4 D5 D7
Figure 11. Cumulative production of RINs that can be used to satisfy the advanced biofuel mandate under the RFS2. D3, D4, D5, and D7 RINs can be used to satisfy this mandate (40 CFR 80.1427). This graph does not include the e"ects of banking.
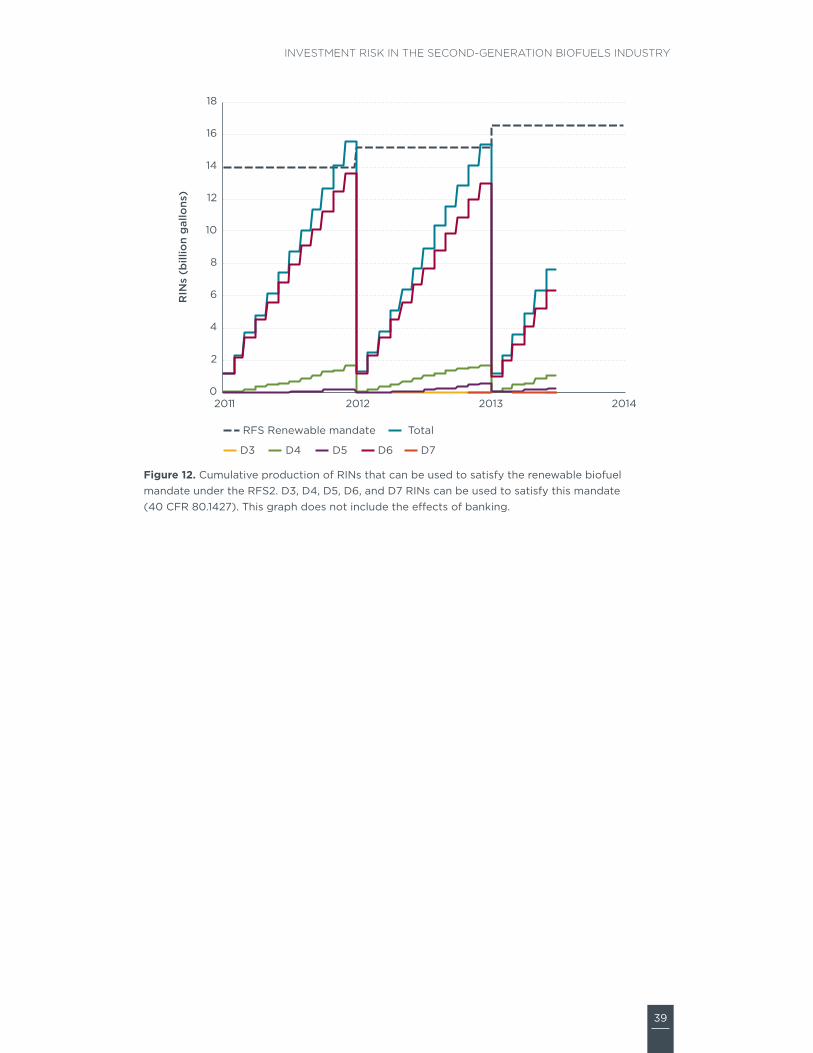
39
INVESTMENT RISK IN THE SECOND-GENERATION BIOFUELS INDUSTRY
RIN
s (b
illio
n ga
llons
)
20140
2
4
6
8
10
12
14
16
18
2011 2012 2013
RFS Renewable mandate Total
D3 D4 D5 D6 D7
Figure 12. Cumulative production of RINs that can be used to satisfy the renewable biofuel mandate under the RFS2. D3, D4, D5, D6, and D7 RINs can be used to satisfy this mandate (40 CFR 80.1427). This graph does not include the e"ects of banking.
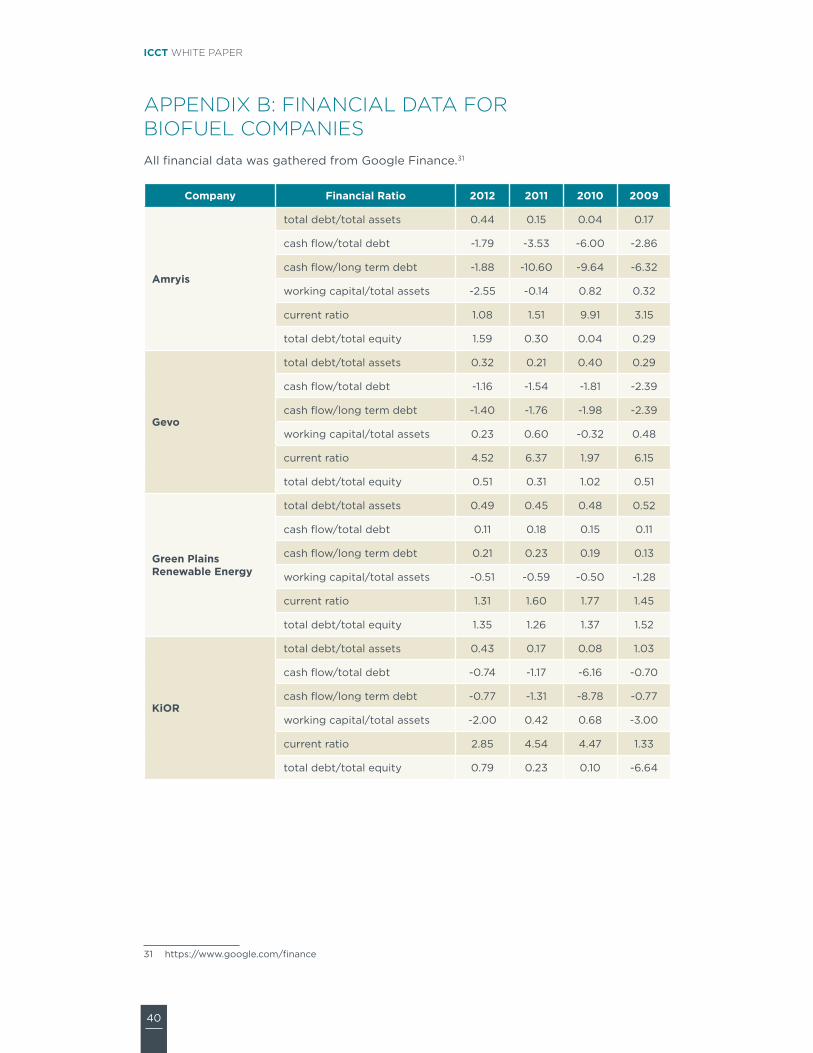
40
ICCT WHITE PAPER
APPENDIX B: FINANCIAL DATA FOR BIOFUEL COMPANIESAll financial data was gathered from Google Finance.31
Company Financial Ratio 2012 2011 2010 2009
Amryis
total debt/total assets 0.44 0.15 0.04 0.17
cash flow/total debt -1.79 -3.53 -6.00 -2.86
cash flow/long term debt -1.88 -10.60 -9.64 -6.32
working capital/total assets -2.55 -0.14 0.82 0.32
current ratio 1.08 1.51 9.91 3.15
total debt/total equity 1.59 0.30 0.04 0.29
Gevo
total debt/total assets 0.32 0.21 0.40 0.29
cash flow/total debt -1.16 -1.54 -1.81 -2.39
cash flow/long term debt -1.40 -1.76 -1.98 -2.39
working capital/total assets 0.23 0.60 -0.32 0.48
current ratio 4.52 6.37 1.97 6.15
total debt/total equity 0.51 0.31 1.02 0.51
Green Plains Renewable Energy
total debt/total assets 0.49 0.45 0.48 0.52
cash flow/total debt 0.11 0.18 0.15 0.11
cash flow/long term debt 0.21 0.23 0.19 0.13
working capital/total assets -0.51 -0.59 -0.50 -1.28
current ratio 1.31 1.60 1.77 1.45
total debt/total equity 1.35 1.26 1.37 1.52
KiOR
total debt/total assets 0.43 0.17 0.08 1.03
cash flow/total debt -0.74 -1.17 -6.16 -0.70
cash flow/long term debt -0.77 -1.31 -8.78 -0.77
working capital/total assets -2.00 0.42 0.68 -3.00
current ratio 2.85 4.54 4.47 1.33
total debt/total equity 0.79 0.23 0.10 -6.64
31# https://www.google.com/finance

41
INVESTMENT RISK IN THE SECOND-GENERATION BIOFUELS INDUSTRY
Company Financial Ratio 2012 2011 2010 2009
Lignol Energy Corp.
total debt/total assets 0.00 0.00 0.00 0.00
cash flow/total debt - - - -
cash flow/long term debt - - - -
working capital/total assets 0.12 0.61 0.51 0.78
current ratio 1.24 2.77 2.20 4.88
total debt/total equity 0.00 0.00 0.00 0.00
Pacific Ethanol
total debt/total assets 0.56 0.41 0.53 0.30
cash flow/total debt -0.26 0.09 0.64 -3.04
cash flow/long term debt -0.27 0.09 0.92 -21.49
working capital/total assets -1.83 -1.78 -3.21 -7.18
current ratio 4.63 7.43 1.20 0.51
total debt/total equity 2.31 2.01 -17.19 -0.90
Rentech Inc.*
total debt/total assets 0.40 0.14 0.76 0.52
cash flow/total debt 0.22 -0.01 -0.28 -0.29
cash flow/long term debt 0.23 -0.01 -0.34 -0.33
working capital/total assets -0.68 0.46 -0.78 -1.06
current ratio 2.27 5.14 1.31 1.39
total debt/total equity 1.22 0.23 -9.87 2.73
Solazyme
total debt/total assets 0.07 0.07 0.00 0.04
cash flow/total debt -5.32 -2.58 -67.35 -7.19
cash flow/long term debt -10.42 -3.49 -86.06 -
working capital/total assets 0.80 0.83 0.82 0.76
current ratio 6.63 8.86 5.93 4.11
total debt/total equity 0.08 0.08 0.00 0.06
Verenium
total debt/total assets 0.50 0.57 0.79 0.63
cash flow/total debt 0.44 0.16 -0.04 -0.51
cash flow/long term debt 0.44 0.96 -0.04 -0.51
working capital/total assets -0.12 -0.17 -0.06 -3.15
current ratio 3.60 0.98 5.43 1.89
total debt/total equity 1.53 4.15 27.76 -4.16
* Rentech’s ratios for 2011 were based on Q4 data only.
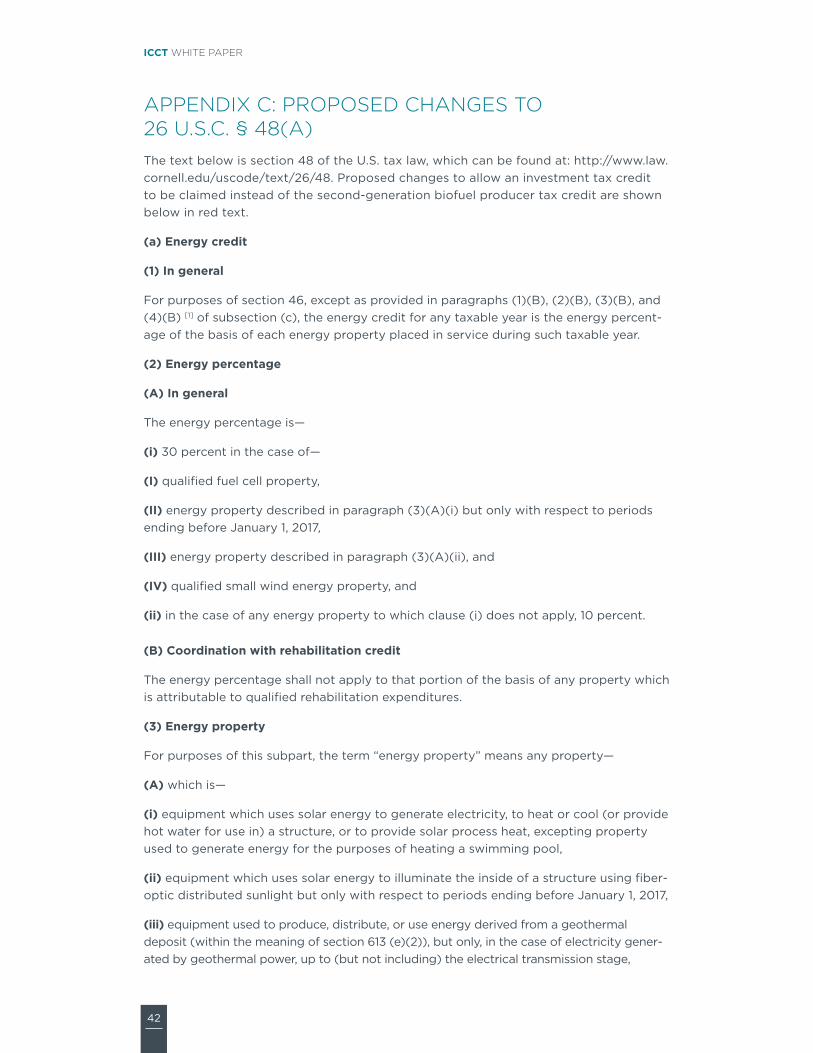
42
ICCT WHITE PAPER
APPENDIX C: PROPOSED CHANGES TO 26 U.S.C. § 48(A)The text below is section 48 of the U.S. tax law, which can be found at: http://www.law.cornell.edu/uscode/text/26/48. Proposed changes to allow an investment tax credit to be claimed instead of the second-generation biofuel producer tax credit are shown below in red text.
(a) Energy credit
(1) In general
For purposes of section 46, except as provided in paragraphs (1)(B), (2)(B), (3)(B), and (4)(B) [1] of subsection (c), the energy credit for any taxable year is the energy percent-age of the basis of each energy property placed in service during such taxable year.
(2) Energy percentage
(A) In general
The energy percentage is—
(i) 30 percent in the case of—
(I) qualified fuel cell property,
(II) energy property described in paragraph (3)(A)(i) but only with respect to periods ending before January 1, 2017,
(III) energy property described in paragraph (3)(A)(ii), and
(IV) qualified small wind energy property, and
(ii) in the case of any energy property to which clause (i) does not apply, 10 percent.
(B) Coordination with rehabilitation credit
The energy percentage shall not apply to that portion of the basis of any property which is attributable to qualified rehabilitation expenditures.
(3) Energy property
For purposes of this subpart, the term “energy property” means any property—
(A) which is—
(i) equipment which uses solar energy to generate electricity, to heat or cool (or provide hot water for use in) a structure, or to provide solar process heat, excepting property used to generate energy for the purposes of heating a swimming pool,
(ii) equipment which uses solar energy to illuminate the inside of a structure using fiber-optic distributed sunlight but only with respect to periods ending before January 1, 2017,
(iii) equipment used to produce, distribute, or use energy derived from a geothermal deposit (within the meaning of section 613 (e)(2)), but only, in the case of electricity gener-ated by geothermal power, up to (but not including) the electrical transmission stage,

43
INVESTMENT RISK IN THE SECOND-GENERATION BIOFUELS INDUSTRY
(iv) qualified fuel cell property or qualified microturbine property,
(v) combined heat and power system property,
(vi) qualified small wind energy property
(vii) equipment which uses the ground or ground water as a thermal energy source to heat a structure or as a thermal energy sink to cool a structure, but only with respect to periods ending before January 1, 2017, or
(viii) equipment used in the production of cellulosic biofuel as defined in section 40(b)(6)(E).
(B)
(i) the construction, reconstruction, or erection of which is completed by the taxpayer, or
(ii) which is acquired by the taxpayer if the original use of such property commences with the taxpayer,
(C) with respect to which depreciation (or amortization in lieu of depreciation) is allowable, and
(D) which meets the performance and quality standards (if any) which—
(i) have been prescribed by the Secretary by regulations (after consultation with the Secretary of Energy), and
(ii) are in e"ect at the time of the acquisition of the property.
Such term shall not include any property which is part of a facility the production from which is allowed as a credit under section 45 for the taxable year or any prior taxable year.
(4) Special rule for property financed by subsidized energy financing or industrial development bonds
(A) Reduction of basis
For purposes of applying the energy percentage to any property, if such property is financed in whole or in part by—
(i) subsidized energy financing, or
(ii) the proceeds of a private activity bond (within the meaning of section 141) the interest on which is exempt from tax under section 103,
the amount taken into account as the basis of such property shall not exceed the amount which (but for this subparagraph) would be so taken into account multiplied by the fraction determined under subparagraph (B).
(B) Determination of fraction
For purposes of subparagraph (A), the fraction determined under this subparagraph is 1 reduced by a fraction—
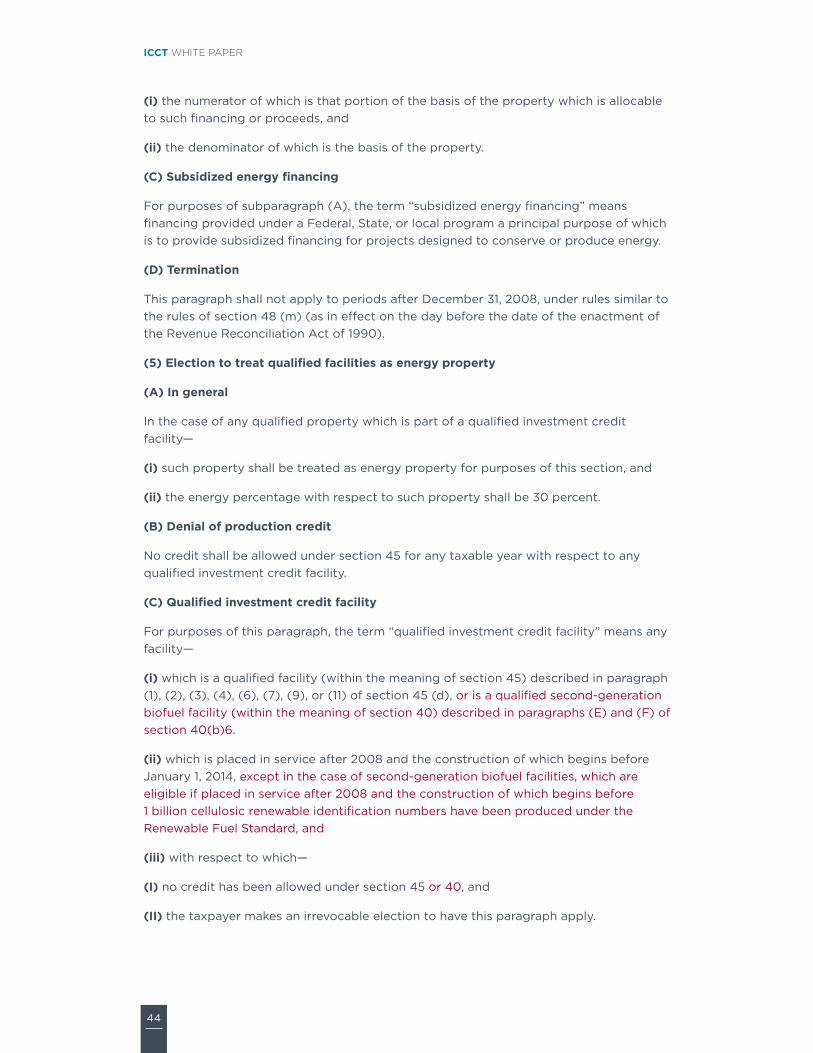
44
ICCT WHITE PAPER
(i) the numerator of which is that portion of the basis of the property which is allocable to such financing or proceeds, and
(ii) the denominator of which is the basis of the property.
(C) Subsidized energy financing
For purposes of subparagraph (A), the term “subsidized energy financing” means financing provided under a Federal, State, or local program a principal purpose of which is to provide subsidized financing for projects designed to conserve or produce energy.
(D) Termination
This paragraph shall not apply to periods after December 31, 2008, under rules similar to the rules of section 48 (m) (as in e"ect on the day before the date of the enactment of the Revenue Reconciliation Act of 1990).
(5) Election to treat qualified facilities as energy property
(A) In general
In the case of any qualified property which is part of a qualified investment credit facility—
(i) such property shall be treated as energy property for purposes of this section, and
(ii) the energy percentage with respect to such property shall be 30 percent.
(B) Denial of production credit
No credit shall be allowed under section 45 for any taxable year with respect to any qualified investment credit facility.
(C) Qualified investment credit facility
For purposes of this paragraph, the term “qualified investment credit facility” means any facility—
(i) which is a qualified facility (within the meaning of section 45) described in paragraph (1), (2), (3), (4), (6), (7), (9), or (11) of section 45 (d), or is a qualified second-generation biofuel facility (within the meaning of section 40) described in paragraphs (E) and (F) of section 40(b)6.
(ii) which is placed in service after 2008 and the construction of which begins before January 1, 2014, except in the case of second-generation biofuel facilities, which are eligible if placed in service after 2008 and the construction of which begins before 1 billion cellulosic renewable identification numbers have been produced under the Renewable Fuel Standard, and
(iii) with respect to which—
(I) no credit has been allowed under section 45 or 40, and
(II) the taxpayer makes an irrevocable election to have this paragraph apply.

45
INVESTMENT RISK IN THE SECOND-GENERATION BIOFUELS INDUSTRY
(D) Qualified property
For purposes of this paragraph, the term “qualified property” means property—
(i) which is—
(I) tangible personal property, or
(II) other tangible property (not including a building or its structural components), but only if such property is used as an integral part of the qualified investment credit facility,
(ii) with respect to which depreciation (or amortization in lieu of depreciation) is allowable,
(iii) which is constructed, reconstructed, erected, retrofitted, or acquired by the tax-payer, and
(iv) the original use of which commences with the taxpayer.
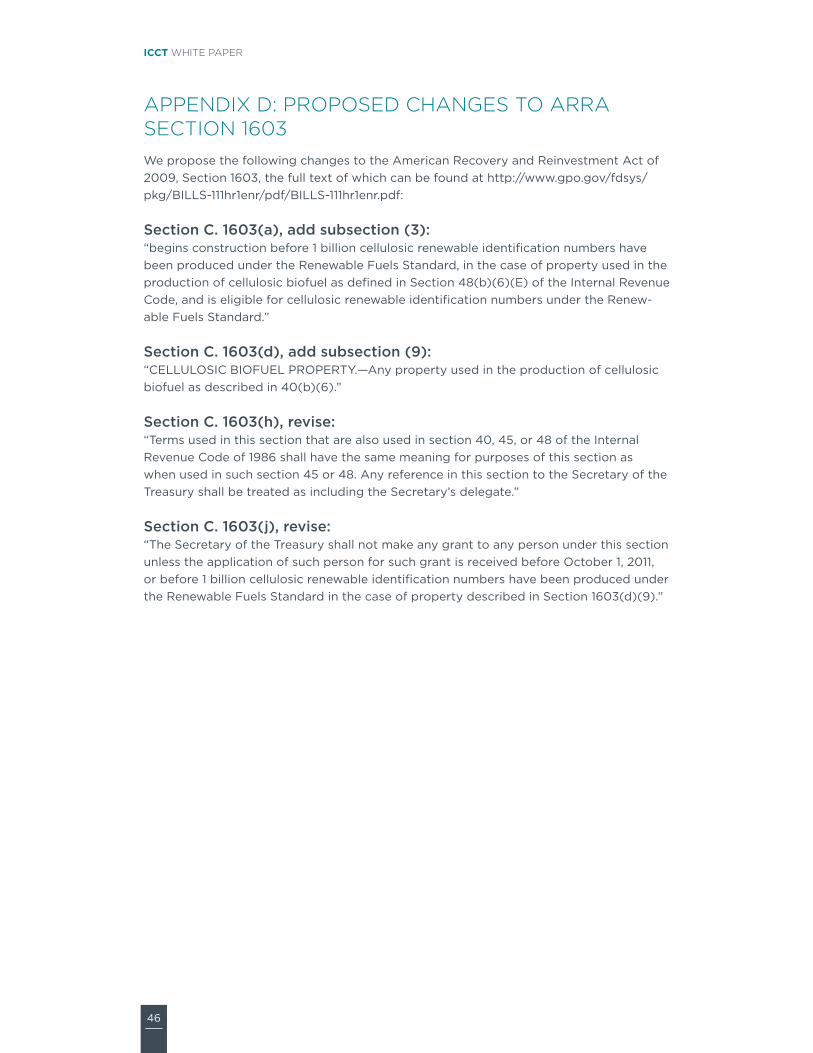
46
ICCT WHITE PAPER
APPENDIX D: PROPOSED CHANGES TO ARRA SECTION 1603We propose the following changes to the American Recovery and Reinvestment Act of 2009, Section 1603, the full text of which can be found at http://www.gpo.gov/fdsys/pkg/BILLS-111hr1enr/pdf/BILLS-111hr1enr.pdf:
Section C. 1603(a), add subsection (3):“begins construction before 1 billion cellulosic renewable identification numbers have been produced under the Renewable Fuels Standard, in the case of property used in the production of cellulosic biofuel as defined in Section 48(b)(6)(E) of the Internal Revenue Code, and is eligible for cellulosic renewable identification numbers under the Renew-able Fuels Standard.”
Section C. 1603(d), add subsection (9):“CELLULOSIC BIOFUEL PROPERTY.—Any property used in the production of cellulosic biofuel as described in 40(b)(6).”
Section C. 1603(h), revise:“Terms used in this section that are also used in section 40, 45, or 48 of the Internal Revenue Code of 1986 shall have the same meaning for purposes of this section as when used in such section 45 or 48. Any reference in this section to the Secretary of the Treasury shall be treated as including the Secretary’s delegate.”
Section C. 1603(j), revise:“The Secretary of the Treasury shall not make any grant to any person under this section unless the application of such person for such grant is received before October 1, 2011, or before 1 billion cellulosic renewable identification numbers have been produced under the Renewable Fuels Standard in the case of property described in Section 1603(d)(9).”