measuring and examining innovation in philippine business ... · pdf file1 measuring and...
TRANSCRIPT
For comments, suggestions or further inquiries please contact:
Philippine Institute for Development Studies Surian sa mga Pag-aaral Pangkaunlaran ng Pilipinas
The PIDS Discussion Paper Series constitutes studies that are preliminary and subject to further revisions. They are being circulated in a limited number of copies only for purposes of soliciting comments and suggestions for further refinements. The studies under the Series are unedited and unreviewed.
The views and opinions expressed are those of the author(s) and do not necessarily reflect those of the Institute.
Not for quotation without permission from the author(s) and the Institute.
The Research Information Staff, Philippine Institute for Development Studies 18th Floor, Three Cyberpod Centris – North Tower, EDSA corner Quezon Avenue, 1100 Quezon City, Philippines Tel Numbers: (63-2) 3721291 and 3721292; E-mail: [email protected] visit our website at http://www.pids.gov.ph
Measuring and Examining Innovation in Philippine Business and Industry
DISCUSSION PAPER SERIES NO. 2017-28
Jose Ramon G. Albert et al.
September 2017

1
Measuring and Examining Innovation in Philippine Business and Industry by
Jose Ramon G. Albert, Francis Mark A. Quimba, Ramonette B. Serafica, Gilberto M. Llanto, Jana Flor V. Vizmanos and Jose Carlos Alexis C. Bairan1
ABSTRACT
Innovation involves implementing new or significantly improved goods and services, production processes, marketing, or organizational methods for adding value. The measurement of innovation provides a mechanism for benchmarking national performance, and for examining innovation and its relation to economic growth. Further, examining determinants and bottlenecks to innovation among firms provides inputs to mainstreaming of policies on innovation. In this paper, results of the 2015 Survey of Innovation Activities (SIA), conducted by the Philippine Institute for Development Studies (PIDS), are described and discussed. Survey results suggest that less than half of firms in the country are innovators, with larger-sized firms innovating more than micro, small, and medium establishments (MSMEs). The most innovative behavior among firms in process innovation. Effects of innovation are observed to be largely customer-driven. Firms suggest cost factors to be the most important barrier to innovation. Knowledge and cooperation networks for innovation need strengthening. Government support and its role on innovation is also limited. Firms hardly access technical assistance from government and research institutions. Cooperation of firms on innovation activities with academe is also limited. Firms cooperate more internally with establishments within their enterprise, their customers and suppliers. Government needs to have a champion for developing stronger policies and interventions to support and encourage innovation. It is also important to improve information dissemination on public programs available to assist firms in innovating. Networking, linkages, and collaboration among the government, industry associations, and universities and research institutions also require further enhancement.
Key Words: innovation, product innovation, process innovation, organizational innovation, marketing innovation, micro, small and medium enterprises (MSMEs)
1 The first and third authors are senior research fellows, the second author is a junior research fellow, the fourth author is president, and the last two authors are research assistants at Philippine Institute for Development Studies (PIDS). Views expressed are those of the authors and do not necessarily reflect those at the PIDS.

2
1 Introduction
The past decade has shown how our ways of doing things have undergone intense transformation especially as a result of innovations, particularly technological innovations. Innovation has always been associated with improved productivity and competitiveness. Consequently, governments are cognizant that innovation is an important driver for sustained economic growth and development, as well as a key to finding enduring solutions to socio- economic and environmental challenges, such as creating new jobs for a continually growing population, and promoting energy efficiency. The Sustainable Development Goals (SDGs), the successor agenda to the Millennium Development Goals, which, in 2015, countries committed to pursuing by 2030, includes a goal to “Build resilient infrastructure, promote inclusive and sustainable industrialization and foster innovation” (SDG 9). Even the Philippine government has laid out in the 2017-2022 Philippine Development Plan (PDP) an entire chapter that identifies a goal to vigorously advance science, technology and innovation (STI).
In business and industry, innovations consist of radical developments or many small changes in product design and quality, production processes (or the way in which production is organized), and management, marketing or maintenance practices that collectively, modify products and processes, bring costs down, increase efficiency and productivity, enhance customer welfare and ensure environmental sustainability. The role of government is crucial for establishing and maintaining the proper climate for innovation.
In the 2016 Global Innovation Index (GII) Report 2, the Philippines has ranked 74th out of 128 economies in an overall measure of the innovation climate. Out of seven Association of Southeast Asian Nations (ASEAN) member states, the country is 5th, behind Singapore (6th), Malaysia (35th), Thailand (52nd), and Vietnam (59th) but ahead of Indonesia (88th) and Cambodia (95th). The GII is a composite measure of innovation, composed of various indicators on seven pillars: institutions, human capital & research, infrastructure, market sophistication, business sophistication, knowledge & technology outputs and creative outputs. The 2017-2022 PDP attributes this poor performance of the country in the GII to the low amount of public expenditures on research and development (R&D), inadequate number of research scientists and engineers, inadequate STI infrastructure, coupled with the fragile STI and intellectual property culture, the restrictive regulations that hamper the conduct of research and the weak linkages of firms engaged in innovation activities with government and the academe.
Innovation is usually connoted with inventions; thus, its measurement has traditionally focused on monitoring R&D indicators, such as R&D expenditures, and the number of R&D scientists and engineers (RSEs) per million people. R&D investments, including the development of
2 This report is published by Cornell University, INSEAD, and the World Intellectual Property Organization, in partnership with other organizations and institutions. The index is based on data derived from several sources, including the International Telecommunication Union, the World Bank and the World Economic Forum.

3
human capital engaged in R&D, are important for improving innovation and technological capability in the country. The share of R&D expenditure to GDP describes technological capacity and innovative efforts in a country in as much as R&D investments enhance a country’s innovation ecosystem. The number of human resource available for knowledge creation and transfer, i.e. the number of RSEs per million people, describes advancement in knowledge and technological applications, as well the diffusion of new knowledge.
With regard to R&D spending, while the Philippines has had a slight increase in R&D expenditure to GDP in recent years (Figure 1.1), this spending is still at less than a fifth of one percent of GDP, which is below the one percent benchmark recommended by the United Nations Educational, Scientific, and Cultural Organization (UNESCO). It also falls below spending of several ASEAN member states, especially Singapore (2.4 %) and Malaysia (1.3 %), and even including Thailand (0.5 %) and Viet Nam (0.2 %). The relatively low spending on R&D activities in the country has been noted even more than a decade ago in several studies (e.g., Cororaton, 2002; Macapanpan, 1999; Patalinhug, 2003), and reflects the low priority provided to STI.
Figure 1.1. R&D Expenditures among ASEAN member states, as percentage of Gross Domestic Product (GDP) (%)
Note: Earliest year: Singapore (2005), Thailand (2005), Philippines (2005), Malaysia (2006), Indonesia (2009); Latest year: Thailand (2010), Viet Nam (2011), Malaysia (2013), Philippines (2013), Indonesia (2013), Singapore (2015).
In the period from 2005 to 2015, the number of RSEs per million people has increased in the country (Figure 1.2), but the levels in the country (189) for latest years are still far from those of several ASEAN member states, such as Singapore (6,618), Malaysia (2,826), and Thailand (974), and about half of the UNESCO benchmark of 380 RSEs per million people.
0.08 0.08 0.12 0.14 0.19 0.23
0.48
0.64
1.26
2.20
2.40
0.5
11
.52
2.5
Pe
rcen
t
Indonesia Philippines Viet Nam Thailand Malaysia Singapore
Source: 2017 ASEAN Community Progress Monitoring System Report.
R&D Expenditure as % of GDP
Earliest Year Latest Year

4
Figure 1.2. Number of research scientists and engineers (per million people)
Note: Earliest year: Singapore (2005), Malaysia (2006), Thailand (2005), Philippines (2005), Indonesia (2009); Latest year: Singapore (2015), Malaysia (2014), Thailand (2014), Philippines (2013)
Though there is an overlap between R&D and innovation, these concepts3 are quite different. Innovation is “new, good ideas put to work”; it involves the creation, development, deployment, and economic utilization of new knowledge as new products, new products and new services (OECD, 1998). New knowledge is not necessarily new in absolute terms. What is crucial is that an innovation increase value, whether customer value, or producer value. Innovation activities thus go beyond inventions and R&D; innovations involve the implementation of technological innovation (either with the development of new or significantly improved products or processes), or non-technological innovation (such as new marketing or organizational methods). Innovation thus requires a means of monitoring beyond the regular examination of R&D indicators.
While developed countries typically work on technological and information innovation because of their extra resources, developing countries like the Philippines tend to be users of technology. But this does not prevent the developing world from making use of opportunities to tap into knowledge and technology available in the world for deployment and economic use in their respective societies. This entails initiating new activities throughout the economy, with
3 Some of R & D outputs, including some elegant mathematical research outputs may not have a specific application in improving productivity directly, but may have “spillovers” into an economy because the knowledge it produces may be useful not only to researchers in other fields, but also to businesses seeking to develop new products and production processes. But measuring these indirect effects in economic returns are extremely challenging since the progress that results from such research may be difficult to identify, or to value, and the time interval between the generation of the R&D output and its application to a product or process maybe long.
80 189 311
974724
2826
5676
6618
90
02
,000
4,0
006
,000
8,0
00
num
ber
of r
ese
arch
sci
ent
ists
an
d e
ngin
eer
s
Philippines Thailand Malaysia Singapore Indonesia
Source: 2017 ASEAN Community Progress Monitoring System Report.
Research scientists and engineers per million people
Earliest Year Latest Year

5
the private sector being the main driver of innovation as it responds to needs of its clients. In the innovation ecosystem, the role of government is in formulating policies and programs to encourage innovative behavior.
Firms face push factors (such as the need to remain competitive) and pull factors (largely the availability of talented skills at low cost, and size of the market) to engage in innovation (Gonzales, et al., 2010). Barriers to innovation in the country include the high cost of equipment and technology for innovation activities, as well as the lack of technical human resources/engineers. Micro, small and medium enterprises (MSMEs) should especially venture into innovation in order to be more productive and competitive4, but they often do not due to the lack of financial capital required for engaging in innovation activities (Llanto, 2010).
Studies on innovative activities in the country have consistently echoed these issues. Nearly two decades ago, a survey of Filipino firms engaged in food processing, textile and garments, metals and metal fabrication, chemicals, and electronics and electrical goods was undertaken, with the survey results suggesting that most firms that engaged in innovations were large firms with large assets (Macapanpan, 1999). Further, many of these firms reported that government was not an important factor for their conduct of innovation activities, and that government research institutions were poorly sources of innovation ideas. Firms also mentioned that financial as well as human resource constraints were their main barriers to conducing innovation activities. According to Macasaquit (2011), results of a survey of manufacturing establishments across the CALABARZON (Cavite, Laguna, Batangas, Rizal, and Quezon) area that was conducted by PIDS in 2008 suggested that Philippine firms undertake product and process innovations, but that linkages of these innovative firms with R&D institutions (such as universities and technology resource centers), and government agencies were weak. This should be a focus of attention as promoting more innovation activities, especially among MSMEs, entails linking knowledge generators and enterprise developers since innovation is a process by which new knowledge is transformed into new goods and new services. These research findings throughout the years were further validated in Albert et al., (2012), which described results of the pilot 2009 Survey of Innovation Activities, conducted by the Department of Science and Technology in cooperation with the PIDS and the then National Statistics Office5. This study also provided a conceptual framework on measuring innovation in the country. See also Patalinghug (2003) or Ancog and Aquino (2007) for a description of the structure and characteristics of the Philippine national innovation system. Hitherto, STRIDE (2014) provides the most recent and rather comprehensive assessment of the innovation ecosystem of the country.
4 Llanto and del Prado (2015) analyzed the determinants of innovation activity and subsequently, they found that innovation, particularly process innovation, is positively associated with increase in sales, profits and labor productivity. Using data for ASEAN member states including the Philippines, Harvie, Narjoko and Oum (2010) found that innovation is an important determinant of SME’s participation in global value chain because it is through product and process innovation (both product and process) that SMEs are able to meet the requirements of higher tier firms. 5 The National Statistics Office has been subsumed into the Philippine Statistics Authority (PSA), by virtue of the Philippine Statistical Act of 2013.

6
In an innovation ecosystem, firms and other economic agents develop new knowledge and transform these into new products, new processes, and new forms of organization, giving these products, processes and organizations economic use. Innovation may be supply pushed (based on new technological possibilities) or demand led (based on client needs and market requirements). Innovation results, however, do not necessarily depend on demand- and supply-side factors but also on the processes that link many different “actors” together in an innovation eco-system. Institutions and policies may influence the innovative behavior of firms, or their lack of it.
Fostering innovation in Philippine business and industry is a challenge given the constraints in the country that we work with: scarce resources (including requisite RSEs), competing aims of public policy, as well as institutional issues. For discussions on constraints in the local automotive industry regarding knowledge and technology transfer from their respective mother company units and other issues on weak network linkages, see Quimba and Rosellon (2011). Rosellon and Del Prado (2017a) explored the conduct of innovation without formal R&D by taking the case of 3 manufacturers in the garments industry. They find that without formal R&D, product and process innovation is still possible provided that appropriately skilled personnel and a supporting mechanism exists in the company. In another paper, a case study of two firms in the food manufacturing industry is given by Rosellon and Del Prado (2017b). The first firm had a strong partnership with its suppliers, supported by government and other innovation intermediaries, while the second firm, a large, locally-owned, export-oriented enterprise, engaged in innovation activities driven by specific need of its international customers. Despite the different drivers of innovation for the two firms, they commonly consider trade shows as important sources of knowledge and information. While Philippine transnational corporations (TNCs) which are relatively larger companies with more resources, augment their production capabilities by working closely with companies in their production network, Ledda and del Prado (2013) finds that the linkage with technology resource centers and government research institutions and universities is weak and lacks maturity. Linkages with government institutions and access to government support programs are critical for firms in the fruit juice processing industry to upgrade their production process (Rosellon and Yasay 2012). While many studies have focused on innovation activities of firms in the country, Serafica (2016), using the 2009 SIA, looked at service innovation across industries.
Critical to promoting innovation is innovation policy, which continues to be embedded within science and technology policy. In the Philippines, STI is merely viewed as providing a supporting role in the quest for economic and social development. Programs on STI have always being related to priority sectors in Philippine development plans, such as agriculture. Furthermore, STI plans, programs and policies do not appear to have been provided with required resources. Further, there is currently a dearth of studies on the impact of STI plans and interventions given the different thrusts across administrations (Ancog and Aquino 2007).
Innovation policy should eventually become mainstreamed into an overall strategy of continually transforming the country into a knowledge-based economy through concerted action in many different public policy arenas—including basic and higher education, trade and

7
investment, agriculture, services, ICT and finance. Stakeholders in both the public and private sectors need to have a firm understanding about current innovation practices in Philippine business and industry, in order to determine what would be pathways for fostering innovative behavior.
The World Bank (2010) provides a handbook for developing countries to help nurture Innovation Policy and the Innovation Ecosystem. It describes the innovation ecosystem, from actors, their roles and the context (Figure 1.3). It offers a rather comprehensive view of innovation policy, in which the government is considered as a gardener who “prepares the ground” (i.e. building up the human resources needed to drive innovation forward); “fertilizes the soil” (i.e. boosting Research and Development and access to most up-to-date-information); “waters the plant” (i.e., assists innovators by providing financial support and other measures to incentivize innovation); and “removes weeds and pests” (i.e., removes regulatory, institutional, or competitive obstacles to innovation).
Figure 1.3. Innovation Ecosystem in Developing Countries
Source: World Bank (2010)
In this discussion paper, we examine results of the 2015 Survey of Innovation Activities (SIA) conducted by the Philippine Institute for Development Studies (PIDS) with the assistance of the Philippine Statistics Authority (PSA). By doing so, this paper aims not only to establish national benchmarks on various indicators of innovation activities, but also provide empirical

8
basis for formulating a coherent set of policies that will foster innovation, as well as for assisting in mainstreaming an innovation-system approach in national policymaking. This paper is organized as follows. The next section firstly presents the sampling scheme behind the 2015 SIA, as well as the profile of establishments sampled for the 2015 SIA. The third section describes innovation activities engaged by firms in the Philippines. The discussion also includes a description of wider forms of innovation. The fourth section describes effects of innovation on firms, as well as the sources of information and cooperation for innovation activities. The fifth section discusses determinants of innovation, as well as barriers and bottlenecks to innovative behavior among firms. The section also examines factors driving or hindering innovation activities among establishments that were interviewed for both the 2015 SIA and the pilot 2009 SIA. The sixth section looks at support for firms in conducting innovation activities. The final section provides a summary of the key survey results and some key policy implications.

9
2 Sampling Scheme and Establishment Profile of 2015 SIA
2.1 A. Survey Objectives and Survey Plan
Similar to the pilot 2009 SIA, the 2015 SIA aims to generate information on the innovative behavior of establishments in the Philippines and to determine the factors that drive their innovation performance. The specific objectives of the 2015 SIA are to
(a) describe the types of innovations engaged in by firms; (b) provide information regarding the environments in which these innovative activities are conducted; (c) determine the factors that drive their innovation performance, the barriers to innovation, and the effects of innovation on the firms.
The survey results discussed in this report are expected to serve as inputs for mainstreaming innovation policy in the country.
The major data items collected from 2015 SIA include: (1) general information about the establishments, including economic activity, legal organization, economic organization, and the like; (2) capital participation by nationality of the stockholder; (3) employment by sex; (4) educational background of workers; (5) product innovation; (6) process innovation; (7) on-going or abandoned innovation activities; (8) sources of information and cooperation for 6 innovation activity; (9) effects of innovation activity; (10) factors hampering innovation activity; (11) intellectual property protection; (12) organizational innovation; (13) marketing innovation; (14) public sector procurement and innovation ; (15) registration with investment promotion agencies; (16) knowledge management; and, (17) government innovation-related policies.
The 2015 SIA utilizes a stratified simple random sample design with the 3-digit PSIC as the industry strata. The three island groups, namely Luzon, Visayas and Mindanao, the Negros Island Region, the National Capital Region (NCR), and nine provinces (Pangasinan, Quezon, Camarines Sur, Iloilo, Cebu, Leyte, Zamboanga del Sur, Davao del Sur and Sulu) serve as geographic domains.
The 2015 SIA involved targeting 1000 establishments for interview across the country with about half of the establishments having been previously surveyed in the 2009 SIA. The survey covered four major industries: (a) food manufacturing, (b) other manufacturing, and (c) information and communication technology (ICT), and (D) business process outsourcing (BPO). In the sampling frame, nearly 30 thousand (29536) establishments were covered across the four major industries and across employment size categories (see Table 2.1). This frame is extracted from the 2015 List of Establishments of the PSA, as of 29 February 2016. The latter categories cover micro, small, medium and large establishments that have employment sizes of less than 50, 50 to 99, 100 to 199, and, 200 and over, respectively.

10
Table 2.1. Distribution of Establishments in Frame by Industry and Employment Size Major Industry Groups Employment Size Category Total
Micro Small Medium Large
Food Manufacturing 8,103 (27.4%)
4,148 (14.0%)
227 (0.8%)
245 (0.8%)
12,723 (43.1%)
Other Manufacturing 3,419 (11.6%)
7,345 (24.9%)
676 (2.3%)
779 (2.6%)
12,219 (41.4%)
ICT 2,248 (7.6%)
1,317 (4.5%)
105 (0.4%)
123 (0.4%)
3,793 (12.8%)
BPO 105 (0.4%)
304 (1.0%)
67 (0.2%)
325 (1.1%)
801 (2.7%)
Total 13,875 (47.0%)
13,114 (44.4%)
1,075 (3.6%)
1,472 (5.0%)
29,536 (100.0%)
Note: Values in parentheses are weighted percentages.
Among the targeted establishments for interview, the PSA received 930 questionnaires from its field offices, of which 891establishments have provided good reporting (thus yielding an effective nonresponse rate of 10.9%), while 35 establishments have been reported as closed, moved-out, or refused to accomplish the questionnaire. The distribution of the 891 responding establishments by major sector and by employment size category is shown in Table 2.2. The weighted percentages are noticeably quite close to the corresponding percentages in Table 2.1.
Table 2.2. Distribution of Sample Establishments by Industry and Employment Size Major Industry Groups Employment Size Category Total
Micro Small Medium Large
Food Manufacturing 53 (28.6%)
60 (13.9%)
26 (0.7%)
41 (0.8%)
180 (44.0%)
Other Manufacturing 60 (11.7%)
157 (23.6%)
115 (2.2%)
141 (2.6%)
473 (40.1%)
ICT 63 (7.6%)
78 (5.6%)
25 (0.3%)
25 (0.4%)
191 (13.9%)
BPO 6 (0.4%)
4 (0.5%)
6 (0.2%)
31 (0.9%)
47 (2.0%)
Total 182 (48.3%)
299 (43.7%)
172 (3.4%)
238 (4.7%)
891 (100.0%)
Note: Values in parentheses are weighted percentages. Of the 891 establishments surveyed for the 2015 SIA, 232 of them were also interviewed in the 2009 SIA, forming a panel, thus enabling an examination of dynamics about innovation activities in the period 2009 to 2015, including identification of significant factors, both static and dynamic, that drive or prevent innovation in Philippine business and industry.
As in other establishment surveys, target respondents for the SIA are the owners and managers of the sampled establishments. Reference period for the 2015 SIA has been set for calendar year 2015, although employment data is as of 15 November 2015. The survey has been designed to be self-administered by the responding establishments. The 2015 SIA questionnaire slightly modifies the questionnaire used in the 2009 SIA, which, in turn, has been

11
adapted from the European Union’s Community Innovation Survey Version IV6. Modifications include extra questions about education background of workers, fiscal incentives given by investment promotion agencies, as well as innovation and public-sector procurement.
The PSA distributed and collected the 2015 SIA questionnaires from middle June 2016 to May 2017. As in typical conduct of surveys, pre-tests of the 2015 SIA instrument were conducted to determine whether the ease of understanding of questions by respondents. The PSA also conducted training activities on both field operations and data processing to ensure consistency in the collection of information from the respondent establishments, and uniformity in applying the data quality checks in data editing.
PSA staff performed manual editing and verification of the accomplished survey questionnaires before data entry. Completeness and consistency checks were also undertaken by the PSA. Data from the sampled establishments were weighted throughout this report by the authors to reflect the sampling frame. Survey weights were computed for all the firms based on the survey design and the information on the frame. For the panel data, however, no survey weights were computed, especially as the pilot innovation survey had a purposive survey design. PSA submitted final microdata files to PIDS on 23 May 2017.
While there are several geographic domains according to the survey design, we only provide here in this report aggregates for four major areas, viz., National Capital Region (NCR), Balance Luzon (i.e., Luzon without NCR), Visayas and Mindanao since the precision of estimates cannot be assured for all the geographic domains. Similarly, henceforth the report shows aggregates for four major industry groups, namely Food Manufacturing, Other Manufacturing, ICT and BPOs, rather than all the 38 industry strata as per survey design.
Results of the 2015 SIA should not be compared with those of the 2009 SIA, the latter being a pilot run, only involved targeting about 500 firms among four select study areas in three purposely chosen industries–food manufacturing, electronics manufacturing, and information and communication technology (ICT) –that were likely to practice innovative behavior. The 2015 PSIA, on the other hand, has been designed to be more nationally representative, with sampled firms chosen from four industries (food manufacturing, other manufacturing, ICT, and business process outsourcing), with twice the sample size of the 2009 SIA, and with all of the 2009 SIA firms targeted for interview in the 2015 SIA. In consequence, the results for the 2009 are merely descriptive of the responding firms, while those in 2015 may be inferred to a broader population of firms in the country. The results of the 2015 SIA are expected to serve as inputs in mainstreaming innovation policy for improving the innovation ecosystem.
2.2 General Information about the Targeted Firms
About two thirds (63.4%) of establishments are stock corporations, and three-tenths (29.4%) are single proprietorships. Stock corporations get an increasing share as the employee size of the firm increases. (Figure 2.1). Among micro establishments with fewer than 50 employees,
6 http://www.oecd.org/science/inno/40140021.pdf (2 August 2017)

12
slightly less than half (46.7%) are stock corporations (while the share of single proprietorships and cooperatives are 42.9 and 6.9 percent, respectively). For small firms that have 50 to 99 employees, three quarters (74.4%) are stock corporations (while a fifth are single proprietorships). For medium and large firms that have employment size 100 to 199, and 200 and above, respectively, nearly all (i.e. about 95 percent or more) are stock corporations.
Figure 2.1. Percentage Distribution of Establishments by Size and by Legal Organization.
About three-fifths of the firms are single establishments (see Figure 2.2), with the share of establishments that are single establishments varying by industry: food manufacturing (slightly over half), other manufacturing (about two thirds), ICT (about three-fifths) and in BPOs (close to three fourths).
About 70.3 percent of firms have been established during the past twenty years, about half of which were established in the last ten years (Figure 2.3). Most (43.5%) of micro-sized firms have been established in the past decade, while many small (33.7%), medium (38.6%) and large (40.9%) firms have been established after the last ten but before the last twenty years.
0.0
0.0
0.33.2
0.00.40.6
4.83.4
33.721.6
0.00.4
0.01.31.0
0.10.2
9.319.8
0 10 20 30 40percent
Others
Cooperative
Non-stock Corporation
Stock Corporation
Government Corporation
Partnership
Single Proprietorship
Source: 2015 Survey of Innovation Activities, Philippine Insitute for Development Studies
micro small medium large

13
Figure 2.2. Percentage Distribution of Establishments by Economic Organization.
Figure 2.3. Distribution of Establishments by Age and Size.
Geographic markets that establishments sold goods or services to in 2015 vary by area (Figure 2.4). Overall, about three-fifths of the firms have local markets, a third have national markets,
60.3%23.2%
16.5%
0.1%
Single establishmentBranch only
Establishment and main office
Main office only
Source: 2015 Survey of Innovation Activities, Philippine Institute for Development Studies
Distribution of Firms by Economic Organization
0
25
50
75
100
per
cent
by
size
0 20 40 60 80 100percent by age
0 to
10
yrs
11 to
20
yrs
21 to
30
yrs
over
30
yrs
age
large
medium
smallmicro
Source: 2015 Survey of Innovation Activities, Philippine Insitute for Development Studies

14
nearly one in twenty firms have markets in other ASEAN countries, while three in twenty have markets in countries outside ASEAN. Firms in Mindanao tend to cater less to international markets than those in Visayas and Luzon (outside NCR). Firms in NCR, largely have less local markets but more national markets than establishments in Balance Luzon (i.e. Luzon outside NCR), Visayas and Mindanao.
Figure 2.4. Percentage Distribution of Establishments by area and by geographic market.
As indicated in Table 2.3, the biggest concentration of capital/equity of firms is from local investors. Balance Luzon has the least average share of capital participation across the establishments among local investors at about 85.1 percent, with Japanese having the biggest share of non-local investors at 7.5 percent. Metro Manila is next to Balance Luzon in having the least share of local investors at 87.0 percent; in the NCR, the biggest share of non-local capital participation is by the Americans (at 4.4 percent) and the Chinese (at 3.2 percent). In Visayas, local share of capital/equity of firms averages to 89.6 percent, with Taiwanese (3.3 percent) and Japanese (2.8 percent) having the largest share of capital participation.
50.7
40.6
1.7
13.0
63.1
28.9
5.2
14.6
69.1
25.8
7.3
16.8
61.5
31.9
3.36.2
02
04
06
08
0p
erce
nt
NCR Luzon Visayas Mindanao
Source: 2015 Survey of Innovation Activities, Philippine Institute for Development Studies
Geographic Markets of Establishments, by Area
Local (within the region) National (within the country)
Other ASEAN countries All other countries

15
Table 2.3. Capital participation share across Nationality, by size of establishment and by major area (%).
EMPLOYMENT SIZE CATEGORY
NATIONALITY MAJOR AREA Philippines
NCR Luzon Visayas Mindanao Micro Filipino 90.6 98.4 98.3 98.4 96.5
American 0.7 0.0 0.0 0.0 0.2 British 0.4 0.0 0.0 0.0 0.1 Chinese 8.0 1.2 0.0 0.0 2.3 German 0.0 0.0 0.0 1.6 0.3 Japanese 0.1 0.1 0.6 0.0 0.2 Korean 0.1 0.0 0.3 0.0 0.1 Singaporean 0.0 0.0 0.0 0.0 0.0 Taiwanese 0.0 0.0 0.8 0.0 0.2 Others 0.1 0.2 0.0 0.0 0.1
Small Filipino 88.1 81.9 83.5 95.6 86.3 American 4.9 4.1 1.4 0.2 3.5 British 0.0 0.0 0.8 0.0 0.1 Chinese 0.4 0.8 0.5 0.0 0.5 German 0.0 0.0 0.0 0.0 0.0 Japanese 0.6 11.3 4.4 0.0 4.6 Korean 0.0 1.1 0.0 0.9 0.5 Singaporean 0.4 0.0 0.0 0.0 0.2 Taiwanese 1.5 0.3 7.3 0.5 1.8 Others 4.1 0.5 2.0 2.8 2.4
Medium Filipino 82.5 59.2 60.4 70.8 70.1 American 7.4 1.0 13.6 0.0 5.1 British 0.6 0.0 0.0 0.0 0.2 Chinese 4.9 0.1 4.2 7.3 3.3 German 0.0 0.0 0.0 0.0 0.0 Japanese 1.5 22.8 11.5 21.9 12.5 Korean 0.1 6.0 0.0 0.0 2.3 Singaporean 0.2 0.0 0.0 0.0 0.1 Taiwanese 0.0 4.6 0.0 0.0 1.7 Others 2.8 6.2 10.3 0.0 4.8
Large Filipino 58.5 23.4 34.4 87.7 41.0 American 19.7 9.0 10.3 0.0 12.7 British 2.0 2.5 3.0 0.0 2.3 Chinese 0.0 8.9 8.4 0.0 5.2 German 1.2 4.9 9.1 0.0 3.9 Japanese 1.0 26.3 15.0 6.3 14.4 Korean 3.1 14.2 0.0 0.0 7.3 Singaporean 4.6 1.4 0.0 0.0 2.3 Taiwanese 0.0 3.4 5.1 0.0 2.2 Others 9.9 5.9 14.7 5.9 8.7
All sizes Filipino 87.0 85.1 89.6 96.6 88.2 American 4.4 2.4 1.2 0.1 2.5 British 0.3 0.2 0.4 0.0 0.2 Chinese 3.2 1.5 0.6 0.2 1.7 German 0.1 0.3 0.4 0.9 0.3 Japanese 0.5 7.5 2.8 0.6 3.3 Korean 0.2 1.6 0.2 0.4 0.7 Singaporean 0.5 0.1 0.0 0.0 0.2 Taiwanese 0.8 0.5 3.3 0.2 1.1 Others 3.0 0.9 1.5 1.2 1.7
Source: 2015 Survey of Innovation Activities, Philippine Institute for Development Studies
Among micro establishments, capital participation comes nearly entirely (at 96.5 percent) from local investors. Among small establishments, local investors still dominate capital

16
participation, but across areas, the distribution varies, with Filipinos having a range of 81.9 percent (in Balance Luzon) to 95.6 percent of capital in Mindanao. Among medium establishments, the dominant investors are Filipinos, Japanese and Americans with the Japanese outranking Americans in Balance Luzon and Mindanao at about 20 percent capital participation as against 1 percent or less for the Americans; while the Americans have similar shares to Japanese in Visayas, and have a more substantial share than the Japanese in Metro Manila. Among large firms, Filipinos have an average of 41.0 share of capital, with both the Japanese (14.4) and Americans (12.7) at over 10 percent, but when examining distributions across areas as well. For large firms, Japanese (26.3%) even have a higher capital share in Balance Luzon than Filipinos (23.4%); Americans have 17.7 percent capital shares in Metro Manila (where Filipinos have 58.5 percent share); in Visayas, capital shares are about 10 percent or over from Japanese, Americans, Germans, and Chinese (while Filipinos have 34.4 percent share), while in Mindanao where Filipinos have the largest share at 87.7 percent, the Japanese have 6.3 percent capital share among large firms.
Franchising is rare, with only 2.0 percent of establishments being franchises, and with the rate roughly similar across areas (Figure 2.5). Franchises tend to be concentrated in the food manufacturing industry, which has fourth-fifth (82.9%) of all franchises, of which 71.8 percent and 27.6 percent are respectively micro and small establishments (Figure 2.6). A tenth (12.8%) of firms that franchise is in ICT, of which, half (53.3%) and a third (35.5%) are small and micro establishments, respectively.
Figure 2.5. Percentage of Establishments that are franchises, by area.
2.5 97.5
2.0 98.0
1.7 98.3
2.1 97.9
Mindanao
Visayas
Luzon
NCR
Source: 2015 Survey of Innovation Activities, Philippine Institute for Development Studies
franchise
not a franchise

17
Figure 2.6. Percentage of Franchised Establishments, by industry and employment size.
Overall, the female share of employment among establishments is about half (48.2%) across the country with the percentage of women among employees in major areas ranging from 35.7% in Mindanao to 45.3 % in Balance Luzon (Figure 2.7)
Figure 2.7. Share of Employment in Establishments by sex and by area.
Significant variations in labor share of women are observed across size of the establishment and major industry (Table 2.4). Among BPO establishments, 55.2 percent of total employees are female, with micro and medium-sized BPO firms having a female share of employment of
0
25
50
75
100
per
cent
by
ma
jor
indu
stry
gro
up
0 20 40 60 80 100percent by employment size category
micr
osm
all
med
iumlarge
employment size category
ICT
Other Manufacturing
Food Manufacturing
Source: 2015 Survey of Innovation Activities, Philippine Institute for Development Studies
55.2
44.8
47.9
52.1
48.8
51.2
61.9
38.1
02
04
06
08
01
00p
erce
nt
NCR Luzon Visayas Mindanao
Source: 2015 Survey of Innovation Activities, Philippine Institute for Development Studies
malefemale

18
more than 70 percent while small and medium sized BPO establishments having women occupying less than 60 percent more than half of their workforce. Establishments engaged in food manufacturing employ substantially fewer females than males (less than two-fifths female share of employment, especially among micro- medium and larger firms). Large establishments engaged in other manufacturing have about three-fifths of females among their total employment. ICT firms also have about their female share of total employment at around two-fifths.
Table 2.4. Female Share of Total Employment, by Industry and Employment Size (%). Major Industry Employment Size
Micro Small Medium Large Total Food Manufacturing
38.3 40.4 35.9 29.1 35.7
Other Manufacturing
33.7 34.6 36.0 60.0 49.5
ICT 40.0 34.6 41.0 46.0 43.3BPO 75.6 59.2 72.3 54.8 55.2All Industries 38.0 36.9 38.7 53.5 48.2
Source: 2015 Survey of Innovation Activities, Philippine Institute for Development Studies
About two thirds (57.5%) of establishments have no employees with post-baccalaureate degrees, with the share of firms going from a low of 25.2 percent among large establishments to as high as 63.2 percent among micro-sized firms (Figure 2.8).
Figure 2.8. Percentage of Establishments that have Employees with a Post-Baccalaureate Degree by Employment Size.
63.19
16.48
4.95
15.38
41.81
26.76
11.71
19.73
33.72 34.88
13.37
18.02
25.21
46.22
13.4515.13
02
04
06
0p
erce
nt
micro small medium large
Source: 2015 Survey of Innovation Activities, Philippine Institute for Development Studies
Firrms that have Workers with Post Baccalaurate Degree by Employment Size
none 1-9%
10-19% over 20%

19
3 Innovation Activity in Philippine Business and Industry
The 2015 SIA asks surveyed establishments a set of questions to probe on the activities conducted by the firms, the level of effort employed and the achievement of new or improved products and/or processes. In this report, establishments are defined as innovation active if they are
(a) product innovators that introduced new or significantly improved products, i.e., goods and/or services; (b) process innovators that introduced (i) new or significantly improved methods of manufacturing or producing goods or services; (ii) new or significantly improved logistics, delivery or distribution methods for your inputs, goods and services; (iii) new or significantly improved supporting activities for your processes, such as maintenance systems or operations for purchasing, accounting, or computing; (c) engaged in innovation projects that are either not yet complete or abandoned; (d) engaged in expenditure of innovation activities for (i) internal or outsourced R&D; (ii) training; (iii) acquisition of external knowledge machinery, equipment or software linked to innovation activities; (iv) market introduction of innovations; and, (v) other preparations to implement innovations.
Tables 3.1, 3.2 and 3.3 provide key statistics on innovation activity in 2015 by size, by major sector, and by area, respectively. Overall, about two-fifths (42.9%) of establishments in the country have been innovation active in 2015. Large establishments are more likely to conduct innovation, with about two thirds (63.0%) being innovation active, as compared to a third among micro-sized firms (33.9%), and about half for small (49.6%) and medium (46.1%) establishments. Across the country, about three in ten (30.7%) establishments are product innovators (30.7 per cent), and this rate is about similar to the proportions of process innovators (30.6 per cent). Of those establishments that have had product innovations, a bigger share also are process innovators. Among establishments that have had process innovations, a smaller share of these firms has had process innovations alone. About one in ten establishments (9.2%) have had projects to develop product or process innovations that had to be abandoned in 2015, while about three out of ten firms (30.3%) have innovation projects that were ongoing up to the end of 2015. The larger the firm size, the more likely that it innovates. Even average expenditures in innovation activities tend rise with the size of establishments. On average, firms have spent 2.9 million pesos for 2015 on innovation activities, with large firms, on average, spending 10 times (30.5 million pesos) than the average spending of all establishments. In relation to total sales, this spending on innovation represents only less than 5 percent of total gross sales, whereas micro-sized establishments have spent, on average, about 208 thousand pesos on innovation activities in 2015, which represents about 9.8 percent of their total gross sales on innovation activities. Only one in thirty (3.1%) establishments have mentioned public support for their innovations with the rate higher among small-sized and large firms than micro and medium-size ones. For wider forms of innovation, organizational innovation is practiced by a third (33.5%) of micro-sized firms and as much as half (53.1%) of large firms. Similarly, a bigger share of large firms (43.3%) than micro-side firms (37.2%) conducts marketing innovation. Overall, two fifth (18.4%) have had some awareness of any government innovation

20
policy or intervention, with a bigger share among large (29.9%) firms being aware of innovation policy than the corresponding share among SMEs (17.8%). More than two fifths (42.5%) of firms practiced knowledge management, especially medium (58.8%) and large (64.4%) firms.
Table 3.1. Key Statistics on Innovation Activity by Size of Establishments. Micro Small Medium Large All firms
Proportion (%) of establishments that are/have: Innovation active 33.9% 49.6% 46.1% 63.0% 42.9%Product innovators 26.8% 33.7% 30.0% 39.3% 30.7%
Of which share with new-to-market products 18.8% 22.7% 18.6% 23.0% 20.8%
Process innovations 22.9% 36.5% 35.7% 46.8% 30.6%Of which share of those that developed process innovation within the establishment or enterprise 22.1% 36.2% 34.4% 44.1% 30.0%
Both product and process innovators 21.1% 26.8% 26.6% 34.0% 24.5%Either product or process innovator 28.6% 43.4% 39.0% 52.1% 36.8%Ongoing innovation activities 19.7% 38.4% 36.3% 50.7% 30.3%Abandoned innovation activities 8.4% 9.8% 5.3% 15.5% 9.2%Innovation-related expenditure 21.4% 30.2% 29.3% 43.4% 26.7%
Memo Notes: Average annual expenditures for innovation activities (in '000 PhP) 208.6 2392.2 7547.4 30494.0 2935.8Proportion of expenditure on innovation from total gross sales 9.8% 2.8% 1.6% 2.9% 5.6%
Proportion (%) of establishments that are/have: Public financial support for innovation 1.4% 4.9% 1.2% 3.7% 3.1%Innovation co-operation 11.8% 23.1% 20.4% 20.1% 17.6%Organizational innovations 33.5% 39.6% 41.4% 53.1% 37.5%
Memo Notes: Average percentage of employees affected by establishment's organizational innovations 59.5% 49.0% 46.9% 54.6% 53.7%
Proportion (%) of establishments that are/have: Marketing innovators 37.2% 38.7% 36.3% 43.3% 38.1%With knowledge management practices 34.8% 46.7% 58.8% 64.4% 42.5%Aware of any government innovation policy or intervention 15.1% 20.1% 25.1% 29.9% 18.4%
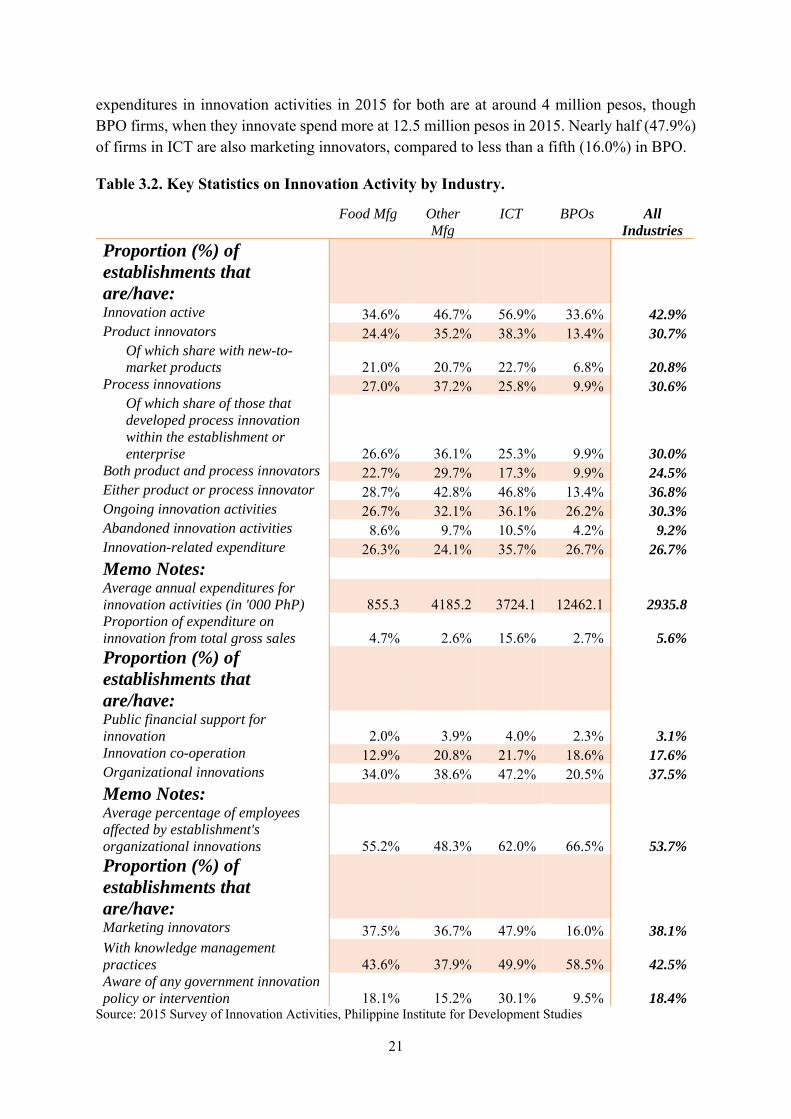
Source: 2015 Survey of Innovation Activities, Philippine Institute for Development Studies Across industries, establishments in ICT and manufacturing of goods other than food are the most innovation active with a rate of 45 percent or above (Table 3.2). In addition, average
21
expenditures in innovation activities in 2015 for both are at around 4 million pesos, though BPO firms, when they innovate spend more at 12.5 million pesos in 2015. Nearly half (47.9%) of firms in ICT are also marketing innovators, compared to less than a fifth (16.0%) in BPO.
Table 3.2. Key Statistics on Innovation Activity by Industry.
Food Mfg Other Mfg
ICT BPOs All Industries
Proportion (%) of establishments that are/have: Innovation active 34.6% 46.7% 56.9% 33.6% 42.9%Product innovators 24.4% 35.2% 38.3% 13.4% 30.7%
Of which share with new-to-market products 21.0% 20.7% 22.7% 6.8% 20.8%
Process innovations 27.0% 37.2% 25.8% 9.9% 30.6%Of which share of those that developed process innovation within the establishment or enterprise 26.6% 36.1% 25.3% 9.9% 30.0%
Both product and process innovators 22.7% 29.7% 17.3% 9.9% 24.5%Either product or process innovator 28.7% 42.8% 46.8% 13.4% 36.8%Ongoing innovation activities 26.7% 32.1% 36.1% 26.2% 30.3%Abandoned innovation activities 8.6% 9.7% 10.5% 4.2% 9.2%Innovation-related expenditure 26.3% 24.1% 35.7% 26.7% 26.7%
Memo Notes: Average annual expenditures for innovation activities (in '000 PhP) 855.3 4185.2 3724.1 12462.1 2935.8Proportion of expenditure on innovation from total gross sales 4.7% 2.6% 15.6% 2.7% 5.6%
Proportion (%) of establishments that are/have: Public financial support for innovation 2.0% 3.9% 4.0% 2.3% 3.1%Innovation co-operation 12.9% 20.8% 21.7% 18.6% 17.6%Organizational innovations 34.0% 38.6% 47.2% 20.5% 37.5%
Memo Notes: Average percentage of employees affected by establishment's organizational innovations 55.2% 48.3% 62.0% 66.5% 53.7%
Proportion (%) of establishments that are/have: Marketing innovators 37.5% 36.7% 47.9% 16.0% 38.1%With knowledge management practices 43.6% 37.9% 49.9% 58.5% 42.5%Aware of any government innovation policy or intervention 18.1% 15.2% 30.1% 9.5% 18.4%
Source: 2015 Survey of Innovation Activities, Philippine Institute for Development Studies

22
Among major areas in the country, Mindanao and NCR have the biggest share of firms that are innovation active with a rate of 45 percent or above (Table 3.3).
Table 3.3. Key Statistics on Innovation Activity by Area.
NCR Balance Luzon
Visayas Mindanao All Areas
Proportion (%) of establishments that are/have: Innovation active 46.7% 39.4% 36.6% 50.2% 42.9%Product innovators 31.8% 30.1% 27.5% 33.4% 30.7%
Of which share with new-to- market products 24.4% 17.5% 19.1% 22.5% 20.8%
Process innovations 28.5% 28.8% 31.9% 38.2% 30.6%Of which share of those that
developed process innovation within the establishment or enterprise 28.4% 27.7% 31.8% 36.3% 30.0%Both product and process innovators 21.0% 24.8% 25.2% 30.5% 24.5%Either product or process innovator 39.4% 34.0% 34.3% 41.0% 36.8%Ongoing innovation activities 33.8% 25.9% 21.4% 43.9% 30.3%Abandoned innovation activities 6.9% 14.5% 6.7% 5.1% 9.2%Innovation-related expenditure 30.7% 24.8% 15.0% 36.8% 26.7%
Memo Notes: Average annual expenditures for innovation activities (in '000 PhP)
3609.646 3883.179 1868.192 579.2567 2935.826
Proportion of expenditure on innovation from total gross sales 7.4% 5.4% 4.8% 2.9% 5.6%
Proportion (%) of establishments that are/have: Public financial support for innovation 0.6% 3.8% 6.3% 3.0% 3.1%Innovation co-operation 21.3% 9.4% 19.4% 26.4% 17.6%Organizational innovations 33.5% 37.2% 40.6% 43.1% 37.5%
Memo Notes: Average percentage of employees affected by establishment's organizational innovations 52.7% 46.6% 65.3% 57.2% 53.7%
Proportion (%) of establishments that are/have: Marketing innovators 33.9% 34.6% 49.2% 41.8% 38.1%With knowledge management practices 42.1% 37.4% 43.4% 53.9% 42.5%Aware of any government innovation policy or intervention 14.1% 15.4% 30.9% 19.7% 18.4%
Source: 2015 Survey of Innovation Activities, Philippine Institute for Development Studies Mindanao also has the biggest share of firms with knowledge management (53.9%) though it had the least expenditures for innovation in both levels (580 thousand pesos) and in relative terms (2.9% of gross sales. Visayas has the least proportion of firms that are innovation active at 36.6 percent, and the least proportion of product innovators (at 27.5 %) but the biggest share of firms with public financial support for innovation (6.3%) and the largest percentage of firms

23
at 49.2 percent that are marketing innovators as well as the biggest proportion of establishments at 30.9 percent that are aware of any government innovation policy or intervention across areas.
In 2015, a quarter (26.7%) of establishments had some innovation-related expenditure. Among these firms, the most commonly reported activities were in investment in internal or external training activities for the development and/or introduction of new products or processes. This was followed by acquisition of machinery, equipment or software. Both these activities were undertaken by more than half of the innovative firms. For large firms, more than two-fifths (43.4%) had spent on innovation activities. Half (47.1%) of these large innovative firms undertook in-house R&D. As much as three-fourth (74.0) of large innovative firms spent on training, while about two-thirds (65.3%) spent on either machinery, equipment or software. The bulk of these acquisitions were on machinery. Half (47.9%) of large firms spent on in-house or sub-contracted activities to design or alter the shape of appearance of goods or services.
Figure 3.1. Proportion of establishments that spent on various innovation-related activities (%), by activity and by size of establishment.
As shown in Figure 3.2, the share of firms that are innovation-active vary considerably across industry groups, with large firms tending to be more innovation active than small firms. In manufacturing, whether food manufacturing or other manufacturing, about two-fifths (40.7%) of firms are innovation active, but only less than a third (31.6%) of micro-sized firms are innovation active, while among small and medium-sized firms, half are innovation active, and 70.5 percent of large firms are innovation active. Among ICT firms where more than half
39.3
18.5
52.3
18.8
50.9
35.539.4
27.9
49.5
25.3
47.5
18.8
57.1
46.5
36.1
29.7
52.2
8.5
59.6
15.8
55.0
33.4
39.837.5
47.1
22.0
65.3
29.3
74.0
33.0
47.943.0
02
04
06
08
0
micro small medium large
Source: 2015 Survey of Innovation Activities, Philippine Institute for Development Studies
Innovation Activities by Size of Establishment
In-house R & D Outsourced R & D
Acquisition of machinery, equipment & software Acquisition of other existing knowledge
Training Market Introduction of Innovation
Design Others

24
(56.9%) are innovation active, half of micro-sized firms are innovation-active, compared to two-thirds of small, medium and large establishments that are innovation active.
Figure 3.2. Proportion of establishments that are innovation-active by industry and by size of establishment (%).
In 2015, a third (34.9%) of innovation active firms filed for intellectual property rights (IPRs), especially in claiming a brand name or registering a trademark (Table 3.4). The filing of IPRs is five to more than twenty times higher among innovation active establishments than among firms that did not innovate.
Table 3.4. Percentage of Establishments that filed for Intellectual Property Rights, by Innovation Activity Status
Intellectual Property Rights (IPR)
Innovators Non-Innovators All Firms
Apply for patent 12.1 1.5 6.0 Register trademark 19.5 4.3 10.8 Claim copyright 10.0 0.5 4.6 Register utility model 8.8 0.4 4.0 Register design 9.7 1.8 5.2 Claim brand name 26.7 5.5 14.6 At least one form of IPR 34.9 9.0 20.1
Source: 2015 Survey of Innovation Activities, Philippine Institute for Development Studies Innovation involves the development or use of technology or other forms of product or process change. A wide sense of innovation comprises implementation of organizational innovation (which comprises new organizational approaches in their business practices, workplace organization or external relations) or marketing innovation (i.e., the implementation of a new
39.2
21.5
48.1
2.3
63.8
55.3
67.8
47.4
69.5
40.6
50.3
35.5
73.7
66.1
39.9
29.9
0 20 40 60 80proportion of firms that are innovactive-active (%)
BPO
ICT
Other Manufacturing
Food Manufacturing
Source: 2015 Survey of Innovation Activities, Philippine Institute for Development Studies
micro small medium large

25
marketing method involving significant changes in product design or packaging product placement, product promotion or pricing). Often, a wider form of innovation is implemented in conjunction with product or process innovation, but also as an independent means of improving competitiveness and productivity. As might be expected, a greater proportion (53.7 percent) of large firms compared to MSMEs (36.7 percent) engage in organizational changes (Figure 3.3). Across major industries, the difference between the rates of SMEs and large establishments that have introduced organizational innovation is largest at 28.6 percentage points in ICT firms.
Figure 3.3. Proportion of among MSMEs and large establishments, by industry and organizational innovation status (%).
As regards marketing innovation, about two-fifths (38.9 %) of establishments engage in marketing innovation, with large-size firms in food manufacturing (55.7 %) taking the lead in implementing marketing innovation, while MSMEs in the BPO industry (5.8%) having the lowest rate of conduct of marketing innovation (Figure 3.4).
10.4
33.1
46.4
75.0
37.4
56.1
33.5
58.2
89.6
66.9
53.6
25.0
62.6
43.9
66.5
41.8
0 20 40 60 80 100percent
BPO
ICT
Other Manufacturing
Food Manufacturing
BPO
ICT
Other Manufacturing
Food Manufacturing
Source: 2015 Survey of Innovation Activities, Philippine Institute for Development Studies
large msme
Organizational Innovator
Not an Organization Innovator

26
Figure 3.4. Proportion of establishments across industry by size and marketing innovation status (%).
In 2015, about a fifth (17.4 %) of establishments undertook (product, process, marketing or organizational) innovation as part of a procurement contract to provide goods and services to a public-sector organization, of which a third (35.7%) did so as the innovation was required from the procurement contract. Among BPO firms, as much as a quarter (23/7%) engaged in innovation as part of a government procurement contract, but the bulk of these innovation activities (87.8%) was not required from the contract (Figure 3.5). On the other hand, only 13.3 percent of food manufacturing establishments had innovation activities arising from government contracts, but as much as two-fifths (41.2%) of which required innovation as part of the procurement contract.
5.8
48.1
37.2
37.8
28.7
43.4
45.5
55.7
94.2
51.9
62.8
62.2
71.3
56.6
54.5
44.3
0 20 40 60 80 100percent
msme
large
msme
large
Source: 2015 Survey of Innovation Activities, Philippine Institute for Development Studies
Food Manufacturing Other Manufacturing
ICT BPO
Marketing Innovator
Not Marketing Innovator

27
Figure 3.5. Proportion of SMEs and large establishments that undertook innovation activities as part of a procurement contract to provide goods or services to a public-sector organization (%), by industry.
5.77.8 86.5
16.4 83.6
7.1 12.4 80.5
9.2 17.2 73.6
6.3 15.6 78.1
5.011.2 83.8
1.0 28.9 70.1
5.5 11.4 83.0
0 20 40 60 80 100 0 20 40 60 80 100
msme
large
msme
large
1
0
1
0
Food Manufacturing Other Manufacturing
ICT BPO
innovation required as part of procurement contractinnovation not required as part of procurement contract
none
percent of firms that undertook innovation as part of government contract
Source: 2015 Survey of Innovation Activities, Philippine Institute for Development Studies

28
4 Effects and Sources of Innovation
As in the pilot 2009 SIA, the 2015 SIA sought information about the perceived effects of product and process innovation on firms. Respondents were asked to rank a number of likely effects of innovation on a scale from ‘not relevant’ (4), through ‘low’ (3), ‘medium’ (2) or ‘high’ (1) perceived effects. Table 4.1 provides the percentage of innovation-active firms who answered ‘high’ in each category. Perceived effects among organizational innovator, and marketing innovators are found in Tables 4.2 and 4.3, respectively.
Perceived effects of product and process innovation varied across industry and size of firms (Table 4.1). Among MSMEs in food manufacturing, half of innovators considered highly the product innovation effects in terms of increasing the range of goods and services, while half of establishments engaged in manufacturing goods other than food rated highly the effect of product on improved quality of goods or services. Also, half of MSMEs in ICT rating highly all product innovation effects. Among large-sized firms engaged in BPO, four-fifths also rated highly all product innovation effects, while nearly all highly rated process innovation effects to include improved flexibility of production or service provision, and increased capacity of production or service provision. Only one in twenty MSMEs in ICT highly considered the effect of process innovations in terms of reduced materials and energy per unit output. A similar low proportion of MSMEs in ICT rated innovation effects in terms of reduced environmental impacts or improved health and safety, as well as met regulatory requirements.
Similarly, the perceived effects of organizational innovation (Table 4.2) and those of marketing innovation (Table 4.3), according to corresponding innovators, varied across industry and size of firms. While about two thirds or more of firms in food manufacturing, ICT and BPO, regardless of size, highly perceived the effect of organizational innovation in improved quality of goods or services, but among other manufacturing establishments, this was highly regarded by two thirds of MSMEs but only a third of large firms. Half of MSMEs in food manufacturing, three fifths of ICT firms, and four fifths of large firms in ICT also highly viewed organizational innovation as affecting improved employee satisfaction and/or lowered employee turnover. Half of MSMEs in food manufacturing and two thirds of MSMEs in BPO highly considered organizational innovation as affecting increased ability to develop new products or processes. Three fifths of large firms in ICT, half of large firms in BPOs and about half of firms in food manufacturing (regardless of size) highly considered improved communication or information sharing as an effect of organizational innovation.
As regards marketing innovators, about half or more of food manufacturing firms (regardless of size), about three quarters of large firms in BPO, and more than half of large ICT firms had a high regard for all identified effects of marketing innovations (sales growth for its goods and services; increased visibility of products or business; reduced costs per unit output; improved customer satisfaction). Only less than a fifth of MSMEs in ICT highly viewed the effect of marketing innovation in sales growth for its goods and services; reduced costs per unit output; and improved customer satisfaction.

29
Table 4.1. Proportion of Innovation-Active Establishments that rate Effects of Product and Process Innovation as ‘high’ (%), by Major Sector and by Size of Firm (%).
Perceived Effects of Product and Process Innovation
Food Manufacturing Other Manufacturing ICT BPO All Industries MSME Large All
firms MSME Large All
firms MSME Large All
firms MSME Large All
firms MSME Large All
firms Product oriented effects
Increased range of goods or services
50.9 38.3 38.7 37.9 42.5 42.2 46.0 32.9 33.4 51.6 81.5 56.6 43.1 39.4 39.6
Entered new markets or increased market share
27.0 28.6 28.6 24.8 32.5 31.9 46.0 19.7 20.7 30.7 81.5 39.2 28.4 28.9 28.9
Improved quality of goods or services
36.9 29.1 29.4 49.4 51.0 50.9 46.0 28.7 29.3 30.7 81.5 39.2 44.1 39.5 39.8
Process oriented effects
Improved flexibility of production or service provision
31.4 20.9 21.4 42.6 36.0 36.6 5.5 28.4 27.7 46.5 97.4 71.0 37.7 29.9 30.4
Increased capacity of production or service provision
35.5 32.3 32.4 45.6 32.2 33.4 34.7 26.7 27.0 44.5 97.4 69.9 42.6 31.7 32.5
Reduced labor costs per unit output
26.3 15.9 16.3 33.2 16.7 18.2 34.7 21.6 22.0 44.5 11.4 28.6 33.6 17.3 18.5
Reduced materials and energy per unit output
18.3 19.4 19.4 31.2 19.0 20.1 5.5 13.1 12.9 40.2 11.4 26.4 27.7 17.9 18.6
Other effects
Reduced environmental impacts or improved health and safety
26.3 17.0 17.4 40.2 21.7 23.4 5.5 16.3 15.9 40.2 11.4 26.4 34.5 18.9 20.0
Met regulatory requirements
34.2 21.7 22.2 44.9 24.8 26.7 6.1 18.7 18.3 44.5 11.4 28.6 39.4 22.4 23.6
Source: 2015 Survey of Innovation Activities, Philippine Institute for Development Studies

30
Table 4.2. Percentage of Organizational Innovators that rate effects of Organizational Innovation as ‘high’ by Major Sector and by Size of Firm (%)
Perceived Effects of Organizational Innovation
Food Manufacturing Other Manufacturing ICT BPO All Industries
MSME Large All firms
MSME Large All firms
MSME Large All firms
MSME Large All firms
MSME Large All firms
Reduced time to respond to customer or supplier needs 46.0 32.9 33.3 43.5 22.5 24.5 41.4 39.9 40.0 63.3 34.3 55.1 46.4 29.9 31.1 Improved quality of goods or services 58.4 66.9 66.7 65.7 37.8 40.4 62.2 67.1 66.9 63.3 88.0 70.3 63.6 55.0 55.6 Reduced costs per unit output 54.8 34.1 34.8 33.3 24.5 25.3 41.4 33.0 33.4 36.7 34.3 36.0 38.5 29.9 30.5 Improved employee satisfaction and/or lower employee turnover 50.0 42.2 42.4 33.0 24.3 25.1 55.6 57.5 57.4 20.9 83.1 38.4 37.1 37.8 37.7 Improved communication or information sharing 47.8 48.6 48.6 40.0 29.8 30.7 23.3 60.6 58.9 36.7 51.2 40.8 38.8 43.1 42.8 Increased ability to develop new products or processes 54.2 36.2 36.8 36.1 33.0 33.3 6.2 49.0 47.0 68.4 51.2 63.5 40.0 37.3 37.5 Others 24.1 0.0 0.8 0.0 2.0 1.8 0.0 0.1 0.0 0.0 0.0 0.0 4.2 0.9 1.1
Source: 2015 Survey of Innovation Activities, Philippine Institute for Development Studies
Table 4.3. Percentage of Marketing Innovators that rate effects of Marketing Innovation as ‘high’, by Major Sector and by Size of Firm (%)
Perceived Effects of Marketing Innovation
Food Manufacturing Other Manufacturing ICT BPO All Industries
MSME Large All firms
MSME Large All firms
MSME Large All firms
MSME Large All firms
MSME Large All firms
Sales growth for its goods and services 52.9 50.9 50.9 49.1 48.2 48.2 16.1 57.0 55.9 42.4 74.2 48.8 46.0 51.0 50.7 Increased visibility of products or business 43.0 53.1 52.9 51.3 33.3 34.7 58.9 55.7 55.8 36.6 78.5 45.1 48.2 45.9 46.0 Reduced costs per unit output 52.9 47.4 47.5 48.1 50.4 50.2 16.1 66.1 64.7 42.4 74.2 48.8 45.4 52.1 51.7 Improved customer satisfaction 62.2 69.5 69.3 53.3 59.4 58.9 16.1 61.7 60.5 42.4 74.2 48.8 50.2 64.1 63.3 Others 0.0 0.0 0.0 0.0 0.0 0.0 0.0 0.9 0.9 0.0 57.0 11.6 0.0 0.3 0.3
Source: 2015 Survey of Innovation Activities, Philippine Institute for Development Studies

31
Introducing innovation in a firm is a complex process that requires coordination of multiple inputs. Firms can gain technical advice, guidance or some inspiration for their innovation activities from several of sources of information. These sources of technology, innovation-related knowledge and information maybe internal (i.e., from within the establishment itself or from other establishments within the enterprise) or external. The latter may be categorized as followed:
Market: from suppliers, customers, clients, consultants, competitors, other businesses, commercial laboratories or private research and development institutes;
Institutional: from the public sector such as government research organizations and academia;
Other sources: from conferences, trade fairs, exhibitions, scientific journals, trade/technical publications, professional or industry associations or technical, industry or service standards.
In the 2015 SIA, as in the 2009 SIA, establishments were asked to rank several potential information sources on a scale from ‘no relationship’ (4) to ‘high importance’ (1). The proportion which answered ‘high’ in each category is shown in Table 4.4.
Table 4.4. Proportion of MSMEs and Large establishments rating information sources as of ‘high’ importance, by size of establishment (%)
Information Source MSMEs Large Firms
All Firms
1. Internal a. Within your establishment or enterprise 9.1 32.3 10.22. Market source a. Suppliers of equipment, materials,
components, or software 7.5 16.1 7.9
b. Clients or customer 14.1 19.8 14.3c. Competitors or other enterprise in your
sector 8.7 9.0 8.7
d. Consultants, commercial laboratories, or private R&D institutes
3.5 6.7 3.6
3. Institutional source
a. Universities or other higher education institutions
1.9 3.7 1.9
b. Government or public research institutes
1.1 2.6 1.2
4. Other source a. Conferences, trade fairs, exhibitions 5.9 10.8 6.2b. Scientific journals and trade/technical
publications 2.0 7.1 2.2
c. Professional and industry associations 3.5 8.7 3.8Source: 2015 Survey of Innovation Activities, Philippine Institute for Development Studies Most establishments reported internal sources (10.2%) and market sources, especially clients (14.3%) and competitors (8.7%) as the most important sources for information on innovation. A third (32.3%) and a fifth (19.8%) of large firms respectively rated internal sources and customers as highly important for innovation, while among SMEs, the corresponding proportions were a tenth (9.1%) and three-twenties (14.1), respectively. Thus, firms mostly rely on their own experience and knowledge coupled with information from customers and competitors. Institutional sources of innovation and knowledge, particularly government

32
(1.2%) or public research institutes (1.9%), were considered by firms, both MSMEs and large firms, to be of lowest importance on information on innovation.
Nearly half (46.3%) of innovation active firms are engaged in innovation cooperation with other establishments or non-commercial institutions. The proportion of innovators across industries with innovation cooperation ranges from 41.0 percent in food manufacturing to 66.8 percent in BPOs. Innovation cooperation is higher among innovation active MSMEs than the corresponding large firms, with cooperation highest among BPO MSMEs at 88.2 percent (Figure 4.1).
Figure 4.1. Percentage of Innovation-active MSMEs and Large establishments with Cooperation Arrangements on Innovation Activities, by Major Industry
Among innovation active collaborators, most had agreements that operated at a national level, firms were least likely to cooperate on an ‘other ASEAN level. As shown in Table 4.5, the most frequent partners for co-operation among innovation active firms were suppliers (93.2 percent), followed by other establishments within the enterprise (89.8 per cent) and clients in the private sector (85.2 per cent). The least likely co-operation arrangement was with government organizations (60.4 per cent) and universities (63.7 per cent)
21.3
41.837.5
49.846.8
48.9
38.8
88.2
02
04
06
08
0
perc
ent
Food Manufacturing Other Manufacturing ICT BPO
Source: 2015 Survey of Innovation Activities, Philippine Institute for Development Studies
Proportion of Innovation-active Firms with Cooperation Agreeements (%)
large msme

33
Table 4.5. Proportion of Innovation Active and Collaborative Firms by Cooperation partners (%)
Type of Cooperation Partner Philippines Other ASEAN
All Other Countries
All Countries
Other establishments within enterprise 86.6 2.2 9.5 89.8
Suppliers of equipment, materials, components, or software
80.6 10.1 21.8 93.2
Clients or customers in private sector 78.1 2.3 8.5 85.2
Clients or customers in public sector 69.5 0.0 2.5 71.3
Competitors or other establishments in your sector
74.2 0.9 5.4 78.9
Consultants, commercial laboratories, or private R&D institutes
67.2 0.0 2.9 68.8
Universities or other higher education institutions
63.5 0.0 0.6 63.7
Government or public research institutes 60.2 0.0 1.0 60.4Source: 2015 Survey of Innovation Activities, Philippine Institute for Development Studies Suppliers and clients in the private sector are also found to be the most valuable co-operation partners for innovation by innovation-active firms, with about three-tenths and two-fifths of large firms considering suppliers and clients, respectively as most valuable, compared to two-fifths and three-twentieths of MSMEs, respectively (see Figure 4.2). Another three-twentieths of innovation-active firms, particularly among MSMEs, rated government or public research institutes as most important partners for innovation. Universities were given the least importance by firms.
Figure 4.2. Cooperation partner found most valuable for innovation (innovation active, collaborative establishments only)
16.9
30.437.8
12.21.8 0.9
8.2
40.2
15.6 14.14.5 1.5
15.9
8.7
39.7
16.9 14.04.3 1.4 0.0
15.0
01
0203
040
01
0203
040
large msme
Total
other establishments within enterprise
suppliers
customers in private sector
customers in public sector
competitors or other establishments in sector
consultants, commercial laboratories or private R&D
universities or other higher educational institutions
government or public research institutes
per
cent
Source: 2015 Survey of Innovation Activities, Philippine Institute for Development Studies

34
5 Factors Influencing and/or Preventing Innovation
In 2015, about three in twenty firms (13.4 %) had some abandoned or delayed innovation projects, especially among large firms (Figure 5.1) In food manufacturing, 11.8 percent of MSMEs abandoned the innovation even at the concept stage, as against 7.6 percent for large firms. For establishments engaged in manufacturing of products other than food, 17.5 percent of large firms abandoned the innovation activity in the concept stage, compared to 5.5% percent for MSMEs. For ICT firms, the rate of abandonment of innovation was twice for large firms (9.1%) that of MSMEs (4.7%). Similar proportions of firms abandoned innovation after the inception of the project or activity. Serious delays were reported by a third of large firms in ICT (35.7%) compared to thee out of twenty large firms in food manufacturing (15.9%) and in other manufacturing (15.2%). Delays were experienced by a tenth of MSMEs (8.8%), ranging from 1.3 percent of MSMEs in BPO to 11.8 percent of MSMEs in ICT.
Figure 5. 1. Proportion of SMEs and Large Establishments Across Industry Groups that had abandoned innovation activities at the concept stage, or after activity inception, or experiencing serious delays (%).
The 2015 SIA asked establishments, both innovators and non-innovators, about a wide range of internal issues (such as human resources, financial resources) or external factors that constrain or prevent innovation. Tables 5.1 and 5.2 show the proportion of responding establishments (by size, as well as among innovators and non-innovators, respectively) that gave a ‘high’ rating to some potential barriers and bottlenecks to the conduct of innovation activities.
100.0
100.0
95.3 4.7
90.9 9.1
94.5 5.5
82.5 17.5
88.1 11.9
92.4 7.6
0 20 40 60 80 100percent
BP
OIC
TO
the
r M
anuf
actu
ring
Foo
d M
anuf
actu
ring
msm
ela
rge
msm
ela
rge
msm
ela
rge
msm
ela
rge
Abandoned in concept stage (%)
no yes
98.7 1.3
100.0
97.4 2.6
91.3 8.7
93.6 6.4
84.2 15.8
88.3 11.7
93.9 6.1
0 20 40 60 80 100percent
msm
ela
rge
msm
ela
rge
msm
ela
rge
msm
ela
rge
Abandoned innovation after activity begun (%)
no yes
98.7 1.3
100.0
88.2 11.8
64.3 35.7
93.2 6.8
84.8 15.2
90.1 9.9
84.1 15.9
0 20 40 60 80 100percent
msm
ela
rge
msm
ela
rge
msm
ela
rge
msm
ela
rge
Delayed seriously (%)
no yes
Source: 2015 Survey of Innovation Activities, Philippine Institute for Development Studies

35
Table 5.1. Percentage of SMEs and Large Establishments that Regarded Potential Barriers to Innovation as “High” Among Innovators and Non-Innovators.
Factors Hampering Innovation Activities
MSMEs Large Firms
Innov. Non-innov.
All Firms
Innov, Non-innov.
All Firms
1. Cost Factors a. Lack of funds within establishment or enterprise
17.3 19.7 18.7 19.4 5.6 14.3
b. Lack of finance from sources outside enterprise
12.6 18.1 15.8 11.6 5.3 9.2
c. Innovation costs too high
22.6 28.1 25.8 25.0 7.0 18.4
2. Knowledge Factors
a. Lack of qualified personnel
14.6 12.4 13.3 9.6 2.8 7.1
b. Lack of information on technology
7.3 14.1 11.3 6.8 3.0 5.4
c. Lack of information on markets
7.5 6.4 6.9 5.7 0.8 3.9
d. Difficulty in finding cooperation partners for innovation
13.5 11.2 12.2 3.9 1.6 3.1
3. Market Factors
a. Market dominated by established enterprises
18.6 15.1 16.6 8.8 1.1 6.0
b. Uncertain demand for innovative goods or services
10.2 12.0 11.2 10.9 4.4 8.5
Source: 2015 Survey of Innovation Activities, Philippine Institute for Development Studies Cost factors were the most commonly issue identified by the establishments as significant barriers to innovation. Direct costs of innovation were viewed as being too high (about 25.5 percent of establishments associated a high degree of importance to this, this is especially among true 28.1% of non-innovator MSMEs and 25% of large firms that were innovation active). About one in every five establishments (18.5%) also mentioned lack of funds within the establishment or enterprise as a barrier to innovation. While cost factors were the most commonly reported hindrance to innovation among all establishments, about one in five establishments, especially among MSMEs, also reported knowledge factors or market factors as significant barriers to innovation. For both innovators and non-innovators among MSMEs, more than 10 percent cited the lack of qualified personnel as a significant barrier to innovation. A similar proportion of MSMEs also cite difficulty in finding cooperation partners for

36
innovation as an important hindrance to the conduct of innovation activities. More than 10 percent of MSMEs also mention the uncertain demand for innovative goods or services, and a slightly bigger proportion (16.6 percent) consider the market being dominated by established enterprises as a barrier to innovation. Perceptions on barriers to innovation among MSMEs generally did not largely depend on whether or not the firm innovates. That is, MSMEs engaged in innovation activities were equally likely to perceive barriers as being highly important compared to non-innovation ones. The only exception was on the issues on lack of information on technology and on lack of finance to enterprise where a bigger share of non-innovating MSMEs considered these as significant barriers to innovation (more than MSMEs that were innovation active in 2015). Among larger firms, across the issues identified, a much bigger proportion of innovators than non-innovation active ones identify the issues (whether cost, knowledge or market) as significant barriers to innovation.
Non-innovators cite market conditions more as the reason for no innovations, with about three in twenty (13.2%) non-innovative establishments felt they did not need to innovate due to lack of demand for innovations, while about one in twenty (4.7%) felt they did not need to innovate due to prior innovations. The difference in rates is most evident among SMEs, especially those in food manufacturing where a fifth report market conditions as the reason for not innovating (see Figure 5.1). In general, across non-innovating firms in all industries except for BPO, market conditions are more cited as the reason why the establishment did not innovate.
Figure 5.1. Percentage of Establishments that Regarded Potential Reasons not to Innovate as “High”, by Size (Non-innovators Only).
Although the information in Table 5.1 and Figure 5.1. as well as the profile of innovation activity across firms in the previous sections from the various visualizations and dashboards
0.04.7
16.817.2
6.42.1
5.30.0
8.06.7
6.43.4
19.43.4
21.513.3
0 5 10 15 20
BPO
ICT
Other
Man
ufac
turin
gFoo
d M
anuf
actu
ring
msme
large
msme
large
msme
large
msme
large
Source: 2015 Survey of Innovation Activities, Philippine Institute for Development Studies
No need due to prior innovations
No demand for innovations

37
(of cross tabulations) provide meaningful information about factors that may influence innovative behavior among firms, they do not explain the effects of these factors on innovation in the presence of other factors. In order to formulate and implement evidence-based innovation policies, it is important to examine the determinants of innovation as well as look into barriers and bottlenecks to innovation. In this report, we make use of cross-section econometric model, particularly a logistic (also called logit) regression7 model to identify whether certain factors explain innovative behavior. The variables examined in the logistic model to explain how likely firms are product innovators, process innovators, and innovators, in general, include:
gross sales (in logarithmic form); age of firm; share of employees with a post baccalaureate degree (none, or some but less than 10
percent, from 10 to 19 percent, or at least 20 percent); export orientation (in particular, whether or not the firm has geographic market in
ASEAN or other countries); foreign ownership (whether or not the firm has foreign capital participation); interaction of export orientation and foreign ownership; share of female employment; major industry (whether the firm is in the food manufacturing, electronics
manufacturing, or IT sectors); location (whether the firm is located in NCR, Balance Luzon Visayas or Mindanao);
and, engagement in knowledge management practices.
These explanatory variables are considered based on the survey results summarized earlier that cost factors (here proxied by constraints from gross sales of the firm), knowledge factors (including knowledge management practices in the firm, institutional capacities and constraints from qualifications of employees proxied by the share of employees with a post baccalaureate degree), as well as market factors (proxied by geographic market, location and type of industry) influence or hinder the ability of a firm to be product innovators, process innovators or, in general, be innovation active. 0.05 level; ***=significant at 0.01 level.
7 A logistic regression model is used to explain or predict a binary outcome from a set of p explanatory variables
, , …, that may be binary, continuous, or a mix of any of these. In this survey report, three logistic regression models are described. For each of the models, the dependent variable is dichotomous – whether a firm is a product innovator or not, whether a firm is a process innovator or not, and whether a firm is innovation active or not, and with probability of a firm being a product innovator, a process innovator or innovation active as θ. In a logistic regression model, the log odds is a linear function of the p explanatory variables:
log ⋯
where the odds is the ratio of the chance of a firm is a product innovator (or process innovator or innovation active) to the chance it is not; α is the constant (intercept) of the logit equation and is the coefficient of explanatory variable . If an explanatory variable is categorical or discrete with say k categories, then this variable will be represented by k-1 indicator variables representing the categories, with the “omitted” category serving as the base category to compare the other categories with.

38
Although survey results also showed that large firms are more prone to innovate than MSMEs, firm size is correlated with gross sales, and thus was not considered in the econometric model to prevent multicollinearity8.
The logistic regression models for innovation activity, product innovation, process innovation, and wider forms of innovation summarized in Table 5.2 were subjected to various diagnostics (particularly tests for model specification and for model fit) to determine their suitability.
The econometric models suggest the importance of knowledge factors in innovative behavior of firms. In general, the practice of knowledge management practices in establishments is a good determinant of product innovation, process innovation and being an innovator. Human resources matter: firms with no employees with post-baccalaureate degrees are less likely to be innovators (in all forms of innovation, product, process, marketing and organizational innovation) than firms with at least a fifth of employees with post-baccalaureate degrees. For marketing innovators, firms with less than 20 percent of employees with post-baccalaureate degrees are also less likely to innovate than those with 20 percent or more post-baccalaureate degrees.
Gross sales matters for innovative behavior, with firms having higher gross sales (which typically also a larger number of employees) more likely to innovate than those with lower gross sales, ceteris paribus. Evidence is also strong that gross sales matters for process, organizational and marketing innovation, but weak for product innovation.
Location generally does not matter much, except for production innovation: firms in NCR and Balance Luzon, all other things equal, are more likely to be product innovators than firms in other Mindanao (and other areas).
All other things being equal, firms across industry appear to be equally likely to be product innovators, but BPO establishments seem less likely to be process innovators than firms in other industries (particularly in food and other manufacturing), ceteris paribus.
While it seems that having a geographic market limited to the local market makes a firm more likely to innovate, the evidence is actually for this is weak. Export orientation is having a negative on process, organizational and marketing orientation. While bigger foreign capital participation seems to have a positive effect on innovation activity and organizational innovation, the evidence is weak; foreign ownership is even having a negative effect on process and marketing innovation, although in these cases there appears to be some positive interaction between export orientation and foreign ownership, though the evidence is weak. A gender disparity indicator, namely, the share of women employees to total employment, also does not contribute to explaining innovative behavior. Age of the firm also does not matter as far as product or process innovation (and wider forms of innovation) is concerned, but there is some evidence that older establishments are, all things being equal, more likely to be innovation active than younger ones.
8 Multicollinearity occurs in a regression model when two or more explanatory variables in the model are approximately determined by a linear combination of other explanatory variables in the model. This is not desirable as unstable parameter estimates result from the difficulty in assessing the effect of the explanatory variables on dependent variables, since the explanatory variables effectively serve as proxies for each other.

39
Table 5.2. Determinants of Product Innovation, Process Innovation and Innovation Activity.
Variable Innovation Active
Product Innovator
Process Innovator
Organizational Innovator
Marketing Innovator
Age 0.105*** 0.058 0.169*** 0.102** 0.093**
gross sales (in logarithm form) 0.198** 0.101 0.076 -0.100 0.004
share of employees with a post baccalaureate degree
None -0.653** -0.628** -0.461** -0.725*** -0.638**
1 to 9 percent -0.241 -0.153 -0.124 -0.310 -0.472*
10 to 19 percent -0.104 -0.005 0.182 -0.279 -0.638**
20 and above (omitted) (omitted) (omitted) (omitted) (omitted)
export orientation: -0.275 -0.463 -0.597** -0.554* -0.570**
foreign ownership 0.061 -0.423 -0.534* 0.084 -0.936***
interaction of export orientation and foreign ownership
-0.014 0.380 0.457 0.259 0.079
share of female employment 0.001 0.003 0.002 0.000 0.004
Area
NCR -0.012 0.473* -0.194 -0.103 -0.163
Balance Luzon 0.238 0.550** 0.322 0.287 0.038
Visayas 0.185 0.302 0.271 0.333 0.194
Mindanao (omitted) (omitted) (omitted) (omitted) (omitted)
industry group
Food Manufacturing 0.649 0.085 0.962* 0.317 0.054
Other Manufacturing 0.577 0.090 1.024** 0.361 0.140
ICT 0.603 0.001 0.677 0.226 0.342
BPO (omitted) (omitted) (omitted) (omitted) (omitted)
knowledge management 1.469*** 1.148*** 1.525*** 2.002*** 1.428**
Constant -3.391*** -2.623*** -5.231*** -2.780*** -2.227***
Number of data 718 718 718 718 718
Overall chi-square 143.410 86.2 151.34 198.61 123.39
p-value 0.000 0.000 0.000 0.000 0.000
Pseudo-Rsquared 0.144 0.092 0.157 0.200 0.126
Specification link test (_hatsq) 0.063 0.145 0.072 0.070 0.148
p-value 0.524 0.32 0.394 0.447 0.147
Hosmer and Lemeshow goodness of fit
7.110 4.55 11.44 9.47 4.81
p-value 0.525 0.804 0.178 0.3042 0.7773Notes: (i) Authors’ calculation on microdata of 2015 Survey of Innovation Activities, Philippine Institute for Development Studies. (ii) Body of data are regression coefficients of logistic regression models. (iii) * = significant at 0.10; **= significant at

40
Of the 891 establishments surveyed for the 2015 SIA, 232 firms were also interviewed in the 2009 SIA conducted by the DOST. For these panel firms, there was a reduction in innovative behavior, especially in process innovation, and wider forms of innovation (Table 5.3).
Table 5.3. Selected Innovation Statistics for Panel Establishments, by Year.
Proportion of establishments that are:
2009 2015 MSME Large All firms MSME Large All firms
Innovation active 55.6% 66.1% 60.8% 46.2% 58.3% 52.2%Product innovators 34.2% 47.8% 40.9% 34.2% 41.7% 37.9%Process innovators 42.7% 56.5% 49.6% 34.2% 44.3% 39.2%Organizational innovators 60.7% 72.2% 66.4% 42.7% 53.9% 48.3%Marketing innovators 56.4% 48.7% 52.6% 43.6% 31.3% 37.5%
Source: 2015 Survey of Innovation Activities, Philippine Institute for Development Studies and 2009 Survey of Innovation Activities, Department of Science and Technology.
From 2009 and 2015, the panel firms have had changes in their characteristics, such as employment size (Table 5.4). While 25 out of 232 MSMEs had very observable upward movements in employment size, 15 MSMEs and 16 large firms had significant downward movements in their respective number of employees in the two years. It is thus, not surprising why innovation behavior has reduced for the establishments surveyed between 2009 and 2015 as changes in employment size of firms would suggest that capacities to innovate for these firms would also change.
Table 5.4. Frequency Distribution of Panel Establishments by Employment Size: 2009 and 2015.
2009 size 2015 size Micro Small Medium Large All firms
Micro 46 4 0 3 53Small 2 9 5 2 18Medium 3 10 22 11 46Large 2 4 10 99 115All firms 53 27 37 115 232
Source: 2015 Survey of Innovation Activities, Philippine Institute for Development Studies and 2009 Survey of Innovation Activities, Department of Science and Technology.
In 2015, the proportion of panel establishments that engaged in innovation was the lowest in the BPO industry compared to other industries (Table 5.5). In terms of innovation outputs, food manufacturing outperformed other industries in product (41.9%) and marketing (51.4%) innovation while manufacturing of goods other than food led in process (41.8%) and organizational (56.4%) innovation.

41
Table 5.5 Key innovation statistics for Panel Establishments, by Industry (%). Proportion of establishments that are:
2009 2015
Food Mfg
Other Mfg
ICT BPO All firms
Food Mfg
Other Mfg
ICT BPO All firms
Innovation active
58.1 64.5 54.8 58.8 60.8 55.4 54.5 45.2 35.3 52.2
Product innovators
35.1 44.5 38.7 47.1 40.9 41.9 38.2 38.7 17.6 37.9
Process innovators
45.9 52.7 48.4 47.1 49.6 40.5 41.8 38.7 17.6 39.2
Organizational innovators
58.1 70.9 61.3 82.4 66.4 44.6 56.4 38.7 29.4 48.3
Marketing innovators
58.1 46.4 58.1 58.8 52.6 51.4 31.8 32.3 23.5 37.5
Source: 2015 Survey of Innovation Activities, Philippine Institute for Development Studies and 2009 Survey of Innovation Activities, Department of Science and Technology.
As mentioned previously, there was a reduction in innovation behavior among panel establishments. The decline occurred across all industries and innovation outputs, except in the case of food manufacturing where there was an increase in the proportion of establishments that engaged in product innovation and in ICT where there was no change. Table 5.6 further reveals that the reduction in innovation behavior in 2015 compared to 2009 was most severe in the BPO industry with organizational innovation experiencing the biggest decline.
Table 5.6. Change in Proportion of Establishments, in percentage points (2009 and 2015) Food
mfg Other mfg
ICT BPO All firms
Innovation active -2.7% -10.0% -9.6% -23.5% -8.6% Product innovators 6.8% -6.3% 0.0% -29.5% -3.0% Process innovators -5.4% -10.9% -9.7% -29.5% -10.4% Organizational innovators -13.5% -14.5% -22.6% -53.0% -18.1% Marketing innovators -6.7% -14.6% -25.8% -35.3% -15.1%
Source: 2015 Survey of Innovation Activities, Philippine Institute for Development Studies and 2009 Survey of Innovation Activities, Department of Science and Technology.
In Table 5.7, we show results of a panel logistic random effects model to explain the innovative behavior of the 232 panel firms interviewed in both the 2009 SIA and the 2015 SIA. The size of the establishment is a significant determinant of being innovation active but in terms of specific innovation activity, it is significant only for process innovation, all other things being equal. Firms engaged in food manufacturing would more likely be innovation active, product innovators or process innovators relative to firms in the BPO sector, ceteris paribus. Firms belonging to electronics manufacturing or ICT are equally likely to innovate as firms in the BPO sector, all things equal. The area where the firms are located, particularly whether or not the firm is located in export processing zones (PEZA), is not a significant determinant of innovation activity, product innovation or process innovation. It is, however, marginally significant in explaining marketing innovation behavior. Finally, just as in the cross-section results for the 2015 SIA responding firms, the practice of knowledge management is found to

42
be a good determinant of innovation behavior for the panel firms, whether for innovation active firms, product innovators, process innovators, marketing innovators and organizational innovators.
Table 5.7. Regression Results on Likely Factors that Explain Innovative Behavior Among Panel Firms
Variable Innovation Active
Product Innovator
Process Innovator
Organizational Innovator
Marketing Innovator
Age 0.003 0.003 0.007 0.001 -0.006employment size (in logarithm form) 0.198** 0.103 0.150** -0.097 0.097geographic market is solely local market 0.185 -0.045 0.308 0.007 0.278share of foreign capital participation 0.000 0.000 0.000 0.000 0.000**
share of female employment 0.003 0.001 -0.002 -0.001 0.005firm in PEZA (or not) 0.199 0.006 0.139 -0.552 -0.200industry group
Food Manufacturing 1.185** 0.983** 0.811** 0.525 0.397 Other Manufacturing 0.395 0.666 0.418 -0.224 0.254 ICT and BPO 0.624 0.654 0.521 0.087 -0.055 BPO (omitted) (omitted) (omitted) (omitted) (omitted)
knowledge management 1.551*** 1.430*** 1.619*** 1.583*** 2.345***
constant -2.721*** -2.824*** -2.878*** -0.757 -2.217
Number of panel observations
232 232 232 232 232
Notes: (i) Authors’ calculation on microdata of 2015 Survey of Innovation Activities, Philippine Institute for Development Studies and 2009 Survey of Innovation Activities, Department of Science and Technology. (ii) body of data are regression coefficients of panel logistic regression fixed effects models. (iii) * = significant at 0.10; **= significant at 0.05 level; ***=significant at 0.01 level.

43
6 Support for Innovation
In 2015, rarely did firms avail of public financial support for innovation, with the proportion of firms getting support at 3.1 percent overall, and the proportion highest at 5.2 percent among large firms in the BPO industry (Figure 6.1). However, for MSMEs and for large firms across industries, the proportion of firms reporting receiving government assistance or support for innovation is consistently higher than those reporting public financial support for innovation. Overall, the proportion that received government support or assistance for innovation is 7.2 percent. Across industries, except ICT, the proportion having support for innovation among large firms is higher than the corresponding proportion among SMEs. In ICT, 10.1 percent of SMEs received support or assistance for innovation, compared to 6.2 percent for large firms.
Figure 6.1. Proportion of MSMEs and Large Establishments with Public Financial Support for Innovation and Proportion of MSMEs and Large Establishments with (National or Local) Government Support to Marketing Innovation (%), by Industry.
Overall, about a fifth (18.5%) of firms in 2015 were aware of any government innovation policies or initiatives, and of which, nearly half (46.5%) were provided some government support or assistance (Table 6.1).
100.0
94.8 5.2
95.9 4.1
100.0
96.1 3.9
95.1 4.9
97.9 2.1
100.0
0 20 40 60 80 100percent
BPO
ICT
Other
Man
ufac
turin
g
Food
Man
ufac
turin
g
msm
ela
rge
msm
ela
rge
msm
ela
rge
msm
ela
rge
Source: 2015 Survey of Innovation Activities, Philippine Institute for Development Studies
Public financial support for innovation (%)
without support with support

44
Table 6.1. Proportion of Establishments that are Aware of any Government Innovation Policy or Intervention and of which, Proportion that are Provided Government Support or Assistance in Innovation, by Size and by Industry (%).
Industry Size Proportion of Establishments Aware of Any Government Innovation Policies
Of which, Proportion Provided Government Support in Innovation
Food Manufacturing Large 33.1 45.8MSME 17.8 52.0Total 18.1 51.8
Other Manufacturing Large 36.1 41.6MSME 13.8 47.4Total 15.2 46.6
ICT Large 23.4 26.4MSME 30.3 38.0Total 30.1 37.7
BPO Large 15.2 83.3MSME 4.9 0.0Total 9.5 63.4
All Industries Large 29.9 44.7MSME 17.8 46.7Total 18.4 46.6
Source: 2015 Survey of Innovation Activities, Philippine Institute for Development Studies MSMEs tended to consider training, tax deductions, tax holidays, tax credits, and loan guarantees to be very important government programs, while large firms value training, tax holidays, tax deductions, duty free importation, and tax credits (Table 6.2). On average, government support programs least cited (at less than 20 percent) to be highly important include R & D funding, and direct subsidies (and others).
Table 6.2. Percentage of SMEs and Large Establishments that Regarded Government Support Programs that they received as “Highly important” for innovation (Recipients of Government Support Only).
Government Support Programs MSME Large All firms
R&D Funding 15.7 4.8 14.9Training 58.5 38.1 57.0Direct Subsidies 13.3 6.2 12.8Tax Deduction 42.2 32.5 41.5Tax Credits 30.4 28.5 30.3Tax Holidays 35.4 34.6 35.3Duty free importation 15.5 29.0 16.5Technical support/advice 25.9 8.1 24.6Infrastructure support 24.5 12.2 23.6Subsidized loans 27.0 8.7 25.7Loan Guarantees 27.4 7.4 25.9Others 4.5 0.0 4.2
Source: 2015 Survey of Innovation Activities, Philippine Institute for Development Studies In the 2015 SIA, firms were also asked to suggest how government can encourage innovation in the firms. While about two-fifths (41.8%) did not provide specific suggestions, most firms, whether MSMEs (17.8%) or large firms (13.6%), identified capacity building to be a

45
mechanism for encouraging innovation (Figure. For MSMEs (8.6%) and large firms (7.8%), the suggestion that ranked next to capacity building was financial support and ease of doing business, respectively.
Figure 6.2. Proportion of MSMEs and Large Establishments by suggestion on how government can encourage innovation (%).
As of 2015, less than a third (31.0%) of firms are registration either the Board of Investments (BOI), the Philippine Economic Zone Authority (PEZA), or some other Investment Promotion Agency (IPA). About a quarter (23.8%) of MSMEs registered at either BOI, or PEZA or both, while among large firms, as much 70.5 percent are registered with PEZA, 9.2 percent with BOI, and 3.4 percent with both (Figure 6.3).
41.8
6.7
5.9
18.0
5.4
8.6
40.8
7.8
1.9
13.6
6.6
7.1
0 10 20 30 40percent
msme
large
Source: 2015 Survey of Innovation Activities, Philippine Institute for Development Studies
financial support tax relatedcapacity building others
ease of doing business none

46
Figure 6.3. Proportion of MSMEs and Large Establishments by Registration at an Investment Promotion Agency (%).
Among establishments that have registered with IPAs, income tax holidays were the most availed of incentive, especially by large firms in BPO (Table 6.3). Other very well availed of financial incentives include tax deductions (especially by large firms in ICT and other manufacturing), duty free importation of raw material inputs as well as VAT exemption/credits for raw material inputs (especially by large firms in other manufacturing), duty free importation of equipment and other capital inputs as well as VAT exemption/credits for equipment and other capital inputs (across large firms except in food manufacturing). In 2015, all financial incentives were roughly availed of by around 6 to 7 percent of firms, especially MSMEs (Table 6.4). In particular, among large firms, nearly a fifth of those in BPO availed of duty free importation of both raw material inputs as well as equipment and other capital inputs, VAT exemption/credits for raw material inputs as well as for equipment and other capital inputs. direct subsidies and subsidized loans.
10.6 12.9 0.3 3.4 72.8
9.2 70.5 3.4 16.9
0 20 40 60 80 100percent of percent
msme
large
Source: 2015 Survey of Innovation Activities, Philippine Institute for Development Studies
BOI only PEZA onlyBoth BOI and PEZA Other IPA
Not registered

47
Table 6.3. Proportion of IPA-Registered Establishments that have ever availed of financial and other incentives since registration with any IPAs, by Major Sector and by Size of Firm (%).
Financial and Other Incentives
Food Manufacturing Other Manufacturing ICT BPO All Industries
MSME Large All firms
MSME Large All firms
MSME Large All firms
MSME Large All firms
MSME Large All firms
Income tax holiday 25.3 5.1 5.5 43.7 15.0 16.8 25.7 5.2 5.8 53.2 2.9 25.3 41.3 9.2 10.7
Tax deduction 15.3 5.8 6.0 32.8 13.1 14.3 36.9 2.2 3.2 16.5 5.6 10.4 26.8 8.2 9.1 Duty free importation of raw material inputs 15.7 3.0 3.2 45.9 16.1 18.0 12.0 1.2 1.5 20.7 3.3 11.1 32.6 8.1 9.3 Duty free importation of equipment and other capital inputs 5.1 2.7 2.8 43.0 14.5 16.3 42.1 1.4 2.6 31.1 4.6 16.4 34.3 7.4 8.7 VAT exemption/credits for raw material inputs 20.7 1.5 1.9 44.2 16.9 18.6 11.1 1.7 2.0 22.7 3.3 11.9 32.9 7.9 9.1 VAT exemption/credits for equipment and other capital inputs 13.3 1.2 1.4 40.8 13.9 15.6 40.1 2.2 3.3 38.4 3.3 18.9 35.8 6.6 8.0
Direct subsidy 8.6 1.7 1.8 5.4 1.2 1.5 8.3 0.8 1.0 0.0 0.0 0.0 5.0 1.3 1.5
Subsidized loan 8.6 1.7 1.8 2.9 1.1 1.2 0.0 0.6 0.5 0.0 0.0 0.0 2.9 1.3 1.3
Loan guarantees 8.6 1.8 1.9 6.1 3.4 3.6 0.0 0.6 0.5 5.2 0.0 2.3 5.8 2.2 2.4
Others 0.0 0.0 0.0 0.0 0.1 0.1 0.0 0.0 0.0 0.0 0.0 0.0 0.0 0.0 0.0 Source: 2015 Survey of Innovation Activities, Philippine Institute for Development Studies

48
Table 6.4. Proportion of IPA-Registered Establishments that have ever availed of financial and other incentives in 2015, by Major Sector and by Size of Firm (%).
Financial and Other Incentives
Food Manufacturing Other Manufacturing ICT BPO All Industries
MSME Large All firms
MSME Large All firms
MSME Large All firms
MSME Large All firms
MSME Large All firms
Income tax holiday 1.3 6.6 6.5 12.2 10.1 10.2 3.1 4.2 4.2 5.2 1.0 2.9 8.2 7.6 7.6
Tax deduction 4.3 6.0 6.0 8.3 9.6 9.5 3.1 0.6 0.7 8.2 0.0 3.6 7.2 6.6 6.6 Duty free importation of raw material inputs 11.0 3.4 3.6 10.6 12.3 12.2 0.0 0.6 0.6 18.7 2.3 9.6 11.5 6.6 6.9 Duty free importation of equipment and other capital inputs 11.0 3.3 3.4 13.6 10.6 10.8 0.0 0.6 0.6 17.4 1.0 8.3 12.8 5.9 6.2 VAT exemption/credits for raw material inputs 1.3 6.6 6.5 14.7 11.1 11.3 0.0 0.8 0.8 18.7 2.3 9.6 12.1 7.5 7.8 VAT exemption/credits for equipment and other capital inputs 5.8 6.5 6.5 14.4 10.6 10.9 0.0 0.8 0.8 18.7 2.3 9.6 12.7 7.3 7.6
Direct subsidy 11.0 4.0 4.1 10.7 12.0 11.9 9.3 1.0 1.2 18.7 2.3 9.6 12.4 6.8 7.1
Subsidized loan 11.0 4.0 4.1 14.1 12.0 12.1 9.3 1.2 1.5 18.7 2.3 9.6 14.2 6.8 7.2
Loan guarantees 11.0 4.0 4.1 11.4 9.9 10.0 9.3 1.2 1.5 13.4 2.3 7.2 11.6 6.0 6.2
Others 0.0 0.6 0.6 0.3 0.2 0.2 0.0 0.1 0.1 5.2 2.4 3.7 1.3 0.4 0.5 Source: 2015 Survey of Innovation Activities, Philippine Institute for Development Studies

49
7 Summary, Policy Issues and Ways Forward
7.1 Summary of findings
Overall, the results of the 2015 SIA do not differ substantially from the general portrait described in the pilot 2009 SIA. While many firms are undertaking innovation, there are also many opportunities for the country to further enhance its innovation ecosystem. Key survey findings include:
Major determinants to innovative behavior, include gross sales of the firm (which correlates with establishment size), educational attainment of employees, knowledge management practices, location and the industry group to which the firm belong.
Effects of innovation are mainly customer-driven. Firms report that cost factors (especially direct costs for innovation activities), are the
most important barrier to innovation. Knowledge factors also are a hindrance to innovative behavior. Government support for innovation is found to be limited, particularly for product innovations. Knowledge networks are largely limited, with firms tending to cooperate with establishments within their enterprise, their customers and suppliers. Establishments, especially small, medium and large firms, also generally do not access technical assistance and support from the government and research institutions. Cooperation and linkages are rather low between firms and academic and research institutions.
Firms that were interviewed in both 2009 and 2015 have had less innovation activity owing to changes in their characteristics, including employment size. Knowledge management practices are a strong determinant for innovative behavior of these panel firms.
Innovative firms, especially MSMEs do not consider government, academic and research institutions as their key partners in their innovative practices, although micro firms appear to be counting a lot on government support. This is understandable considering that the R&D institutions often are inward-focused, and are mostly disconnected from the needs of industry. Further, micro-sized firms need to rely on government support given their limited capacities. While various financial incentives have been provided to firms, innovation policies have not been fully mainstreamed, and investments by both the public and private sectors in R&D and in innovation activities has been limited. Innovation support by government has often been viewed only within the context of S&T, and implemented without a “whole-of-government” approach, often as support by the Department of Trade and Industry (DTI) for SMEs, or by DOST for science- and research-driven innovation activities. S&T spending in the country, whether in public or private expenditures, has been minimal (at less than the suggested benchmark expenditures of UNESCO) so S&T infrastructure has hardly been integrated with production needs.
7.2 Implications for policy
In this section, the policy implications of the key findings are discussed. Other interesting results that merit attention are highlighted as well.

50
Fostering innovation through education and training The econometric results suggest that human resources matter for innovation as firms without post-baccalaureate degree holders are less likely to be innovators. Moreover, continuous improvement in human resources matters too as the survey revealed the importance given by firms to internal and external training activities. Also, the respondents, regardless of establishment size, recognized of the value of capacity building as the best way for government to encourage innovation. Thus, using the gardener metaphor, the role of government in “preparing the ground” cannot be overemphasized. According to OECD (2016) however, while it is clear that higher levels of human capital and skills are a foundation of improved innovation performance, designing appropriate policies and programs is however less straightforward. It cautions against simple “more-is-better” policy prescriptions as simply adding inputs that may not achieve the desired outcomes given that innovation is a multifaceted and complex undertaking. A better understanding of the linkages between skills and innovation is needed so that government can develop the appropriate interventions to build capacities for innovation.
Harnessing government procurement as a catalyst for innovation
Although governments have traditionally focused on supply-side instruments (e.g. fiscal incentives, targeted grants), demand-side policies can also be effective in stimulating innovation (WB 2010, Edler and Georghiou 2007). The SIA 2015 provided baseline evidence of how government procurement encouraged innovation in Philippine industries. In some cases, the innovation was required as part of the contract while in most instances, it was a voluntary response. Given the volume and range of public sector needs as well as the current initiative to ‘right size’ the government (HB 5707), the potential of government procurement as a tool to spur innovation should not be ignored. Innovative solutions, goods, or services can be developed by industry for the government. Understanding the risks and learning from successful (and not so successful) examples of innovation through government procurement both here and in other countries will be useful in institutionalizing the policy and practice more widely across government agencies, both at the national and local levels.
Decline in innovation behavior in the BPO industry as a cause for concern
The Information Technology and Business Process Management (IT-BPM) is now one of the pillars of the Philippine economy. It dominates services exports and establishes significant spillover benefits to other industries. As articulated in both the Comprehensive National Industry Strategy and Philippine Development Plan (2017-2022) as well as the industry’s own roadmap, Roadmap 2022 (Accelerate PH), the Philippines must continue to expand its market share while moving up the global value chain through more complex and higher value services. In light of these goals and potential threats from other competitors and technologies (e.g. automation and artificial intelligence), the decline in innovation behavior in the BPO industry as revealed among firms interviewed in both the 2009 SIA and the 2015 SIA is a concern, and must be addressed.

51
Targeting assistance to MSMEs
The 2015 SIA shows that large establishments are more likely to engage in innovation. To encourage smaller firms to take risks and innovate, public interventions have to be adapted to the specific needs of firms, and will need to be impactful. Innovation generally varies across areas, and across size of firm. Barriers and bottlenecks faced by MSMEs to innovate, especially constraints for accessing finance, knowledge, and skills, are not similar to those faced by large firms. MSMEs need to be supported with the aim of having them develop eventually into larger-sized, more productive firms. Large firms, on the other hand, while having already more resources (both financial and human), will need to see the importance of going beyond their knowledge and cooperation networks for innovation.
Strengthening linkages between knowledge producers and users
A persistent problem that has been identified in both the 2009 and 2015 surveys is the very weak linkage between firms and the academic and research institutions. This issue is not unique to the Philippines or developing economies. As discussed in WB (2010), similar challenges were experienced in the US. Thus, the Bayh-Dole Act was enacted in 1980 to encourage commercially relevant research and provide incentives to universities by giving recipients of federally funded research intellectual property rights over the inventions they developed as a result of that funding. The WB (2010) identifies various mechanisms to strengthen knowledge and cooperation networks along with the pros and cons of each (Table 7.1).
An inventory and evaluation of existing mechanisms in the Philippines could be undertaken to identify effective programs that could be scaled up. The study of Vea (2014) examining various forms of industry-academe collaboration provides useful insights on what has worked and what else needs to be done.
Cost factors have been cited by firms in both the 2009 SIA and 2015 SIA as barriers to innovate. These cost factors can be brought down with effective partnerships. Most firms that are conducting innovation activities do not identify research and public institutions as a source of cooperation and information for innovation. The scope for partnerships to promote innovation is wide. Given the shift towards a more open system of innovation and the importance of knowledge management practices as a determinant of innovation, the government will need to actively promote the free exchange of ideas and flow of knowledge from outside the companies. Establishments, especially large firms, need to be stimulated to cooperate for innovation, rather than being averse to networking with their competitors. Improving networking, linkages and collaboration between the government, industry associations, and universities and research institutions must be pursued vigorously with far better budgets than currently available.

52
Table 7.1. Instruments for Promoting Relevant R&D in Universities and Greater Commercialization of Knowledge and Interaction with Enterprises
Instrument Advantage Disadvantage Bayh-Dole–type legislation - Provides an incentive for
researchers at universities and public research institutes to produce commercially relevant knowledge and earn income from the licensing or sale of the knowledge produced
- May create an excessively commercial orientation in universities or public R&D labs, which compromises the public-good nature of university and public lab R&D
- Excessive preoccupation by universities and public R&D centers with financial side of contracts may make transactions costs too high for businesses to work with them
Technology transfer offices - Provide economies of scale and experience in patenting applications and technology transfer contracts
- Create greater incentive to commercialize technology
- May put too much pressure on researchers to privatize their knowledge and thus impede the public flow of knowledge
- Sometimes may not produce enough income to justify cost
Science parks - Provide economies of scale in provision of basic infrastructure
- May lead to agglomeration economies in interaction between knowledge workers and technology-based firms
- May not achieve the economies of scale and agglomeration envisioned because they lack the necessary critical mass
- May become real estate operations more than knowledge centers
Business incubators at universities
- Provide economies of scale in physical and institutional support for start-ups, including help in preparing business plans, matching scientists with business, obtaining permits to set up new businesses, and the like
- May not function well because they lack the ability to match business skills with technology skills, or to provide complementary support services
- May focus too much on real estate rather than on promotion of new technology firms
Matching grants or tax subsidies for cooperation among universities, firms, and public research institutes
- Create incentives for potentially mutually beneficial synergies among firms, universities, and public R&D labs
- May not be used because of lack of trust between the parties.
- May subsidize interactions that would have happened anyway
Source: Table 5.12 (WB 2010, p. 158)

53
Recognizing the role of regulatory frameworks in promoting or inhibiting innovation Government will need to regularly examine regulatory frameworks, and remove obstacles to innovative initiatives. As suggested by respondents, improving the ease of doing business is one way by which government can encourage innovation in the firms. Government must also start to look into its regulatory frameworks, as regulators may have a tendency to focus on implementing regulations (that may not be always applicable to changing environments) over considering the ultimate goal of public welfare. Regulators and legislators have to seriously examine the extent to which regulations are becoming barriers to innovation.
The lack of regulation or weak enforcement can also hinder innovation. Quimba, et al., (2017) show two cases showing the importance of intellectual property: the first involves the pharmaceutical industry where a trademark filed by Pascual Laboratories led to improving product recognition and increased sales; the second involves the experience of local firms in the automotive industry with limited innovation because technology from mother companies are not transferred owing to intellectual property issues. The latter shows that mindsets of foreign companies, particularly in the automotive industry, could be changed if policies on intellectual property rights are stronger.
Although not captured in the survey9, the impact of restrictive regulations on technology adoption (and hence, innovation) must be considered. Current regulations and laws do not always adequately apply to new and emerging technologies, and consequently these regulations can be barriers and bottlenecks to innovation and creativity, and can even have the unintended consequences of reinforcing monopolistic positions in a market (as in the current regulatory scrutiny of UBER in the country).
Adopting a whole of government approach While a number of measures and systems are in place for the generation of new ideas (through tax incentives, IPR protection, and competitive S&T research), innovation policies should veer away from a linear innovation model10 to a model of the entire innovation ecosystem (see Figure 1.3) with interventions thought out in consultation with all stakeholders. A national innovation framework and plan of action is required for facilitating interactions between the various players involved in the innovation ecosystems: universities, research laboratories, banks (for venture capital), and government agencies in charge of various sectors, such as DTI, DOST, Department of Agriculture and Department of Health. This innovation roadmap should take into consideration sector-specific characteristics and needs of firms. Public investments for large scale programs to support innovation also require further boosting. Particular areas where more support is needed include determining the feasibility of research and their subsequent commercialization (technology financing programs, IPR support), establishing new businesses (venture capital, start-up funds) that are likely to conduct innovation activities, as
9 Partly because of the limited industries covered (i.e. highly regulated service industries are not included) 10 A linear innovation model assumes that R&D leads to innovation and commercialization of mature of R&D outputs, product technologies and consequently economic growth (Ancog and Aquino, 2007)

54
well as generating and sustaining revenues through technology business incubators (TBIs), technology centers, and technoparks. Further, specific time-bound plans and interventions should be crafted to make R&D institutions more responsive to industry needs, and to improve academic institutions in fostering creativity among learners for enhancing a technical culture.
HEIs should be encouraged to pursue R&D without being hindered by myopic internal policies (STRAND, 2014). They should work on pursuing partnerships with private firms in order to work on product development and commercialization.
National government agencies, local government units, and the legislators need to work in tandem with academe and the business sectors to advocate for innovation, providing more leadership, bringing people and institutions together. TBIs bring together the resources of the three major stakeholders related to innovation: government, startups/private firms, and the academe. Because these three would be directly affected by policies on startups, any national policies on innovation, including a framework and strategy should be made in coordination and with inputs from all stakeholders.
7.3 Proposed legislative measures
Key legislative measures are currently being considered independently in both the House of Representatives and the Senate to spur innovation. A Senate bill, called the Philippine Innovation Act, has been passed this May 2017 which provides for the establishment of a National Innovation Council (NIC). The proposed NIC is to have the President as its chair, the Director General of the National Economic and Development Authority (NEDA) as vice-chair, with members that include 16 Secretaries of various Departments, including DTI and DOST, the Department of Information and Communications Technology (DICT) and the Department of Budget and Management (DBM), as well as the Director-General of the Intellectual Property Office, and 7 executive members (at least one of whom shall be a woman) representing business, academe, and the scientific community. Except for the private sector composition, the structure of the NIC appears to largely mimic an expanded composition of secretaries comprising the NEDA Board11. The NIC is to be given the responsibility of crafting a National Innovation Agenda and Strategy Document (NIASD). Further, the legislation earmarks approximately P1 billion to finance innovation grants for entrepreneurship. While this legislative measure provides a concrete mechanism for developing an innovation roadmap through the NIASD, for supporting MSMEs and for mainstreaming innovation policy, the establishment of this new body may duplicate existing structures, such as the NEDA Board although the latter tends to focus more on approving infrastructure investments during its meetings. If a new body were to be established that will involve key cabinet secretaries and representatives of the private sector and academic/research institutions, there may be more
11 In the NEDA Board, the President and NEDA Director-General serve respectively as chair and vice-chair. Board members include secretaries of 11 Departments (such as DTI and DOST), a representative of the Bangko Sentral ng Pilipinas, heads of several government agencies (such as the Housing and Urban Development Coordinating Council), the Chairperson of the Metro Manila Development Authority, the President of Union of Local Authorities of the Philippines, the Governor of the Autonomous Region for Muslim Mindanao, and the Chairperson of the Mindanao Development Authority.

55
sense in keeping the membership in the proposed NIC much smaller, to include the secretaries of DTI, DOST, DICT, Commission on Higher Education, Department of Agriculture, DBM, and NEDA, with meetings quarterly set under the leadership of one of them to discuss mainstreaming of innovation policy, and supporting innovation activities. Funds earmarked, such as the proposed P1 billion grants, may already be best channeled directly through existing mechanism such as MSME support facilities at DTI, or DOST’s Small Enterprises Technology Upgrading (SETUP) project (for the latter, see, e.g., DOST, 2015).
The House of Representatives has also independently worked on boosting innovation, chiefly through House Bill (HB) 4581, also called the “Science for Change Program (S4CP) Act.” This legislative initiative increases funds at DOST for innovation, considerably increasing R&D budgets from PHP5.8 billion to PHP21 billion, and more or less doubling yearly over the next five-year period to reach PHP672 billion by 2022. The S4CP provides justification for this expanded S&T budget given a comprehensive action plan for expanding current S&T programs, support new initiatives, invest in S&T Human Resources and build capacities of R&D Institutions and industrial competitiveness. While HB 4851 provides more concrete and ambitious ground than the Senate initiative, it tends to be S&T focused, and there are concerns that bigger need not always be better. Although innovation derives a lot from S&T or R&D, and thus government need build a good science base, innovation is ultimately practiced in the economy to add value to products and services. It is important to pursue an impact evaluation of some large-funded S&T projects to determine what works and what doesn’t.
7.4 Concluding remarks
Innovation policy is quite complex and should be aimed at facilitating relationships of various actors and institutions involved in the innovation ecosystem: firms, academic and research institutions, banks (for venture capital), and government agencies in charge of various sectors. Thus, innovation investments should be broader than merely more support for S&T, or R&D, although these are important. Both the legislative initiatives in the Senate and the House are welcome developments to improve the innovation ecosystem, but they ultimately must be focused on (a) removing barriers and bottlenecks to innovative initiatives in regulatory frameworks; (b) providing meaningful and impactful support to innovators; (c) investing in required technology, research infrastructure, and R&D researchers; (d) carrying out appropriate reforms in education, the investment climate, and trade. Innovation policy acts within a context, typically an established institutional setting that can be crowded with many agencies that have limited financial resources. Thus far, the country has conducted two rounds of the SIA, the 2009 SIA and the 2015 SIA, the first was a pilot survey conducted by DOST, while the second was conducted by PIDS. It will be important to regularly monitor the extent of innovation activities being undertaken, every 3 to 5 years, since the management of the innovation ecosystem cannot be effectively done if what is being managed is not being measured. More financial resources will certainly be required for supporting innovation but where these resources go will be important to examine, and a champion for innovation in the policy environment will most certainly be needed to ensure that innovation gets mainstreamed.

56
References Albert, J. R., Aldaba, R., Quimba, F. M, and Yasay, D. (2013). Innovative Behavior of Local Firms Results of the 2009 Pilot Survey of Innovation Activities Conducted under the DOST-IDRC Project: Towards an Innovation-Led Development Path in the Philippines. Department of Science and Technology; Philippine Institute for Development Studies. Ancog, A. and Aquino, A. (2007). The emerging national system of innovation in the Philippines, in Science, Technology Policy and the Diffusion of Knowledge: Understanding the Dynamics of Innovation Systems in the Asia Pacific, edited by Turpin, T. and V.V. Krishna, pp. 337-377. Cheltenhan and MA: Edward Elgar. Cororaton, C. B. (2002). Research and Development and Technology in the Philippines. PIDS Discussion Paper Series No. 2002-23, Philippine Institute for Development Studies. Department of Science and Technology. (2015). 2015 Performance Report Edler, J. and L. Georghiou (2007) Public Procurement and Innovation: Resurrecting the Demand Side. Research Policy, 36: 949-963. Gonzales, K. G., M.-L. R. Macasaquit and J. T. Yap. (2010). Determinants of Locating R&D Activity in the Philippines: Policy Implications. PIDS Discussion Paper Series 2010-07, Philippine Institute for Development Studies. Harvie, C., Narjoko, D., & Oum, S. (2010). Firm characteristic determinants of SME participation in production networks. ERIA discussion paper series, 11. Ledda, V. M., & Del Prado, F. L. E. (2013). Innovation in Philippine transnational corporations: case studies. Asian Journal of Technology Innovation, 21(sup1), 82-103. Llanto, G. M. (2013). Innovation and SME Financing in Selected Asian Economies. Tokyo: Asian Productivity Organization. Llanto, G. M., & del Prado, F. (2015). Does Innovation Mediate Good Firm Performance? PIDS Discussion Paper Series No 2015-06, Philippine Institute for Development Studies. Macapanpan, T. H. (1999). Private Sector Activities on Research and Development. PIDS Discussion Paper Series No. 99-19, Philippine Institute for Development Studies. Macasaquit, M. (2011). Strengthening sources of knowledge/ technology to promote innovation: the case of CALABARZON. PIDS Policy Notes 2011-09 (May 2011), ISSN 1656-5266, Philippine Institute for Development Studies. OECD (2011). Skills for Innovation and Research, OECD Publishing http://dx.doi.org/10.1787/9789264097490-en Patalinghug, E. (2003). The Philippine Innovation System: Structure and Characteristics. PIDS Research Paper Series No. 2003-04, Philippine Institute for Development Studies.

57
Quimba, F. M. A., Albert, J. R. G. & Llanto, G. M. (2017). Innovation Activity of Firms in the Philippines. Unpublished ERIA Research Project on Innovation Policy in ASEAN. Quimba, F. M. A., & Rosellon, M. A. D. (2012). Innovation in the Automotive Sector of the Philippines. Asian Journal of Technology Innovation, 20(sup1), 49-65. Rosellon, M. A. D., & Del Prado, F. L. E. (2017a). Achieving Innovation Without Formal R&D: Philippine Case Study of Garment Firms PIDS Discussion Paper Series No. 2017-09, Philippine Institute for Development Studies. Rosellon, M. A. D., & Del Prado, F. L. E. (2017b). Technology and Knowledge Transfers in Production Networks: Case Study on Philippine Food Manufacturing Firms PIDS Discussion Paper Series No. 2017-08, Philippine Institute for Development Studies. Rosellon, M. A.D., and Yasay, D. B. (2012). ‘A Case Study on Upgrading of Capital Goods in the Philippines’, in P. Patarapong (ed.), Unpublished ERIA Research Project on Wiring Innovation Networks: How Networks Upgrade Innovation Capacity in East Asia, Jakarta: Economic Research Institute for ASEAN and East Asia. Serafica, R. B. (2016). Service Innovation in Philippine Industries. PIDS Discussion Paper Series No. 2016-20, Philippine Institute for Development Studies. STRIDE (2014). Philippine Innovation Ecosystem Assessment. Available at: http://www.academia.edu/10358761/Philippines_Innovation_Ecosystem_Assessment Vea, Reynaldo (2014). Industry-Academe Collaboration for Research and Development. PIDS Discussion Paper Series No. 2014-10, Philippine Institute for Development Studies. Velasco, Aida. The Role of Philippine Universities in FILIPINNOVATION (Philippine Innovation System). http://asialics6.ust.hk/essay_ao/Velasco_Aida_022_June20.pdf Villafania, Alexander. (2007). Filipinnovation’ is new word from innovation summit. http://newsinfo.inquirer.net/breakingnews/infotech/view/20071126- 103174/%91Filipinnovation%92_is_new_word_from_innovation_summit World Bank. (2010). Innovation Policy: A Guide for Developing Countries. Washington, DC.