measuring and managing co2 emissions of european … · 1 measuring and managing co2 emissions of...
TRANSCRIPT

1
Measuring and managing CO2 emissions of European chemical transport
Jos Verlinden, Cefic
Workshop Inland Navigation CO2 EmissionsStrasbourg 12 April 2011
2
Agenda
1.Short introduction of Cefic and Responsible Care
2. Measuring transport CO2 emissions
3. Opportunities to reduce transport CO2 emissions
2007 2020 20402010 2020 2040

3
European Chemical Industry Council: http://www.cefic.org/Cefic is the voice of the European chemical industry based in Brussels Cefic represents 27,000 chemical companies that produce 29% of the world chemical production and employ over 1.2 million people
Staff & network:150 staff4000 industry experts from companies & federations
• Horizontal Programmes, Strategy Implementation Groups and Issue Teams• 150 Sector Groups
Members28 national federations in Europe50 major international companies450 business company members
CEFIC was founded in 1972
What is Cefic?

44
Responsible Care
Voluntary initiative of the global Chemical Industry
« Responsible Care is the world-wide chemical industry’s commitment to continuous improvement in all aspects of Health, Safety and Environment performance of its products and processes and to openess in communication about its activities and achievements. »
5
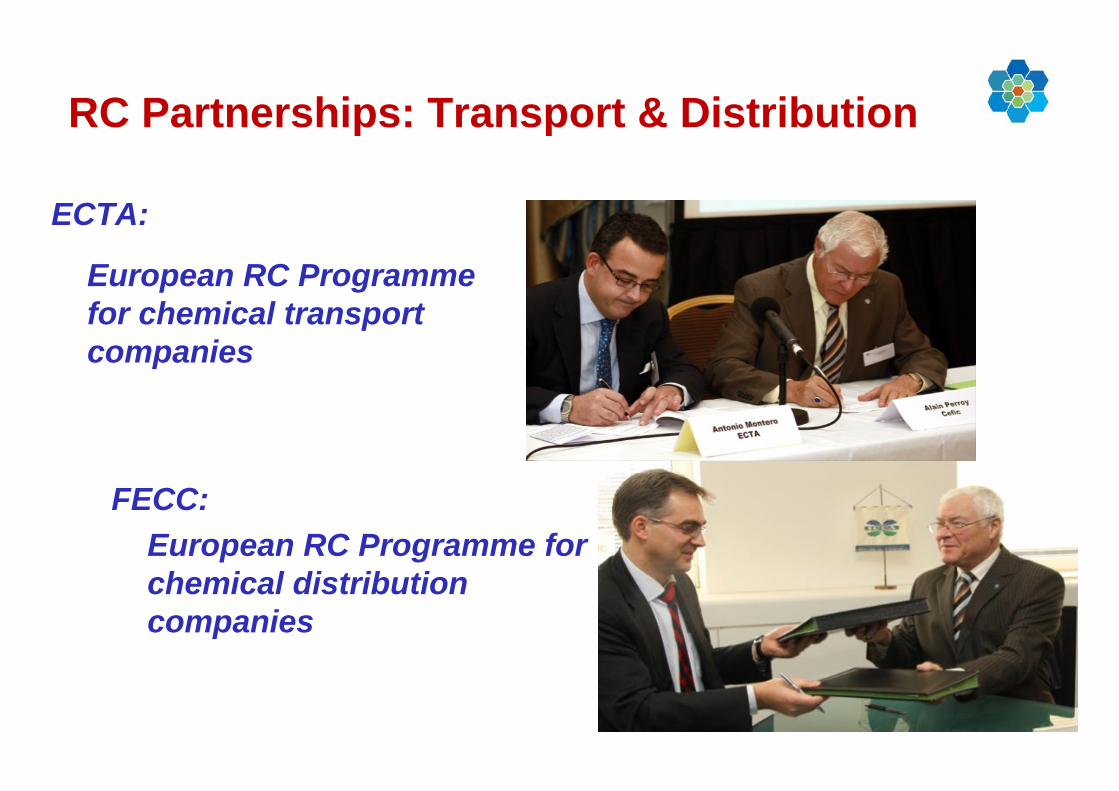
ECTA:
European RC Programme for chemical transport companies
Passing Responsible Care onalong the chemical supply chain
FECC:European RC Programme for chemical distribution companies
RC Partnerships: Transport & Distribution

6
Main Cefic areas of attention
Development of Best Practice Guidelines
Managing SQAS
Advocacy of chemical industry positions
Behaviour Based Safety (BBS)Logistics performance reportingDriver shortageDriver waiting timesTransport equipmentSecurity of transportSafety of loading/unloadingTransperantoGHG emissions
A world class assessment system for LSP’s:
5 SQAS modules70 accredited assessors 4,500 assessments16,000 consultations
CDI for sea transport EBIS for barges
Dangerous goods regulationsEuropean transport policyRail Single Wagon TransportVehicle weights (44T)
Sustainable logistics

77
EU overall emissions trajectories
Source: European Environment Agency (EEA)
Source: SULTAN, Development of an Illustrative Scenarios Tool for Assessing Potential Impacts of Measures on EU transport GHG; www.eutransportghg2050.eu
• The EU-27 GHG emissions from transport have been increasing by 1,4%/year over the past years and are projected to continue to do so.
• The growth rate of transport GHG emissions has the potential to undermine the EU’s efforts to meet long-term GHG emission reduction targets, if no action is taken.

8
Sustainable transport – GHG emissions
Actions already undertaken by Cefic
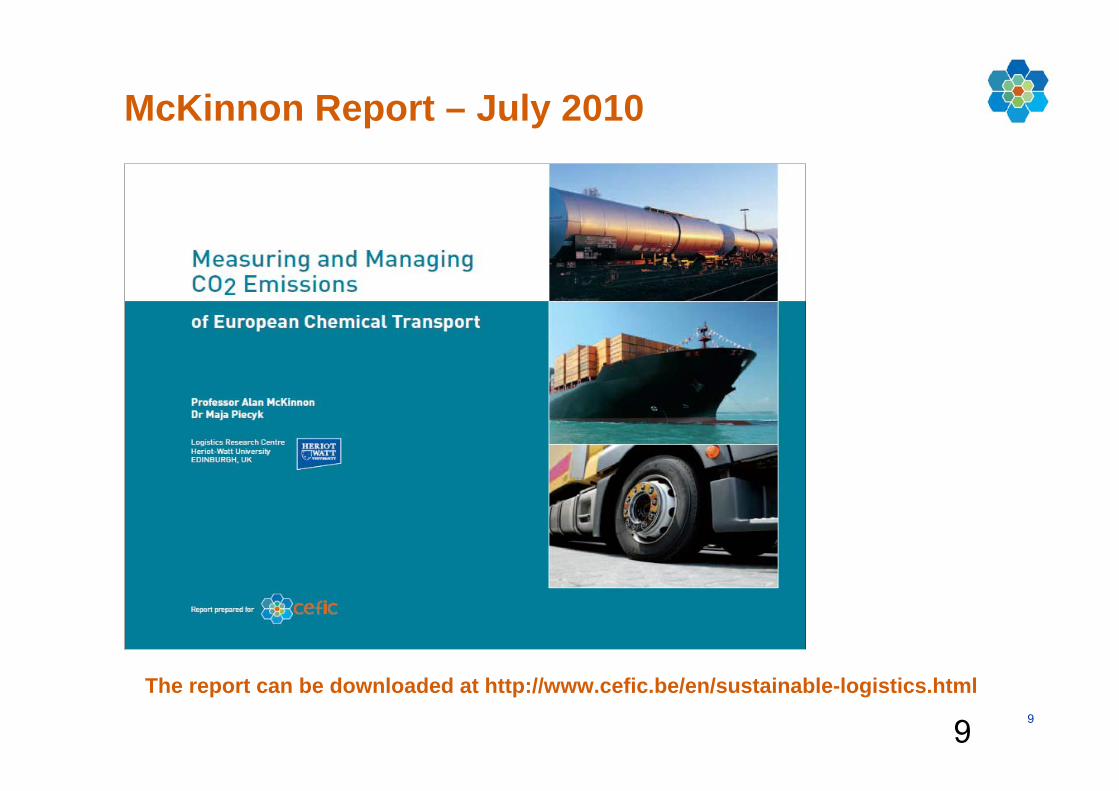
• Cefic sponsored study by Prof McKinnon (Edinburgh) on transport carbon measurement and management for chemical transport
• Cefic Guidelines for measuring and reducing transport CO2 emissions
• First rough estimate of chemical transport carbon footprint
99
McKinnon Report – July 2010
The report can be downloaded at http://www.cefic.be/en/sustainable-logistics.html

1010
■ General framework■ Calculation method■ Average emission factors■ Calculation template■ Opportunities to reduce emissions
See www.cefic.be
Cefic/ECTA Guidelines for Measuring and Managing CO2 Emissions from Freight Transport Operations
April 2011

11
Average emission factors recommended by McKinnon
Transport mode gCO2/Ton - km
Road transport 62
Rail transport 22
Barge transport 31
Short sea 16
Deep-sea container 8
Deep-sea tanker 5
Intermodal road / rail 26
Intermodal road / barge 34
Intermodal road / short sea 21
Pipelines 5
Airfreight 602

12
Organisation gCO2 / tonne-km
INFRAS 31
TRENDS 31
Tremove 32.5
IFEU 28-35
Published Emission Factors for Inland Waterway Transport Source: Alan McKinnon

13
Ship type Upstream Downstream Canal
Container Barges * gCO2/tonne-km
Small (90TEU) 63.4 31.3 44.5
Medium (208 TEU) 28.3 14.7 17.4
Large (500 TEU) 19.6 10.2
Tank / Solid Bulk Barges**50% load factor gCO2/tonne-km
800 t 70.8 27.3 39.31250 t 62.6 24.1 34.3
1750 t 57.7 22.3 31.1
2500 t 46.0 18.1 25.8
Other Published Barge Emission Factors* Verkehrsrundschau 44/2009
** Verkehr im Umweltmanagement - Anleitung zur betrieblichen Erfassung verkehrsbedingter Umwelteinwirkungen – Sept 2009 based on Borken et al. 1999

1414
Generic company approach for establishing a green logistics strategy and action plan
■ Establish framework for CO2-footprint measurement
■ Calculate baseline (e.g. CO2-footprint in 2010 or 2011)
■ Determine realistic CO2-emission reduction target (baseline -> 2020)
■ Establish action plan, identifying measures to reduce CO2-footprint
■ Monitor progress and report year-on-year achievement
Key steps
Cefic/ECTA Guidelines for measuring and managing of CO2 emissions from freight transport operations

1515
Methods to calculate CO2 emissions fromfreight transport operations
Activity-based approach
In the absence of energy consumption data, it is possible to make a rough estimate of the carbon footprint of a transport operation by applying a simple formula:CO2 = tons transported x average transport distance x CO2-emission factor per ton-km
Energy /fuel consumption-based approach
Since almost all CO2-emissions from freight transport are energy/fuel-related, this is the simplest and most accurate way of calculating these emissions, using the following formula:CO2 = fuel consumption (in litres) x CO2-factor

1616
Activity-based approachCefic recommended CO2 emission calculation template
Calculation Template for CO2-Emissions from Freight Transport Operations
Mode of Transport TonsAvg kms
(estimates!) Ton-kmsg CO2 / ton-km Tons CO2
Road transport bulk 100.000 500 50.000.000 62 3.100Road transport packed 100.000 500 50.000.000 62 3.100Rail transport 100.000 500 50.000.000 22 1.100Barge transport bulk 100.000 500 50.000.000 31 1.550Barge transport packed 100.000 500 50.000.000 31 1.550Short sea bulk 100.000 500 50.000.000 16 800Short sea packed 100.000 500 50.000.000 16 800Intermodal road / rail 100.000 500 50.000.000 26 1.300Intermodal road / barge 100.000 500 50.000.000 34 1.700Intermodal road / short sea 100.000 500 50.000.000 21 1.050Pipelines 100.000 5 500.000 5 3Deep-sea container 100.000 5.000 500.000.000 8 4.000Deep-sea tanker 100.000 5.000 500.000.000 5 2.500Airfreight 1.000 5.000 5.000.000 602 3.010
TOTAL 1.301.000 1.505.500.000 25.563

17
Results Cefic survey 12 chemical companies Share of different transport modes
%
18
Decarbonising logistics operations
Main opportunities • Fuel efficiency of vehicles (design, operation & maintenance)
• Carbon intensity of fuel (fossil fuel, biofuel, electricity, …)
• Modal split (pipeline, sea, barge, rail, road, intermodal, air)
• Supply chain design
• Vehicle utilisation ( payload, empty running,….)
19
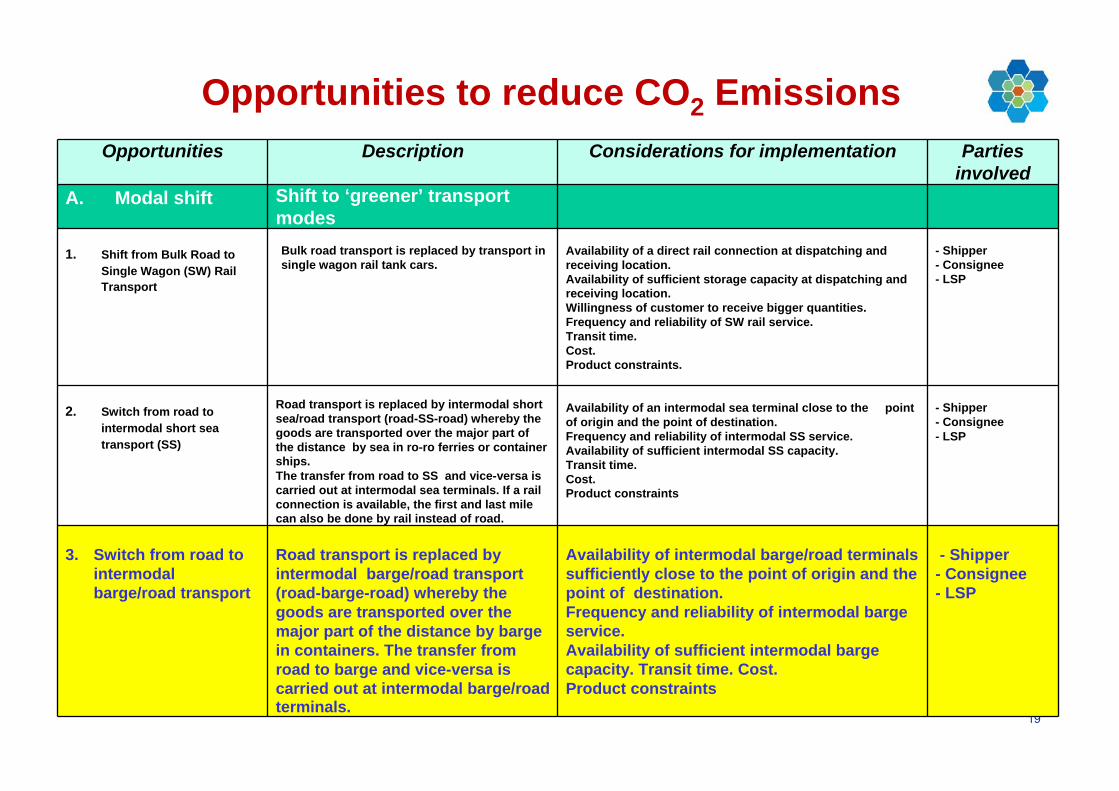
Opportunities to reduce CO2 EmissionsOpportunities Description Considerations for implementation Parties
involvedA. Modal shift Shift to ‘greener’ transport
modes
1. Shift from Bulk Road to Single Wagon (SW) Rail Transport
Bulk road transport is replaced by transport in single wagon rail tank cars.
Availability of a direct rail connection at dispatching and receiving location. Availability of sufficient storage capacity at dispatching and receiving location.Willingness of customer to receive bigger quantities.Frequency and reliability of SW rail service.Transit time.Cost.Product constraints.
- Shipper- Consignee- LSP
2. Switch from road to intermodal short sea transport (SS)
Road transport is replaced by intermodal short sea/road transport (road-SS-road) whereby the goods are transported over the major part of the distance by sea in ro-ro ferries or container ships. The transfer from road to SS and vice-versa is carried out at intermodal sea terminals. If a rail connection is available, the first and last mile can also be done by rail instead of road.
Availability of an intermodal sea terminal close to the point of origin and the point of destination.Frequency and reliability of intermodal SS service.Availability of sufficient intermodal SS capacity. Transit time. Cost.Product constraints
- Shipper- Consignee- LSP
3. Switch from road to intermodal barge/road transport
Road transport is replaced by intermodal barge/road transport (road-barge-road) whereby the goods are transported over the major part of the distance by barge in containers. The transfer from road to barge and vice-versa is carried out at intermodal barge/road terminals.
Availability of intermodal barge/road terminals sufficiently close to the point of origin and the point of destination. Frequency and reliability of intermodal barge service.Availability of sufficient intermodal barge capacity. Transit time. Cost.Product constraints
- Shipper- Consignee- LSP

20
Opportunities to reduce transport emissions
• Shift from Bulk Road to Single Wagon (SW) Rail Transport
• Switch from road to intermodal short sea transport (SS)
• Switch from road to intermodal barge/road transport
• Switch from road to intermodal short sea transport (SS)
• Product swap arrangements
• Relax monthly order-invoice cycles
• Maximize direct deliveries
• Improved routing
• Flexibility of loading and unloading time windows
• Flexibility of delivery dates
• Increase availability of tank cleaning stations at key locations
• Reduce black lists of previously loaded products
21
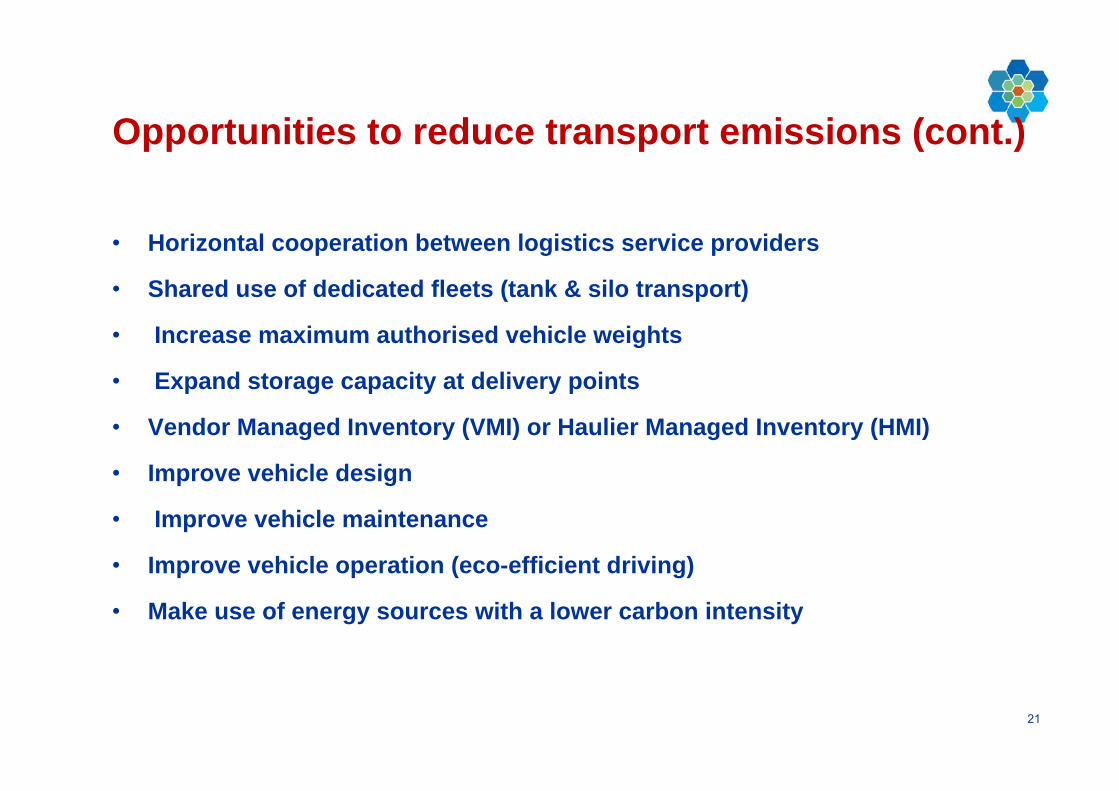
Opportunities to reduce transport emissions (cont.)
• Horizontal cooperation between logistics service providers
• Shared use of dedicated fleets (tank & silo transport)
• Increase maximum authorised vehicle weights
• Expand storage capacity at delivery points
• Vendor Managed Inventory (VMI) or Haulier Managed Inventory (HMI)
• Improve vehicle design
• Improve vehicle maintenance
• Improve vehicle operation (eco-efficient driving)
• Make use of energy sources with a lower carbon intensity
22
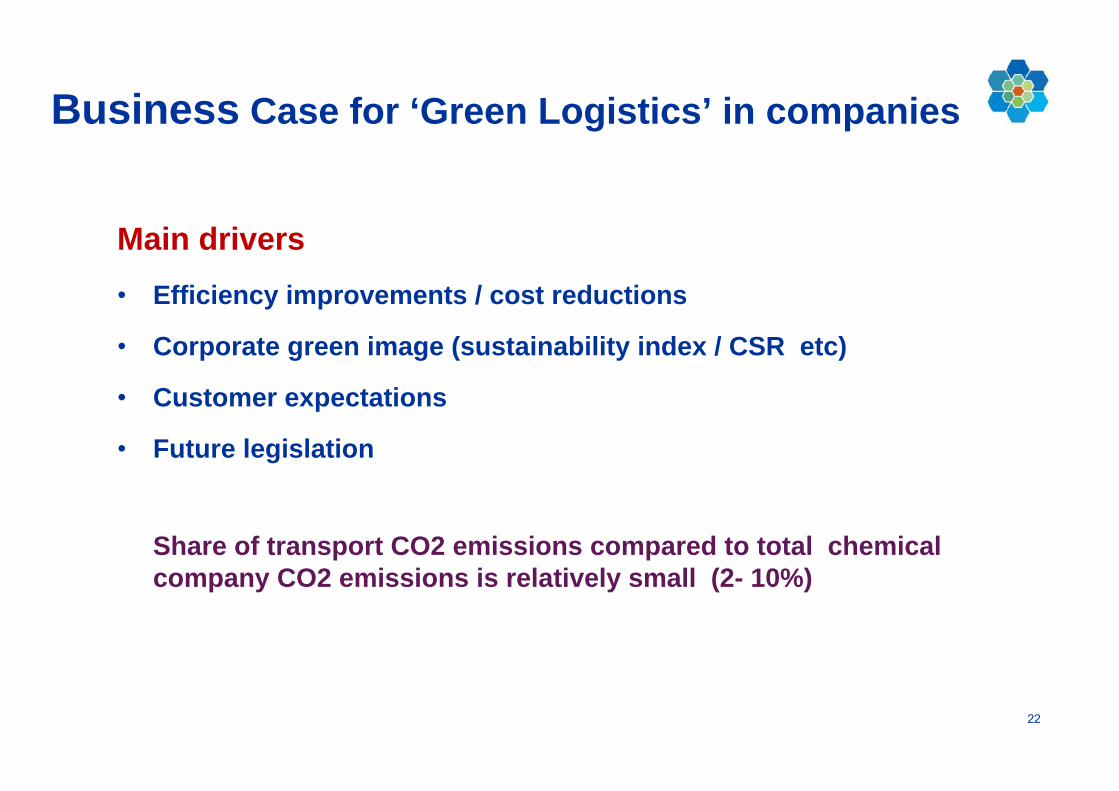
Business Case for ‘Green Logistics’ in companies
Main drivers • Efficiency improvements / cost reductions
• Corporate green image (sustainability index / CSR etc)
• Customer expectations
• Future legislation
Share of transport CO2 emissions compared to total chemical company CO2 emissions is relatively small (2- 10%)
23
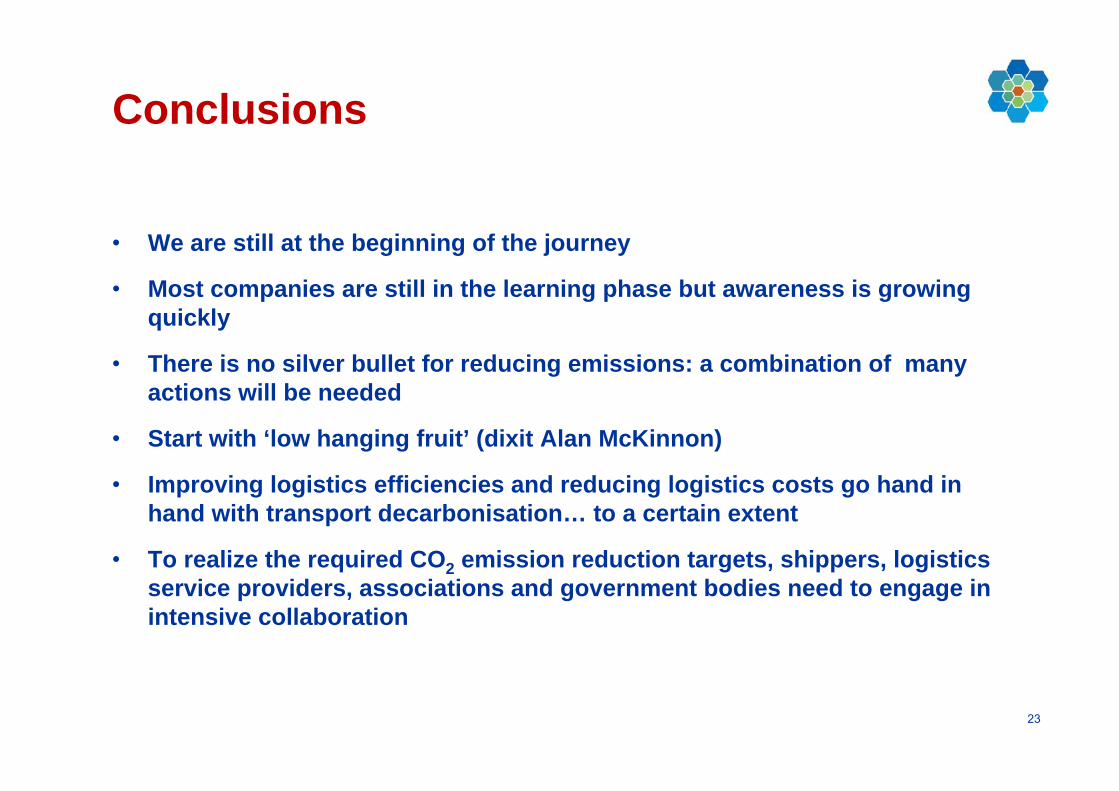
Conclusions
• We are still at the beginning of the journey
• Most companies are still in the learning phase but awareness is growing quickly
• There is no silver bullet for reducing emissions: a combination of many actions will be needed
• Start with ‘low hanging fruit’ (dixit Alan McKinnon)
• Improving logistics efficiencies and reducing logistics costs go hand in hand with transport decarbonisation… to a certain extent
• To realize the required CO2 emission reduction targets, shippers, logistics service providers, associations and government bodies need to engage in intensive collaboration

2424
Thank you for your attention!