measuring and mitigating - social market foundation
TRANSCRIPT


Measuring and mitigating child hunger in the UK
Aveek Bhattacharya Jake Shepherd
Kindly supported by

MEASURING AND MITIGATING CHILD HUNGER
1
FIRST PUBLISHED BY
The Social Market Foundation, December 2020 11 Tufton Street, London SW1P 3QB Copyright © The Social Market Foundation, 2020
The moral right of the authors has been asserted. All rights reserved. Without limiting the rights under copyright reserved above, no part of this publication may be reproduced, stored or introduced into a retrieval system, or transmitted, in any form or by any means (electronic, mechanical, photocopying, recording, or otherwise), without the prior written permission of both the copyright owner and the publisher of this book.
THE SOCIAL MARKET FOUNDATION
The Foundation’s main activity is to commission and publish original papers by independent academics and other experts on key topics in the economic and social fields, with a view to stimulating public discussion on the performance of markets and the social framework within which they operate. The Foundation is a registered charity (1000971) and a company limited by guarantee. It is independent of any political party or group and is funded predominantly through sponsorship of research and public policy debates. The views expressed in this publication are those of the authors, and these do not necessarily reflect the views of the Social Market Foundation.
CHAIR DIRECTOR
Mary Ann Sieghart James Kirkup
TRUSTEES
Professor Tim Bale Tom Ebbutt Baroness Grender MBE Rt Hon Dame Margaret Hodge MP Rt Hon Baroness Morgan of Cotes Trevor Phillips OBE Peter Readman Melville Rodrigues

SOCIAL MARKET FOUNDATION
2
CONTENTS
ACKNOWLEDGEMENTS 3
ABOUT THE AUTHORS 3
EXECUTIVE SUMMARY 4
CHAPTER ONE - INTRODUCTION 7
CHAPTER 2 - BACKGROUND CONTEXT 8
CHAPTER 3 - SURVEY FINDINGS AND MODELLING 14
CHAPTER 4 - POLICY RECOMMENDATIONS 26
APPENDIX A: SURVEY QUESTIONNAIRE 32
APPENDIX B: NOTES ON METHODS AND COMPARISON WITH OTHER SURVEYS 37
APPENDIX C: MODELLED ESTIMATE PROPORTION OF CHILDREN IN VERY LOW FOOD SECURITY BY LOCAL AUTHORITY 39
ENDNOTES 48

MEASURING AND MITIGATING CHILD HUNGER
3
ACKNOWLEDGEMENTS
The Social Market Foundation is grateful to Deliveroo for sponsoring this research. The views in the report do not necessarily reflect those of Deliveroo. The Social Market Foundation retains full editorial independence with respect to its research.
SMF would also like to acknowledge the support of Opinium in designing and carrying out the survey.
Thanks also to all those that contributed their time and insights to our expert roundtable, bringing perspectives from academia, the charity sector, advocacy and politics. In particular, we appreciated the opportunity to follow up on the discussion individually with Megan Blake and Clare Holley.
ABOUT THE AUTHORS
Aveek Bhattacharya
Aveek Bhattacharya joined the SMF as Chief Economist in September 2020. Prior to that, he was Senior Policy Analyst at the Institute of Alcohol Studies, researching and advocating for policies to reduce alcohol-related harm. He has also previously worked for OC&C Strategy Consultants, advising clients across a range of sectors including retail, consumer goods, software and services.
Aveek studied Philosophy, Politics and Economics at undergraduate level, and has Master’s degrees in Politics (from the University of Oxford) and Social Policy Research (from the London School of Economics). He is currently working towards a PhD in Social Policy at the London School of Economics. His thesis compares secondary school choice policy between England and Scotland.
Jake Shepherd
Jake joined the SMF research team in March 2020, having previously held research roles across the public and social sectors. He was last employed as a Research Analyst for the Office for National Statistics and before that he was a Research Assistant at public service reform think tank New Local Government Network.
Jake holds an MA in Social Research from the University of Leeds and a BA in Sociology from Manchester Metropolitan University.

SOCIAL MARKET FOUNDATION
4
EXECUTIVE SUMMARY
Food insecurity, and particularly child hunger, has been a source of growing social and political concern for the best part of a decade. There are fears that COVID-19, and the economic shutdowns brought in its wake, will make it even worse. That has drawn substantial public attention to the issue – not least as a result of a high-profile campaign from Marcus Rashford and his Child Food Poverty Taskforce and subsequent changes in Government policy on support for children in England on free school meals through the school holidays.
Campaigners have long argued that there is inadequate data on food insecurity and child hunger in the UK. In 2019, the Government incorporated a battery of questions on the topic into its Family Resources Survey. However, the 2019/20 results will not be published until March 2021, and it will be 2022 until we have data covering the period of the pandemic.
In this report, we attempt to fill that breach, providing initial findings on the level of food insecurity in the UK, as well as the impact of the pandemic. We commissioned Opinium to survey 1,000 parents, asking them a set of questions closely modelled on the ones that will be used to produce official government statistics when they arrive. We found that:
1. Levels of child food insecurity in the UK are high • Our survey suggests one in four children, 3 million in total, have faced some form of food
deprivation in the six months following lockdown.
• 16% of parents said that their children made do with smaller portions, had to skip meals or went a day without eating between March and September.
• 14% of children – 1.7 million across the country - were classified as facing very low food security, using an internationally recognised assessment tool.
2. Children in families hit worst by the pandemic have suffered most • Very low food security is more common and rose significantly for children with parents
working in hospitality and leisure, retail and construction – all sectors badly hit by economic shutdown.
• Of the children entering very low food security in 2020, 61% had parents whose wages had fallen (compared to 25% for those that did not enter very low food security), 44% had parents whose working hours had been cut and 24% had parents that lost a job.
3. Existing support schemes appear to have made a difference, but have not been adequate to address the problem • Reported usage of food banks rose from 8% before the crisis to 11% since, but reported
take-up of free school meals went down slightly from 22% to 20%.
• Only 30% of children receiving free school meals are classified as very low food security, suggesting that the measure is effective at reducing hunger.
• However, 60% of children classified as very low food security in the survey do not report receiving free school meals, indicating possible issues with take-up and targeting.

MEASURING AND MITIGATING CHILD HUNGER
5
In this report, we have also modelled levels of very low child food security by local authority, producing a national ‘heatmap’.i We find that rates are highest in London, where just under one in five (19%) of children face very low food security, as well as in the South West. In fact, the top three local authorities for estimated child food insecurity are in the East of the capital: Redbridge (25.5%), Tower Hamlets (24.7%) and Newham (23.9%).
Local authorities with the highest share of children with very low food security
Rank Local authority Number of children with very low food security
Proportion of children with very low food security
1 Redbridge 17,409 25.5%
2 Tower Hamlets 15,912 24.7%
3 Newham 18,851 23.9%
4 Harrow 12,471 23.7%
5 Brent 16,559 23.6%
6 Blackburn with Darwen 8,093 23.5%
7 Mid Devon 3,477 23.1%
8 Teignbridge 4,697 21.8%
9 North Devon 3,557 21.4%
10 Bolton 12,840 21.1%
11 Hackney 12,205 21.0%
12 Wandsworth 12,328 20.9%
13 Lewisham 12,855 20.6%
14 Manchester 22,626 20.4%
15 Ealing 15,030 20.3%
16 Waltham Forest 12,326 20.2%
17 Fylde 2,454 19.7%
18 Lambeth 11,195 19.6%
19 Barking and Dagenham 11,342 19.6%
20 Middlesbrough 5,744 19.6%
i An interactive version of the complete table and ‘heatmap’ are available at www.smf.co.uk/publications/measuring-child-hunger
SOCIAL MARKET FOUNDATION
6
Given the scale of the challenge, it is imperative that the Government does more. Specifically, we suggest the following policies:
1. Implement all recommendations included in the National Food Strategy. It is extremely welcome that the Government has expanded Holiday Activity and Food Programmes and increased the value of Healthy Start vouchers for pregnant women, but it should also adopt a third “urgent recommendation” of the National Food Strategy and expand eligibility for free school meals to all children whose parent or guardian is in receipt of Universal Credit or equivalent benefits.
2. Bolster Universal Credit and the wider benefits system, providing families with the money they need to buy food. The fundamental driver of food insecurity is a lack of money. The Government needs to find ways to get cash into the hands of those facing greatest hardship – perhaps by retaining the temporary £20 increase in Universal Credit, increasing its child element or widening coverage.
3. Coordinate and mobilise a national network of food redistribution. The Government should harness the energy and enthusiasm of businesses and civil society, coordinating food redistribution at a national level. It should provide funding for schemes to reduce waste, identify sources of waste in the food chain and direct surplus food to the places where it is required most.
4. Devolve responsibility and funding for on the ground food distribution to local authorities. Local authorities have the local knowledge, relationships and facilities necessary to cover the ‘last mile’ of food distribution. They should be given support and autonomy to develop their own Food Plans to meet their area’s needs, with ministerial oversight from the Department for Environment, Food and Rural Affairs.
5. Introduce healthy eating programmes across all local authorities, delivering social and nutritional support to families. Food insecurity should not be considered in isolation, separate from other challenges around diet and food. The Government should build on the expansion of Holiday Activity and Food programmes and encourage and support community-led initiatives such as food education schemes.

MEASURING AND MITIGATING CHILD HUNGER
7
CHAPTER ONE - INTRODUCTION
It is dismaying that one of the leading political issues in the UK in the year 2020 is how to feed hungry children. That is to some extent a consequence of the unprecedented disruption of the Coronavirus crisis – in particular, the economic damage it has wrought and the closure of schools. But the issue long predates the pandemic, and for years there have been warning signs that too many children have too little to eat. To a large extent, it is to the credit of dedicated campaigners – most prominently the footballer Marcus Rashford, but certainly not him alone - that they have forced politicians and wider society to confront the problems.
One of the issues these campaigners have raised consistently in recent years is the lack of robust data on food insecurity in the UK. With COVID-19 having dramatically reshaped society, that lack is felt particularly keenly at the moment. There are plenty of reasons why we might expect child food insecurity to have worsened since March, but we have little evidence to go on. The Government is in the process of developing official statistics, but nothing covering the pandemic era will be available until 2022. If we are to have informed discussion of the issue, if we are to design measures to effectively target and mitigate the problem, we need a more timely picture of the current scale and contours of child hunger.
The purpose of this report is to try and help to fill that gap. We have surveyed 1,000 parents across the country, asking them questions based closely on the measures of food insecurity the government itself will use, in order to estimate the scale of the problem over the past six months. We have used this survey data to model child food insecurity at a local authority level, creating a ‘heatmap’ identifying the parts of Great Britain where the problem is most severe. We then draw on this new data, as well as a private roundtable discussion with academic and policy experts in the field, to produce a set of recommendations for policymakers seeking to alleviate the suffering we have uncovered.
The report is structured as follows:
• Chapter 2 - provides background context, summarising what we knew about child hunger going into the pandemic, what we know about how it has changed and setting the political scene.
• Chapter 3 - describes the findings of our survey and modelling.
• Chapter 4 - sets out our policy recommendations.

SOCIAL MARKET FOUNDATION
8
CHAPTER 2 - BACKGROUND CONTEXT
Hunger in the UK leading into the pandemic
Food insecurity, and particularly child hunger, has been a source of growing social and political concern in the UK for the best part of a decade, long predating the current Coronavirus crisis. Back in 2013, responding to a sharp rise in the use of emergency food aid, a decrease in the number of calories consumed, and an increase in diagnoses of malnutrition, medical experts writing in the BMJ declared the country to be facing a “public health emergency”.1 Despite a subsequent fall in food prices2 and higher earnings for low paid workers driven by the introduction of the National Living Wage,3 the issue has persisted. A 2019 report by the United Nations Special Rapporteur on extreme poverty and human rights, Philip Alston, described dire poverty, with some families having to choose between food and heating4 - though his account was strongly contested by the Government at the time.5 A Human Rights Watch report, also from last year, was even more damning, accusing the Government of failing to secure people’s right to food.6
Levels of food poverty were high going into the pandemic. According to the Trussell Trust, 1.9 million emergency food parcels were handed out by food banks in the financial year 2019/20 – an increase of 18% from the previous year. 700,000 of these are believed to have gone to children, more than double the figure for 2013/14.7 Moreover, such efforts fall short of true needs: it has been estimated that, in London alone, 9 million meals are needed per month to sufficiently alleviate hunger.8
Overall, there are 4.2 million children living in poverty,9 and even prior to the pandemic child poverty rates were expected to increase further. Both the Social Mobility Commission and the Resolution Foundation forecast that there will be an additional 1 million children in relative poverty between 2022 and 2024.10 In 2017, UNICEF estimated that 10% of British children experience severe food insecurity (compared to the European average of 4%).11 The Environmental Audit Committee has said that the UK has among the highest food insecurity levels in Europe.12
COVID-19 and hunger
The economic shutdowns of recent months, disproportionately hitting lower income households, have created fears that COVID-19 has made – and will continue to make – an already challenging situation considerably worse. Based on a survey carried out by the Children’s Commissioner at the end of April 2020 – the ‘spring peak’ of confirmed COVID cases – it was estimated that 88,000 children had seen a parent lose their job, 1.2 million were in families where a parent had been furloughed, and 2 million were in families where a parent’s working hours were reduced. This equates to over 3 million children living in households losing between a fifth (the furlough rate) and a half (the Universal Credit replacement rate) of their earnings.13 The Trussell Trust, the UK’s largest food bank network, has said that it supported 81% more people in March 2020 than in the same month the previous year – a “record spike”.14 In November 2020, the Legatum Institute estimated that 690,000 people – including 120,000 children – have entered poverty because of the Coronavirus crisis.15

MEASURING AND MITIGATING CHILD HUNGER
9
In response, there has been growing pressure on governments to do more to address child food insecurity. In August, the United Nations issued a Call to Action, urging them to adopt the following actions in order to prevent “an intergenerational hunger and malnutrition crisis”:16
1. Safeguard and promote access to nutritious, safe, and affordable diets 2. Invest in improving maternal and child nutrition through pregnancy, infancy, and early
childhood
3. Reactivate and scale-up services for the early detection and treatment of child wasting and maintain and expand other nutrition services
4. Maintain the provision of nutritious and safe school meals for vulnerable children
5. Expand social protection to safeguard access to nutritious diets and essential services
Debate in the UK has centred around one measure in particular: free school meals for vulnerable children. Going into the crisis, many families were reliant on school meals to adequately feed their children, and the loss of that provision due to school closures has made the task much harder. In response to the crisis, the Department for Education established an electronic voucher system so that families of children in England who normally receive free school meals could buy food at supermarkets instead.17 However, it took two weeks from the start of lockdown to launch, and was not eligible for use at cheaper supermarkets or outside of term time.18
Campaigners, activists, and members of parliament – most prominently Rashford and his Child Food Poverty Taskforce – have argued that this is inadequate, and called for year-round food distribution to make sure children do not go hungry during the school holidays. This has prompted a succession of U-turns from the Government, pressured into extending provision into first the Easter holidays,19 then the summer holidays,20 and finally the Christmas holidays and into 2021. The most recent announcement includes a £170 million winter grant scheme to local authorities, along with the expansion of pre-existing programmes such as Healthy Start and Holiday Activities and Food.
The free school meals debate has taken place against the backdrop of a broader policy discussion over how best to address child hunger. The National Food Strategy, commissioned by the Government as the first major review of UK food policy in almost 75 years, makes a series of recommendations to alleviate the effects of the pandemic upon Britain’s poorest households.21 Most relevantly, it calls for a relaxation of eligibility criteria for the Free School Meals programme, extension of the Holiday Activity and Food Programme to the whole country, and an increase in the value of Healthy Start vouchers for pregnant women and households with children under four.
Drivers of food insecurity and child hunger
Food insecurity comes in different degrees of severity, from a lack of variety of food to going without completely.22 It has many causes, stemming in different ways from social disadvantage and government policy. However, three in particular were identified by the Environmental Audit Committee as particularly significant,23 a finding echoed by charities and academic researchers:24
• Low income and high living costs. • Universal Credit and the wider benefits system.

SOCIAL MARKET FOUNDATION
10
• Cuts to funding for local social care services.
Poverty and inequality have been identified as major obstacles to the Government achieving its nutrition targets. For households with children in the bottom two income deciles, 42% of disposable income is needed in order to meet the Government’s Eat Well Guide costs.25 The Trussell Trust has said that the median monthly income after housing costs of people referred to food banks was £215, 11% of the national average.26 Financial hardship has in some cases been exacerbated by difficulties with the benefits system, to a significant extent stemming from the adjustment to Universal Credit. A 2018 study led by Rachel Loopstra of King’s College London found that extended waiting periods for payments (often five weeks when people first sign up), delayed payments, and benefits sanctions can all limit people’s ability to afford food week-to week.27 The Trussell Trust found that demand for foodbanks had increased 52% in the twelve months after Universal Credit was introduced, even after accounting for seasonal variation.28 Issues with Universal Credit may also limit people’s ability to make use of other support programmes. For example, the Healthy Start initiative for pregnant women and children under four requires individuals to be a recipient of benefits.29 Wider challenges facing the system, such as vouchers not being accepted in particular supermarkets, can have deep consequences – not just the immediate lack of access to food, but also through stigma and humiliation discouraging the further take-up of support.
Meanwhile, cuts to funding for local authorities have limited the amount of support they can provide vulnerable families. According to the Environmental Audit Committee, this has restricted local authorities’ ability to “serve as a centralised point for a number of services, such as providing advice on medical issues, overcoming barriers to accessing benefits, and developing career skills”.30 It is no longer mandatory for local authorities to maintain welfare funds, which can be a vital source of crisis support for households. Consequently, their use has declined.31
Challenging life experiences and disruptions – such as housing eviction, divorce and ill health – also drive families towards the use of food banks. Turbulence in the home can negatively affect household finances, and due to stress or time scarcity make it harder to engage with the welfare system.32 Negative economic shocks, such as losing a job or having reduced work hours, are particular risk factors for referral to food banks. Similarly, a lack of informal social support from friends and family makes it harder to weather downturns in fortune.33
Migrant children are particularly vulnerable to hunger. Those subject to the Government’s ‘No Recourse to Public Funds’ policy were deemed ineligible for free school meals, and therefore prevented from using vouchers handed out during the closure of schools. However, the Government has temporarily extended free school meal eligibility to these children as a result of the COVID-19 outbreak.34
Non-governmental action on food insecurity and child hunger
Even before the pandemic, charities and parts of the private sector were making significant efforts to reduce food poverty in the UK, with some demonstrable success. For example, the Courtauld Commitment 2025, a voluntary agreement made by signatories across the retail, manufacturing and hospitality sectors and funded by the UK and devolved governments, aims to make the production and consumption of food more sustainable. It contains pledges to accelerate action on food waste and to increase the amount of surplus food that is redistributed.35

MEASURING AND MITIGATING CHILD HUNGER
11
Organisations such as FareShare, a national network of charitable food redistributors, work both with producers and with frontline charities so that food that would otherwise be thrown away can be delivered to those that need it most. In 2019/20, FareShare alone redistributed 57.3 million meals, providing over 930,000 people with access to food.36
Anticipating higher and different needs to be met in the wake of the COVID-19 pandemic, charities and businesses alike have increased their response. WRAP, the group in charge of delivering the Courtauld 2025 agreements, administers a government-funded COVID-19 Emergency Surplus Food Grant to assist food redistributors obtain and distribute surplus food to people in need.37 FareShare and linked organisations have delivered an additional 16 million meals to vulnerable families throughout the pandemic.38 Companies including Deliveroo, Pret a Manger, and Tesco have made large, in-kind food donations.39 After a public rally of support for Marcus Rashford’s campaign, even smaller businesses such as local cafés and restaurants have offered free lunches to children experiencing hunger in the school holidays.40
Despite significant progress, there are limits to what the private and third sectors have been able to achieve so far. Less than 1% of food sold by retailers is now wasted, but the figure is higher for manufacturers (3%), and much higher (18%) for hospitality and food services.41 There is therefore a need for food redistribution efforts to extend into other areas of the supply chain. However, as participants in our expert roundtable told us, repurposing non-retail food is often trickier because it is less clearly compliant with regulations on, for example, food safety and labelling. Non-retail food firms may often also be smaller, and thus less well placed to coordinate with government on where to send donations. There is a potential role then for both local and national government in helping firms and charities to coordinate donations and navigate and comply with regulations.
Defining and measuring food insecurity and child hunger
Governments and experts tend to speak more of ‘food insecurity’, a broader and more fundamental concept than ‘hunger’. The term can be defined in a number of different ways, including as a “limited access to food due to a lack of money or other resources” by the Food and Agriculture Organisation of the United Nations and the World Health Organisation,42 a “household-level economic and social condition of limited or uncertain access to adequate food” by the US Department of Agriculture,43 and the inability “to secure enough food of sufficient quality and quantity to allow you to stay healthy and participate in society” by the Food Foundation here in the UK.44 ‘Hunger’ is a more familiar concept, but being inherently subjective, its measurement is more elusive.
There is no single method for measuring food insecurity and its different dimensions, but rather a number of possible approaches.45 Objective measures can draw on different types of statistics. They can compare household incomes and expenditures to food prices to identify those with inadequate resources to afford sufficient nutritious food.46 Alternatively, food insecurity can be measured by identifying how many people lack sufficient income to afford a ‘socially acceptable’ food budget.47 Food intake surveys can be used to gauge calorie consumption. Physical anthropometric measurements, such as growth or thinness, offer another way to observe the impact of differences in diet.48
Alternatively, there are subjective measures of food insecurity, designed to capture households’ reported experiences of food. Typically these are survey-based, but can be derived through other

SOCIAL MARKET FOUNDATION
12
means of data collection, such as social media listening.49 Objective and subjective approaches each have strengths and weaknesses, but given that our ultimate concern is usually with how households actually function rather than whether they could theoretically afford to buy food, subjective indicators tend to be more favoured.50 Though food insecurity is certainly closely linked to a household’s financial resources, it can be the consequence of any number of other factors, which is why researchers increasingly prefer asking people directly about their experiences.51
Figure 1: Conceptualising food insecurity
Source: Food Foundation (2017)
The most prominent subjective measures of food insecurity are the US Department of Agriculture’s (USDA) Household Food Security Module, the Canadian Household Food Security Survey Module, and the UN’s Food Insecurity Experience Scale (FIES). Though these are not identical in terms of content and wording, they broadly overlap. Each asks people to report how much they have had to worry about affording food, the variety of their diet, skipping meals, reducing portions or running out of food. The USDA and Canadian surveys ask parents explicitly about their children as well.
Assessing food insecurity and child hunger in the UK
It has long been argued that there is inadequate data on food insecurity and child hunger in the UK. Unlike the US or Canada, figures are not routinely collected by the government. Since 2016, a range of groups, including the All-Party Parliamentary Group on Hunger,52 the Food Research Collaboration, the Food Foundation, Oxfam, Sustain and the University of Oxford Sociology Department have called for a standard measure, incorporated into official national surveys.53 Even the Deputy National Statistician of the Office for National Statistics has acknowledged there are a “confused set of requirements” and a need for better reporting. 54 In 2017, the Labour MP Emma Lewell-Buck introduced a Private Members’ Bill calling for the Government to “monitor and report on food insecurity” and “to make provision for official statistics on food insecurity”.55
In 2019, the Government responded by confirming that ten standard questions on food insecurity, based on the USDA’s battery of questions, would be included in its Family Resources Survey from April of that year.56 However, it will be some time before official statistics are released: 2019/20 data will not be published until March 2021. For data on the impact of the pandemic, we will have to wait until 2022.
In the meantime, there are a number of data sources that can shed light on the level of child food insecurity and hunger in the UK, before and since coronavirus hit. In terms of objective measures,
MILD FOOD INSECURITY MODERATE FOOD INSECURITY SEVERE FOOD INSECURITY
Worrying about the ability to obtain food
Compromising on quality and
variety of food
Reducing quantities,
skipping meals
Experiencing hunger

MEASURING AND MITIGATING CHILD HUNGER
13
the Food Foundation conducted an affordability analysis of the Government’s Eatwell Guide, which shows what and how much individuals should be eating to achieve a healthy balanced diet.57 Comparing the costs of a diet consistent with the guide to disposable incomes, the Food Foundation found that the Eatwell recommended standard was unaffordable for more than half of all British households, some 14.4 million in total. For households with children in the bottom two income deciles, keeping to the Eatwell diet would mean spending 42% of the after-housing disposable income.58
The Food and You consumer survey, carried out biannually by the Food Standards Agency, measures household food security by asking questions that relate to experiences with food access and consumption. The 2018 version showed that 10% of households were ‘marginally’ food secure, whereas 10% were experiencing low or very low food security. It also found that people who lived with children were less likely to have high food security (70% versus 84%).59
Between April and July 2020, the Food Standards Agency carried out a series of ‘consumer tracker’ surveys which covered food security and affordability. It showed that 16-18% of adults said that they had cut down the size of their portions or skipped meals in the past month. That figure was higher for those living in households with a child present: ranging from a reported 24% in May to 33% in June.60
The Food Foundation has also attempted to track food insecurity through the Coronavirus pandemic. In September 2020, it reported that 14% of adults living with children had experienced food insecurity over the previous six months. This means that 4 million people, including 2.3 million children, experienced food insecurity. For example, data showed that 12% of adults living with children had said they skipped meals because they could not afford or access food, whereas 4% said they had gone a whole day without eating. This indicates an increase from the period before the pandemic, when 11.5% of households with children were estimated to have experienced food insecurity.61

SOCIAL MARKET FOUNDATION
14
CHAPTER 3 - SURVEY FINDINGS AND MODELLING
A new, rapid response survey to estimate the impact of COVID-19 on child hunger and food insecurity
With official government measures of food insecurity in the COVID-era not due for release until March 2022, the Social Market Foundation commissioned the research company Opinium to carry out an online survey to give us a more immediate sense of how families have been affected by the crisis. They provided a nationally representative sample of 3,000 UK adults, 1,000 of whom are parents of children under 18.
The full survey questionnaire is reproduced in Appendix A. The questions that we asked were mostly based on the USDA’s food security survey module, and thus should be similar to the food security measures that will eventually be published by government. However, we adapted the USDA survey in three significant ways to better suit our purposes. First, we dropped some of the questions on adult food insecurity in the interests of brevity, since the focus of our research is on children. Second, we asked respondents to describe their diets over a recall period of six months, rather than the 12 months used by USDA or the 30 days used by the UK Family Resources Survey.62 This is to ensure that we captured the full range of experiences since the pandemic struck, recognising that circumstances may have shifted significantly from the start of lockdown to the end of the summer. Third, to identify the scale of the changes wrought by the pandemic, we asked people to think back and explicitly compare their experiences in the past six months to the equivalent period in the previous year: March to September 2019.
The prevalence of child food insecurity in the UK
Figure 2 shows the proportion of parents that said their children experienced different forms of deprivation over the first six months of the Coronavirus crisis. Overall, around a quarter faced some form of food insecurity: that amounts to almost 3 million children nationally. 24% said they had had to rely on only a few kinds of low-cost food. 18% said that they couldn’t afford balanced meals and that their child was not eating enough. 16% said that their children had faced smaller portion sizes, had to skip meals or went a day without eating. 7% said their child went hungry.
These figures are striking, indicating that a large minority of children in the UK have experienced significant hardship over recent months. They suggest that the scale of the problem is greater than many might previously have imagined. Consequently, we have analysed them closely – in Appendix B, we compare the results to other similar surveys, and discuss possible methodological reasons for discrepancies.
MEASURING AND MITIGATING CHILD HUNGER
15
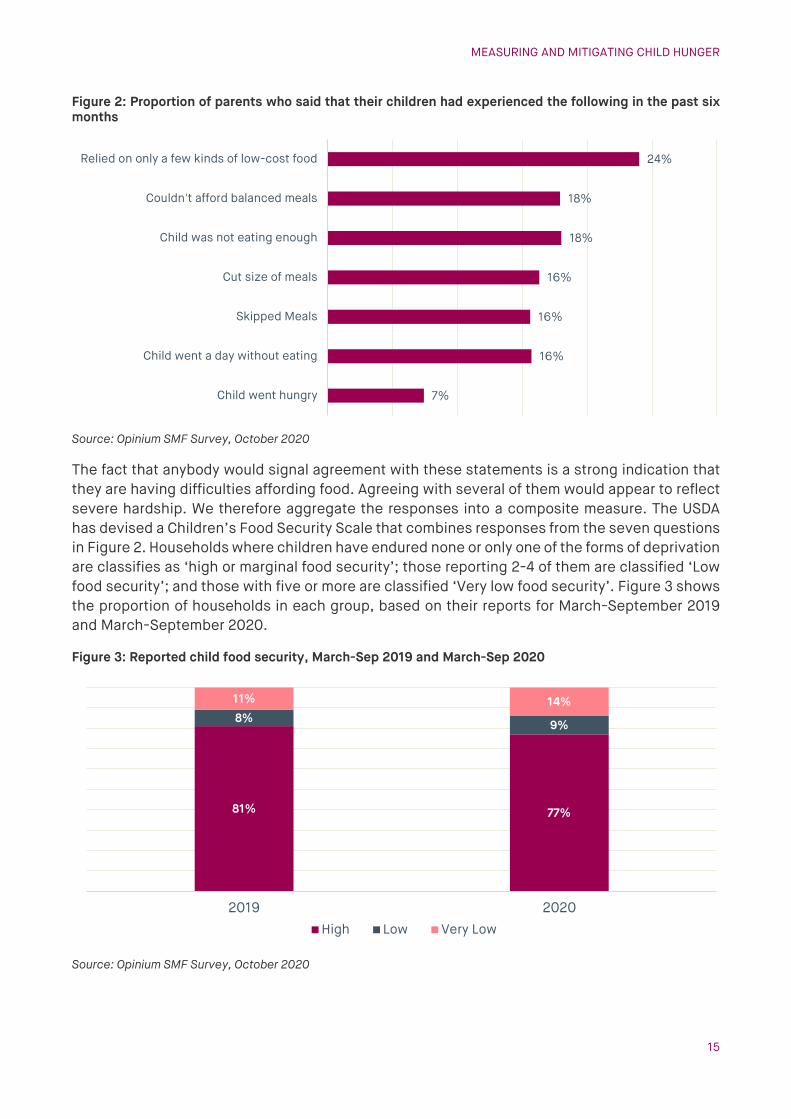
Figure 2: Proportion of parents who said that their children had experienced the following in the past six months
Source: Opinium SMF Survey, October 2020
The fact that anybody would signal agreement with these statements is a strong indication that they are having difficulties affording food. Agreeing with several of them would appear to reflect severe hardship. We therefore aggregate the responses into a composite measure. The USDA has devised a Children’s Food Security Scale that combines responses from the seven questions in Figure 2. Households where children have endured none or only one of the forms of deprivation are classifies as ‘high or marginal food security’; those reporting 2-4 of them are classified ‘Low food security’; and those with five or more are classified ‘Very low food security’. Figure 3 shows the proportion of households in each group, based on their reports for March-September 2019 and March-September 2020.
Figure 3: Reported child food security, March-Sep 2019 and March-Sep 2020
Source: Opinium SMF Survey, October 2020
24%
18%
18%
16%
16%
16%
7%
Relied on only a few kinds of low-cost food
Couldn't afford balanced meals
Child was not eating enough
Cut size of meals
Skipped Meals
Child went a day without eating
Child went hungry
81% 77%
8% 9%
11% 14%
2019 2020High Low Very Low

SOCIAL MARKET FOUNDATION
16
Overall, our survey suggests that 14% of children have experienced very low food security in the six months following the pandemic, some 1.7 million in absolute terms. That is a similar order of magnitude to the 10% of children, and 14% of households containing children experiencing any kind of food insecurity, moderate or severe, estimated by the Food Foundation.63 The survey also indicates a non-trivial uptick in reported food insecurity, with a 3 percentage point rise in very low food security compared to the same period a year ago. However, given the magnitude of the damage done to the economy by coronavirus, it is notable that the increase is not any greater. This is likely to be a reflection of the Government’s success to this point in protecting incomes through the downturn.
Which sorts of families are at greatest risk of child food insecurity?
As described above, food insecurity is to a significant extent a consequence of economic disadvantage and high living costs. Unsurprisingly, in our survey families that reported lower incomes, and who reported higher housing costs relative to their income were more likely to classified as in a state of very low food security. Younger parents were more likely to report very low child food security: just under a quarter of those aged under 35 did so, compared to less than 10% of parents in their late 40s and above, as Figure 4 shows.
Figure 4: Proportion of households classified as very low child food security, by age of parent
Source: Opinium SMF Survey, October 2020
A child’s risk of low food security also varies by parental occupation, as Figure 5 shows. Unsurprisingly, sectors with lower pay and often less consistent and secure contracts, such as hospitality and retail, had higher levels of food insecurity, with around a quarter of parents recalling difficulty feeding their children prior to the pandemic.
23%24%
19%
12%
8%7% 8%
4%
9%
0%
5%
10%
15%
20%
25%
30%
18-29 30-34 35-39 40-44 45-49 50-54 55-59 60-64 65+

MEASURING AND MITIGATING CHILD HUNGER
17
Figure 5: Proportion of households classified as very low child food security, by parent’s occupational sector
Source: Opinium SMF Survey, October 2020
Notice the large increases in very low child food security in hospitality and leisure (up 7 percentage points from 2019 to 2020, to 35%) and construction (up 8 percentage points to 26%) - both sectors were badly affected by shutdowns to slow the spread of the virus. Figure 5 also shows that these were the sectors in which the highest proportion of respondents said that their incomes had fallen since the pandemic. It is therefore reassuring that the construction sector appears to be in recovery, albeit a fragile one, with some continued plans for job cuts.64 On the other hand, these figures illustrate the importance of providing adequate support to workers in the hospitality sector, which faces ongoing uncertainty in the months to come.
How has the pandemic affected child food insecurity?
The pandemic has been hugely disruptive to the accessibility and affordability of food. In our survey, 33% of respondents said that they had not always had enough food to eat and enough of the kinds of food they wanted to eat, up from 20% a year earlier. The picture was even starker for families with children: 43% said that they lacked enough of their preferred kinds of food in 2020, compared to 31% in 2019.
However, different sorts of families have been disrupted in different ways. As Figure 6 shows, there are significant differences in the reasons why people were unsatisfied with the food they ate between those who had too little and those who could only get the wrong kinds. Those who did not have enough food were more likely to cite affordability and transport as obstacles to getting food – although it is still striking that less than a third of parents who said they lacked sufficient food said that affordability was the reason. That suggests that providing families with
28%
24%
27%
18%
14%
18%
14%
11%
10%
35%
28%
27%
26%
21%
20%
17%
13%
11%
0% 5% 10% 15% 20% 25% 30% 35% 40%
Hospitality & leisure
Retail
Manufacturing
Construction
Transportation & storage
Other public sector
Professional services
Health and social care
Education
2019 2020
Proportion of households with adult working in sector reporting reduced income
41%
28%
23%
39%
28%
25%
34%
24%
27%

SOCIAL MARKET FOUNDATION
18
money is unlikely to solve the problem on its own. Previous SMF research has found that 10.2 million individuals live in ‘food deserts’ – areas poorly served by food stores, where people with disabilities or without cars may struggle to access healthy and affordable food.65 Providing such households with food in more nearby and convenient locations is an important task for policymakers, and we address how they could go about it in the following section.
By contrast, those who said they had enough food, but not the right kinds, were more likely to cite availability on the shelves – perhaps reflecting disruption to supply chains and panic buying earlier in the crisis. A substantial minority referred to coronavirus-specific reasons: 13% said they lacked for food because they did not feel safe to go to the shops, for example because they were shielding. Others pointed to longer standing structural and geographical issues: 10% said they had too little food because of a lack of appropriate shops in the area.
Figure 6: Reasons offered by parents for why they had too little or the wrong kinds of food
Source: Opinium SMF Survey, October 2020
Looking specifically at those families who reported moving into very low child food security in 2020, having been more food secure in 2019, we see that they were disproportionately affected by the economic fallout from the pandemic.ii As Figure 7 shows, 61% reported reduced income,
ii We should be a little careful in interpreting these figures as they are based on a relatively small sample: 32 respondents to the survey were classified as moving into very low food security in 2020.
2%
9%
4%
4%
16%
14%
14%
25%
12%
1%
7%
2%
6%
13%
19%
10%
13%
29%
Other
Wasn’t able to get deliveries
Didn’t have the time to go to the shops
Didn’t have the time to cook
Didn’t feel safe/was advised not to go to shops due to coronavirus (e.g. shielding)
Wasn’t able to travel to shops
Didn’t have the right shops in the local area
The right sort of food wasn’t available in the local shops
Wasn't able to afford it
Sometimes not enough to eat at all or often not enough to eat at all
Enough food to eat but not always the kinds of food I/we want

MEASURING AND MITIGATING CHILD HUNGER
19
compared to 25% of all other parents with children. 44% had faced reduced working hours, compared to 24% of other parents. Around a quarter said they had lost their job and 22% said they had suffered a delay in benefits payments, far higher than the rest of the population. Parents moving into very low child food security were only marginally more likely to report being placed on furlough, indicating that the job retention scheme did effectively cushion the blow for many families. There was also no relationship between suffering a suspected or confirmed case of COVID-19 and a deterioration in child food security.
Figure 7: Experiences of the crisis, Parents entering Very Low Child Food Security compared to other Parents
Source: Opinium SMF Survey, October 2020
How far have support mechanisms mitigated child food insecurity?
As described above, there are several different forms of support that may be available to those struggling to feed themselves or their children, albeit sometimes with limits in capacity and accessibility. Most prominently, there are government-funded free school meals. There are also charitable food banks, as well as ‘breakfast clubs’ and ‘holiday clubs’ that provide children with food, often through schools as well as non-governmental organisations. Figure 8 shows how reported usage of these schemes compares to recalled usage before the pandemic.
61%
44%
32%
24%
22%
12%
10%
2%
27%
25%
24%
26%
9%
4%
15%
11%
3%
59%
Reduced income
Reduced working hours
Been placed on furlough
Lost a job
Suffered a delay in benefits payments
Increased working hours
Suffered coronavirus symptoms
Tested positive for coronavirus
None of these
Entered VLFS in 2020 Other households with children

SOCIAL MARKET FOUNDATION
20
Figure 8: Reported usage of support schemes by parents
Source: Opinium SMF Survey, October 2020
For all the attention free school meals have attracted in recent months, in our survey the proportion of parents reporting receiving them has gone down slightly – from 22% before the pandemic to 20% during it. By contrast, the proportion of parents reporting using food banks has risen – from 8% before the pandemic to 11% since it struck.
Those parents that have made use of support during the pandemic vary in their level of food security, as Figure 9 shows. 60% of those that reported using food banks were classified as very low child food security, whereas only a minority – 30% - of those using free school meals were. In part, this could be a reflection of the effectiveness and adequacy of these different forms of assistance. If most children in families receiving help from food banks nonetheless remain in very low food security, that demonstrates that food bank provision is not enough on its own. By contrast, the finding that most children on free school meals are not classified as existing in very low food security would seem to indicate that free school meals are effectively addressing food insecurity for at least some of those that receive them.
Figure 9: Proportion of households that reported using support scheme classified as very low child food security
Source: Opinium SMF Survey, October 2020
22%
14%12%
8%
20%
13% 12% 11%
Free School Meals Breakfast club Holiday club Food Bank
Used before the pandemic Used since the pandemic
30%
47%52%
60%
Free School Meals Breakfast club Holiday club Food Bank

MEASURING AND MITIGATING CHILD HUNGER
21
At the same time, these results could also reflect how well targeted different forms of support are. Figure 10 shows the proportion of households with children classified as very low food security that accessed each form of help. It suggests that less than half made use of food banks, and only 40% accessed free school meals. That, in turn, shows the risks of relying excessively on any one form of assistance – for example, an exclusive focus on free school meals could risk missing substantial numbers of hungry children.
Figure 10: Proportion of households with children classified as very low food security that made use of each form of assistance
Source: Opinium SMF Survey, October 2020
Mapping child food insecurity in Great Britain
In order to understand the distribution of child food insecurity in more detail, we created a model estimating its level in each local authority in Great Britain. The modelling had three stages. To begin with, we combined data on the rate of child poverty, take-up of free school meals, housing costs and the level of employment in industries that put households at greater risk of child food insecurity in our survey (such as hospitality or construction). These were weighted according to their predictive power in identifying households with very low food security in our survey, and (for English local authorities) combined with data on the proportion of children identified as underweight at ages 4-5 and 10-11. That gave us an initial estimate of child food insecurity for every local authority in the country. The second stage was to produce regional estimates for child food insecurity. We did this by aggregating these ‘bottom up’ estimates to the government office region level, and combining them with three other data sources: our survey estimate of very low food security in each region, the Food Foundation’s estimate of food insecurity in each region and the region’s share of food bank usage. That gave us an estimate of the number and proportion of children in very low food security in each region. Finally, within each region, the number of children estimated to be in very low food security was distributed between local authorities in proportion to each local authority’s share of food insecure children in the ‘bottom up’ model.
40% 42% 44% 47%
60% 58% 56% 53%
Free School Meals Breakfast club Holiday club Food Bank
Used Not used

SOCIAL MARKET FOUNDATION
22
Figure 11: Summary of the modelling process
It is important to emphasise that the figures produced are modelled estimates: the level of child food insecurity that we would expect in a local authority, based on its fundamental characteristics. The model can be thought of as offering a ‘bird’s eye’ view of the phenomenon, and as such, it is incapable of detecting circumstances ‘on the ground’. Thus, for example, it could be that particular local authorities or charitable schemes in certain areas have been particularly effective at addressing food insecurity – that would not be reflected in our modelled estimates.
Figure 12 shows the estimated proportion of children facing very low food security by region. It shows that rates are highest in London, where just under one in five (19%) of children face very low food security. The South West is also considerably above national average, with a rate of 17%. By contrast, levels of child food insecurity are lowest, though still too high, in the South East and East Midlands, where they are closer to 10%. Northern Ireland is left out of the model because of a lack of comparable data with the rest of the country.
Stage 3: Aligning regional to LA estimates
For each region, estimated number of food insecure children divided between LAs in proportion to their share of food insecure children using the ‘bottom up’ method
Stage 2: Regional estimates
Based on:
- Aggregated ‘bottom up’ LA estimates
- SMF survey - Food Foundation
survey - Food bank use
Based on:
-
Stage 1: ‘Bottom up’ Local authority estimates

MEASURING AND MITIGATING CHILD HUNGER
23
Figure 12: Modelled Estimate proportion of children in very low food security by region
Source: SMF food insecurity model
Table 1 presents the local authorities in Great Britain with the highest proportion of children in very low food security. Figures for every local authority can be found in Appendix C.iii The most severe levels are estimated to be in East London, highest in Redbridge, where over a quarter of children are classified to be in very low food security, with Tower Hamlets and Newham not far behind. There are other ‘hot spots’ in the North West, such as Blackburn with Darwen, Bolton and
iii An interactive version of the complete table and ‘heatmap’ are available at www.smf.co.uk/publications/measuring-child-hunger

SOCIAL MARKET FOUNDATION
24
Marcus Rashford’s home city of Manchester, which is 14th on the list. Given the high levels of hunger in the South West, three local authorities in Devon also feature in the top 10.
Table 1: Local authorities with the highest share of children with very low food security
Rank Local authority Number of children with very low food security
Proportion of children with very low food security
1 Redbridge 17,409 25.5%
2 Tower Hamlets 15,912 24.7%
3 Newham 18,851 23.9%
4 Harrow 12,471 23.7%
5 Brent 16,559 23.6%
6 Blackburn with Darwen 8,093 23.5%
7 Mid Devon 3,477 23.1%
8 Teignbridge 4,697 21.8%
9 North Devon 3,557 21.4%
10 Bolton 12,840 21.1%
11 Hackney 12,205 21.0%
12 Wandsworth 12,328 20.9%
13 Lewisham 12,855 20.6%
14 Manchester 22,626 20.4%
15 Ealing 15,030 20.3%
16 Waltham Forest 12,326 20.2%
17 Fylde 2,454 19.7%
18 Lambeth 11,195 19.6%
19 Barking and Dagenham 11,342 19.6%
20 Middlesbrough 5,744 19.6%
Source: SMF food insecurity model
Figure 13 shows the relationship between the proportion of children with very low food security in each local authority and the proportion of children in poverty. Unsurprisingly (not least because child poverty rates are one of the components of the model), there is a positive association between the two. In general, places with higher child poverty rates have higher rates of food insecurity. However, they are not perfectly correlated. For example, Redbridge’s child poverty rate is only slightly above national average at 16%, but its modelled rate of child food insecurity

MEASURING AND MITIGATING CHILD HUNGER
25
is very high because it has one of the highest proportions of children underweight in the country, and relatively high housing costs. Again, this suggests that income is important to understanding child food insecurity, but that it ought to be considered alongside other factors to get a complete picture of the phenomenon.
Figure 13: Estimated proportion of children in very low food security and proportion of children in poverty by local authority
Source: SMF food insecurity model; Department for Work & Pensions, Children in low income families: local area statistics 2014/15 to 2018/19
0.0%
5.0%
10.0%
15.0%
20.0%
25.0%
30.0%
0.0% 5.0% 10.0% 15.0% 20.0% 25.0% 30.0% 35.0%
% o
f chi
ldre
n in
ver
y lo
w fo
od s
ecur
ity
% of children in poverty

SOCIAL MARKET FOUNDATION
26
CHAPTER 4 - POLICY RECOMMENDATIONS
In this report we have examined the prevalence of child hunger and food insecurity in the UK, the ways they have been exacerbated by coronavirus, and the challenges of measuring them. We have also provided timely data on food insecurity, showing that insecurity has indeed risen during the pandemic. In this final chapter, we explore the UK’s hunger and food policy landscape, so as to highlight possible gaps and opportunities for change to address this stark challenge.
In response to the challenges faced by families and institutions in the wake of the pandemic, as well as increased public scrutiny and pressure, the UK Government has made a number of policy announcements to address child poverty and hunger in recent months:
• April 2020: the Government agreed to provide a national voucher scheme to children that receive free school meals during the Easter holidays.66 Due to the drastic impact of COVID-19 on the labour market, it announced temporary expansions to the benefits system, including the increase of the standard allowance and the removal of the ‘minimum income floor’ for the self-employed. In November, the MIF removal was extended until April 2021.
• June 2020: in England, the Government announced its provision of a £120 million summer school fund to provide vouchers to children who qualify for free school meals, essentially extending the scheme throughout the summer holidays. Shortly thereafter, the devolved nations made similar commitments.
• November 2020: the Government agreed to provide a £170 million winter grant scheme, allowing councils to provide extra support to those most in need with food and bills over the winter holiday period. It also pledged to expand its holiday food and activities programme for all holidays during 2021, and to increase Healthy Start payments from April 2021.
These are unlikely to be the final word on the matter, given that food insecurity remains high for many families, and the economic outlook remains difficult. For example, the Government has identified potential disruption to food supply chains from a ‘no deal’ Brexit as posing a particular risk to the food security of low income groups, including those with children.67 The Government is likely to face sustained pressure to continue delivering support to recipients of free school meals outside of school holidays. The Institute for Fiscal Studies has estimated that making the scheme permanent, under current eligibility rules, would cost around £270 million a year. When pupils made newly eligible due to slipping into food insecurity during the pandemic are taken into account, assuming that the number of benefits caseloads return to what they were before the pandemic, that cost rises to £370 million.68
Table 2 provides a list of the major policies and forms of support provided by the Government to prevent hunger, including new measures introduced during the crisis. It is worth noting that local authorities in Wales, Scotland, and Northern Ireland have adopted slightly different approaches to dealing with the hunger crisis, such as opting to provide cash transfers instead of vouchers so that poor families can access food more quickly.69

MEASURING AND MITIGATING CHILD HUNGER
27
Table 2: Government policies to address child hunger and food insecurity
Policy Description COVID-19 Response
Free School Meals
Prior to the crisis, free school meals were available during term-time to children in the first three years of school or older children from families in England and Wales receiving less than £7,400 per year after tax and before benefits. The threshold is slightly lower in Scotland and much higher in Northern Ireland (£14,000 a year)
Governments in England, Wales and Scotland have agreed to provide free school meals to eligible children in holiday periods at least through to Easter 2021. Thus far, the qualifying income criteria have remained unchanged, leaving many low income families ineligible.70 However, the SNP has pledged to offer universal free school meals to all primary school children if it is re-elected as the Scottish Government in 2021.71
Direct Cash Payments
A range of benefits, most prominently Universal Credit, were available to families with children.
The standard allowance of Universal Credit (as well as the basic element of working tax credit), was increased by £20 a week, but this is set to expire in April 2021, alongside an increase in local housing allowances.72 The Scottish Government is to make a direct £100 payment to every family with a child receiving free school meals before Christmas 2020, ahead of the introduction of the Scottish Child Payment, worth £10 per week per child to low-income families, in February 2021.73
Healthy Start Healthy Start is a UK-wide voucher scheme for women in receipt of benefits who have children under four or are pregnant. Vouchers can be used to buy milk and fresh or frozen fruit and vegetables, and coupons can be exchanged for free vitamins.
The National Food Strategy has recommended that the value of vouchers be increased from £3.10 a week to £4.25. As part of its winter grant scheme, the Government agreed to do so. However, the income threshold still excludes some families in low paid work from support, and not all children are eligible.74
Holiday Activities and Food (HAF)
Prior to November 2020, the Holiday Activities and Food programme fed disadvantaged children in 17 local authority areas and helped them stay healthy and active during the summer holidays.
In November 2020, the Government committed to extending HAF across all holiday periods and all local authorities in England throughout 2021. However provision of food hinges upon attending an activity, which may not be suitable or accessible for some children.75

SOCIAL MARKET FOUNDATION
28
Without further intervention, these measures are insufficient to address the issue of child poverty. For a response proportionate to the scale of the problem, the Government should consider enacting the following policies.
Recommendation 1 - Implement all recommendations included in the National Food Strategy
This should be the minimum policy response from Government. The National Food Strategy, among its “urgent recommendations”, calls on the Government to do the following:76
• Expand eligibility for the Free School Meal scheme to include every child (up to the age of 16) from a household where the parent or guardian is in receipt of Universal Credit or equivalent benefits;
• Extend the Holiday Activity and Food Programme to all areas in England, so that summer holiday support is available to all children in receipt of Free School Meals;
• Increase the value of Healthy Start vouchers to £4.25 per week and expand the scheme to every pregnant woman and to all households with children under 4 where a parent or guardian is in receipt of Universal Credit or equivalent benefits.
It is extremely welcome that the Government has agreed to implement two of these (expanding HAF and raising the value of Healthy Start vouchers), but widening free school meal eligibility is critical too. As we saw in Chapter 3, the majority of children reported to be in receipt of free school meals in our survey were not classified as being in very low food security, suggesting that free school meals are effective at reducing hunger. But with 60% of those in very low food security not reporting receiving free school meals, wider eligibility criteria could help the many that currently appear to be missing out.
Beyond the specific recommendations of the National Food Strategy, there are a number of ways that the Government could extend the principle of subsidising healthy food. For example, the Institute for Public Policy Research recommends that the Government provides a voucher worth £20 to all children receiving free school meals for healthy items of food, essentially subsidising to increase consumption among low income families. As well as reducing hunger, this could incentivise retailers to promote and help to break the link between deprivation and obesity.77
The Government could encourage retailers to do more to provide cheaper, healthier options in other ways. A report by the All-Party Parliamentary Group on a Fit and Healthy Childhood has proposed that supermarkets shift promotions away from unhealthy products – those that are high in fat, sugar, or salt – to healthy products, as well as increasing the provision of healthier foods in local convenience stores.78
Recommendation 2 - Bolster Universal Credit and the wider benefits system, providing families with the money they need to buy food
Although it refers to Universal Credit and the recurring problem of people being unable to “match their expenditure to the benefits they were receiving”, the National Food Strategy refrains from making any recommendations concerned with the UK benefits system. The Strategy acknowledges that the best way to tackle poverty is to have a strong economy balanced with an effective benefits system, and that a reinforced welfare safety net is crucial during times of

MEASURING AND MITIGATING CHILD HUNGER
29
crises, but its recommendations remain focused on the provision of a “nutritional safety net” for children.79
While there are clear benefits to the kind of direct interventions outlined above, they do not address the fundamental driver of food insecurity: a lack of money. Direct provision or subsidy of food can alleviate the symptoms of economic insecurity, providing families with food when it is needed most, but ultimately it is improved financial resources that will prevent child poverty.
It is beyond the remit of this report to suggest fundamental changes to the welfare system, a task fraught with technical and political complexity. However, the levels of hunger we and others have documented suggest the status quo is insufficient. That means that the Government needs to find ways to get cash into the hands of the poorest families facing the greatest hardship. An obvious way to do so would be to retain the temporary £20 increase in Universal Credit, and broadening coverage. Solutions might include lifting the two-child limit on Universal Credit, increasing its child element, or ensuring that all people – including those with no recourse to public funds – have access to support, at least for the duration of the crisis.
There is a deeper policy question about whether cash transfers, benefits in kind (such as free school meals) or subsidies (such as voucher schemes) are the best way to address food insecurity. We do not pursue that question here: starting from where we are, any of the options could help make progress against child hunger.
Recommendation 3 - Coordinate and mobilise a national network of food redistribution
The Government does not need to tackle child hunger and food insecurity alone. The response to Marcus Rashford’s campaign to feed children during the October half-term holidays, with over 1,000 organisations pledging support, demonstrates the strength of will among businesses and civil society to make a contribution.80 However, it is not always straightforward to move from good intentions to practically assisting those in need, and the Government’s role should be to bridge that gap: making it easier to navigate practical obstacles, regulatory hurdles, financial disincentives, and the challenges of where to direct attention and resources.
One of the most promising ways for it to do so is by ensuring that surplus food does not go to waste, working with businesses and relevant stakeholders, such as FareShare and other redistributors. Several food redistribution networks already exist. For example, the Courtauld 2025 agreement contains voluntary commitments from supermarkets to improve food efficiency81 and the Surplus Food Redistribution Working Group shares and promotes examples of best practice within the sector, as well as consulting and allocating government funding to help support local redistribution projects.82 To build on these schemes, the Government should do two things in particular.
• First, provide more funding. This could be used to find cost-effective means of turning excess raw products into new, consumable products; to improve foreign body detection systems to ensure that surplus food, not included within the typical food chain, always meets safety requirements; and to support the purchase of food from producers that would otherwise go to waste (such as WIP products).iv As well as increasing the amount
iv WIP, or work-in-progress products, are raw products which enter a food production site to be used for a specific purpose, such as sandwich fillings in sandwiches. If all requisite sandwiches are not filled with sandwich filling, the WIP raw product, then that filling goes to waste.

SOCIAL MARKET FOUNDATION
30
of food that is available to redistributors and, thus, to the local authorities that need it, government financial support could provide a stronger financial incentive for food production companies to repurpose food rather than disposing of it.83
• Second, coordinate a national food redistribution network. In practice, this would involve identifying all parts of the UK food chain that have surplus food, and working with businesses to identify ways that the surplus could be repurposed (and possibly negotiating financial incentives where appropriate). It should then connect the businesses with excess food with the local authorities that can make use of it.
Recommendation 4 - Devolve responsibility and funding for on the ground food distribution to local authorities
While central government can take on an important coordination role at the national level, it is poorly placed to deliver food at the local level. Covering the ‘last mile’ of food distribution to ensure that food gets to those that need it is far easier with local knowledge, relationships and facilities. Instead of trying to develop new infrastructure, it is far better to build on what already exists. That is why final responsibility should be devolved to local authorities, who have close links to the schools, public health bodies and charities that understand their communities and can serve as a distribution network.
Local authorities should be given adequate funding and support to develop Food Plans: strategies that reflect the particular circumstances and requirements of their area. Many authorities have already started down this path: Barnsley Council for example, has had a Food Plan in place for the past two years, effectively coordinating local actors to address local food needs.84 Councils may choose to create dedicated post(s) to discharge these responsibilities, with individuals or teams responsible for the coordination of all activities related to food and food-related health, including the collection of food security data.
In general, local authorities should be given autonomy to deliver their own Food Plans, based on the resources available to them and the specific circumstances they face. They should be encouraged to experiment with different approaches. However, their performance should be monitored by a minister in the Department for Environment, Food and Rural Affairs, whose role should include identifying and sharing good practice between local authorities.
The relevant minister in turn should coordinate food objectives across the relevant government departments, including the Department for Education and the Ministry for Housing, Communities & Local Government. Indeed, the Government has already identified the need for cross-government action on hunger, and has recognised the lack of ministerial accountability for combatting it.85 A similar (but slimmer) arrangement has already been called for in the National Food Strategy, where it is recommended that the work of the Food to Vulnerable Ministerial Taskforce is extended until July 2021.86
Recommendation 5 - Introduce healthy eating programmes across all local authorities, delivering social and nutritional support to families
The measures outlined above can offer immediate relief for families that are experiencing food insecurity. However, it would be a mistake to consider food insecurity as a temporary or isolated problem, distinct from the other challenges the country faces around diet and food. In the long term, it is critical to take a more holistic approach to developing a healthier food ‘ecosystem’.87

MEASURING AND MITIGATING CHILD HUNGER
31
This is necessary for two reasons. First, to avoid policy incoherence. Efforts to address hunger and food insecurity should not conflict with or undermine measures to improve the quality of diets and reduce obesity. Second, because developing and strengthening food redistribution networks creates opportunities to help people in other ways, beyond just feeding them. Well-designed food projects can engage people in discussion about their habits, behaviours and the role of food in their lives. They also have the potential to address issues like social isolation. They are likely to work best if developed collaboratively with those that make use of them, rather than imposed top down.
There are many promising community-led initiatives already in place to build upon. For example, the Sustainable Food Places Network, led by sustainable food organisations, the Soil Association, Food Matters, and Sustain, helps communities to share practical solutions to today’s food issues by adopting a collaborative approach to ‘good food governance’. This means addressing all parts of the food system, bringing together local government, businesses, and civil society so food is not just affordable and accessible, but so that people have the resources and support they need to adequately feed themselves.88
StreetGames’ Fit and Fed provides both physical activities and nutritious, healthy meals to vulnerable young children, primarily to address ‘holiday hunger’. Not only does the campaign offer free-to-access food, but it also supports local organisations to respond to local demands by providing tailor made services to prevent food insecurity, therefore empowering communities to deliver their own Fit and Fed programmes locally. Such an asset-based approach, harnessing the resources that are possessed by local communities, is designed to be cost-effective, and it is therefore more sustainable in the longer term.89
Food education programmes help people to recognise the nutritional value of food, the elements of a balanced diet and how to prepare healthy meals. 90 For instance, the one run by the Nutrition Foundation in schools has the following objectives: recognising food as a basic yet enjoyable requirement of life, encouraging an awareness of the social, economic, and cultural aspects of food choice, and enabling individuals to display food choice.91
Given the potential benefits of a more holistic approach, it is encouraging that the Government has committed to the expansion of Holiday Activities and Food programmes, a move backed by many food experts.92 As well as providing food, they may also help children develop social skills, enhance wellbeing and mitigate potential learning loss, as well as providing childcare support for parents. In the short run, the Government should directly or through local authorities encourage programmes that tie food support to a broader food agenda, and encourage experimentation. It should also evaluate these programmes to identify which are most effective and the local contexts in which they seem to work best so as to spread best practice in the long run.
Policy recommendations to government
1. Implement all recommendations made in the National Food Strategy
2. Bolster Universal Credit and the wider benefits system
3. Coordinate a national network of food redistribution
4. Devolve responsibility and funding for on the ground food distribution for local authorities
5. Introduce healthy eating programmes across all local authorities

SOCIAL MARKET FOUNDATION
32
APPENDIX A: SURVEY QUESTIONNAIRE
We are looking to understand how the coronavirus pandemic has affected people’s diets and ability to buy food for themselves. We are going to ask you some questions about how your household has been affected by the pandemic, and your situation before and after it struck in March. Background
1. How many children under 18 and adults (18+) are there in your household? [Two response columns: Adults aged 18+, Children aged under 18]
o None o One o Two o Three o Four o Five o Six o Seven o Eight o Nine o Ten or more
2. Since the start of the pandemic in March, have any of the following happened to you or
the other adult(s) in your household? [Two response columns: Has happened to me, Has happened to another adult in the household]
o Tested positive for coronavirus o Suffered coronavirus symptoms o Lost a job o Been placed on furlough o Increased working hours o Reduced working hours o Reduced income o Suffered a delay in benefits payments o None of these
3. Which of the following have your family made use of, before and after the pandemic hit
in March? [Three response columns: Used before the pandemic, Used since the pandemic, Have not used this at all]
o Food bank o Free School Meals o ‘School breakfast club’ (providing children free food before school starts) o ‘Holiday club’ (providing children with free food/place to play in the school
holidays)

MEASURING AND MITIGATING CHILD HUNGER
33
4. Please think about your take-home household income. This is however much you receive each month after all taxes and deductions are removed combined with the same for all other adults in your household. Approximately how much was your household income last month and what was your household income for the same month last year? [Two response columns: In September 2019, In September 2020]
o Less than £500 per month o £501 - £1,000 o £1,001 - £1,500 o £1,501 - £2,000 o £2,001 - £2,500 o £2,501 - £3,000 o £3,001 - £4,000 o £4,001 - £5,000 o £5,001 - £7,500 o £7,501 - £10,000 o More than £10,000 per month o Don’t know
5. Approximately how much does your household pay in rent/mortgage payments each
month? Please think about the total amount that is paid by all adults in your household together rather than just what you pay yourself.
o Less than £500 per month o £501 - £750 o £751 - £1,000 o £1,001 - £1,250 o £1,251 - £1,500 o £1,501 - £1,750 o £1,751 - £2,000 o £2,001 - £2,500 o £2,501 - £3,000 o £3,001 - £3,500 o £3,501 - £4,000 o More than £4,000 per month o Don’t know
6. Which of these best describes the industries you work in? [Two response columns: Me,
Other adults in my household] o Health and social care o Education o Other public sector o Retail o Hospitality & leisure o Manufacturing

SOCIAL MARKET FOUNDATION
34
o Professional services o Construction o Transportation & storage o Other o N/A – do not work
Adult food insecurity questions
7. Which of these statements best describes the food eaten in your household? Please give an answer for March to December this year and for the same period last year [Two response columns: How we have eaten in March-September this year, How we ate in March-September last year]
o Enough food to eat and of the kinds of food I/we want to eat o Enough food to eat but not always the kinds of food I/we want o Sometimes not enough to eat at all o Often not enough to eat at all o Don’t know/would rather not say
[If ‘Enough food to eat and of the kinds of food I/we want to eat’ in both periods, skip to Q9]
8. Why were you unable to have enough of all the kinds of food you wanted to eat? Tick all that apply [Two response columns: March-September this year, March-September last year]
o Wasn't able to afford it o The right sort of food wasn’t available in the local shops o Didn’t have the right shops in the local area o Wasn’t able to travel to shops o Didn’t feel safe/was advised not to go to shops due to coronavirus (eg shielding) o Didn’t have the time to cook o Didn’t have the time to go to the shops o Wasn’t able to get deliveries o Other
9. Did you or other adults in your household ever cut the size of your meals or skip meals
because there wasn't enough money for food? [Two response columns: March-September this year, March-September last year]
o Almost every month o For 3 or 4 months o For 1 or 2 months o No – not at all o Don’t know/would rather not say
10. Did you ever eat less than you felt you should because there wasn't enough money for
food? [Two response columns: March-September this year, March-September last year] o Yes o No o Don’t know/would rather not say

MEASURING AND MITIGATING CHILD HUNGER
35
11. Were you ever hungry but didn't eat because there wasn't enough money for food? [Two response columns: March-September this year, March-September last year]
o Yes o No o Don’t know/would rather not say
12. Did you or other adults in your household ever not eat for a whole day because there
wasn't enough money for food? [Two response columns: March-September this year, March-September last year]
o Almost every month o For 3 or 4 months o For 1 or 2 months o No – not at all o Don’t know/would rather not say
Child food insecurity questions
[Asked only to parents with children under 18]
We’re now going to ask you some questions about your child’s/children’s eating habits in the last six months since the pandemic struck in March, and how that compares to what they ate in the same period, March to September, last year.
13. How well do each of these statements apply to your child/children? “I/we relied on only a few kinds of low-cost food to feed my/our child/children because (I was/we were) running out of money to buy food.”
o Often true o Sometimes true o Never true o Don’t know/would rather not say
14. How well do each of these statements apply to your child/children? “I/we couldn’t feed my/our child/children a balanced meal, because I/we couldn’t afford that”
o Often true o Sometimes true o Never true o Don’t know/would rather not say
15. How well do each of these statements apply to your child/children? “My/our child/children were not eating enough because I/we just couldn’t afford enough food”
o Often true o Sometimes true

SOCIAL MARKET FOUNDATION
36
o Never true o Don’t know/would rather not say
[If ‘Never true for Q13, 14 and 15, skip to end of survey]
16. Did you cut the size of your child’s/children’s meals because there wasn't enough money for food? [Two response columns: March-September this year, March-September last year]
o Almost every month o For 3 or 4 months o For 1 or 2 months o No – not at all o Don’t know/would rather not say
17. Did you cut the size of your child’s/children child ever skip meals because there wasn't
enough money for food? [Two response columns: March-September this year, March-September last year]
o Almost every month o For 3 or 4 months o For 1 or 2 months o No – not at all o Don’t know/would rather not say
18. Was your child/children ever hungry but you just couldn’t afford more food? [Two
response columns: March-September this year, March-September last year] o Almost every month o For 3 or 4 months o For 1 or 2 months o No – not at all o Don’t know/would rather not say
19. Did your child/children ever not eat for a whole day because there wasn't enough money
for food? [Two response columns: March-September this year, March-September last year]
o Almost every month o For 3 or 4 months o For 1 or 2 months o No – not at all o Don’t know/would rather not say

MEASURING AND MITIGATING CHILD HUNGER
37
APPENDIX B: NOTES ON METHODS AND COMPARISON WITH OTHER SURVEYS
The results produced by our survey are striking, and given the significance of the issue, they bear some scrutiny. Opinium provided us with a statement describing the process by which the survey was conducted and testifying to their experience of carrying out such research, which we reproduce below:
Panel background
This survey was conducted using Opinium’s consumer panel of circa 45,000 UK adults with some demographics (9% of total) being topped up sample purchased from partners.
Basic demographic data collected when a person joins the panel is updated via routine profiling surveys and this is used to pre-answer most demographic questions (age, gender, region etc.) in a typical survey. As well as allowing us to appropriately target invitations to surveys, this also allows us to review participants responses over multiple surveys when making determinations about data quality.
Survey methodology and sampling
For this survey, as with a typical online project, our panel system creates a sample based on our standard nationally representative sample frame. This uses pre-profiled demographic information as well as the average response rate for each top-level demographic combination (e.g. female, North Wales, 55-64) to determine the number of invitations that need to be sent to each one to produce a sample of 3,000 people that is representative of the UK adult population at a total level.
As parents of school-aged children (4-17) make up approx. 28% of the adult population, the 3,000 sample contained 831, requiring a boost of ~170 to meet our target of 1,000. Accordingly, a similar sampling process was conducted to identify parents of school aged children to ensure this top-up sample was not overly skewed.
Data cleaning
Opinium operates an industry standard data cleaning process on all research projects, reviewing raw data to identify poor quality responses and remove them from the dataset. Standard criteria for this include completion time, variability within responses (e.g. straight-lining in grid questions), contradictory answers in behavioural questions, impossible combinations (e.g. respondent age vs. age of child) and poor quality verbatim responses.
Weighting
While the sampling process itself would ideally provide a perfectly representative sample, for practical reasons this is not common. Therefore, like most survey research agencies, we employ weighting to finesse our final sample to meet representative criteria. The companion weightset for our nationally representative sample frame is based on interlocked gender and age group, region, working status and socio-economic grade.
About Opinium
Opinium is a full service market research agency founded in 2007 and our experience of conducting representative surveys of the British public covers work for a wide range of charities, think tanks and advocacy groups. Further information on our Thought Leadership practice area can be found on our website.93
Our public work also covers four general elections, three referendums and two London Mayoral elections, producing the most accurate final polls of any agency in the 2019 general election and 2016 EU referendum.

SOCIAL MARKET FOUNDATION
38
Turning to the results themselves, the chart below compares the data presented in figure 1 of the report to the estimates from a similar survey conducted by the Food Foundation in April.94
Proportion of parents who said that their children had experienced the following in the past six months
Source: Opinium SMF Survey, October 2020
It shows that our survey suggests a substantially higher level of child food insecurity than the Food Foundation’s. The two surveys are not directly comparable because the Food Foundation only covers a single month, whereas our survey covers a six month period, but that is unlikely to explain such a large discrepancy. Moreover, it might be seen as surprising that there is not more of a gradient as the measures of food insecurity increase in severity - we might, for example expect many more children to skip single meals than to go a full day without eating (i.e. skip multiple meals).
It is possible that differences in survey design also have influenced the results. For most of these questions, there were multiple affirmative answers (‘Almost every month’, ‘For 3 to 4 months’, ‘For 1 to 2 months’), but only one negative answer (‘No – not at all’). That may have encouraged more people to answer positively and say they had had the experience in question. It is notable that on the one question with a straight yes/no answer - ‘Was your child/were you children ever hungry but you just couldn’t afford more food?’ - fewer people said that they were, albeit still higher than we would expect from the Food Foundation results.
At the same time, we note that the results in figure 1 are not so far out of line with surveys asking about household food insecurity for families with children. In the Food Standards Agency’s COVID-19 tracker survey, the proportion of people in households with children that said that they had cut down meal sizes or skipped meals in the last month ranged from 24% to 33% between April and July.95 The Food Foundation estimated the same number to be between 10% and 19%.96 In that context, our result that 16% of children have skipped meals in the last six months is less remarkable. Our conclusion is that these figures, though remarkable, are credible.
24%
18%
18%
16%
16%
16%
7%
Relied on only a few kinds of low-cost food
Couldn't afford balanced meals
Child was not eating enough
Cut size of meals
Skipped Meals
Child went a day without eating
Child went hungry
Food Foundation estimate, April 2020
6%
7%
2%
1%

MEASURING AND MITIGATING CHILD HUNGER
39
APPENDIX C: MODELLED ESTIMATE PROPORTION OF CHILDREN IN VERY LOW FOOD SECURITY BY LOCAL AUTHORITY
Rank Local authority Number of children with very low food security
Proportion of children with very low food security
1 Redbridge 17,409 25.5%
2 Tower Hamlets 15,912 24.7%
3 Newham 18,851 23.9%
4 Harrow 12,471 23.7%
5 Brent 16,559 23.6%
6 Blackburn with Darwen 8,093 23.5%
7 Mid Devon 3,477 23.1%
8 Teignbridge 4,697 21.8%
9 North Devon 3,557 21.4%
10 Bolton 12,840 21.1%
11 Hackney 12,205 21.0%
12 Wandsworth 12,328 20.9%
13 Lewisham 12,855 20.6%
14 Manchester 22,626 20.4%
15 Ealing 15,030 20.3%
16 Waltham Forest 12,326 20.2%
17 Fylde 2,454 19.7%
18 Lambeth 11,195 19.6%
19 Barking and Dagenham 11,342 19.6%
20 Middlesbrough 5,744 19.6%
21 Croydon 16,732 19.6%
22 Enfield 14,945 19.5%
23 Oldham 10,351 19.4%
24 Pendle 3,744 19.4%
25 South Somerset 5,701 19.4%
26 Hillingdon 12,875 19.4%
27 Peterborough 8,964 19.3%
28 Torbay 4,385 19.2%
29 Torridge 2,125 19.2%
30 Hounslow 11,297 19.1%
31 Luton 9,796 18.8%
32 Preston 5,399 18.8%
33 Rochdale 8,895 18.7%
34 Fenland 3,383 18.6%
35 Knowsley 5,615 18.6%
36 Haringey 10,062 18.6%
37 Westminster 7,969 18.5%
38 Northumberland 9,622 18.3%

SOCIAL MARKET FOUNDATION
40
39 West Devon 1,618 18.3%
40 Sedgemoor 4,050 18.3%
41 Islington 6,973 18.3%
42 Somerset West and Taunton 4,785 18.2%
43 Hyndburn 3,054 18.1%
44 South Hams 2,467 18.1%
45 Cheltenham 3,738 18.1%
46 Hammersmith and Fulham 6,074 18.0%
47 Tewkesbury 3,107 18.0%
48 Kensington and Chelsea 4,646 17.9%
49 Mendip 3,689 17.8%
50 Isles of Scilly 60 17.7%
51 Hartlepool 3,162 17.7%
52 Blaenau Gwent / Blaenau Gwent 2,151 17.6%
53 Camden 8,050 17.6%
54 Bristol, City of 14,947 17.5%
55 Cornwall 16,754 17.4%
56 Gloucester 4,503 17.3%
57 Swindon 7,800 17.2%
58 Barrow-in-Furness 2,012 17.1%
59 Cotswold 2,486 17.1%
60 Barnet 14,326 17.1%
61 Rossendale 2,382 17.1%
62 Bradford 21,778 17.1%
63 East Suffolk 7,098 16.9%
64 Tameside 7,652 16.9%
65 Sandwell 12,445 16.8%
66 Leicester 12,689 16.7%
67 South Lakeland 2,574 16.7%
68 Dorset 9,933 16.7%
69 Burnley 3,081 16.6%
70 Bath and North East Somerset 5,295 16.6%
71 Plymouth 7,856 16.6%
72 Forest of Dean 2,361 16.5%
73 East Devon 3,770 16.5%
74 Merton 7,129 16.5%
75 Rhondda Cynon Taf / Rhondda Cynon Taf 7,318 16.3%
76 Bournemouth, Christchurch and Poole 11,061 16.3%
77 Braintree 4,724 16.2%
78 Caerphilly / Caerffili 5,540 16.2%

MEASURING AND MITIGATING CHILD HUNGER
41
79 South Gloucestershire 8,537 16.2%
80 Torfaen / Tor-faen 2,775 16.0%
81 Copeland 1,855 16.0%
82 Blackpool 4,137 16.0%
83 Sutton 6,958 16.0%
84 Merthyr Tydfil / Merthyr Tudful 1,838 15.9%
85 Carlisle 3,045 15.8%
86 Kingston upon Thames 5,613 15.8%
87 Hastings 2,713 15.7%
88 Neath Port Talbot / Castell-nedd Port Talbot 3,906 15.7%
89 Stroud 3,343 15.7%
90 Wyre 2,738 15.6%
91 North Somerset 6,052 15.6%
92 Flintshire / Sir y Fflint 4,473 15.6%
93 Wrexham / Wrecsam 4,086 15.5%
94 Greenwich 9,768 15.5%
95 Barnsley 7,085 15.5%
96 Exeter 3,117 15.5%
97 Pembrokeshire / Sir Benfro 3,309 15.4%
98 Carmarthenshire / Sir Gaerfyrddin 5,124 15.4%
99 Southwark 9,200 15.4%
100 Liverpool 13,224 15.4%
101 Ribble Valley 1,594 15.4%
102 Scarborough 2,690 15.4%
103 South Tyneside 4,121 15.3%
104 Redditch 2,596 15.3%
105 Salford 7,855 15.2%
106 Thurrock 6,069 15.2%
107 Denbighshire / Sir Ddinbych 2,631 15.2%
108 Newcastle upon Tyne 7,953 15.2%
109 Newport / Casnewydd 4,745 15.1%
110 Birmingham 39,372 15.1%
111 Redcar and Cleveland 3,750 15.1%
112 Bridgend / Pen-y-bont ar Ogwr 3,902 14.9%
113 Eden 1,204 14.9%
114 Dundee City 3,572 14.9%
115 West Lancashire 2,928 14.9%
116 Bromley 9,929 14.7%
117 Sunderland 7,176 14.7%
118 Havering 7,612 14.7%
119 North Norfolk 2,127 14.7%

SOCIAL MARKET FOUNDATION
42
120 Wiltshire 13,793 14.6%
121 Walsall 8,960 14.6%
122 Allerdale 2,347 14.6%
123 Cardiff / Caerdydd 9,855 14.6%
124 North Ayrshire 3,313 14.5%
125 Swansea / Abertawe 6,098 14.5%
126 Glasgow City 14,501 14.5%
127 Wolverhampton 8,000 14.4%
128 Great Yarmouth 2,555 14.4%
129 Darlington 2,899 14.4%
130 County Durham 13,042 14.3%
131 Conwy / Conwy 2,711 14.3%
132 Halton 3,676 14.3%
133 Basildon 5,506 14.2%
134 West Dunbartonshire 2,232 14.2%
135 Powys / Powys 3,004 14.2%
136 Kirklees 12,690 14.1%
137 Rochford 2,112 14.1%
138 Clackmannanshire 1,265 14.1%
139 Chorley 3,029 14.1%
140 Vale of Glamorgan / Bro Morgannwg 3,429 14.0%
141 Gwynedd / Gwynedd 2,914 14.0%
142 Wigan 8,516 13.9%
143 Bexley 7,105 13.9%
144 Norwich 3,329 13.9%
145 Harlow 2,685 13.8%
146 East Ayrshire 2,910 13.8%
147 Castle Point 2,095 13.7%
148 Bedford 4,948 13.7%
149 Isle of Wight 3,019 13.7%
150 Monmouthshire / Sir Fynwy 2,111 13.7%
151 Bury 5,303 13.7%
152 Cambridge 2,937 13.7%
153 Ceredigion / Ceredigion 1,497 13.7%
154 Worcester 2,542 13.6%
155 Babergh 2,099 13.6%
156 Stoke-on-Trent 7,095 13.6%
157 South Ayrshire 2,383 13.5%
158 South Ribble 2,736 13.5%
159 Stevenage 2,439 13.4%
160 Maldon 1,417 13.4%
161 Lancaster 3,243 13.4%
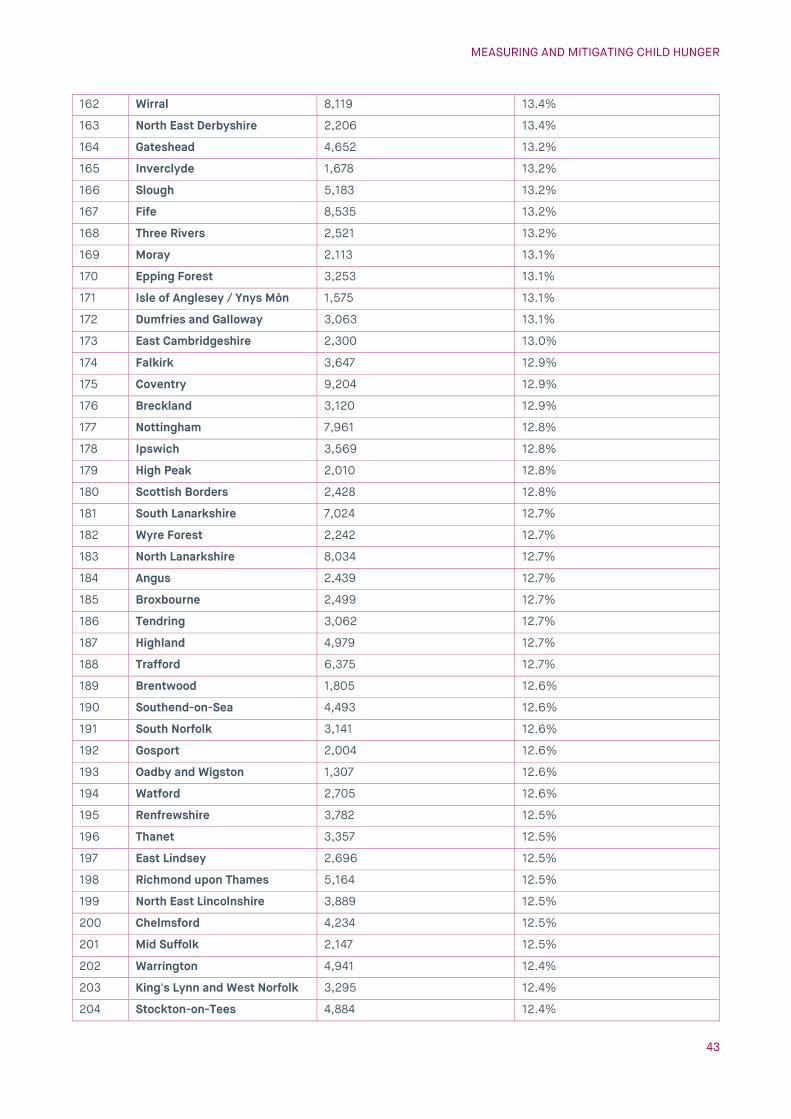
MEASURING AND MITIGATING CHILD HUNGER
43
162 Wirral 8,119 13.4%
163 North East Derbyshire 2,206 13.4%
164 Gateshead 4,652 13.2%
165 Inverclyde 1,678 13.2%
166 Slough 5,183 13.2%
167 Fife 8,535 13.2%
168 Three Rivers 2,521 13.2%
169 Moray 2,113 13.1%
170 Epping Forest 3,253 13.1%
171 Isle of Anglesey / Ynys Môn 1,575 13.1%
172 Dumfries and Galloway 3,063 13.1%
173 East Cambridgeshire 2,300 13.0%
174 Falkirk 3,647 12.9%
175 Coventry 9,204 12.9%
176 Breckland 3,120 12.9%
177 Nottingham 7,961 12.8%
178 Ipswich 3,569 12.8%
179 High Peak 2,010 12.8%
180 Scottish Borders 2,428 12.8%
181 South Lanarkshire 7,024 12.7%
182 Wyre Forest 2,242 12.7%
183 North Lanarkshire 8,034 12.7%
184 Angus 2,439 12.7%
185 Broxbourne 2,499 12.7%
186 Tendring 3,062 12.7%
187 Highland 4,979 12.7%
188 Trafford 6,375 12.7%
189 Brentwood 1,805 12.6%
190 Southend-on-Sea 4,493 12.6%
191 South Norfolk 3,141 12.6%
192 Gosport 2,004 12.6%
193 Oadby and Wigston 1,307 12.6%
194 Watford 2,705 12.6%
195 Renfrewshire 3,782 12.5%
196 Thanet 3,357 12.5%
197 East Lindsey 2,696 12.5%
198 Richmond upon Thames 5,164 12.5%
199 North East Lincolnshire 3,889 12.5%
200 Chelmsford 4,234 12.5%
201 Mid Suffolk 2,147 12.5%
202 Warrington 4,941 12.4%
203 King's Lynn and West Norfolk 3,295 12.4%
204 Stockton-on-Tees 4,884 12.4%

SOCIAL MARKET FOUNDATION
44
205 North Hertfordshire 3,264 12.4%
206 Sefton 5,954 12.4%
207 West Suffolk 4,231 12.4%
208 South Cambridgeshire 3,914 12.4%
209 Argyll and Bute 1,611 12.4%
210 Colchester 4,457 12.3%
211 North Tyneside 4,542 12.3%
212 Midlothian 2,142 12.2%
213 Welwyn Hatfield 2,756 12.1%
214 West Lothian 4,252 12.0%
215 Epsom and Ewell 1,969 12.0%
216 Dacorum 3,744 11.9%
217 Broadland 2,542 11.9%
218 Canterbury 3,120 11.9%
219 Calderdale 4,892 11.9%
220 Perth and Kinross 2,881 11.8%
221 Eastbourne 2,100 11.8%
222 Dudley 7,304 11.8%
223 East Lothian 2,256 11.7%
224 Amber Valley 2,484 11.6%
225 Stockport 6,589 11.6%
226 Stirling 1,789 11.6%
227 Sheffield 12,207 11.6%
228 Southampton 5,350 11.5%
229 St Albans 3,813 11.5%
230 Huntingdonshire 3,751 11.5%
231 East Staffordshire 2,651 11.5%
232 Hambleton 1,677 11.5%
233 Hertsmere 2,552 11.5%
234 Tamworth 1,704 11.4%
235 Aberdeen City 3,944 11.4%
236 Na h-Eileanan Siar 491 11.3%
237 North Lincolnshire 3,617 11.3%
238 Central Bedfordshire 6,317 11.3%
239 Malvern Hills 1,406 11.3%
240 East Dunbartonshire 2,163 11.2%
241 Orkney Islands 399 11.2%
242 Wychavon 2,435 11.2%
243 Oxford 3,030 11.1%
244 Cheshire West and Chester 6,779 11.1%
245 Wealden 3,050 11.1%
246 Arun 2,868 11.1%
247 East Hertfordshire 3,229 11.1%

MEASURING AND MITIGATING CHILD HUNGER
45
248 Doncaster 6,610 11.0%
249 Cheshire East 7,561 11.0%
250 Crawley 2,725 11.0%
251 Aberdeenshire 5,423 11.0%
252 Ryedale 944 11.0%
253 Rotherham 5,607 10.9%
254 City of Edinburgh 8,564 10.9%
255 St. Helens 3,602 10.9%
256 City of London 145 10.9%
257 West Lindsey 1,766 10.8%
258 Newark and Sherwood 2,361 10.8%
259 Uttlesford 1,915 10.8%
260 Mole Valley 1,676 10.8%
261 Reading 3,649 10.8%
262 Shetland Islands 454 10.7%
263 Horsham 2,752 10.6%
264 Derby 5,728 10.6%
265 Chiltern 2,095 10.6%
266 East Renfrewshire 2,036 10.5%
267 Stafford 2,440 10.5%
268 Gravesham 2,357 10.5%
269 Mansfield 2,149 10.5%
270 Dover 2,141 10.4%
271 Boston 1,368 10.4%
272 Kingston upon Hull, City of 5,365 10.4%
273 Solihull 4,325 10.3%
274 Telford and Wrekin 3,775 10.3%
275 Lewes 1,832 10.3%
276 Wellingborough 1,702 10.3%
277 Cannock Chase 1,841 10.3%
278 Corby 1,632 10.3%
279 South Derbyshire 2,027 10.3%
280 Folkestone and Hythe 1,963 10.3%
281 Lincoln 1,691 10.2%
282 Runnymede 1,551 10.2%
283 South Bucks 1,377 10.2%
284 Richmondshire 914 10.2%
285 Woking 2,203 10.2%
286 Stratford-on-Avon 2,144 10.1%
287 Leeds 15,297 10.0%
288 Brighton and Hove 4,561 10.0%
289 Wycombe 3,667 10.0%
290 Harborough 1,698 10.0%

SOCIAL MARKET FOUNDATION
46
291 South Staffordshire 1,748 10.0%
292 Portsmouth 3,962 10.0%
293 North Warwickshire 1,116 9.9%
294 Herefordshire, County of 3,197 9.9%
295 Hinckley and Bosworth 1,976 9.9%
296 Ashford 2,632 9.9%
297 Dartford 2,393 9.8%
298 Swale 2,941 9.8%
299 Fareham 1,913 9.8%
300 Medway 5,659 9.8%
301 Nuneaton and Bedworth 2,465 9.8%
302 Staffordshire Moorlands 1,550 9.8%
303 Craven 875 9.8%
304 Newcastle-under-Lyme 2,057 9.8%
305 Shropshire 5,142 9.8%
306 Ashfield 2,349 9.7%
307 Bassetlaw 2,024 9.7%
308 East Riding of Yorkshire 5,406 9.7%
309 Wakefield 6,348 9.7%
310 Milton Keynes 5,980 9.6%
311 Cherwell 2,838 9.6%
312 Rother 1,357 9.5%
313 Chesterfield 1,680 9.5%
314 Blaby 1,794 9.5%
315 Harrogate 2,705 9.4%
316 Spelthorne 1,838 9.4%
317 York 3,071 9.4%
318 Warwick 2,296 9.4%
319 South Kesteven 2,421 9.3%
320 Derbyshire Dales 1,019 9.3%
321 South Oxfordshire 2,494 9.3%
322 Bracknell Forest 2,351 9.3%
323 East Northamptonshire 1,653 9.3%
324 East Hampshire 2,037 9.3%
325 Adur 1,088 9.3%
326 Broxtowe 1,805 9.3%
327 Lichfield 1,640 9.3%
328 Selby 1,527 9.3%
329 West Oxfordshire 1,882 9.3%
330 Surrey Heath 1,558 9.2%
331 Eastleigh 2,311 9.2%
332 Bolsover 1,285 9.1%
333 Gedling 1,937 9.1%

MEASURING AND MITIGATING CHILD HUNGER
47
334 Worthing 1,780 9.1%
335 Melton 823 9.1%
336 Aylesbury Vale 3,759 9.1%
337 Elmbridge 2,754 9.1%
338 Rugby 1,954 9.0%
339 Havant 1,991 9.0%
340 Tonbridge and Malling 2,365 8.9%
341 Erewash 1,852 8.9%
342 Kettering 1,843 8.9%
343 Mid Sussex 2,600 8.8%
344 New Forest 2,512 8.8%
345 Tunbridge Wells 2,096 8.8%
346 Charnwood 2,697 8.7%
347 Sevenoaks 2,090 8.7%
348 Tandridge 1,474 8.7%
349 Chichester 1,727 8.7%
350 Rushmoor 1,643 8.6%
351 Windsor and Maidenhead 2,621 8.6%
352 Waverley 2,130 8.5%
353 Basingstoke and Deane 3,009 8.5%
354 South Holland 1,394 8.5%
355 Northampton 4,153 8.5%
356 Hart 1,623 8.4%
357 Reigate and Banstead 2,520 8.3%
358 Maidstone 2,815 8.3%
359 West Berkshire 2,610 8.3%
360 Test Valley 1,924 8.2%
361 Winchester 1,830 8.0%
362 Daventry 1,208 7.8%
363 Wokingham 2,759 7.8%
364 North Kesteven 1,568 7.8%
365 North West Leicestershire 1,457 7.7%
366 Rutland 515 7.7%
367 Guildford 2,015 7.7%
368 Bromsgrove 1,351 7.6%
369 Rushcliffe 1,628 7.5%
370 Vale of White Horse 1,904 7.4%
371 South Northamptonshire 1,140 6.5%

SOCIAL MARKET FOUNDATION
48
ENDNOTES
1 Taylor-Robinson et al (2013), “The rise of food poverty in the UK”, BMJ 2 Department for Environment Food and Rural Affairs (2020), “Food Statistics in your pocket: Prices and expenditure” 3 Resolution Foundation (2020), “Low Pay Britain 2020: Resolution Foundation annual report” 4 United Nations (2019), “Visit to the United Kingdom of Great Britain and Northern Ireland: Report of the Special Rapporteur on extreme poverty and human rights” 5 https://www.theguardian.com/politics/2019/may/22/amber-rudd-to-lodge-complaint-over-un-austerity-report 6 Human Rights Watch (2019), “Nothing Left in the Cupboards: Austerity, Welfare Cuts, and the Right to Food in the UK” 7 https://www.trusselltrust.org/news-and-blog/latest-stats/end-year-stats/#children 8 Environmental Audit Committee (2018), Written evidence submitted by City Harvest London 9 Social Mobility Commission (2020), “Monitoring social mobility: 2013-2020: Is the government delivering on our recommendations? “ 10 Social Mobility Commission (2020), “Monitoring social mobility: 2013-2020: Is the government delivering on our recommendations?”; Resolution Foundation (2019), “The Living Standards Outlook 2019” 11 Unicef (2017), “Prevalence and Correlates of Food Insecurity among Children across the Globe” 12 Environmental Audit Committee (2019), “Sustainable Development Goals in the UK follow up: Hunger, malnutrition and food insecurity in the UK” 13 https://www.childrenscommissioner.gov.uk/2020/06/04/children-should-not-bear-the-burden-of-the-pandemic-recession/ 14 https://www.trusselltrust.org/2020/05/01/coalition-call/ 15 Legatum Institute (2020), “Briefing: Poverty During The Covid-19 Crisis” 16 https://www.ifpri.org/blog/covid-19-virus-will-mostly-spare-young-children-economic-crisis-will-not 17 https://www.gov.uk/government/news/voucher-scheme-launches-for-schools-providing-free-school-meals 18 https://schoolsweek.co.uk/coronavirus-dfe-confirms-plans-for-15-a-week-free-school-meal-vouchers/ 19 https://www.thetimes.co.uk/article/no-10-makes-u-turn-to-offer-free-holiday-meals-to-pupils-cgsdblk7c 20 https://www.theguardian.com/politics/2020/jun/16/boris-johnson-faces-tory-rebellion-over-marcus-rashfords-school-meals-call 21 Dimbleby et al (2020), “The National Food Strategy: Part One – July 2020” 22 https://foodfoundation.org.uk/new-evidence-of-child-food-insecurity-in-the-uk/ 23 Environmental Audit Committee (2019), op. cit. 24 End Hunger UK (2019), “Why End UK Hunger? The case for ending hunger in the UK”; Barker and Russell (2020), “Feeding the food insecure in Britain: learning from the 2020 COVID-19 crisis” 26 The Trussell Trust (2019), “State of Hunger: A study of poverty and food insecurity in the UK” 27 Loopstra et al (2018), “Impact of Welfare Benefit Sanctioning on Food Insecurity: a Dynamic Cross-Area Study of Food Bank Usage in the UK”, Journal of Social Policy

MEASURING AND MITIGATING CHILD HUNGER
49
28 The Trussell Trust (2018), “The Next Stage of Universal Credit: Moving onto the new benefit system and foodbank use” 29 Environmental Audit Committee (2019), op. cit. 30 Ibid 31 https://foodfoundation.org.uk/covid-19-latest-impact-on-food/ 32 The Trussell Trust (2019), “State of Hunger: A study of poverty and food insecurity in the UK” 33 Ibid 34 Department for Education (2020), “Guidance: Providing school meals during the coronavirus (COVID-19) outbreak” 35 https://www.wrap.org.uk/food-drink/business-food-waste/courtauld-2025 36 https://fareshare.org.uk/what-we-do/our-impact/ 37 https://www.wrap.org.uk/content/emergency-covid-19-surplus-food-redistribution-resource-hub 38 https://fareshare.org.uk/news-media/news/mammoth-covid-19-response-sees-16-million-meals-provided-to-uks-most-vulnerable-through-pandemic/ 39 https://fareshare.org.uk/news-media/press-releases/deliveroo-commits-to-delivering-food-to-thousands-of-families-in-need-this-christmas/; https://fareshare.org.uk/news-media/press-releases/tesco-to-donate-an-additional-4m-of-food-to-fareshare/ 40https://www.theguardian.com/education/2020/oct/30/marcus-rashford-businesses-proving-free-meals-in-england 41 WRAP (2020), “Food surplus and waste in the UK – key facts” 42 United Nations (2017), “The State of Food Security and Nutrition in the World” 43 https://www.ers.usda.gov/topics/food-nutrition-assistance/food-security-in-the-us/definitions-of-food-security.aspx#:~:text=Food%20insecurity%E2%80%94the%20condition%20assessed,may%20result%20from%20food%20insecurity. 44 https://foodfoundation.org.uk/new-evidence-of-child-food-insecurity-in-the-uk/ 45 http://www.fao.org/fao-stories/article/en/c/1201668/#:~:text=For%20many%20years%2C%20hunger%20has,to%20the%20food%20they%20need 46 Webb et al (2006), “Measuring Household Food Insecurity: Why It’s So Important and Yet so Difficult to Do”, The Journal of Nutrition; Food and Agriculture Organisation of the United Nations (2013), “The Food Insecurity Experience Scale: Development of a Global Standard for Monitoring Hunger Worldwide” 47 https://www.lboro.ac.uk/research/crsp/mis/ 48 http://www.fao.org/3/Y4249E/y4249e0d.htm 49 https://www.food.gov.uk/research/research-projects/social-media-listening-emerging-trends 50 Webb et al (2006), op. cit.; Food and Agriculture Organisation of the United Nations (2013), “The Food Insecurity Experience Scale: Development of a Global Standard for Monitoring Hunger Worldwide” 51 The Food Foundation & Loopstra (2016), “Household food insecurity: the missing data” 52 All-Party Parliamentary Group on Hunger (2016), “Britain’s not-so-hidden hunger: A progress report from the All-Party Parliamentary Group on Hunger” 53 Sharpe (2018), “Time to count the hungry: The case for a standard measure of household food insecurity in the UK”

SOCIAL MARKET FOUNDATION
50
54 House of Commons Environmental Audit Committee (2018), Oral evidence: Sustainable Development Goals in the UK follow-up, HC 1491, Tuesday 23 October 2018 55 Food Insecurity Bill 2017-19 56 https://www.sustainweb.org/news/feb19_household_food_insecurity_measurement/ 57 Public Health England (2016), “The Eatwell Guide” 58 The Food Foundation (2018), “Affordability of the UK’s Eatwell Guide” 59 https://www.food.gov.uk/sites/default/files/media/document/food-and-you-wave-5-combined-report.pdf 60 Food Standards Agency and NatCen Social Research (2019), “The Food and You Survey: Wave 5” 61 The Food Foundation (2020), “The Impact of Coronavirus on Children’s Food”, https://foodfoundation.org.uk/new-food-foundation-data-sept-2020/ 62 Evidence and Network on UK Household Food Insecurity in the UK, “Household food insecurity in the UK”, https://enuf.org.uk/household-food-insecurity-uk#:~:text=Over%202016%20to%202018%2C%205.6,FSA's%20Food%20and%20You%20survey 63 The Food Foundation (2020), “The Impact of Coronavirus on Children’s Food”, op. cit. 64 https://www.theguardian.com/business/2020/nov/05/rise-uk-construction-sector-economic-builders-contraction-lockdown 65 Corfe (2018), “What are the barriers to eating healthily in the UK?”, Social Market Foundation, https://www.smf.co.uk/wp-content/uploads/2018/10/What-are-the-barriers-to-eating-healthy-in-the-UK.pdf 66 https://www.thetimes.co.uk/article/no-10-makes-u-turn-to-offer-free-holiday-meals-to-pupils-cgsdblk7c 67 https://www.theguardian.com/politics/2020/nov/24/uk-facing-risk-of-systemic-economic-crisis-official-paper-says 68 Farquharson (2020), “No free lunch? Some pros and cons of holiday free school meals”, Institute for Fiscal Studies, https://www.ifs.org.uk/publications/15148 69 https://www.hrw.org/news/2020/05/27/uk-children-england-going-hungry-schools-shut 70 https://foodfoundation.org.uk/food-foundation-welcomes-significant-step-in-support-of-endchildfoodpoverty-after-government-announcement/ 71 https://www.bbc.co.uk/news/uk-scotland-scotland-politics-55105158 72 Bourquin & Waters (2020), “The temporary benefit increases beyond 2020-21”, Institute for Fiscal Studies, https://www.ifs.org.uk/uploads/CH8-IFS-Green-Budget-2020-Temporary-benefit-increases.pdf 73 https://www.scotsman.com/health/coronavirus/nicola-sturgeon-announce-ps100-every-family-receiving-free-school-meals-christmas-3051668 74 https://foodfoundation.org.uk/food-foundation-welcomes-significant-step-in-support-of-endchildfoodpoverty-after-government-announcement/ 75 https://schoolsweek.co.uk/holiday-hunger-programme-extended-nationwide-with-220m-funding/ 76 https://fareshare.org.uk/news-media/press-releases/fareshare-joins-child-poverty-task-force-spearheaded-by-england-international-footballer-marcus-rashford/ 77 Hochlaf & Thomas (2020), “The Whole Society Approach”, Institute for Public Policy Approach, https://www.ippr.org/files/2020-08/a-whole-society-approach-aug-2020.pdf 78 All Party Parliamentary Group on a fit and healthy childhood (2020), “Healthy Families: The Present and Future role of the Supermarket”,
MEASURING AND MITIGATING CHILD HUNGER
51
https://repository.canterbury.ac.uk/download/f04067adf30660709e000908a267c95dbd40b1f8af5ad9da1b3f95f93e9cd9bb/424970/SUPERMARKETS%20REPORT%20Feb2020.pdf 79 Dimbleby et al (2020), “op. cit. 80 https://metro.co.uk/2020/10/25/marcus-rashford-truly-overwhelmed-after-1000-organisations-pledge-free-school-meals-13476941/ 81 http://www.wrap.org.uk/food-drink/business-food-waste/history-courtauld 82 https://www.wrap.org.uk/content/surplus-food-redistribution-working-group-0#:~:text=The%20Working%20Group%20will%20seek,and%20approaches%20to%20monitoring%20progress; https://www.wrap.org.uk/content/new-food-waste-reduction-fund-will-help-charities-feed-people 83 https://www.wrap.org.uk/content/business-case-reducing-food-loss-and-waste-0 84 https://www.barnsley.gov.uk/news/new-food-plan-for-barnsley/ 85 House of Commons Environmental Audit Committee (2019), “Sustainable Development Goals in the UK follow up: Hunger, malnutrition and food insecurity in the UK”, https://publications.parliament.uk/pa/cm201719/cmselect/cmenvaud/1491/149105.htm 86 Dimbleby et al (2020), op. cit.; https://www.gov.uk/government/news/63-million-for-local-authorities-to-assist-those-struggling-to-afford-food-and-other-essentials 87 Public Health England (2019), “Whole systems approach to obesity”, https://assets.publishing.service.gov.uk/government/uploads/system/uploads/attachment_data/file/820783/Whole_systems_approach_to_obesity_guide.pdf 88 https://www.sustainablefoodplaces.org/news/using-food-ladders-to-create-household-and-community-resilience/; https://geofoodie.org/2019/06/19/food-ladders/ 89 Street Games (2020), “Fit and Fed”, https://www.streetgames.org/Handlers/Download.ashx?IDMF=8a393a49-3a3b-451e-85d2-8b694706f143 90 https://www.sustainweb.org/childrensfoodcampaign/teaching_food_skills/ 91 https://www.nutrition.org.uk/foodinschools/programme/the-education-programme.html 92 https://www.theguardian.com/society/2020/oct/26/haf-the-hit-pilot-scheme-that-could-offer-way-out-of-school-meals-row 93 https://www.opinium.com/what-we-do/thought-leadership/ 94 The Food Foundation (2020), “The Impact of Coronavirus on Children’s Food”, op. cit. 95 Food Standards Agency & Ipsos MORI (2020), “Covid-19 Consumer Tracker Waves 1-3”, https://www.food.gov.uk/sites/default/files/media/document/covid-19-wave-1-4-report-final-mc.pdf 96 The Food Foundation (2020), “The Impact of Coronavirus on Children’s Food”, op. cit.