measuring and promoting inter-rater agreement of teacher and
TRANSCRIPT

Measuring and Promoting Inter-Rater Agreement of Teacher and Principal Performance Ratings
February 2012
Matthew Graham Anthony Milanowski Jackson Miller Westat

The work described in this paper was supported by the U.S. Department of Education through the Center for Educator Compensation Reform. The opinions expressed are those of the authors and do not necessarily reflect the view of the U.S. Department of Education, the Center for Educator Compensation Reform, or the institutional partners of the Center. Comments and suggestions are welcome.
The Center for Educator Compensation and Reform (CECR) was awarded to Westat — in partnership with Learning Point Associates, an affiliate of American Institutes for Research, Synergy Enterprises Inc., J. Koppich and Associates and the University of Wisconsin — by the U.S. Department of Education in October 2006.
The primary purpose of CECR is to support Teacher Incentive Fund (TIF) grantees in their implementation efforts through provision of sustained technical assistance and development and dissemination of timely resources. CECR also is charged with raising national awareness of alternative and effective strategies for educator compensation through a newsletter, a Web-based clearinghouse, and other outreach activities.
This work was originally produced in whole or in part by the CECR with funds from the U.S. Department of Education under contract number ED-06-CO-0110. The content does not necessarily reflect the position or policy of CECR or the Department of Education, nor does mention or visual representation of trade names, commercial products, or organizations imply endorsement by CECR or the federal government.
Allison Henderson, Director Phone: 888-202-1513 E-mail: [email protected]
34705.0212.83670507

Contents
I. Introduction . . . . . . . . . . . . . . . . . . . . . . . . . . . . . . . . . .4
II. Inter-Rater Reliability and Inter-Rater Agreement . . . . . . . . . . . . . . . . . . . .5
Which is more important for educator evaluation? . . . . . . . . . . . . . . . . . . . .6
III. How Is Inter-Rater Agreement Measured? . . . . . . . . . . . . . . . . . . . . . . .7
IV. What Level of Agreement Is Acceptable? . . . . . . . . . . . . . . . . . . . . . . .9
Which ratings should agree? . . . . . . . . . . . . . . . . . . . . . . . . . . . 11
V. How Can Evidence of Agreement be Gathered? . . . . . . . . . . . . . . . . . . . . 13
VI. What Factors Affect Inter-Rater Agreement? . . . . . . . . . . . . . . . . . . . . . 15
Rater training . . . . . . . . . . . . . . . . . . . . . . . . . . . . . . . . . 15
Rater selection . . . . . . . . . . . . . . . . . . . . . . . . . . . . . . . . 16
Accountability for accurate rating . . . . . . . . . . . . . . . . . . . . . . . . . 17
Rubric design . . . . . . . . . . . . . . . . . . . . . . . . . . . . . . . . . 18
Type of rubric scale . . . . . . . . . . . . . . . . . . . . . . . . . . . . . . . 19
Pilot programs and redesign . . . . . . . . . . . . . . . . . . . . . . . . . . . 21
VII. Other Issues to Consider . . . . . . . . . . . . . . . . . . . . . . . . . . . . 22
Representativeness of observations . . . . . . . . . . . . . . . . . . . . . . . . . 22
Videotaped observations . . . . . . . . . . . . . . . . . . . . . . . . . . . . . 22
Appendix 1: More on Intra-Class Correlations . . . . . . . . . . . . . . . . . . . . . . 24
Appendix 2: Frame-of-Reference Training Outline . . . . . . . . . . . . . . . . . . . . . 25
References . . . . . . . . . . . . . . . . . . . . . . . . . . . . . . . . . . . . 28
Measuring and Promoting Inter-Rater Agreement of Teacher and Principal Performance Ratings 3
4
I. Introduction
As states, districts, and schools transition toward more rigorous educator evaluation systems, they are placing additional weight on judgments about educator practice. Both the U.S. Department of Education’s Race to the Top and Teacher Incentive Fund (TIF) program guidelines call for evaluation systems to include observations of educator practice using a multi-level rating scale or rubric. Since observation ratings inherently rely on evaluators’ professional judgment, there is always a question of how much the ratings depend on the particular evaluator rather than the educator’s actual performance. This is an important question because teachers and principals do not want to be observed by a “hard grader,” nor worry about a particular rater’s idiosyncratic vision of good practice. In addition, administrators using evaluation ratings to target development or reward high performers want the ratings to represent objective differences in performance rather than one evaluator’s opinion on good practice.
Ensuring that evaluators’ ratings are consistent and fair addresses these concerns. Practitioners, researchers, and policymakers often refer to the measurement of consistency across evaluators’ judgments about a person or object as “inter-rater reliability.” This broad use of the term masks an
important technical distinction between inter-rater agreement and inter-rater reliability. High reliability scores indicate that observers tend to rate teachers in the same relative order, while agreement measures the extent to which scorers agree on the absolute level of performance (the numerical score). When measures of inter-rater agreement and inter-rater reliability are high, educators can be more confident that their scores are consistent and fair.
Since evaluation results are beginning to help inform high-stakes decisions about promotion, retention, tenure, and compensation, it is becoming increasingly important to achieve high inter-rater agreement and inter-rater reliability in observational evaluations. Consequently, some states, districts, and schools have provided extensive professional development to help ensure that their evaluators’ assessments of an educator’s performance are consistent. To help states, districts, and schools choose a tool to measure the consistency of evaluator observations, this paper will: (1) draw a distinction between inter-rater reliability and inter-rater agreement, (2) review methods for calculating inter-rater reliability and agreement and recommend thresholds for inter-rater agreement scores, and (3) identify practices that can improve inter-rater reliability and inter-rater agreement.
Measuring and Promoting Inter-Rater Agreement of Teacher and Principal Performance Ratings

5
II. Inter-Rater Reliability and Inter-Rater Agreement
Practitioners, researchers, and policymakers often use inter-rater reliability as a generic term for rater consistency. However, some measurement experts contend that inter-rater reliability has a more precise definition. They define it as the measurement of the consistency between evaluators in the ordering or relative standing of performance ratings, regardless of the absolute value of each evaluator’s rating. We adopt this use of the term in this paper.
Based on this definition of inter-rater reliability, we contend that inter-rater agreement is the measure that is of most concern to users of educator evaluation ratings. Inter-rater agreement is the degree to which two or more evaluators using the same rating scale give the same rating to an identical observable situation (e.g., a lesson, a video, or a set of documents). Thus, unlike inter-rater reliability, inter-rater agreement is a measurement of the consistency between the absolute value of evaluators’ ratings.
Table 1 illustrates the difference between inter-rater agreement and reliability. Again, agreement measures how frequently two or more evaluators assign the exact same rating (e.g., if both give a rating of “4” they are in agreement), and reliability measures the relative similarity between two or more sets of ratings. Therefore, two evaluators who have little to no agreement could still have high inter-rater reliability (Tinsley & Weiss, 2000). Table 1 offers an example of how this can occur. In this scenario, Raters 1 and 2 agree on the relative performance of the four teachers because both assigned ratings that increased monotonically, with Teacher A receiving the lowest score and Teacher D receiving the highest score. However, though they agreed on the relative ranking of the four teachers, they never agreed on the absolute level of performance. As a consequence, the level of inter-rater reliability between Raters 1 and 2 is perfect (1.0), but there is no agreement (0.0). By contrast, Raters 3 and 4 agree on both the absolute level and relative order of teacher
Table 1: Example of Differences Between Reliability and Agreement
Low Agreement, High Reliability High Agreement, High Reliability Rater 1 Rater 2 Rater 3 Rater 4
Teacher A 1 2 1 1
Teacher B 2 3 2 2
Teacher C 3 4 3 3
Teacher D 4 5 4 4
Agreement 0.0 1.0
Reliability 1.0 1.0
Based on Tinsley & Weiss (2000).
Measuring and Promoting Inter-Rater Agreement of Teacher and Principal Performance Ratings

6
performance. Thus, they have both perfect inter-rater reliability (1.0) and inter-rater agreement (1.0).
Another way to think about the distinction is that inter-rater agreement is based on a “criterion-referenced” interpretation of the rating scale: there is some level or standard of performance that counts as good or poor. Inter-rater reliability, on the other hand, is based on a norm-referenced view: the order of the ratings with respect to the mean or median defines good or poor rather than the rating itself.
Which is more important for educator evaluation?
Typically, rater agreement is more important to educators when tying high-stakes decisions about promotion, retention, or compensation to evaluations because they often make decisions based on a score threshold. For example, a teacher receiving a “2.5” may not be eligible for a pay increase, whereas a teacher scoring a “3” may
receive one. Thus, to ensure that educators receive fair compensation, it is important that evaluators rate practice consistently. Inter-rater agreement is also important when it informs evaluation results to give teachers feedback or to plan professional development. Evaluation ratings with better inter-rater agreement are more likely to be a credible source of performance feedback and basis for professional development planning because they are more likely to reflect true strengths and weaknesses rather than a rater’s opinion on good educator practice.
Inter-rater reliability is more frequently of concern in research studies or where the only interest is in consistency of raters’ judgments about the relative levels of performance. For example, states, districts, and schools can use inter-rater reliability in situations where financial rewards are provided to a fixed percentage of educators (e.g., the top performing 30%) or when the lowest quintile of performers receive remedial professional development.
Measuring and Promoting Inter-Rater Agreement of Teacher and Principal Performance Ratings

7
III. How Is Inter-Rater Agreement Measured?
There are three common indexes of inter-rater agreement: the percentage of absolute agreement, various versions of Cohen’s kappa, and the intra-class correlation coefficient.
The percentage of absolute agreement is the simplest to understand.1 One simply calculates the number of times raters agree on a rating, then divides by the total number of ratings. Thus, this measure can vary between 0 and 100%. Other names for this measure include percentage of exact agreement and percentage of specific agreement. It may also be useful to calculate the percentage of times ratings fall within one performance level of one another (e.g., count as agreement cases in which rater 1 gives a 4 and rater 2 gives a 5). This measure has been called the percentage of exact and adjacent agreement. When there are more than 4 or 5 rating levels, exact and adjacent agreement may be a more realistic measure to use.
Cohen’s kappa is a more stringent measure than the percentage of absolute agreement because it corrects for the likelihood that some agreement between evaluators will occur by chance. If chance agreement is high, then the percentage of absolute agreement will overstate how much agreement occurred due to a shared understanding of the performance and the rating scale.2 One can calculate kappa by subtracting the estimated level of chance agreement from the observed level of agreement, then dividing by the maximum possible nonchance agreement. Originally, kappa measured the agreement between two raters using a two-level (e.g., proficient vs. not proficient) rating scale, but it can also measure when there are three or more performance levels. Similarly
to the exact and adjacent agreement discussed above, one can use a variation called weighted kappa to distinguish between the number of ratings that fall within one performance level and the number of ratings that differ by two or more performance levels. In addition, a version called generalized kappa can compare groups of more than two raters. All versions of kappa range from 0 to 1. It is easiest to calculate kappa using statistical software such as SPPSX, SAS, or programs designed to calculate rater agreement, such as AgreeStat (http://agreestat.com/agreestat), AGREE (http://www.scienceplus.nl/catalog/agree),or ReCal (http://dfreelon.org/utils/recalfront/).
The intra-class correlation (ICC) is a measure of agreement that is useful when there are many rating categories (5 or more) or when ratings are made along a continuous scale (e.g., one that allows ratings of rational numbers such as 2.3, 2.4, 2.5, etc). Under these conditions, it is difficult and not very meaningful to calculate kappa or the percentage of absolute agreement. When measuring rater agreement, the ICC represents the proportion of the variation in the ratings that is due to the performance of the person being evaluated rather than factors such as how the rater interprets the rubric. Subtracting the ICC from 1 gives the proportion of variation between raters that occurs due to rater disagreement. ICC scores generally range from 0 to 1, where a 1 indicates perfect agreement, and a 0 indicates no agreement. There are several versions of the ICC, so it is important to choose the appropriate one.3 The ICC is best calculated using general purpose statistical packages, which is discussed further in Appendix 1.
1 A good reference on absolute agreement is http://www.john-uebersax.com/stat/raw.htm.2 Good references on kappa include Fleiss (1981) Chapter 13 and Gwet (2010) Chapters 2 and 3. 3 The website http://www.john-uebersax.com/stat/icc.htm provides a useful introduction to the intra-class correlation. Those with a statistical
background might want to look at articles by Shrout & Fleiss (1979) or McGraw & Wong (1996).
Measuring and Promoting Inter-Rater Agreement of Teacher and Principal Performance Ratings

8
Table 2: Common Measures of Inter-Rater Agreement
Index Concept Advantages Limitations
Percent absolute agreement
How often do raters agree on the exact rating?
Easy to calculate when number of raters and rating levels is small.
Easy to interpret.
Best measure to use when many ratees receive the same rating.
Hard to calculate and interpret if there are very many categories.
Does not take chance agreement into account, so may overestimate the agreement that can be expected in the future.
Does not distinguish between a 1-level disagreement and a 2- or more level disagreement.
Cohen’s kappa How well do raters agree, corrected for chance agreement?
Kappa is a better estimate of the agreement that might be expected from raters rating a different group of ratees.
Hard to calculate and interpret if there are many rating levels.
Can be misleadingly low if a large majority of ratings are at the highest or lowest level.
Intra-class correlation What proportion of the variation in rating is due to ratee performance rather than rater error?
Easier to calculate than other measures when there are a lot of raters and 5 or more levels.
The only measure that works well when ratings are on a continuous scale.
Requires some understanding of statistics to calculate.
Can be misleading if there is low variation in ratings across ratees.
Table 2 summarizes the strengths and weaknesses of each method of measuring inter-rater agreement.
Because no one method is best under all circumstances, it is often appropriate to calculate more than one measure. For example, if the ICC is lower than expected, calculating the percentage of absolute agreement can show whether the problem is low agreement or limited variation in the performance ratings. Typically, if there are four or fewer discrete rating levels, kappa and the percentage of absolute agreement should both be calculated. If there are a moderate number of performance levels
(e.g., 5-9), one could use the ICC as well as the percentage of absolute agreement. If scores are on a continuous scale, then one should always use the ICC to calculate inter-rater agreement. After inter-rater agreement is calculated using the ICC, one can group the scores into categories based on expected thresholds for consequences (e.g., the scores required for rewards, tenure, or triggering remediation). Based on the groupings, one can calculate the percentage of absolute agreement by dividing the number of times raters placed individual teachers in the same performance category by the total number of teachers observed.
Measuring and Promoting Inter-Rater Agreement of Teacher and Principal Performance Ratings
9
IV. What Level of Agreement Is Acceptable?
There are no hard and fast rules about the level of agreement needed to use a set of ratings to make high-stakes decisions or to consider the evaluation process reliable.4 In general, researchers contend that the greater the consequences resulting from the evaluation, the greater the need for high inter-rater agreement. (e.g., LeBreton & Sentor, 2008; Nunnally & Bernstein, 1994).
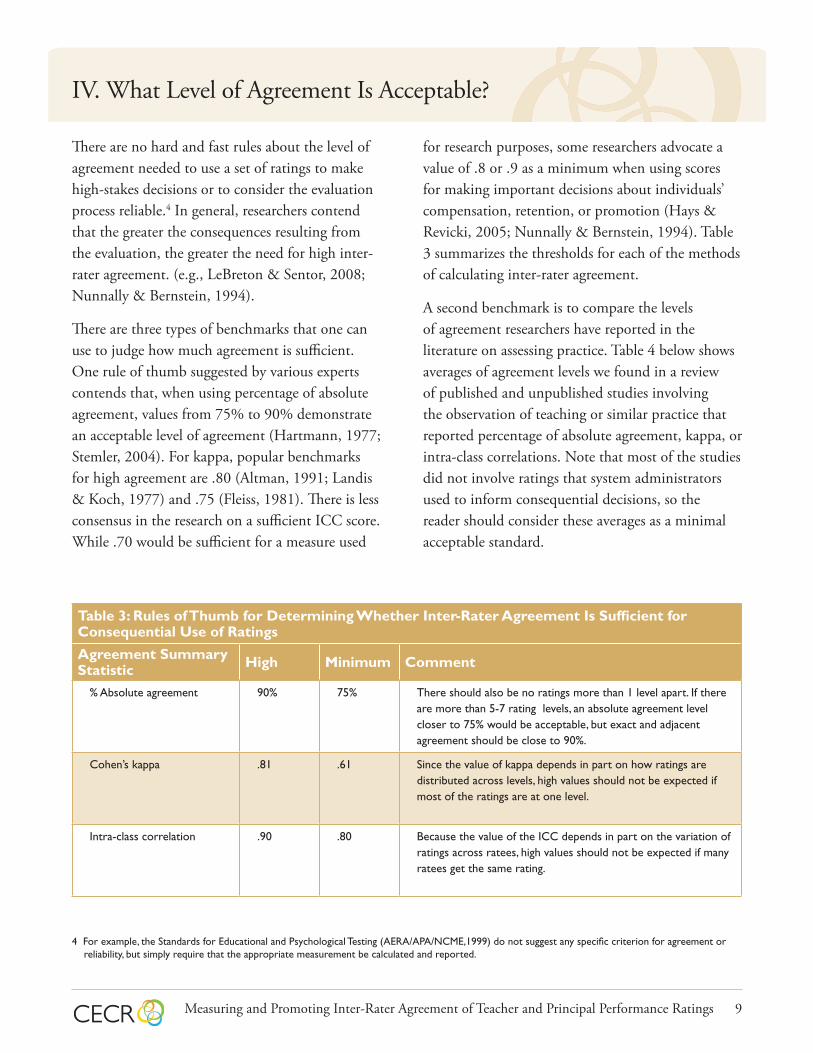
There are three types of benchmarks that one can use to judge how much agreement is sufficient. One rule of thumb suggested by various experts contends that, when using percentage of absolute agreement, values from 75% to 90% demonstrate an acceptable level of agreement (Hartmann, 1977; Stemler, 2004). For kappa, popular benchmarks for high agreement are .80 (Altman, 1991; Landis & Koch, 1977) and .75 (Fleiss, 1981). There is less consensus in the research on a sufficient ICC score. While .70 would be sufficient for a measure used
for research purposes, some researchers advocate a value of .8 or .9 as a minimum when using scores for making important decisions about individuals’ compensation, retention, or promotion (Hays & Revicki, 2005; Nunnally & Bernstein, 1994). Table 3 summarizes the thresholds for each of the methods of calculating inter-rater agreement.
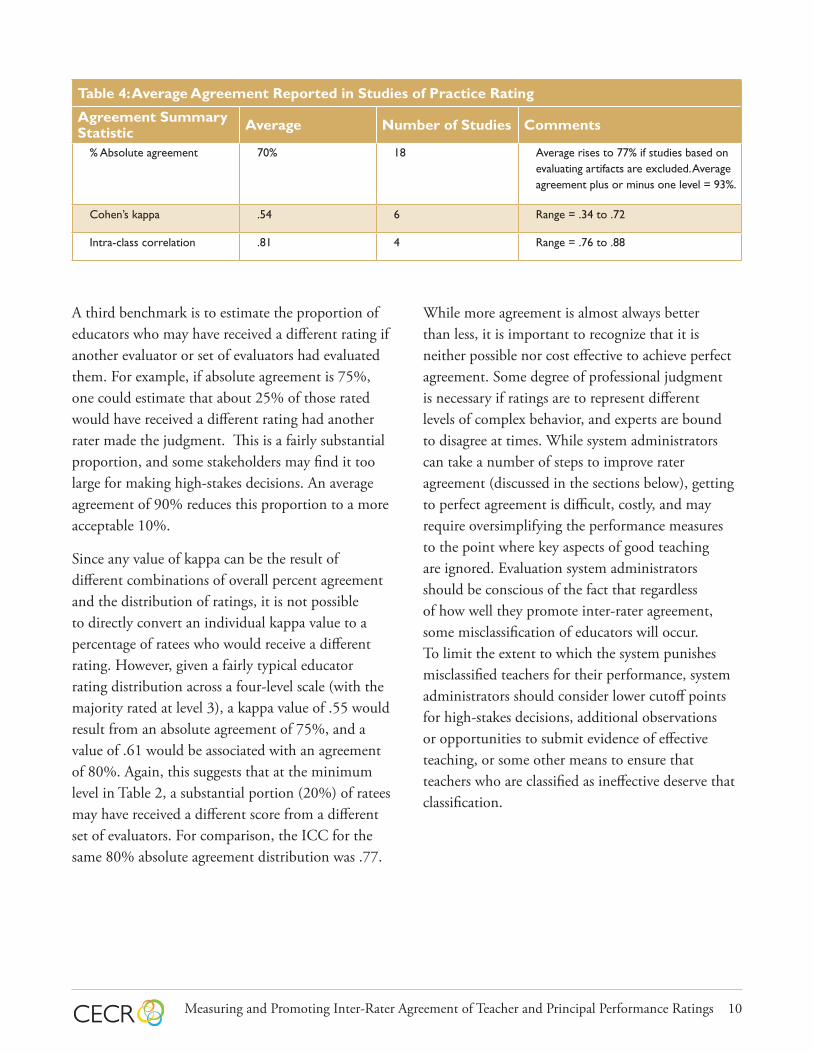
A second benchmark is to compare the levels of agreement researchers have reported in the literature on assessing practice. Table 4 below shows averages of agreement levels we found in a review of published and unpublished studies involving the observation of teaching or similar practice that reported percentage of absolute agreement, kappa, or intra-class correlations. Note that most of the studies did not involve ratings that system administrators used to inform consequential decisions, so the reader should consider these averages as a minimal acceptable standard.
Table 3: Rules of Thumb for Determining Whether Inter-Rater Agreement Is Sufficient for Consequential Use of Ratings
Agreement Summary Statistic High Minimum Comment
% Absolute agreement 90% 75% There should also be no ratings more than 1 level apart. If there are more than 5-7 rating levels, an absolute agreement level closer to 75% would be acceptable, but exact and adjacent agreement should be close to 90%.
Cohen’s kappa .81 .61 Since the value of kappa depends in part on how ratings are distributed across levels, high values should not be expected if most of the ratings are at one level.
Intra-class correlation .90 .80 Because the value of the ICC depends in part on the variation of ratings across ratees, high values should not be expected if many ratees get the same rating.
4 For example, the Standards for Educational and Psychological Testing (AERA/APA/NCME,1999) do not suggest any specific criterion for agreement or reliability, but simply require that the appropriate measurement be calculated and reported.
Measuring and Promoting Inter-Rater Agreement of Teacher and Principal Performance Ratings
10
Table 4: Average Agreement Reported in Studies of Practice Rating
Agreement Summary Statistic Average Number of Studies Comments
% Absolute agreement 70% 18 Average rises to 77% if studies based on evaluating artifacts are excluded. Average agreement plus or minus one level = 93%.
Cohen’s kappa .54 6 Range = .34 to .72
Intra-class correlation .81 4 Range = .76 to .88
A third benchmark is to estimate the proportion of educators who may have received a different rating if another evaluator or set of evaluators had evaluated them. For example, if absolute agreement is 75%, one could estimate that about 25% of those rated would have received a different rating had another rater made the judgment. This is a fairly substantial proportion, and some stakeholders may find it too large for making high-stakes decisions. An average agreement of 90% reduces this proportion to a more acceptable 10%.
Since any value of kappa can be the result of different combinations of overall percent agreement and the distribution of ratings, it is not possible to directly convert an individual kappa value to a percentage of ratees who would receive a different rating. However, given a fairly typical educator rating distribution across a four-level scale (with the majority rated at level 3), a kappa value of .55 would result from an absolute agreement of 75%, and a value of .61 would be associated with an agreement of 80%. Again, this suggests that at the minimum level in Table 2, a substantial portion (20%) of ratees may have received a different score from a different set of evaluators. For comparison, the ICC for the same 80% absolute agreement distribution was .77.
While more agreement is almost always better than less, it is important to recognize that it is neither possible nor cost effective to achieve perfect agreement. Some degree of professional judgment is necessary if ratings are to represent different levels of complex behavior, and experts are bound to disagree at times. While system administrators can take a number of steps to improve rater agreement (discussed in the sections below), getting to perfect agreement is difficult, costly, and may require oversimplifying the performance measures to the point where key aspects of good teaching are ignored. Evaluation system administrators should be conscious of the fact that regardless of how well they promote inter-rater agreement, some misclassification of educators will occur. To limit the extent to which the system punishes misclassified teachers for their performance, system administrators should consider lower cutoff points for high-stakes decisions, additional observations or opportunities to submit evidence of effective teaching, or some other means to ensure that teachers who are classified as ineffective deserve that classification.
Measuring and Promoting Inter-Rater Agreement of Teacher and Principal Performance Ratings

11
Which ratings should agree?
A typical evaluation system asks raters to rate performance in different categories referred to as dimensions or domains. In most cases, domain ratings combine in some way to provide an overall rating of practice (see Table 5). For example, both the TAP teacher evaluation system and many systems based on Danielson’s Framework for Teaching have four domains, and each domain has several standards or components within it. Raters evaluate educators on each standard or component and use the combined component ratings to generate domain-level and/or overall scores. The TAP system averages standard-level ratings to provide domain scores. Then, TAP calculates an overall score across all four domains (designing and planning instruction, the learning environment, instruction, and responsibilities) as a weighted average of the domain-level scores.
When assessing inter-rater agreement, should agreement be assessed at the standard, domain, or overall score level?
There are good reasons to calculate agreement at the lowest level at which a separate numerical rating is made. Agreement at this level provides information about which rubrics raters may find difficult to use. If agreement on one standard or dimension is consistently low, a revision of the rubric wording or more training on that particular rubric is likely to be needed. If building higher level ratings combines the ratings at the lowest level (e.g., added or averaged), good agreement at the lowest level almost always leads to good agreement at higher levels as well.
When reporting inter-rater agreement at lower levels, if ratings are made using whole numbers, it is usually easiest to report the percentage of absolute agreement. Reporting by standard and then averaging within domains and across all standards can provide useful information. Table 6 below illustrates this principle.
Table 5. Typical Streucture of an Evaluation ScoreOverall Rating
Domain 1 Domain 2 Domain 3 Domain 4
1-1 1-2 1-3 1-4 2-1 2-2 2-3 2-4 3-1 3-2 3-3 3-4 4-1 4-2 4-3 4-4
Measuring and Promoting Inter-Rater Agreement of Teacher and Principal Performance Ratings

12
In the Table 6 scenario, at 82%, the average agreement at the standard level is fairly good. However, the calculation of scores at the standard level reveals three standards, 1-3, 2-1, and 3-1, that had levels of agreement substantially below the 75% rule of thumb. Ratings on these standards need further examination, and raters should report any problems they had applying the corresponding rubrics. In addition, calculating scores at the domain level reveals that each standard in Domain 4 has average or better agreement, while Domain 1 has on average the least agreement. In such a situation, states, districts, or schools might consider comparing rubrics for these two domains and talking with raters to determine whether one set of rubrics is more understandable or evidence is easier to evaluate.
It is also useful to assess agreement at the overall or final rating level, especially if rewards or other consequences are based on the overall rating. If lower level ratings are added or averaged, and not rounded up or down to an integer value for the overall rating, it is probably best to use the ICC to measure agreement. As explained above, the ICC can more easily handle the greater number of levels and the intermediate scores between two rubric levels (e.g., 2.5. 3.2). At the overall level, an agreement estimate such as the ICC provides an indication of how reliable the overall rating is for making decisions such as rewards, remediation, or termination.
Table 6: Example Rater Agreement ReportDomain/Standard % Agreement
1-1 75
1-2 80
1-3 65
1-4 72
Domain 1 Average 73
2-1 67
2-2 75
2-3 78
2-4 81
Domain2 Average 75
3-1 65
3-2 75
3-3 78
3-4 81
Domain 3 Average 75
4-1 85
4-2 82
4-3 87
4-4 86
Domain 4 Average 85
Average Across Standards 82
Measuring and Promoting Inter-Rater Agreement of Teacher and Principal Performance Ratings
13
V. How Can Evidence of Agreement Be Gathered?
Inter-rater agreement and inter-rater reliability each represent the consistency of a particular set of ratings. Therefore, in order to calculate either measure, administrators must obtain samples wherein two or more observers have rated the same set of observable evidence (e.g., a lesson, a set of documents, etc.).
One way to obtain such a sample is to have raters rate a common set of video clips or artifacts. A common way to do this is to simulate a field observation at the end of training by asking all raters to rate a set of video clips that no rater has previously viewed. Using this method, administrators can calculate agreement or reliability by comparing raters to each other, or to a “gold standard” established by an expert panel. Often, when comparing raters to each other or a gold standard, raters must attain a minimum threshold for agreement on such a test before they can conduct observations in the field (e.g., 75%). Passing this test is evidence that each rater has at least the ability to assign ratings that are likely to agree with those of other trained raters.
Another way to provide evidence is to conduct a pilot study using the same procedures expected to be used when the evaluation system is fully operational. Ideally, administrators would conduct the pilot using samples of raters and educators who are representative of those who will be using the evaluation system in the future.
If two or more raters regularly evaluate every educator, inter-rater agreement can be periodically checked by having two raters observe and independently rate each educator at the same time at
least once per year. Administrators can then compare the ratings to assess agreement using the measures discussed above. If only one evaluator normally rates, system administrators can have a second rater observe and rate a sample of educators on the same occasion and make an independent rating. Again, administrators can use these two ratings of the same educator at the same time to calculate agreement. This could be done each year or each semester. If portfolios or other artifacts are part of the evaluation system, the two raters can also review a sample of these items.
Administrators can also calculate inter-rater agreement and reliability by videotaping each classroom observation and having a second rater conduct a follow-up rating on a portion of randomly selected observations. This method will ensure that raters always feel accountable for their rating performance and will allow follow-ups to be conducted in the summer, when educators’ time is less scarce. In addition, collecting such videotapes could provide an improved basis for self-evaluation or professional development and could bolster the supply of sample videos available for training. (For more information, see Videotaped observations.)
It is important to remember that inter-rater agreement and reliability calculations apply only to the set of ratings and observers that compose the sample used in the calculation. Neither inter-rater agreement nor inter-reliability is an inherent property of a measurement instrument such as an evaluation system rubric (Tinsley & Weiss, 2000; Walker, 2007). High agreement or reliability in one sample is no guarantee of similar results
Measuring and Promoting Inter-Rater Agreement of Teacher and Principal Performance Ratings

14
in the future. For example, there could be high agreement among one set of raters one year, but lower agreement the next as raters gain experience with the system, new raters join the system, and new educators receive evaluations. Thus, evaluation system administrators should periodically check for inter-rater agreement.
If rater agreement is checked periodically, system administrators will be able to monitor agreement over time and will have up-to-date evidence of agreement for each year’s ratings. They will also be able to determine whether raters need additional training or whether rater motivation to adhere to the process may be weakening.
Measuring and Promoting Inter-Rater Agreement of Teacher and Principal Performance Ratings

15
VI. What Factors Affect Inter-Rater Agreement?VI. What Factors Affect Inter-Rater Agreement?
As mentioned earlier, it is important to recognize that it is neither possible nor cost effective to achieve perfect agreement. Some degree of professional judgment is necessary if ratings are to represent different levels of complex behavior. However, evaluation system administrators can take many concrete steps to improve the consistency of evaluation results. This section discusses the major factors system designers should consider in order to maximize potential agreement.
Rater training Rater training is one of the most important tools system administrators have to improve agreement. Though some studies have found that some variability can persist even after lengthy training (Hoyt & Kerns, 1999; Lumley & McNamara, 1995; Wang, Wong, & Kwong, 2010), research has found that correctly designed training can improve agreement.
Current thinking about rater training emphasizes developing a common understanding among evaluators so that they will apply the rating system as consistently as possible. This common understanding, often called Frame of Reference (FOR) training, addresses the main sources of observer disagreement Hoyt and Kerns (1999) identified: lack of overlap among what is observed, discrepant interpretations of descriptor meanings, and personal beliefs or biases. FOR training typically involves an explanation of the rating system, discussion of avoiding bias and common errors, advice on mental processes for observation and making judgments, and practice observations (see Appendix 2 for a complete overview of typical steps in FOR training).
Research shows that FOR training improves rating accuracy, reliability, and validity (Gorman & Rentsch, 2009; Schleicher, Day, Bronston, Mayes, & Riggo, 2002; Woehr & Huffcutt, 1994). While large-scale evaluation systems have the added challenge of ensuring that training sessions at different times or locations teach the same principles, administrators can take several steps to maximize uniformity. Johnson, Penny, and Gordon (2008) recommend monitoring the training sessions to ensure quality. Monitoring methods could include videotaping different training sessions, comparing how raters at different training sessions rate the same sample lessons, and conducting training for trainers using a FOR model that reinforces the common understandings to be developed among the raters. Although training many raters is more difficult, researchers have concluded that it is possible. Henry, Grimm, and Pianta (2010) examined a sample of 2,093 Classroom Assessment Scoring System (CLASS) raters trained by the Office of Head Start and concluded that it was feasible to calibrate large pools of raters. Seventy-one percent of those observers passed the initial screening on the first try, which required 80% adjacent agreement (within one scale point) on a 7-point scale, as well as agreement requirements within each of the three dimensions CLASS assesses.5
The duration of training is also important. Research indicates that training needs to be more than an hour or two long to be effective. Researchers have found short training sessions to be ineffective at calibration (bringing evaluators in line with expert ratings or one another) and unlikely to produce consistent results (Barrett, 2001; Congdon & McQueen, 2000). Hoyt and Kerns (1999) found
5 It is important to emphasize that this was the first calibration assessment, and raters that fail often receive further training. Additionally, these authors are among those who recommend recruiting more raters than needed so that inaccurate raters can be dismissed.
Measuring and Promoting Inter-Rater Agreement of Teacher and Principal Performance Ratings

16
that training sessions that lasted 5 hours or more were significantly more effective than those lasting fewer than 5 hours. They also suggested that for highly inferential measures (those that are not explicitly linked to a directly observable behavior), there was a large benefit for 25-plus hours of training. This finding suggests that intermediate-length training sessions may be appropriate for more objective recording of behaviors, but that rating systems requiring more subjective judgments should use lengthier training. Many current systems require multi-day training, including CLASS, the Performance Assessment for California Teachers (PACT), Hillsborough County Schools’ system in Florida, and the Early Childhood Environment Rating Scale (Giota, 1995; Henry, Grimm, & Pianta, 2010; Pecheone & Chung Wei, 2007; Watts, 2011).
Before allowing raters to score educators in the field, evaluation administrators should test those raters’ ability to agree with expert ratings of the same performance to ensure that the training has been effective. However, training an observer is no guarantee of that person’s ability to use the rubric––some observers may require more training than others, and some may continue to produce inconsistent results even after intensive re-training (Henry, Grimm, & Pianta, 2010; Johnson, Penny, & Gordon, 2008; Lumley & McNamara, 1995; Weigle, 1998). Some assessment systems require that raters attain a minimum threshold of agreement with experts or peers before they are permitted to enter the field (Beesley, 2009; Dymond et al., 2008; Johnson, Penny, & Gordon, 2008; La Paro, Pianta, & Stuhlman, 2004; NICHHD ECCRN, 2005). As mentioned previously, system administrators can accomplish this by having trainee raters evaluate videos, transcripts, or other artifacts of classroom practices that expert raters have previously rated. Then they can retrain raters whose agreement with
the standard is less than some minimum (e.g., 75% absolute agreement) or not allow such raters to make ratings with consequences. While such tests cannot guarantee that raters will rate the same way in the field or agree with each other after the training, it does show that they have the skill to interpret the rubrics in an acceptable way.
Rater selection Research suggests that even extensive training will not ensure that every observer agrees with a standard or with her/his peers (Myford & Wolfe, 2009). Some researchers have recommended recruiting more raters than necessary and dismissing those who cannot pass agreement or reliability screenings (Henry, Grimm, & Pianta, 2010; Johnson, Penny, & Gordon, 2008; Lumley & McNamara, 1995; Weigle, 1998).
While little research explicitly ties rater expertise to agreement, there are reasons to believe that a rater’s expertise may improve accuracy. Some performance assessment studies have found positive links between observer expertise and rating accuracy, as well as the ability to differentiate between different domains on a performance scale (Kozlowski & Kirsch, 1987; Smither, Barry, & Reilly, 1989). A study of Chicago’s Excellence in Teaching pilot program suggested that experienced raters had an easier time collecting and interpreting observation evidence (Sartain, Stoelinga, & Brown, 2009). In the absence of more conclusive findings, fairness and common sense would seem to dictate that observers have relevant expertise and experience. The American Educational Research Association’s standards advise that raters understand the domains they are assessing, as well as the subjects to be assessed (AERA/APA/NCME, 1999).
Some research has shown that an observer’s pedagogical beliefs can influence that person’s ability to use a rating system as intended by the
Measuring and Promoting Inter-Rater Agreement of Teacher and Principal Performance Ratings

17
designers. In their study of CLASS, Henry et al. (2010) found that when raters’ beliefs conflicted with the underlying theoretical foundation of the evaluation system, it was more difficult to calibrate them (bring their ratings in line) with other raters. The study also found that instructional beliefs were much more strongly related to an observer’s ability to use the evaluation system than either education or experience. Research on job performance in other contexts has found that observers perform better when they believe in and accept their organization’s goals or the goals of the rating system (Murphy & Cleveland, 1995; Tziner, Murphy, & Cleveland, 2005). In the same vein, Danielson (2011) recommends that “everyone involved in the evaluation system should possess a shared understanding of the definition of good teaching” (p. 36). Of course, there is no universally agreed-upon definition of effective educator practice, but evaluation administrators need to make raters aware of the definition of effective practice embodied by their evaluation system and explain to evaluators how this definition connects with research, accepted state or national standards, or the performance goals of the school system.
Many studies have documented that observers’ personal or professional relationships to the people they are rating affects rating behavior. In the wider performance assessment literature, substantial evidence suggests that deliberate distortion of performance ratings is just as great a problem as unintentional error (Tziner, Murphy, & Cleveland, 2005). Numerous studies have concluded that supervisor ratings conducted for administrative purposes tend to be more lenient than ratings done for research or employee development purposes (Jawahar & Williams, 1997). In some cases, researchers have found that this occurred because superiors wanted to help their subordinates’ chances of receiving a pay raise or promotion (Murphy & Cleveland, 1995). Other organizational goals on the
part of the observer may also distort performance ratings (Wang et al., 2010). This suggests that for any given observation, the observer should be someone who has as little incentive as possible to pursue any objective other than accuracy.
An observer’s familiarity with the person he or she is evaluating also invites potential biases. A review by Bretz, Milkovich, and Read (1992) concludes that an observer’s prior expectations about a ratee’s performance can bias judgments. Schoorman (1988) found that supervisors who participated in the hiring of an employee tended to give higher ratings to employees that they had wanted to hire and lower ratings to employees whose hiring they had opposed. Research also indicates that evaluators are more lenient when they know they will have to justify those ratings in a face-to-face meeting with the ratee (Levy & Williams, 2004). Additionally, people who work together may develop friendships or animosities, which studies have shown to bias observers (Antonioni & Park, 2001; Kwan, 2009; Robbins & DeNisi, 1994). Tsui and Barry (1986) found higher rates of agreement among observers with similar feelings about the ratee and confirmed that observers with more positive or negative feelings toward a person reflect those feelings through their ratings. All of these findings point to the conclusion that observers who are less familiar with their ratees will be more likely to rate accurately.
Accountability for accurate ratingEven if administrators select a good group of evaluators, maintaining inter-rater agreement is an ongoing challenge. As mentioned earlier, inter-rater agreement is not an inherent property of an evaluation system, but only characterizes one set of ratings made by one set of evaluators. Raters’ interpretations of the rubric and the behavior they see, as well as their motivation to do a good job, can change. Thus, there is no guarantee that different
Measuring and Promoting Inter-Rater Agreement of Teacher and Principal Performance Ratings
18
raters will continue to rate consistently after they complete the initial training. Keeping ratings consistent requires constant attention from system administrators.
In order to ensure that the effects of training persist, it is important to re-train observers and monitor their performance. Studies have shown that even reliable raters may change their rating behavior over time (Congdon & McQueen, 2000; Englehard & Myford, 2003; Harik et al., 2009; McQueen & Congdon, 1997; Myford, & Wolfe, 2009; Rowan, Harrison, & Hayes, 2004). As a result of this finding, Lumley and McNamara (1995) and Johnson, Penny, and Gordon (2008) recommend against the practice of certifying raters and then assuming that evaluations using only one rater will produce consistent results. Instead, they suggest periodic re-calibrations and the use of multiple raters.6 The National Institute for Excellence in Teaching’s evaluation system, The System for Teacher and Student Advancement, takes this approach (Daley & Kim, 2010). Additionally, ongoing training has the potential to help raters improve. One study of CLASS found that in ongoing training sessions, observers improved their calibration with master scorers (Henry, Grimm, & Pianta, 2010).
Holding raters accountable for accurate rating is another potential way to improve agreement. Researchers have found that raters, even experienced ones, provide much lower quality data when they do not know that their performance is being monitored (Mero & Motowidlo, 1995; Romanczyk, Kent, Diament, & O’Leary, 1973; Weinrott & Jones, 1984). Johnson, Penny, and Gordon (2008) report that test raters are more attentive to requirements and score more closely to the rubric when they know their ratings are going to be monitored. These findings suggest that observers are more accurate when they feel accountable for their compliance with
the rubric. This could be accomplished by reviewing some of the raters’ scores on artifacts or classroom observations, possibly by randomly double-scoring videotaped observations or artifacts.
Unfortunately, placing a value on indices of inter-rater agreement or reliability also creates an incentive to falsely inflate those indices. Farley (2009) reported instances where standardized testing supervisors from nationally recognized organizations boosted inter-rater reliability by changing scores that disagreed, assigning inconsistent raters to essays that would not be included in the calculations, or by simply copying one another’s scores. Such practices obviously undermine the goal of creating a fair, accurate evaluation system, and designers should consider the issue of falsification to be a legitimate threat.
Rubric designThe consistency of observers’ ratings of educator performance can be influenced by the design of the evaluation rubric. The more difficult it is for observers to use a rubric, the less likely it is that they will apply it consistently. Designers should create evaluation rubrics with clear and differentiated descriptors and should test observer performance with those descriptors to identify which are problematic before the system is fully implemented or used for high-stakes decisions.
In general, an evaluation rubric should consist of a number of well-defined domains in which the educator is to be assessed. Within each domain, there should be several well-defined standards or performance points that each observer clearly understands. Dunbar, Koretz, and Hoover (1991) found that detailed information about score points and sample responses “dramatically reduce[s]” measurement errors (p. 291). One study boosted
6 These researchers focused on assessing student work, not educator performance, but the same principle applies.
Measuring and Promoting Inter-Rater Agreement of Teacher and Principal Performance Ratings

19
exact rater agreement from 45% to 70% by making descriptors available to observers (Capie, 1978). If descriptors are not clear, observers may not be able to make decisions based on the rubric. Lumley (2002) found that when evaluators are unable to decide between two score points, other extraneous factors often creep into their decision-making, such as over-weighting one factor, adjudicating based on factors not included in the rubric, or comparing the current subject with previously rated subjects. Gitomer (2008) describes a similar problem with descriptors that were eliminated from the National Board for Professional Teaching Standards (NBPTS). To ameliorate this problem, descriptors should be written to be as applicable as possible to the whole range of teaching activities to which the rubric may be applied. Some evaluation systems, including the NBPTS and the PACT, have different standards and rubrics for different subjects and grade levels to allow rubric language to reference specific practices rather than use more generic wording (Pecheone & Chung, 2006).
Some problems with descriptor wording may be avoided simply by using sufficiently detailed descriptors that clearly distinguish performance levels (Milanowski, Prince, & Koppich, 2007). In the past, some particularly error-prone rating scales have called for judgments without sufficient description of what observable evidence might entail (Nelsen & Ray, 1983). However, simply including a lot of detailed descriptors has the potential to confuse raters and make it hard to apply the rubric to the necessary range of situations. Early versions of the NBPTS, for example, contained too many references to specific behaviors, which rendered the rubric too inflexible (Wolfe & Gitomer, 2000).
Another potential problem is the overuse of ambiguous quantifiers like “occasionally” or “frequently,” which make it difficult for observers to develop a shared understanding of the standard
(Heneman & Milanowski, 2003). Porter (2010) concluded that high-error items in PACT were those with more complex wording, as well as items that assumed prior knowledge that not all observers possessed. To compensate for these problems, some have suggested the use of “low inference” measures that are readily observable and less subjective. Hoyt and Kerns (1999) found that “explicit attributes” like counting instances of a particular behavior have much lower error than “inferential attributes” that require more judgment (p. 420).
Even well-written descriptors must combine with training, as no description can eliminate all ambiguities or address all potential interpretations. According to Wolfe and Gitomer (2000), the NBPTS’s experience redesigning its evaluation system demonstrated that “rubrics and verbal descriptions are inherently limited” (p. 9) and that actual examples provide clarity that system administrators cannot match by merely explaining the standards. Observers in the pilot of Chicago’s Excellence in Teaching Project reported that video examples were extremely helpful to them in understanding the intent of the rubrics (Sartain, Stoelinga, & Brown, 2009).
Type of rubric scaleAn educator evaluation system’s rating scale can also affect inter-rater agreement. Designers of evaluation systems can choose between dichotomous scales with only two options per category (e.g., yes/no or a checklist), scales with several different score points, or even graphical scales that allow evaluators to mark any point along a continuum. Researchers have contended that one’s “true” level of competence is best measured by a continuum rather than being forced into a whole number––for example, if an evaluator believes that one educator’s true performance is a “2.4” and another’s a “2.6,” a whole number scale would force that evaluator to give a
Measuring and Promoting Inter-Rater Agreement of Teacher and Principal Performance Ratings

20
“2” and a “3,” which distorts their rating and could result in undue consequences for the nearly-as-good educator (Cronbach, Linn, Brennan, & Haertel, 1995). Some evaluations, like the NBPTS, allow raters to augment their whole number ratings with pluses or minuses (Wolfe & Gitomer, 2000). This rating augmentation expands the number of points on the rating scale without defining the intermediate levels of performance in behavioral terms. In turn, raters have greater flexibility to make more precise estimates of educator performance.
Rubric designers’ choice of rating scale can present a tradeoff between rater agreement and rater reliability. Rubrics designed to produce greater agreement may show lower reliability. For example, a yes/no checklist is likely produce high rates of agreement because ratings are often exactly the same. However, such a rating system could have lower reliability because the limited choices in a dichotomous rubric leave little room to compare the relative rank order of different categories, which is how inter-rater reliability is determined (see "Inter-Rater Reliability and Inter-Rater Agreement" page 5). By contrast, a rubric with more score points, e.g.1-7 ratings instead of 1-4, could improve reliability by allowing for more variation in ratings, but reduces the likelihood of exact agreement on a particular score. Studies have confirmed that wider rubric scales produce greater inter-rater reliability, but reduce rater agreement (Cook & Beckman, 2009; Penny, Johnson, & Gordon, 2000). When calculating agreement using multiple scale levels, as suggested above, it makes sense to use exact and adjacent agreement.
Rating scales with one or two levels (e.g., a checklist), may be appropriate for some applications, but research suggests that such scales may restrict evaluators’ choices to the detriment of accuracy. For example, the choice between two levels on a rubric can be difficult, even for raters who tend to agree
overall (e.g., Smith, 1993). Recall that observers often make difficult choices between two levels on a rubric scale by using extraneous factors (Lumley, 2002). Raters may also tend to give ratees the benefit of the doubt in hard-to-decide cases, leading to inflated ratings. Increasing the number of choices on the rating scale could keep evaluators more faithful to the rubric and limit rating inflation.
Evaluation systems with wider rating scales reduce the chances of exact inter-rater agreement, but designers may decide that increased precision and inter-rater reliability are worth the trade-off. Inter-rater agreement can still be measured when a wider scale is used. Indeed, the oft-used “within one scale point” standard for agreement holds evaluators to a higher standard of agreement when that one point is a relatively smaller difference on the scale.
In situations where acceptable inter-rater agreement is not achieved, system administrators can use certain procedures to adjudicate between discrepant scores. For example, the NBPTS augmented scale allows ratings between 1 and 4 with a plus or minus, creating 12 total score points. It treats each plus or minus as 0.25 of a point and uses an adjudication procedure for the small fraction of cases in which the difference is greater than 1.25 points (3.3% of cases between the 2002–03, 2003–04, and 2004–05 academic years) (Gitomer, 2008; Hakel, Koenig, & Elliott, 2008). Most states require some form of adjudication on standardized writing assessments when two evaluators disagree (Penny, Johnson, & Gordon, 2000). Possibilities for adjudicating differences between ratings include, but are not limited to, averaging the two scores, adding a third rater’s score to the average, using a third “expert” rater and averaging that person’s score with the closest original score, scrapping the original scores and allowing an expert to decide on a new score, or allowing the two original raters to discuss the score (Johnson, Penny, & Gordon, 2008). In cases where
Measuring and Promoting Inter-Rater Agreement of Teacher and Principal Performance Ratings
21
initial inter-rater agreement is insufficient or an educator’s score falls close to an important cutoff, adjudication procedures can greatly enhance an evaluation system’s accuracy.
Ultimately, the choice of scale should be based on the priorities and goals of the evaluation system in question. However, the body of research suggests that all else equal, a rubric with more possible rating levels can enhance the accuracy of scores, even if inter-rater agreement measures suffer as a result. As with any statistical indicator, results should be interpreted in context. If administrators decide on a 7-point scale or permit rating augmentation, they should adjust their expectations for agreement and reliability accordingly, for example, by calculating both exact and adjacent agreement.
Pilot programs and redesignPerhaps the most critical part of designing an educator evaluation system that produces high reliability and agreement is a careful design approach that identifies problems and improves upon initial trials. The lack of consistency between evaluators has been a major problem in the past (Danielson, 2011) in large part because educational performance assessments are often designed and implemented before important methodological issues are considered (Linn & Baker, 1996).
If given sufficient time to develop a fair observation instrument, designers can address problems before they implement the system. They can identify which items are problematic and rework the assessment to reflect those problems. The NBPTS was able to dramatically improve its reliability and agreement indices by modifying its training procedures to include more examples and more bias training, changing confusing components of its rubric, adding more guidance for teachers, and tweaking
its rating scale. Furthermore, these improvements came at an extremely low cost (Wolfe & Gitomer, 2000). Although Cincinnati’s evaluation system is no longer in place, the district improved the system after a pilot phase by revising its rubric to remove problematic descriptors. It also modified training to include more time and a greater focus on identifying sources of disagreement between observers (Heneman & Milanowski, 2003). Chicago’s Excellence in Teaching program used a pilot to identify areas where observers would benefit from additional training, and CLASS training has also identified areas where observers consistently stray from master-coded scores (Henry, Grimm, & Pianta, 2010; Sartain, Stoelinga, & Brown, 2009).
In addition to providing opportunities to improve the agreement and reliability of the system, a lengthier design period allows stakeholders to iron out disagreements and build trust. Zellman and Perlman (2008) recommend devoting significant time to pilot programs, noting that post-implementation changes in child care observation systems led to confusion and resentment among parents and educators in several states. Despite using a pilot program, Cincinnati’s teacher evaluation system left questions about how to score some observations unanswered, which harmed its credibility (Milanowski & Kimball, 2003). The Cincinnati system’s downfall appears to have been poor implementation––because of numerous changes made throughout the year, teachers found the implementation disorganized and confusing (Heneman & Milanowski, 2003). By making revisions based on pilot programs, designers can ensure the quality of an observation instrument before evaluators use it in the field, resulting in greater inter-rater agreement and smoother implementation.
Measuring and Promoting Inter-Rater Agreement of Teacher and Principal Performance Ratings

22
VII. Other Issues to Consider
Representativeness of observationsEducators will not be surprised by the finding that teacher behavior can vary a great deal from hour to hour or day to day (Henry, Grimm, & Pianta, 2010; Hiatt & Keesling, 1979). To ensure fairness to teachers, possible ways to reduce this variability during teacher observations include increasing the frequency of observations (possibly by using video recordings) or by giving educators control over when they are observed to allow everyone to put his/her best effort forward. An evaluation system’s method of ensuring that observations are sufficiently frequent and representative has implications for inter-rater agreement and inter-rater reliability. Hoyt and Kerns’ (1999) review found that observers who watch ratees at different times tend to have lower inter-rater agreement. Evaluation administrators should use caution if they choose to compute agreement or reliability for the results of observations made at different times.
Another concern raised in the literature deals with the length of observations. Henry, Grimm, and Pianta (2010) found that longer observation times had a negative, statistically significant relationship with the productivity and behavior management categories on the CLASS instrument. They conjecture that this relationship may be due to the fact that observers who watched for longer had more chances to observe misbehavior and unproductive transition times. This finding suggests that if observations are to be compared across time periods, inter-rater agreement and reliability will be higher if the observations are of similar length.
Videotaped observationsThe traditional method of classroom observation is live, but in recent decades, technology has made it possible to observe educators without ever entering the school. Videotaping observations has the potential to greatly increase efficiency and cost-effectiveness by cutting down on schedule conflicts and travel time, which could be especially valuable for teachers in remote or spread out areas (Fry, 2006), especially since videotaped samples are frequently used in rater training (Bakker, 2008; Clare, 2000; Henry, Grimm, & Pianta, 2010; Rose & Huynh, 1984). The NBPTS and other currently used teacher evaluation systems have demonstrated that high levels of agreement and reliability can be achieved using video samples (Gitomer, 2008). However, poorly implemented technology can present its own set of problems, and poor camera angles or sound quality could harm the observer’s ability to accurately assess a teacher.
Very little research has specifically compared inter-rater agreement or reliability across different media sources. By far the most relevant study, performed by Dymond and colleagues (2008), computed inter-observer agreement on a checklist used to assess special education teachers. They achieved an average 86% agreement between on-site raters and videotaped raters and found that most of the differences were due to differential interpretation of the rubric rather than the observation of different behaviors.
Measuring and Promoting Inter-Rater Agreement of Teacher and Principal Performance Ratings
23
Despite their promise as an efficiency-enhancing tool, technological means of increasing observational efficiency should not be used to pack as many observations as possible into short periods of time. Greater demands on memory and increased stress have been shown to affect observer accuracy and faithfulness to the scoring system (Bretz et al., 1992; Srinivas & Motowidlo, 1987). A study of Israeli parole boards provides a cautionary tale. The first candidate of the day and first candidate after lunch
were found to have about a 65% chance of receiving parole, while the last candidate of a given session had a near-zero chance (Danzinger, Levav, & Avnaim-Pesso, 2011). If technology is to be used to increase the efficiency of observations, designers should be conscious of these effects and test for them during trials. Avoiding the effects of mental taxation could include basic steps such as adequate breaks, natural light, or refreshments.
Measuring and Promoting Inter-Rater Agreement of Teacher and Principal Performance Ratings
24
Appendix 1: More on Intra-Class Correlations
As mentioned above, the intra-class correlation is a measure of the degree to which raters give similar ratings to each person or object rated.7 Several variations of the coefficient exist, but the one most likely to be used to measure inter-rater agreement is the version that accounts for differences in which level raters choose for each ratee, as well as differences in the ordering of ratees, and does not require that every ratee be rated by every rater. Technically, this version is based on a one-way random effects analysis of variance that estimates the variation in scores due to ratees (i.e., true differences in performance) and the variation due to errors, including rater disagreement (Shrout & Fleiss, 1979).
The easiest way to calculate the right version is to use a statistical package such as SPSSX, which includes this intra-class correlation as an option under the scale/reliability analysis menu. Using this option involves clicking on the “statistics” option, checking “intraclass correlation coefficient,” and choosing the one-way random model and the absolute agreement type. SPSSX will estimate two types of expected agreement:
a. the agreement between one rater and another single rater (labeled “Single Measure” in the output);
b. the agreement between the average of these raters’ ratings and the average of ratings by another, similar group of raters (labeled “Average Measures” in the output).
The single measure intraclass correlation shows the agreement among raters and thus how well an evaluation rating based on the ratings of one rater
is likely to agree with ratings by another rater. The average measures coefficient estimates agreement between averages of ratings and is meaningful only if evaluations average the ratings of two or more raters.
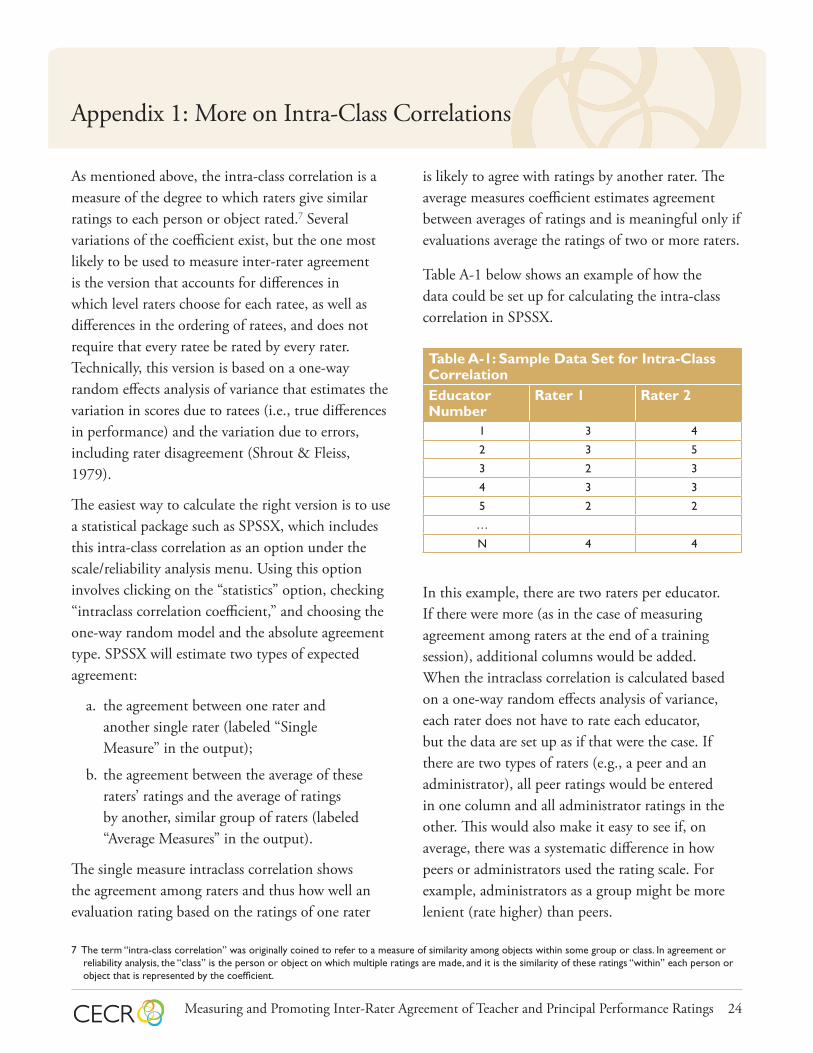
Table A-1 below shows an example of how the data could be set up for calculating the intra-class correlation in SPSSX.
Table A-1: Sample Data Set for Intra-Class CorrelationEducator Number
Rater 1 Rater 2
1 3 4
2 3 5
3 2 3
4 3 3
5 2 2
…
N 4 4
In this example, there are two raters per educator. If there were more (as in the case of measuring agreement among raters at the end of a training session), additional columns would be added. When the intraclass correlation is calculated based on a one-way random effects analysis of variance, each rater does not have to rate each educator, but the data are set up as if that were the case. If there are two types of raters (e.g., a peer and an administrator), all peer ratings would be entered in one column and all administrator ratings in the other. This would also make it easy to see if, on average, there was a systematic difference in how peers or administrators used the rating scale. For example, administrators as a group might be more lenient (rate higher) than peers.
7 The term “intra-class correlation” was originally coined to refer to a measure of similarity among objects within some group or class. In agreement or reliability analysis, the “class” is the person or object on which multiple ratings are made, and it is the similarity of these ratings “within” each person or object that is represented by the coefficient.
Measuring and Promoting Inter-Rater Agreement of Teacher and Principal Performance Ratings

25
Appendix 2: Frame-of-Reference Training Outline
1. Provide a process overview to give the observers the big picture.
•Purpose of observations.
•Frequency and length of observations.
•Use of pre- or postconferences, collection of artifacts.
•How results will be used.
• Feedback to person being evaluated.• Coaching/assistance for performance
improvement.• Goal setting.• Administrative consequences for good
and poor performance.
2. Explain the rating dimensions (standards of performance & rubrics).
•Review rubrics.
•Explain how rubrics are consistent with or represent organization’s vision of good practice.
•Discuss questions about concepts or wording.
3. Help raters identify and put aside their own biases.
•All observers bring beliefs about what good teaching looks like, which can influence what they see and how they evaluate it.
•Explain that observers need to be able to separate these beliefs from the observation, especially when observing a different style, level, or subject of practice.
•Have observers discuss their beliefs and implicit theories of practice.
•Ask them how their beliefs and implicit theories might influence how they record and evaluate evidence.
•Warn observers to be aware of potential biases and to focus on and rate using the specific definitions and explanations of the rating scale.
4. Explain common rater errors to be aware of and avoid.
•Similarity––rating influenced by how similar the observed classroom or school is to yours, how similar the practice observed is to yours, or how similar the person being observed is to you.
•Leniency––rating higher than deserved to give the person the “benefit of doubt.”
•Halo––rating on one dimension determined by rating on another.
•Central tendency––rating everyone in the middle; often due to “anchoring” on the middle level by assuming that everyone is average (or proficient) unless there is a lot of evidence he/she is not.
•Consistency/confirmation––looking for evidence for pre-judgment or a judgment based on one’s initial impression.
•Context effects––performance of peer group influences ratings.
Measuring and Promoting Inter-Rater Agreement of Teacher and Principal Performance Ratings

26
5. Describe the process for decision-making.
•Emphasize separating the observation (or other evidence collection) from the judgment about the level of practice (which is based on comparing the evidence to the rubric or rating scale).
•When taking notes, record what was observed in behavioral terms.
•Do not rate while observing.
•Review notes after finishing observation; highlight evidence that is relevant to each dimension.
•Compare performance observed to the rubric or rating scale, not to other performers.
•Respect the rubric over your gut feeling. (Don’t rely on “I know good teaching when I see it.”)
•Evaluate based only on the evidence collected: if no evidence, make no inference.
•Where evidence is mixed on whether observed performance meets the requirements for rubric level, base decisions on the predominance of evidence. If a substantial majority of the evidence supports rating at a specific level, choose that level rather than the level below.
•Avoid anchoring–– assuming the performance is satisfactory or proficient unless there is evidence to the contrary.
•Rate performance on each dimension or standard separately.
•Try not to compensate for a near miss on one dimension with a generous rating on another.
6. Have observers practice observing and recording evidence; discuss and provide feedback to observers.
7. Have observers practice connecting evidence recorded from the observation to performance dimensions.
•Discuss questions about what performance standards or dimensions cover.
•Review rubrics: what am I looking for?
•Review notes/artifacts and identify evidence related to rubric dimensions.
8. Have observers practice interpreting the rubrics.
•Identify the specific rubric language that differentiates between different performance levels.
•Discuss questions observers may have about the interpretation of rubric language.
•Review rating techniques and conventions (e.g., how a word like “consistently” is to be interpreted).
•Practice rating using videos, written scenarios, or live observations.
•Have observers share ratings, discuss reasons for ratings; trainer then provides feedback to observers on how well they are doing.
•Repeat for all rubric dimensions or standards.
Measuring and Promoting Inter-Rater Agreement of Teacher and Principal Performance Ratings

27
9. Rater training may be followed by a “certification exercise” in which evaluators must match the ratings of videos, observations, or artifacts done by expert jury in order to be allowed to do assessment in the field. Usually some threshold is set, such as 75% absolute agreement with the experts. Trainees who fail are retrained.
Even detailed rubrics, trained raters, and good evidence will not make performance assessment a completely objective process. Some professional judgment will always be called for in assessing performance in professional jobs.
The goal of rater training is not to eliminate professional judgment but to guide and focus it. This includes developing a shared mental model of good performance first among the observers and then among the educators being observed.
Measuring and Promoting Inter-Rater Agreement of Teacher and Principal Performance Ratings

28
References
Altman, D. (1991). Practical statistics for medical research (reprint 1999): Boca Raton, FL: CRC Press.
American Educational Research Association (AERA), American Psychological Association (APA), & National Council on
Measurement in Education (NCME). (1999). Standards for educational and psychological testing. Washington, DC: AERA.
Antonioni, D., & Park, H. (2001). The relationship between rater affect and three sources of 360-degree feedback ratings.
Journal of Management, 27, 479–495.
Bakker, N. (2008). Design and evaluation of video portfolios: Reliability, generalizability, and validity of an authentic performance assessment for teachers. Holland: Netherlands Organisation for Scientific Research.
Barrett, S. (2001). The impact of training on rater variability. International Education Journal, 2(1), 49–58.
Beesley, A. (2009, April). Measuring classroom assessment with a work sample. Denver, CO: Mid-Continent Research for
Education and Learning. http://www.eric.ed.gov/PDFS/ ED508465.pdf
Bretz, R. D., Milkovich, G. T., & Read, W. (1992). The current state of performance appraisal research and practice: Concerns,
directions, and implications. Journal of Management, 18, 321–352.
Capie, W. (1978, November). The objectivity of classroom observation scales. Paper presented at the Annual Meeting of the
Southeastern Association for the Education of Teachers of Science, New Orleans, LA.
Clare, L. (2000). Using teachers’ assignments as an indicator of classroom practice: CSE technical report. Los Angeles, CA: Center
for Research on Evaluation, Standards, and Student Testing.
Congdon, P. J., & McQueen, J. (2000). The stability of rater severity in large-scale assessment programs. Journal of Educational Measurement, 37(2), 163–178.
Cook, D. A., & Beckman, T. J. (2009). Does scale length matter? A comparison of nine- versus five-point rating scales for mini-
CEX. Advances in Health Sciences Education, 14, 655–684.
Cronbach, L. J., Linn, R.L., Brennan, R. L., & Haertel, E. (1995, Summer). Generalizability analysis for educational
assessments. Los Angeles, CA: UCLA’s Center for the Study of Evaluation & The National Center for Research on Evaluation,
Standards, and Student Testing. www.cse.ucla.edu/products/evaluation/cresst_ec1995_3.pdf
Daley, G., & Kim, L. (2010). A teacher evaluation system that works. Santa Monica, CA: National Institute for Excellence in
Teaching. http://www.tapsystem.org/publications/ wp_eval.pdf
Danielson, C. (2011). Evaluations that help teachers learn. Educational Leadership, 68(4), 35–40.
Danziger, S., Levav, J., & Avnaim-Pesso, L. (2011). Extraneous factors in judicial decisions. Proceedings of the National Academy of Sciences, 108(17), 6889–6892.
Measuring and Promoting Inter-Rater Agreement of Teacher and Principal Performance Ratings
29
Dunbar, S. B., Koretz, D. M., & Hoover, H. D. (1991). Quality control in the development and use of performance
assessments. Applied Measurement in Education, 4(4), 293–303.
Dymond, S. K., Renzaglia, A., Halle, J. W., Chadsey, J., & Bentz, J. L. (2008). An evaluation of videoconferencing as a
supportive technology for practicum supervision. Teacher Education and Special Education, 31(4), 243–256.
Englehard, G. Jr., & Myford, C. M. (2003). Monitoring faculty consultant performance in the advanced placement English
literature and composition program with a many-faceted Rasch model. College Board Research Report No. 2003-1. http://
professionals. collegeboard.com/profdownload/pdf/cbresearchreport20031_22204.pdf
Farley, T. (2009). Making the grades: My misadventures in the standardized testing industry. Sausalito, CA: PoliPoint Press.
Fleiss, J. L. (1981). Statistical methods for rates and proportions. 2nd ed. New York: John Wiley.
Fry, S. (2006). Promoting student teacher success in isolated and rural areas. In C. Crawford et al. (Eds.), Proceedings of Society for Information Technology & Teacher Education International Conference 2006 (pp. 2513-2518). Chesapeake, VA: Association
for the Advancement of Computing in Education.
Giota, J. (1995, September). ECERS as research instrument: Statistical analyses. Paper presented at the European Conference of
the Europe Early Childhood Education Research Association on the Quality of Early Childhood Education, Paris, France.
Gitomer, D. (2008). Reliability and NBPTS assessments. In L. Ingvarson & J. Hattie (Eds.), Assessing teachers for professional certification: The first decade of the National Board for Professional Teaching Standards. Bingley, UK: Emerald Group
Publishing.
Gorman, C. A. & Rentsch, J. R. (2009). Evaluating frame-of-reference rater training effectiveness using performance schema
accuracy. Journal of Applied Psychology, 94(5), 1336–1344.
Gwet, K. L. (2010). Handbook of inter-rater reliability: The definitive guide to measuring the extent of agreement among raters (2nd ed.). Gaithersburg, MD: Advanced Analytics LLC.
Hakel, M. D., Koenig, J. A., & Elliott, S. W. (2008). Assessing accomplished teaching: Advanced-level certification programs. Washington, DC: National Academies Press.
Harik, P., Clauser, B. E., Grabovsky, I., Nungester, R. J., Swanson, D., & Nandakumar, R. (2009). An examination of rater
drift within a generalizability theory framework. Journal of Educational Measurement, 46(1), 43–58.
Hartmann, D. P. (1977). Considerations in the choice of interobserver reliability measures. Journal of Applied Behavior Analysis, 10, 103–116.
Hays, R. D., & Reviki, D. A. (2005) Reliability and validity (including responsiveness). In P. M. Fayers &, R. D. Hays (eds).
Assessing quality of life in clinical trials: Methods and practice. NY: Oxford University Press.
Heneman, H. G., & Milanowski, A. T. (2003). Continuing assessment of teacher reactions to a standards-based teacher
evaluation system. Journal of Personnel Evaluation in Education, 17(2), 173–195.
Measuring and Promoting Inter-Rater Agreement of Teacher and Principal Performance Ratings
30
Henry, A. E., Grimm, K. J., & Pianta, R. C. (2010). Rater calibration when observational assessment occurs at large-scale: Degree of calibration and characteristics of raters associated with calibration. (Doctoral dissertation, University of Virginia). http://
proquest.umi.com/ pqdlink?Ver=1&Exp=08-31-2016&FMT=7&DID=2396570251&RQT= 309&attempt=1&cfc=1
Hiatt, D. B., & Keesling, J. W. (1979, April). The dependability of classroom observations. Paper presented at the Annual Meeting
of the American Educational Research Association, San Francisco, CA.
Hoyt, W. T., & Kerns, M. (1999). Magnitude and moderators of bias in observer ratings: A meta-analysis. Psychological Methods, 4, 403–424.
Jawahar, I. M., & Williams, C. R. (1997). Where all the children are above average: The performance appraisal purpose effect.
Personnel Psychology, 50, 905–925.
Johnson, R. L., Penny, J. A., & Gordon, B. (2008). Assessing performance. New York, NY: The Guilford Press.
Kozlowski, S. W. J., & Kirsch, M. P. (1987). The systematic distortion hypothesis, halo, and accuracy: An individual-level
analysis. Journal of Applied Psychology, 72(2), 252–261.
Kwan, S. O. (2009). Interpersonal affect and performance ratings in work teams (Doctoral dissertation, University of Hong
Kong). http://hub.hku.hk/bitstream/10722/57033/1/ FullText.pdf.
Landis, J. R., & Koch, G. G. (1977). A one way components of variance model for categorical data. Biometrics, 33, 671–679.
La Paro, K. M., Pianta, R. C., & Stuhlman, M. (2004). The classroom assessment scoring system: Findings from the
prekindergarten year. The Elementary School Journal, 104(5), 409–426.
Le Breton, J. M., & Sentor, J. L. (2008). Answers to 20 questions about interrater reliability and interrater agreement.
Organizational Research Methods, 11(4), 815–852.
Levy, P. E., & Williams, J. R. (2004). The social context of performance appraisal: A review and framework for the future. Journal of Management, 30(6), 881–905.
Linn, R. L., & Baker, E. L. (1996). Can performance-based student assessments be psychometrically sound? In J. B. Baron and D.
P. Wolf (Eds.), Performance-based student assessment: Challenges and possibilities, Ninety-fifth Yearbook of the National Society for the Study of Education. Chicago: University of Chicago Press.
Lumley, T. (2002). Assessment criteria in a large-scale writing test: What do they really mean to the raters? Language Testing, 19, 246–277.
Lumley, T., & McNamara, T. F. (1995). Rater characteristics and rater bias: Implications for training. Language Testing, 12, 54–72.
McGraw, K. O., & Wong, S. P. (1996). Forming inferences about some intraclass correlation coefficients. Psychological Methods, 1(1), 30–46.
McQueen, J., & Congdon, P. J. (1997, March). Rater severity in large-scale assessment: Is it invariant? Paper presented at the
Annual Meeting of the American Educational Research Association, Chicago, IL.
Measuring and Promoting Inter-Rater Agreement of Teacher and Principal Performance Ratings

31
Mero, N. P., & Motowidlo, S. J. (1995). Effects of rater accountability on the accuracy and the favorability of performance
ratings. Journal of Applied Psychology, 80(4), 517–524.
Milanowski, A., & Kimball, S. M. (2003, April). The framework-based teacher performance assessment systems in Cincinnati
and Washoe. Paper presented at the Annual Meeting of the American Educational Research Association, Chicago, IL.
Milanowski, A., Prince, C., & Koppich, J. (2007). Observations of teachers’ classroom performance. Washington, DC: U.S.
Department of Education, Office of Elementary and Secondary Education, Center for Educator Compensation Reform.
Murphy, K. R., & Cleveland, J. N. (1995). Understanding performance appraisal: Social, organizational, and goal-based perspectives. Thousand Oaks, CA: SAGE Publications.
Myford, C. M., & Wolfe, E. W. (2009). Monitoring rater performance over time: A framework for detecting differential accuracy
and differential scale use. Journal of Educational Measurement, 46(4), 371–389.
National Institute of Child Health and Human Development, Early Child Care Research Network. (2005). A day in
third grade: Classroom quality, teacher, and student behaviors. Elementary School Journal, 105(4), 377–394.
Nelsen, E. A. & Ray, W. J. (1983, August). Observational ratings of teaching performance: Dimensionality and stability. Paper
presented at the annual meeting of the American Psychological Association, Los Angeles, CA.
Nunnally, J. C., & Bernstein. I. H. (1994). Psychometric theory (3rd ed.). New York: McGraw-Hill.
Pecheone, R. L. & Chung, R. R. (2006). Evidence in teacher education: The performance assessment for California teachers
(PACT). Journal of Teacher Education, 57(1), 22–36.
Pecheone, R. L., & Chung Wei, R. R. (2007). Performance assessment for California teachers: Summary of validity and
reliability studies for the 2003-04 pilot year. Palo Alto, CA: Stanford University PACT Consortium.
Penny, J., Johnson, R. L., & Gordon, B. (2000). Using rating augmentation to expand the scale of an analytic rubric. The
Journal of Experimental Education, 68(3), 269–287.
Porter, J. M. (2010). Performance assessment for California teachers (PACT): An evaluation of inter-rater reliability. (Doctoral
dissertation, University of California-Davis).
Robbins, T. L., & DeNisi, A. S. (1994). A closer look at interpersonal affect as a distinct influence on cognitive processing in
performance evaluations. Journal of Applied Psychology, 79(3), 341–353.
Romanczyk, R. G., Kent, R. N., Diament, C., & O'Leary, K. D. (1973). Measuring the reliability of observational data:
A reactive process. Journal of Applied Behavior Analysis, 6(1), 175–184.
Rose, J. S., & Huynh, H. (1984, April). Technical issues in adopting the APT for district-wide teacher evaluation. Paper
presented at the Annual Meeting of the National Council on Measurement in Education, New Orleans, LA.
Rowan, B., Harrison, D., & Hayes, A. (2004). Using instructional logs to study mathematics curriculum and teaching in the
early grades. Elementary School Journal, 105(1), 103–127.
Measuring and Promoting Inter-Rater Agreement of Teacher and Principal Performance Ratings

32
Sartain, L., Stoelinga, S. R., & Brown, E. (2009). Evaluation of the Excellence in Teaching pilot: Year 1 report to the Joyce
Foundation. Chicago, IL: The Consortium on Chicago School Research at the University of Chicago. http://ccsr.uchicago.
edu/publications/ Teacher%20Eval%20Final.pdf. Cited with author’s permission.
Schleicher, D. J., Day, D. V., Bronston, T., Mayes, B. T., & Riggo, R. E (2002). A new frame for frame-of-reference training:
Enhancing the construct validity of assessment centers. Journal of Applied Psychology, 87(4), 735–746.
Schoorman, D. F. (1988). Escalation bias in performance appraisals: An unintended consequence of supervisor participation in
hiring decisions. Journal of Applied Psychology, 73(1), 58–62.
Shrout, P. E., & Fleiss, J. L. (1979). Intraclass correlations: Uses in assessing rater reliability. Psychological Bulletin, 86(2),
420–428.
Smith, W. (1993). Assessing the reliability and adequacy of using holistic scoring of essays as a college composition placement
technique. In M. M. Williamson & B. A. Hout (Eds.), Validating holistic scoring for writing assessment: Theoretical and empirical foundations. New York, NY: Hampton Press.
Smither, J. W., Barry, S. R., & Reilly, R. R. (1989). An investigation of the validity of expert true score estimates in appraisal
research. Journal of Applied Psychology, 74, 599–605.
Srinivas, S., & Motowidlo, S. J. (1987). Effects of raters' stress on the dispersion and favorability of performance ratings. Journal of Applied Psychology, 72(2), 247–251.
Stemler, S. E. (2004). A comparison of consensus, consistency, and measurement approaches to estimating interrater reliability.
Practical Assessment, Research & Evaluation, 9(4). http://pareonline.net/getvn.asp?v=9&n=4
Tinsley, H. E. A., & Weiss, D. J. (2000). Interrater reliability and agreement. In H. E. A. Tinsley & S. D. Brown (Eds.),
Handbook of applied multivariate statistics and mathematical modeling (pp. 95–124). New York: Academic Press.
Tsuai, A. S., & Barry, B. (1986, September). Interpersonal affect and rating errors. The Academy of Management Journal, 29(3),
586–599.
Tziner, A., Murphy, K. R., & Cleveland, J. N. (2005). Contextual and rater factors affecting rating behavior. Group & Organization Management, 30(1), 89–98.
Walker, M. E. (2007). Is test score reliability necessary? R&D Connections, Educational Testing Service. http://www.ets.org/
Media/Research/pdf/RD_Connections5.pdf
Wang, X. M., Wong, K. F. E., & Kwong, J. Y. Y. (2010). The roles of rater goals and ratee performance levels in the distortion of
performance ratings. Journal of Applied Psychology, 95(3), 546–561.
Watts, M. R. (2011 July). Analysis of teacher evaluation data. Unpublished manuscript, Hillsborough County Public Schools.
Retrieved via personal communication with author, August 25, 2011.
Weigle, S. C. (1998). Using FACETS to model rater training effects. Language Testing, 15, 263–287.
Weinrott, L., & Jones, B. (1984). Overt verses covert assessment of observer reliability. Child Development, 55, 1125–1137.
Measuring and Promoting Inter-Rater Agreement of Teacher and Principal Performance Ratings

33
Woehr, D. J., & Huffcutt, A. I. (1994). Rater training for performance appraisal: A quantitative review. Journal of Occupational and Organizational Psychology, 67, 189–205.
Wolfe, E. W., & Gitomer, D. H. (2000). The influence of changes in assessment design on the psychometric quality of scores. Princeton, NJ: Educational Testing Service.
Zellman, G. L., & Perlman, M. (2008). Child-care quality rating and improvement systems in five pioneer states. Santa Monica,
CA: The RAND Corporation. http://www.rand.org/ content/dam/rand/pubs/monographs/2008/RAND_MG795.pdf
34705.0212.83670507
Measuring and Promoting Inter-Rater Agreement of Teacher and Principal Performance Ratings