measuring aniseikonia using scattering filters … · measuring aniseikonia using scattering...
TRANSCRIPT

MEASURING ANISEIKONIA USING SCATTERING FILTERS TO SIMULATE CATARACT
By
JASON WILSON
RODERICK J. FULLARD, COMMITTEE CHAIR DAWN K. DECARLO
ROBERT P. RUTSTEIN
A THESIS Submitted to the graduate faculty of The University of Alabama at Birmingham,
in partial fulfillment of the requirements of the degree of Master of Science
BIRMINGHAM, ALABAMA
2011

Copyright by Jason Wilson
2011

iii
MEASURING ANISEIKONIA USING SCATTERING FILTERS TO SIMULATE CATARACT
JASON WILSON
DEPARTMENT OF VISION SCIENCE
ABSTRACT
The relationship between anisometropia and aniseikonia (ANK) is not well
understood. Ametropic cataract patients provide a unique opportunity to study this
relationship after undergoing emmetropizing lens extraction. Because light scatter may affect
ANK measurement in cataract patients, its effect should also be evaluated.
The Basic Aniseikonia Test (BAT) was evaluated using afocal size lenses to produce
specific changes in retinal height. Several light scattering devices were then evaluated to
determine which produced effects most similar to cataract. Contrast sensitivity and visual
acuity (VA) losses were measured with each device and compared to those reported in
cataract. After determining the most appropriate light scattering device, twenty healthy
patients with normal visual function were recruited to perform the BAT using the filters to
simulate cataract.
Cataract patients were recruited from Vision America and the University of Alabama
at Birmingham School of Optometry. Patients between 20 and 75 years of age with at least
20/80 VA in each eye, ≥ 2D ametropia, and normal binocular function were recruited.
Stereopsis and ANK were tested and each patient completed a symptom questionnaire.
ANK measurements using afocal size lenses indicated that the BAT underestimates
ANK, although the effect was minimal for vertical targets and darkened surroundings, as
previously reported. Based on VA and contrast sensitivity loss, Vistech scattering filters

iv
produced changes most similar to cataract. Results of the BAT using Vistech filters
demonstrated that a moderate cataract but not a mild cataract may affect the ANK
measurement.
ANK measurements on cataract patients indicated that those with ≥ 2 D ametropia in
each eye may suffer from induced ANK after the first cataract extraction. With upcoming
healthcare reform, unilateral cataract extraction may be covered, but not necessarily bilateral,
depending on patient VA in each eye. However, a questionnaire about symptoms at each visit
in the current study showed that visual comfort did not improve after unilateral, but did
improve after bilateral, cataract extraction. This indicates that quality of life should be better
in bilateral cataract patients only if both cataracts are removed. This is supported by the
findings of other studies.
Keywords: Aniseikonia, Anisometropia, Cataract, Ametropia

v
ACKNOWLEDGEMENTS
I sincerely thank Dr. Fullard for is dedication, guidance, and motivating nature
throughout this process. He has kept on track with this project throughout its entirety, and his
lightheartedness has keep my moral, as well as the moral of everyone else in the lab, up in
rough times.
I also want to thank Drs. Rutstein and DeCarlo. Dr. Rutstein for keeping the Vision
America project alive and kicking, and Dr. DeCarlo for encouraging me and giving very
helpful suggestions for the simulated cataract part of the study.
The staff at Vision America deserves special thanks for working around me as I recruited and
tested their patients. Drs. McCurdy, Batson, and Helton as well as Billie Lively and Joy at the
front desk have been an invaluable asset.
My parents, Larry and Jeannine, deserve so much credit that it cannot be put into
words. Their seemingly never ending faith in their son seems crazy at times, but it has help
me get through this. It will also continue to motivate through optometry school and beyond.
Finally, my sincerest thanks to my fiancé, Peggy. She has packed up her life and moved away
from home to be with me for this. There is nothing more I could ask of her. I thank her for
being there, listening to what I have to say even though she may not understand it, critiquing
presentations, and never flinching at the talk of the long journey to get where I want to be. I
am ever thankful that I will not have to do it alone.

vi
TABLE OF CONTENTS
Page
ABSTRACT ....................................................................................................................... iii ACKNOWLEDGMENTS .................................................................................................. v LIST OF TABLES ............................................................................................................. ix LIST OF FIGURES ............................................................................................................ x LIST OF ABBREVERATIONS ....................................................................................... xii CHAPTER
1 INTRODUCTION ...................................................................................................... 1
Anisometropia and Aniseikonia ................................................................................ 2 Causes of Aniseikonia ............................................................................................... 3 Symptoms of Aniseikonia ......................................................................................... 4 Measuring Aniseikonia ............................................................................................. 4 Vernier Alignment .................................................................................................... 6 Cataract and Aniseikonia .......................................................................................... 8 Other Factors affecting Aniseikonia ......................................................................... 9 Cataract Simulating Devices ................................................................................... 10 Bangerter Foils ................................................................................................... 10 Vistech Scattering Goggles ................................................................................ 10 Tiffen ProMist Black Filters .............................................................................. 10 Optical Defocusing Lenses ................................................................................ 11 Visual Acuity .......................................................................................................... 11 Contrast Sensitivity ................................................................................................. 12 2 AIMS AND RATIONALE ....................................................................................... 14
Null Hypothesis ....................................................................................................... 14 Alternative Hypothesis ............................................................................................ 14 Aims ........................................................................................................................ 14 Specific Aim 1.................................................................................................... 14 Specific Aim 2.................................................................................................... 15

vii
3 EXPERIMENTAL DESIGN ........................................................................................ 16
Validating the Basic Aniseikonia Test .................................................................... 16 Determining appropriate scattering device ............................................................. 16 Criteria for Selecting Study Participants ................................................................. 18 Simulated Cataract Participants ......................................................................... 18 Cataract Patients ................................................................................................. 19 Data Collection........................................................................................................ 19 Simulated Cataract Participants ......................................................................... 19 Cataract Patients ................................................................................................. 21 4 RESULTS ................................................................................................................. 25 Validating Basic Aniseikonia Test .......................................................................... 25 Vernier Alignment .................................................................................................. 28 Determining Appropriate Scattering Device for Subsequent Testing..................... 34 Bangerter Foils ................................................................................................... 34 Optical Defocus Lenses ..................................................................................... 37 Vistech Scattering Filters ................................................................................... 39 Tiffen ProMist Black Filters .............................................................................. 41 Final Selection of Simulated Cataract Filter ........................................................... 46 Simulation of Cataract using Vistech Filters .......................................................... 47 Cataract Patient Study: Specific Aim 2 ................................................................... 52 5 DISCUSSION ........................................................................................................... 63 Key Findings ........................................................................................................... 63 Validating Basic Aniseikonia Test .......................................................................... 63 Vernier Alignment .................................................................................................. 64 Simulated Cataract .................................................................................................. 65 Cataract Patients ...................................................................................................... 67 Correction of Refractive Error for Working Distance of BAT .......................... 68 Limitations and Possible Future Studies ................................................................ 71 Simulated Cataract ............................................................................................. 71 Cataract Patient Study ........................................................................................ 71 Future Studies .................................................................................................... 72 Conclusions ........................................................................................................ 73 LIST OF REFERENCES .................................................................................................. 75 APPENDICES .................................................................................................................. 79

viii
A. INSTITUTIONAL REVIEW BOARD LETTER .............................................. 79
B. CATARACT PATIENT DATA COLLECTION FORMS ................................ 80
C. CATARACT PATIENT DATA ......................................................................... 86

ix
LIST OF TABLES Table Page
1 Details of Scattering Devices ..................................................................................... 18
2 Expected ANK Results using BAT with Afocal Size Lenses .................................... 26
3 Preliminary MARS contrast sensitivity Results of all Filters .................................... 43
4a Preliminary Visual Acuity Results of all Filters ....................................................... 44
4b Preliminary Visual Acuity Results of all Filters ....................................................... 45 5 Comparative Effect of each Filter Type on ANK Measurement ............................... 47 6 VA Results using Snellen Chart for Participants Enrolled in Simulated Cataract Study ........................................................................................... 50 7 CS results using MARS Contrast Sensitivity Test for Participants Enrolled in Simulated Cataract Study ........................................................................ 51 8 Expected ANK Results using BAT on Cataract Patients ........................................... 53 9 ANK Means of Cataract Patients with Ametropia Type, Consistency to Prediction, and Predicted ANK due to SM ....................................... 58 10 Stereopsis Results of Cataract Patients ...................................................................... 59 11 Results of One Way ANOVA and t test on Cataract Patient Questionnaire Results ................................................................................................ 62

x
LIST OF FIGURES
Figure Page 1 Example of BAT Display ............................................................................................. 6
2 Example of Vernier Alignment Task Display .............................................................. 7
3 Spectacle Magnification Formula ................................................................................ 9
4 Formula used to Predict the Contribution of SM to ANK ...................................... 24
5 Normalized Preliminary BAT Results using Afocal Size Lenses in the Absence of
Defocusing or Scattering Devices .............................................................................. 27
6 Vernier Alignment Task Results with “No Filter” Versus Optical
Defocus Lenses .......................................................................................................... 29
7 Vernier Alignment Task Results with “No Filter” Versus Vistech Filters ................ 31
8 Vernier Alignment Task Results with “No Filter” Versus Tiffen
Pro Mist Black Filters 1,2,3,5, and 6.......................................................................... 32
8a Vernier Alignment Task Results with “No Filter” Versus Tiffen
Pro Mist Black Filters 1,2,3,5, and 6 with no Error Bars .......................................... 33
9 Normalized Preliminary BAT Results using Bangerter Foils .................................... 36
10 Normalized Preliminary BAT Results using Optical Defocusing Lenses ................. 38
11 Normalized Preliminary BAT Results using Vistech Scattering Filters .................... 40
12 Normalized Preliminary BAT Results using Tiffen Pro Mist Black Filters .............. 42
13 Normalized BAT ANK Results using Vistech Filters 1 and 2................................... 49

xi
14 BAT Measurements from Cataract Patients ............................................................... 54
15 Vision America cataract patient questionnaire results ............................................... 60

xii
LIST OF ABBREVIATIONS
ANK Aniseikonia ANOVA Analysis of Variance BAT Basic Aniseikonia Test CS Contrast Sensitivity D Diopter IOL Intraocular Lens LOGMAR Logarithmic Minimal Angle of Resolution OD Ocular Dexter OS Ocular Sinister OU Ocular Utirque RCT Repeatability Coefficient Test SD Standard Deviation SEM Standard Error of the Mean Sim K Simulated Keratometry SM Spectacle Magnification TPM Tiffen Pro Mist Black Filter UABSO University of Alabama at Birmingham School of Optometry VA Visual Acuity
1
CHAPTER 1
INTRODUCTION
The goals of this study are to determine whether or not light scattering affects
aniseikonia (ANK) measurement using the Basic Aniseikonia Test (BAT) and to better
understand the effects of emmetropizing cataract surgery on previously ametropic
patients. In particular, do symptoms of ANK develop after surgery in previously
asymptomatic patients? With upcoming healthcare reform that may affect the conditions
required to allow reimbursement of bilateral rather than unilateral cataract extraction,
there is a pressing need for a greater understanding of ANK to provide greater incentive
for clinical testing and treatment of this condition.
The relationship between anisometropia and ANK is not very well understood.
Ametropic patients undergoing non-simultaneous bilateral cataract surgery provide a
unique opportunity to study clinically induced ANK after patients have had the first
cataract extracted.
The original goal of this study was to look at previously anisometropic refractive
surgery patients to determine the effect of creating bilateral emmetropia (therefore
removing anisometropia) after bilateral surgery. Due to a receding economy and
refractive surgery not typically covered by insurance providers, it was not feasible to
obtain definitive data on such a group. Therefore, the effect of unilateral cataract surgery
on patients with at least 2D ametropia in each eye was instead investigated. The rationale

2
was that anisometropia would be induced after the first surgery and subsequently
eliminated if a second surgery was performed on the contralateral eye. An additional
consideration was the possibility that the aniseikonia measuring device itself could be
influenced by the light scattering effect of cataract – in particular unilateral cataract.
Given the relatively modest number of qualifying cataract patients, the study of light
scattering effects on the ANK measurement became the primary emphasis of this thesis.
Anisometropia and Aniseikonia
Anisometropia is the departure from emmetropia in which the two eyes have
ametropia of unequal magnitude. If a sufficient difference exists between the refractive
powers of the patient’s eyes, ANK may develop. ANK is a binocular condition in which
the left and right eyes perceive the same object as having different sizes (Rutstein and
Daum 1998). The visual cortex typically has problems fusing the separate images with a
size difference of 2% or greater. ANK exists in 1% to 3.5% of the population, and can
cause dizziness, headaches, amblyopia, reduction of stereopsis, and other impairments of
visual function (Jimenez et al. 2002). Although ANK is often diagnosed in conjunction
with anisometropia, one can have ANK without being diagnosed with anisometropia
because the relationship between anisometropia and ANK is very poorly understood, and
much more research will be required to better understand this relationship.
The original research on ANK occurred at Dartmouth Eye Institute in 1932 by
Adelbert Ames Jr. and Professor Charles Proctor, of the Department of Physics at
Dartmouth College, with the assistance of the Eastman Kodak Company. Although their
original study involving a camera model to simulate image formation and aberrations of

3
the human eye was not a success, it prompted a ten-year series of studies on the
physiologies of binocular anomalies. In 1940, Walter Lancaster became the head of the
Dartmouth Eye Institute and coined the term aniseikonia. After Ames completed his
research, Kenneth Ogle and his colleagues continued on, making the measurement and
correction of ANK the hallmark of the Dartmouth Eye Institute (Achiron et al. 1997).
Causes of Aniseikonia
ANK has many possible causes including: differences in ocular size, axial length,
refractive error, and retinal or neural distribution of ganglion cells and receptive fields
respectively. Retinotopic mapping allows the formation of images, and if one retina
developed in a different manner due to a larger eye or longer axial length, that image will
be perceived as being larger by the cortex. A long eye will produce a larger retinal image,
but a larger eye may have the receptors placed further apart making cortical receptive
fields larger and may counterbalance the larger retinal image. ANK is often associated
with oblique astigmatism as well as retinal diseases such as epiretinal membrane and
vitreomacular traction. Isometropic ANK is the condition in which one eye is larger than
the other, or has a different ganglion cell density, but both eyes have the same magnitude
of ametropia (Phillips, 1958).
Several other ocular parameters may contribute to ANK including axial length
differences between eyes, location of the crystalline lens (or intraocular lens (IOL)), and
corneal power. Light scattering produced by cataract may affect ANK as well.

4
Symptoms of Aniseikonia
The symptoms of ANK range from physical to optical to neurological. Most
patients with ANK experience asthenopia and headaches. Some have reported
photophobia, amblyopia, excessive tearing, and difficulty reading, along with a host of
other physiological manifestations. In about 10% of cases, patients report mobility
difficulties due to diplopia. Patients will also experience spatial distortions accompanied
by impaired stereoscopic depth perception. Keratometry gives insight into the origin of
anisometropia and the likelihood of ANK with the patient’s habitual correction. If a
patient’s corneal powers are sufficiently different anisometropia is present, it is likely that
the difference in refractive power is the primary cause of anisometropia. However, if
corneal powers are the same, axial length is more likely to be responsible for the
anisometropia (Bannon, 1954). Axial length measurement can confirm this. According to
Knapp’s Law, axial anisometropes should be corrected with spectacle lenses ideally
located at the anterior focus of the eye to produce equal corrected retinal image heights.
Measuring Aniseikonia
The Space Eikonometer (American Optical Corp., Southbane, MA) has for many
years been considered the gold standard in ANK testing. However, it does have its
shortcomings, in particular because it presents an exceptionally difficult visual challenge
for the patient. For this reason, the Space Eikonometer has fallen out of favor and has not
been in production for many decades. Significant training is required to become
accustomed to it, and even then it is heavily influenced by patient judgment (Antona et. al
2006, McCormack et. et al. 1992). Measurements are based on optics research in

5
stereopsis and single binocular vision (McCormack et al. 1992). The New ANK Test
(Handaya, Tokyo, Japan) is commercially available and better accepted by practitioners
than the Space Eikonometer but tends to underestimate the degree of ANK in the patient
(McCormack et. al 1992, Yoshida et. al. 1997). While other methods of ANK testing are
becoming available and more are being developed, the most appropriate ANK test
available appears to be the deWit Basic Aniseikonia Test (Optical Diagnostics,
Culemborg, The Netherlands). While it is easier to operate and offers more time-efficient
testing than the Space Eikonometer, it does tend to underestimate ANK in the vertical
meridian and is inconsistent in the horizontal meridian due to heterophoria. It is also
more accurate when used in a dim room to aid in eliminating peripheral fusion cues
(Fullard et al. 2007). This test uses a computer monitor set at a specific distance (77cm
for the configuration used in the study) to produce the appropriate visual angle of specific
targets. The targets are two vertically aligned semicircles, one red and one green, with a
strong fixation point and a yellow background as illustrated in Figure 1. The subject
wears special red/green anaglyph glasses so that the eyes are dissociated. The subject
then adjusts the size of the right (red) semicircle to match the size of the other. This
procedure is performed twice with the right semicircle starting 25% smaller than the left,
and then the right semicircle starting out 25% larger than the left. The average of these
two tests yields an ANK measurement. The selection of the deWit BAT is the best choice
given the options, but it is far from perfect. A series of evaluation tests were performed as
part of the current project.

6
Figure 1. Example of BAT Display.
Vernier Alignment
Part of the BAT task is a simultaneous vernier alignment between the upper and
lower edges of the semicircles to make sure that the subject is matching semicircle sizes
and not the top or bottom of one relative to the other. Vernier alignment is also a more
accurate gauge of acuity than a typical Snellen test because it is not affected by
differences in legibility of visual acuity (VA) chart letters. Vernier alignment
performance is related to cataract severity (Essock et al. 1984).The test consists of two
horizontal lines, one fixed and one variable, separated by a gap as shown in Figure 2. A
strong fixation point is included to prevent fusion. The participant must indicate whether
the variable horizontal line is aligned above or below the fixed horizontal line. Polarizing

7
the screen and using matching orthogonal polarizing glasses appeared in preliminary
testing to enhance vernier alignment reliability over red-green anaglyph glasses.
Figure 2. Vernier Alignment Task Display.
Using cataract patients may compromise the validity of the BAT due to the light
scattering effects of cataract. Based on discussion with binocular vision research experts
at The University of Alabama School of Optometry (UABSO), the question arose as to
whether the light scattering caused by cataract could affect the ability to resolve the edges
on the semicircles on the BAT. If so, this may influence the perceived retinal image
height of the light scatter-affected image, possibly making it appear larger. Due to
increased spread in the image, vernier alignment may also be impeded by the light
scattering effect. The patient may not be able to make an accurate judgment of the
potentially thicker appearing upper and lower edges of the semicircles due to the light
scattering caused by cataract.

8
Cataract and Aniseikonia
Cataract surgery presents a unique opportunity to study clinically induced ANK.
Even though these are not typical anisometropes, having one phakic and one
pseudophakic lens in a previously ≥2D bilateral ametrope produces a difference in
refractive power (induced refractive anisometropia) of acute onset. This does not leave
the visual system much time to adapt to the new conditions, or provide long term data
about the ANK. Emmetropizing cataract surgery is the most cost effective and commonly
performed surgery in the world. Cataract has been shown to improve visual function as
well as quality of life (Mangione et al. 1994). Nuclear and cortical cataracts are the most
common types of cataracts seen in clinic (Tan et al. 2006). With cataract surgery
becoming more commonplace, clinically induced ANK in anisometropes from unilateral
surgery or in ametropes in the period between the first and second surgery is inevitable.
The degree of ANK, as well as the plasticity of the patients’ visual system, varies
depending on the visual stimuli or visual task presented to the patient (Troutman, 1962).
The degree of ANK produced by unilateral emmetropizing cataract surgery needs
to be accurately determined due to healthcare reform. Bilateral cataract surgery may not
be insured if a sufficient quality of life is determined by healthcare regulators to be
accomplished by performing unilateral cataract surgery. This would leave the patient in
an anisometropic condition that may induce ANK. Based on literature reports, it appears
that unilateral pseudophakes have a higher incidence of ANK symptoms than bilateral
pseudophakes (Kramer et al 1999). Bilateral ametropic cataract patients could be utilized
in order to clinically induce ANK and measure it using the BAT.

9
Other Factors Affecting Aniseikonia
For patients wearing spectacles, performing the BAT is affected by the spectacle
magnification of their lenses. Spectacle magnification (SM) is calculated by using the
shape factor and power factor of the spectacle lens as shown in Figure 3. The shape factor
depends on the front surface power and the thickness of the lens while the power factor
depends on the back vertex power and the distance of the vertex to the cornea (Ogle
1972). The spectacle magnification of the cataract patients’ spectacles will be taken into
account.
Figure 3. Spectacle Magnification Formula. t is the thickness of the lens, n is the
refractive index of the material used, F1 is the base curve of the lens, d is the vertex
distance, and F’v is the lens back vertex power expressed as equivalent sphere.
Placement of the IOL inside the eye will affect the total refractive power.
According to the literature, IOLs in the anterior chamber produce more retinal image
magnification than IOLs placed in the posterior chamber. If IOL power does not produce
emmetropia and a residual spectacle correction is required, each diopter of spectacle
overcorrection at a vertex distance of 12 mm causes 2% retinal image magnification (plus
lenses) or minification (minus lenses) (Atebera et al. 2009). IOLs intrinsically produce a
1
1 11
1 V
spec lens
Spectacle Magnificationd Ft F
n
= ×′−
− ×

10
change in retinal image magnification relative to the crystalline lens that can be a
confounder in ANK measurement.
Cataract Simulating Devices
Bangerter Foils
Bangerter foils are plastic devices with embedded microbubbles of varying
densities. They have been available since the 1960’s and are typically used to treat
amblyopia by reducing retinal image quality in the unaffected eye to a predicted level.
Different Bangerter foils should produce different degrees of light scatter. However,
studies have shown that the rated VA loss caused by the foils is inaccurate (Perez et al.
2010).
Vistech Scattering Goggles
Scattering goggles produced by Vistech Inc. now Stereo Optical are used to
illustrate to the family of a cataract patient how the affected person sees through the
cataracts. They have also been used in prior studies to simulate the light scattering effects
of cataract. These goggles can be combined on top of each other to increase the image
degradation. The goggles have shown to simulate the angular light distribution of cataract
(Elliot et al. 1996).
Tiffen ProMist Black Filters
Tiffen ProMist Black (TPM) filters 1, 2, and 3 are camera filters that are used in
photography to produce a hazy appearance. These filters can also be combined by

11
screwing them together to increase their density. According to reports, these filters
provide a representation of early and mid level cataracts as they cause glare effects
analogous to these conditions (DeWit, et al. 2006).
Optical Defocusing Lenses
Optical defocusing lenses are simple plus sphere lenses out of a trial frame set.
They are not a source of light scatter per se, but are included to allow comparison of the
effects of light scatter and defocus on the ANK measurement. PERG (Pattern
Electroretinogram) studies comparing the impact of both optical defocus of +1.75
through +5.00D and light scattering transparencies indicated that the two scattering
methods cause different effects on the retina (Bach and Matheau, 2004).
Visual Acuity
Visual acuity loss is associated with cataract, although it does not always give the
full picture of how the patient’s vision is affected (Chylack et al. 1993). Snellen VA
typically measures visual acuity loss. However, a plethora of ocular diseases affect the
transparency of the ocular media and retina. Intraocular light scatter can decrease VA. A
simple VA measurement is therefore inadequate due to incomplete assessment of visual
function. A patient can have reasonable VA and severely reduced contrast sensitivity
(CS) that will not show up on a standard Snellen acuity test.

12
Contrast Sensitivity
Increasing severity in all types of cataract has been associated with decreasing VA
and CS (Maraini et al. 1994). It has been found that contrast sensitivity measurement in
both high and low spatial frequencies does provide more information about vision loss
due to diabetic cataract than visual acuity measurement alone (Chylack et al. 1993).
Contrast sensitivity is sometimes clinically used in quantifying vision loss resulting from
cataract (Guyton and Rubin, 1990) as well as a host of other ocular diseases. In early
cataract, CS is not affected as much in the lower spatial frequencies. In previous studies,
the Pelli-Robson test has been used (Klein et al. 2003) due to its ease of administration
and repeatability (Rubin et al. 1997). The Lighthouse Letter Contrast Sensitivity Test,
later named the MARS Letter Contrast Sensitivity Test, was chosen due to its portability
over the Pelli-Robson test as well as the increased accuracy. Contrast sensitivity is
associated with decreased ambulatory mobility (Marron and Baily, 1982), driving
performance (Wood and Troutbeck, 1995), facial recognition, and daily tasks (West et. al
2002). All of these tasks operate in the lower special frequency range (Dougherty et al.
2005). The test operates in the low spatial frequencies at 0.5m, around 1.25 cycles/degree
or 20/480 visual acuity. The BAT also operates in the lower spatial frequency range. The
test uses the same Sloan letter set as the Pelli-Robson test, but decreases contrast
sensitivity by each letter as opposed to each trio of letters in the Pelli-Robson test. Also,
the Mars test includes three tests of the same contrast sensitivity but with different letters.
The Mars test measures 23x35.5 cm and is printed on rigid plastic. It has a white
background and black letters similar to a Snellen chart. It has 48 letters that are 1.75 cm
high in 8 rows of 6 letters each. The advertised contrast varies from 91% (-0.04 log units)

13
to 1.2% (-1.92 log units). Each letter subtends 2 degrees at the testing distance of 0.5m
(Dougherty et al. 2005).

14
CHAPTER 2
AIMS AND RATIONALE
Null Hypothesis
Light scattering does not affect ANK measurement using the BAT in normal
subjects using an appropriate scattering device to simulate different degrees of cataracts.
ANK is not induced by emmetropizing cataract surgery in asymptomatic patients with 2
D or greater presurgical ametropia following initial cataract extraction. Subsequent
removal of the contralateral cataract will also produce no change in symptoms of ANK.
Alternative Hypothesis
Light scattering does affect ANK measurement using the BAT in normal subjects
using an appropriate scattering device to simulate different degrees of cataracts.
Aniseikonia is induced by emmetropizing cataract surgery in asymptomatic patients with
2 D or greater presurgical ametropia following initial cataract extraction. Subsequent
removal of the contralateral cataract will return ANK measurements to baseline.
Aims
Specific Aim 1
Validate the Basic Aniseikonia Test using a group of normal participants and
afocal size lenses to induce size difference between each eye. Determine the appropriate

15
device to accurately simulate cataracts by comparing visual acuity and contrast sensitivity
loss of different scattering filters. Then, the potential influence of cataract-induced light
scatter on perceived retinal image height and therefore ANK will be measured. This will
be accomplished by performing the BAT on a group of normal participants wearing an
appropriate scattering device simulating different degrees of cataracts.
Specific Aim 2
Measure ANK in >2D ametropic cataract patients prior to cataract extraction and
after each cataract is removed and replaced with an emmetropizing intraocular lens,
based on surgeries spaced at least 3 weeks apart.
The changes in light scattering due to lens removal may influence ANK
measurements. The data from Aim 1 will address the influence of light scatter. The
amount of induced ANK from the difference in overall refractive power between
ametropic and emmetropic eyes can then be determined. Factors influencing the changes
included removal of the spectacle lens SM and the potential magnification change
induced by the IOL. This will be used to predict the degree of ANK induced by
emmetropizing surgery and how anisometropia relates to ANK. This may be useful to
predict the effect of emmetropizing cataract surgery on previously anisometropic patients
and could eventually be applied to correct ANK in moderate to high isometropes who
will only obtain unilateral cataract surgery. Determination of the effect of unilateral
cataract extraction on quality of life is important for another reason. If healthcare
providers restrict coverage of second cataract extractions based only on presurgical VA,
this may adversely affect the patient’s quality of life.

16
CHAPTER 3
EXPERIMENTAL DESIGN
Validating the Basic Aniseikonia Test
A group of six participants was used to validate the BAT. This was accomplished
by performing the BAT with just the red/green filters as well as placing afocal size lenses
in front of each eye. Afocal size lenses enlarge an objects size by a determined
percentage without altering refractive error. The afocal size lenses that were used are
+1%, +2%, and +3.5%. The BAT, which was presented on a Dell 2405fpw monitor, was
set at 77cm from the participants, and the left and right arrows of the keyboard adjusted
the size of the right semicircle. The participants’ ANK mean with no size lens present
was used to normalize their size lens data. All subsequent simulated cataract ANK tests
were performed with the Dell 2405 fpw monitor. With an image height of 11cm and a
viewing distance of 77cm, the image subtends 8.1 degrees of the retina. The ANK
measurements were analyzed using linear regression.
Determining Appropriate Scattering Device
Scattering devices were tested for their ability to simulate cataract. They were
also evaluated with the BAT to ensure that ANK testing was possible. Four different
scattering devices were tested. These devices are listed in Table 1. Vistech filters became
available only after testing on the first two devices was completed. Tiffen ProMist filters

17
were available at a later date again. This meant that three separate test sessions were
required to complete this part of the study.
Six participants were used to evaluate each cataract simulator. The BAT was set
at a 77cm test distance, and the left and right keyboard arrows were used to adjust the
size of the right semicircle. To determine if each participant attained sufficient
repeatability on the BAT, the Repeatability Coefficient Test (RCT) was applied. The
mean and standard deviation(SD) of the 14 BAT measurements were taken, and the
standard deviation multiplied by 2.77. This was the subject’s repeatability coefficient.
The difference between consecutive measurements was then evaluated. To reach
appropriate repeatability required a difference between consecutive measurements less
than the repeatability coefficient (Weiss et al. 2010).
Each scattering device was tested using the following procedure. The scattering
device was placed in front of one eye and the BAT measurement repeated 14 times. The
device was then placed in front of the contralateral eye and 14 further measurements
taken. This process was repeated for each grade of scattering device (e.g. 0.3, 0.4 and 0.6
LogMAR Bangerter foils). VA was measured using a Snellen chart and contrast
sensitivity using a MARS contrast sensitivity test. The outcomes of these tests were
used to determine which scattering device most closely simulated visual performance
losses caused by cataracts. All simulated cataract ANK measurements were analyzed
using one way ANOVA and Tukey’s test (normal distribution of Kruskal-Wallis if not
normal). Post-hoc tests were applied only if there were significant differences among
group mean values.

18
Details of Scattering Devices
Table 1.
Details of Scattering Devices
Scattering Device Source Grades Bangerter Foil Ryser Ophthalmologie, St.
Gallen, Switzerland 0.3, 0.4, 0.6 LogMAR*
Optical Defocusing Lenses
Oculus, Wetzlar, Germany +0.50 D, +1.00 D
Vistech Scattering Filters
Stereo Optical, Chicago, IL 1, 2, 3, and 4 filters
Tiffen ProMist Black Filters
Tiffen, New York, NY 1, 2, 3, 5 (filters 2 and 3 combined), and 6 (filters 1, 2 and 3 combined)
*LogMAR = Logarithm of the minimum angle of resolution
Criteria for Selecting Study Patients
Simulated Cataract Participants
Participants were recruited using flyers placed in the UABSO, Worrell Building,
and Shelby Biomedical Sciences Building. Normal binocular vision was required
because heterophoria was shown in preliminary testing to cause inconsistent ANK
measurements. An age range of 20 to 30 years was required to lessen the chance of
ocular media opacities. Slit Lamp examination verification of clear media ensured that
the only sources of light scattering were the simulating devices.

19
Cataract Patients
Patients were selected from Vision America in Birmingham as well as the
UABSO Eye Clinic. Patients were eligible for the study if they were between 20 and 75
years of age. In addition, these patients had 20/80 or better VA in the worse eye. To be
included, patients were required to have at least 2 D ametropia in each eye and normal
binocular vision. Study forms are located in Appendix B.
Data Collection
Simulated Cataract Participants
Qualified patients underwent:
• Slit lamp exam
• Visual Acuity using a Snellen chart (OS, OD, OU)
• Cover test at distance and near
• Contrast Sensitivity using MARS test (OS, OD, OU)
The MARS test was performed in the recommended fashion by setting the test 0.5
m from the participant, and then allowing patients to read left to right. The test was
concluded when the participant responded with two incorrect answers in a row. The test
was performed monocularly and binocularly with no filter present and with Vistech 1 and
2 in front of each eye.
Demonstration of satisfactory repeatability on the BAT was a requirement to
participate in the simulated cataract study. The BAT was set at 77cm from the
participants, and the left and right arrows of the keyboard adjusted the size of the right
semicircle. This was determined by performing the BAT 21 times with no scattering

20
device. The RCT was used on this data to determine repeatability. To determine if the
ANK measurement is altered by the scattering produced by simulated cataract, the
following procedure was used. A Vistech filter was placed in front of one eye,
alternating between OD first and OS first for sequential subjects and BAT testing was
conducted. This process was repeated with each Vistech filter in front of each eye.
Some subjects also performed the vernier alignment test. It has been postulated
that is a similar task as aligning the top and bottom edges of the two semicircles in the
BAT. Vernier alignment was tested by having participants indicate if one variable
horizontal line was above or below a fixed horizontal line on a computer screen using the
up and down arrows on a Bluetooth keyboard. A Bluetooth keyboard was necessary due
to the testing distance. The test was forced choice as the participants could not indicate if
the lines were aligned. A fixation point was included to aid in preventing fusion. The
participants wore TechSpec Linear polarizing laminated film orthogonally with matching
orthogonal polarizing film attached to the screen so only one horizontal line could be
seen with each eye. Initially, the horizontal lines were 75x2 pixels, but unavoidable
fusion into stereo occurred. The lines had to be increased to 150x2 pixels to perform the
task. All scattering devices were tested in front of the left eye, and the test was performed
on a Sony Trinitron Multiscan G400 monitor. A cathode ray tube monitor was necessary
to produce polarizable light. The testing distance was 5m, and the distance from the
bottom edge of the maximum upward displacement of the variable horizontal line and the
top edge of the maximum downward displacement of the variable horizontal line was 3
mm. The angle subtended by the upper and lower edge of the most positive and most
negative position respectively is 0.03 degrees. This test was repeated 55 times per eye

21
with each degree of scattering device. Only the vertical meridian was tested in both the
ANK and Vernier alignment studies. The resulting data expressed as a percentage correct
for each possible offset position was analyzed by comparing the “No Filter” condition to
each filter type’s offset using one way ANOVA and Tukey’s test (normal distribution of
Kruskal-Wallis if not normal): post-hoc applied only if significant difference indicated
among groups based on between group mean values.
Cataract Patients
Vision America cataract patients were approached during their presurgical
consultation and the purpose of the study was explained to them. UABSO clinic patients
were usually contacted the Friday before their presurgical consult. If the patient agreed to
the study, the following tests were performed by Vision America Staff:
• Refraction
• Visual Acuity using a Snellen chart
• Alternate prism cover test at distance and near
• Axial Length
• Corneal topography with stimulated keratometry
• Measurement of spectacle parameters
o Spectacle prescription
The principal investigator then conducted the following series of tests:
• Measurement of spectacle parameters
o Base curve
o Type of material for refractive index

22
o Normal vertex distance using a Pupillary Distance ruler
o Central lens thickness
• Stereopsis using a Randot stereopsis test
• BAT
• Questionnaire
The measurement of spectacle parameters is important in determining the amount
of spectacle magnification the patient experiences. Increasing the base curve, refractive
index, and central thickness increases the magnification. If vertex distance is increased
with a plus lens (or decreased vertex distance with a minus lens), spectacle magnification
is increased. If refractive index is increased, spectacle magnification is decreased. The
serial numbers of the implanted lenses as well as the power were recorded.
The cataract patient questionnaire consisted of 10 visual symptoms that the
patient might experience if ANK was present. Then patient indicated the severity of each
symptom as a number ranging from one to five with one being never and five being
always. The symptoms are those most commonly reported in a prior study of 500
aniseikonic patients (Bannon and Triller, 1944). The same questionnaire was given at
each visit and is located in Appendix B.
The BAT viewing distance was set at 77cm on an identical monitor to the one
used for the simulated cataract study (Dell 2405fpw), and the left and right arrows of the
keyboard adjusted the size of the right semicircle. Additional lenses were not used to
correct for the working distance due to concerns about the change in spectacle
magnification and reduced field of view. The subjects were trained on the BAT before
data collection began. This consisted of the patient simply becoming familiar with the

23
format and what is expected of them. The patients performed the test with their habitual
correction. The BAT test was repeated 10 times. Before the test, each patient was
reminded to examine the top and bottom edges of the semicircles to ensure that they are
properly aligned and stationary. The initial measurements provided a baseline with which
to correlate data. Most patients undergo bilateral cataract surgery. Therefore, two
postoperative tests were performed in which the subject had to return to Vision America
or the UABSO. These visits typically took place at the 30 day post op or the evaluation
for the second cataract extraction. For the first postoperative visit, patients wore their
habitual visual correction in front of the unoperated eye and a Halberg clip with their
current over-correction if their equivalent sphere was ≥ 0.50D when performing the BAT.
Patients were not corrected in the operated eye if their equivalent sphere was <0.50D.
Patients wore a Halberg clip with their current correction if their equivalent sphere was ≥
0.50D as well as a +2.50D add when testing stereopsis. ANK measurements from the
cataract patients were analyzed using one way ANOVA on parametric data, and Kruskal-
Wallis One Way ANOVA with Tukey Test on nonparametric data. During these visits,
Vision America staff performed the following tests:
• Refraction
• Visual Acuity
• Alternate prism cover test at distance and near
Then, the principal investigator conducted the following tests:
• Stereopsis
• BAT
• Questionnaire

24
These visits occurred within one month plus or minus one week of each surgery. Data
collected at each visit is listed in Appendix C.
Figure 4 illustrates the formula used to predict the contribution of spectacle
magnification to ANK. Using the spectacle magnification calculated based on the
spectacle parameters, an estimate of the contribution of SM to ANK was determined. The
ANK value recorded prior to the first surgery was divided by the SM of the operated eye
for an estimated ANK measurement for post surgery 1. Multiplying the estimated ANK
measurement for post surgery 1 by the SM of the contralateral lens produced an
estimation of the ANK post surgery 2.
11 Presurgery ANK MeasurementPredicted ANK PostsurgerySM of unoperated eye
=
2 * SM of spectacle lens from second operated eyePredicted ANK Postsurgery Presurgery ANK MeasurementSM of spectacle lens from first operated eye
=
Figure 4. Formula used to Predict the Contribution of SM to ANK.
25
CHAPTER 4
RESULTS
Validating the Basic Aniseikonia Test
A baseline measurement with no size lenses was obtained from each subject. The
baseline measurements were used to normalize each participant’s data. This method was
used for all simulated cataract BAT tests. Results expected based only on afocal size lens
magnification are listed in Table 2.
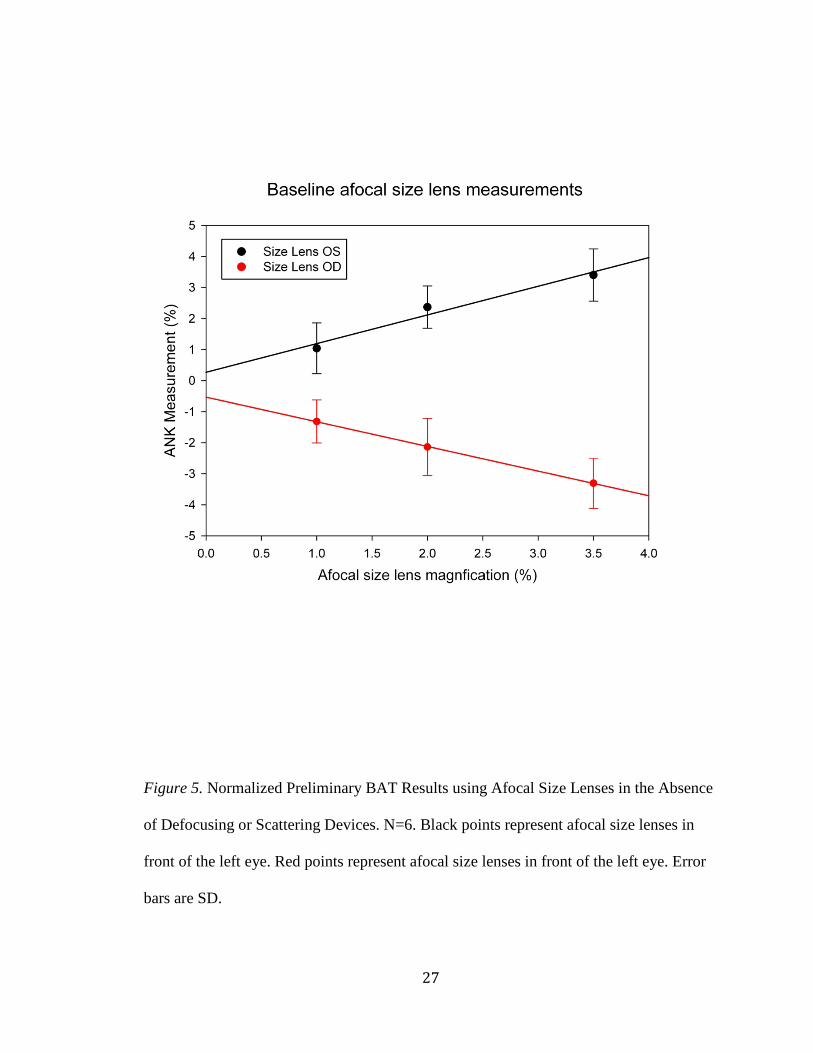
Actual results are graphed in Figure 5. Rank Sum Tests on the +1% OS and +1%
OD size lens ANK measurement results showed a significant difference (P<0.001). A
similar significant difference (p<0.001) was found with the +3.5% OD and +3.5% OS
size lens ANK measurements. Because the data was normal for the +2% OD and +2%
OS size lens ANK measurement results, a student’s t test was used. The +2% OD and
+2% OS size lens ANK results differed significantly (p <0.001, Power = 1.00). These
results indicate a significant difference in ANK measurement when the afocal size lenses
are moved from one eye to the other. This is consistent with the fact that unilateral size
lenses change retinal image height in one eye. Absolute differences in retinal image
height were smaller on average than the value expected based on size lens magnification.
The underestimation was similar for size lens in front of OD and size lens in front of OS.
This was consistent with literature reports (Fullard et al, 2007) that the BAT tends to
underestimate ANK.

26
Table 2.
Expected ANK Results using BAT with Afocal Size Lenses.
Eye with lens Retinal Image Change ANK Measurement
OS ↑ Positive OD ↑ Negative
The correlation between afocal size lens magnification and change from baseline
ANK was measured by linear regression analysis. For the three size lenses placed in
front of the left eye, a slope of 0.924 for ANK versus size lens magnification was
obtained (R = 0.765, R2 = 0.585, p<0.001). For the size lenses placed in front of the right
eye a slope of −0.795 for ANK versus size lens magnification was obtained (R = 0.711,
R2 = 0.505, p<0.001).
27
Figure 5. Normalized Preliminary BAT Results using Afocal Size Lenses in the Absence
of Defocusing or Scattering Devices. N=6. Black points represent afocal size lenses in
front of the left eye. Red points represent afocal size lenses in front of the left eye. Error
bars are SD.

28
Vernier Alignment
During the test, it was difficult for the participant to retain dissociated images and
required continued attention to the fixation point. Red-green glasses were therefore tried
as a potential replacement for orthogonal plane polarizers and the colors of the horizontal
lines were changed to match in an attempt to make the task easier on the participant.
However, the screen would not produce the necessary wavelengths of light and the colors
bled through allowing both lines to be seen by one eye. For these reasons, the orthogonal
polarizers were used for all subsequent vernier alignment tests. The line width was
increased from 75 to 150 pixels, and vernier alignment tests were possible using the
+0.50 D and +1.00 D defocusing lenses (Figure 6), Tiffen Pro Mist Black filters
1,2,3,5(TPM 2 and 3 combined),and 6 (TPM 1,2, and 3 combined) ( Figure 7), and
Vistech 1 and 2 (Figure 8 and 8a). Vistech 3 and 4 filters as well as the Bangerter foils
still caused unavoidable fusion even with the 150 pixel line width making them unusable,
and while the test proved challenging for participants, there was no significant difference
between the participants’ data in the absence of any devices and all devices tested.

29
Figure 6. Vernier alignment Task Results with “No Filter” Versus Defocusing
Lenses. N=6. Results are expressed as a percent correct for each position the variable
horizontal line was presented. The defocus lenses did not significantly alter the
percentage of correct indications at each offset position. There were no correct answers
for 0 offset because it is a forced choice test. Error Bars are Standard Error of the Mean
(SEM).

30
Figure 6 illustrates the vernier alignment task results comparing the “No filter”
condition to the optical defocusing lenses. Performing ANOVA and Tukey’s test (normal
distribution, or Kruskal-Wallis test if not normal) on the percent correct at offset position
with the “No Filter” condition and defocusing lenses did not reveal any significant
differences. However, at position −1 (one position lower than 0), a p value of 0.065 was
found, indicating that it was close to being significant. A similar result was found at
position 2 (p=0.092). The powers (P) for ANOVA tests on vernier alignment results for
all positions with normal data were very low (P ≤0.385, 95% confidence interval).
Figure 7 shows the vernier alignment task results with no filter versus Vistech
filters 1 and 2. There is no marked difference in vernier alignment accuracy between the
“No Filter” condition and each Vistech filter. ANOVA and Tukey’s test were used
(normal distribution of Kruskal-Wallis if not normal). Post-hoc tests were applied only
when a significant difference among groups was indicated by ANOVA (based on
between group mean values). For the data that was normal, statistical power was very low
(P ≤0.364, 95% confidence interval), and as for defocusing lenses, the positions that
showed differences closest to being significant were −1 (p=0.078) and +2 (p=0.071). The
reason for this is unclear.

31
Figure 7. Vernier Alignment Task Results with “No Filter” Versus Vistech
Filters. N=6. Vistech filters 1 and 2 were tested. Results are expressed as a percent
correct for each position the variable horizontal line was presented. There were no
significant differences between the percentage correct at each vernier line position with
no filter and with each filter in place. There were no correct answers for 0 offset because
it is a forced choice test. Error Bars are SEM.

32
Figure 8. Vernier Alignment Task Results with “No Filter” Versus Tiffen Pro Mist
Black Filters 1,2,3,5 (TPM 2 and 3 combined), and 6 (TPM 1,2, and 3 combined). N=6.
Results are expressed as a percent correct for each position the variable horizontal line
was presented. There were no correct answers for 0 offset because it is a forced choice
test. Error bars indicate SEM.

33
Figure 8a. Vernier alignment task with Tiffen Pro Mist Black Filters in front of OS
with no Error Bars.

34
Figure 8 shows the vernier alignment task results with the Tiffen Pro Mist Black
1,2,3,5, and 6 filters relative to “No Filter.” The data is reillustrated in Figure 8a with no
error bars. The Tiffen Pro Mist Black filters also do not show any difference in the
percentage of correct choices of vernier offset line direction (above or below) as the filter
density is increased. ANOVA and Tukey’s test were used to determine significance
(normal distribution, or Kruskal-Wallis test if not normal). Post-hoc comparisons of
means applied only when ANOVA showed significant differences among groups (based
on between group mean values). For the data that was normal, statistical power was also
low (P≤0.050, 95% confidence interval). The p values (p≥0.522) indicated the differences
for all positions were not significant.
Determining the Appropriate Scattering Device for Subsequent Testing
Several different scattering devices were evaluated to determine the most suitable
means of simulating different densities of cataract. Ideally, the device should produce
comparable VA loss and CS loss to that of cataract. Visual acuity loss was assessed with
a Snellen chart, and CS was determined using the MARS contrast sensitivity test.
Bangerter Foils
If scattering was influencing the ANK measurement, a possible trend would be an
increase in retinal image height of the eye with the Bangerter foil. This is based on the
concept that the scatter of light produced by the foil makes the edges appear wider and
therefore makes the overall image appear larger. Therefore, if the foil was placed in front
of the right eye, the ANK measurement would be decreased. If the foil was placed in

35
front of the left eye, the ANK measurement would be increased, and this trend would
increase as the density of the foil was increased.
The BAT results using 0.3, 0.4, and 0.6 Bangerter foils (Figure 9) produced
multiple significant differences in the ANK measurement (based on ANOVA and post-
hoc comparisons among means) for different foil densities in front of the right eye versus
the left eye. Data was normalized using the average of the measurements taken using just
the red/green glasses. Regression analysis of the Bangerter foil data interestingly revealed
no significant trend in ANK measurement versus foil density with filters in front of the
left eye (R=0.0741, R2=0.0055, p=0.241, m=0.560). However, a weak, but significant
trend was found when the filters were placed in front of the right eye (R=0.167,
R2=0.0280, p=0.008, m=0.918).
As further evidence that Bangerter may not be the optimal choice of cataract
simulation device; the foils did not produce a graded VA or CS loss. Contrast sensitivity
and VA losses were moderate, but did not increase with Bangerter rating as seen in
Tables 3 and 4. A similar result was found by Odell et al. (2008) in a report on the effects
of Bangerter foils on Visual Acuity. For the above reasons, Bangerter Foils were
considered to be a poor choice for subsequent cataract simulation experiments.

36
Figure 9. Normalized Preliminary BAT Results using Bangerter Foils. N=6. No
significant trend going from low visual acuity ratings to high visual acuity ratings. X axis
is reversed due to the Bangerter foil ratings being LogMAR. Error bars are SD.

37
Optical Defocusing Lenses
Figure 10 illustrates the BAT results using the +0.50D and +1.00D defocusing lenses.
There was a similar trend in the ANK measurements on the BAT to that found earlier
with the afocal size lenses as shown in Figure 5. BAT data was normalized using the
average of the measurements taken with no lens in place. Plus lenses in front of the left
eye produced a larger retinal image in the left eye indicated by the positive measurement
caused by the participants adjusting the right semicircle to be larger. Plus lenses in front
of the right eye produced a larger retinal image in the right eye, and the participants
adjusted the right semicircle to be smaller, producing a negative measurement. This is
consistent with the preliminary results using size lenses. However, dioptric lenses
produce a purely refractive change, and the optical defocusing lenses produce more than
1% change per 1D of refractive error. Therefore, overcorrection may affect ANK more
than what would be assumed. VA and CS were only mildly affected as seen in Tables 3
and 4. These lenses do not prove to be a good simulation of cataract because their
defocusing effect is not analogous to the typical light scattering effect caused by cataract.
Using a PERG, it has been shown that light scattering reduces amplitude more than
defocus. The two methods of image degradation have different effects on the retina (Bach
and Matheau, 2004).

38
Figure 10. Normalized Preliminary BAT Results using Optical Defocusing
Lenses. Black points represent defocusing lenses in front of the left eye. Red points
represent defocusing lenses in front of the right eye. N=6. Error bars are SD.

39
Regression analysis of the defocusing lens BAT ANK measurements revealed a
highly significant trend in both the left and right eye (p<0.001). This is consistent with
the earlier findings using the afocal size lenses (Figure 5). However, the defocusing
lenses produced slopes larger than 1 (−2.617 OD and 2.771 OS) indicating that plus
sphere lenses produce magnification higher than the accepted “rule of thumb” of 1 D
produces 1% magnification (Linksz et al., 1965).
Vistech Scattering Filters
Vistech scattering filters decreased both contrast sensitivity and visual acuity as a
function of the number of stacked filters. CS was affected more than VA as seen in
Tables 3 and 4. The ANK results were normalized using the average of the measurements
taken using just the red/green glasses.
Figure 11 illustrates the normalized ANK measurements from the BAT with
Vistech filters in front of each eye. Performing the BAT using 1 as well as 2, 3, and 4
Vistech scattering filters stacked on top of each other showed a small trend in ANK
measurement using linear regression for 1 and 2 filters stacked in front of the right eye
(p=0.018, m=0.355, R=0.182, R2=0.0331), but not in the left (p=0.240, m=−0.151,
R=0.0.0911, R2=0.0829). However, the subjects were not able to see the semicircle with
the eye in front of which 3 or 4 filters stacked. The test was repeated by reversing the red
green filters and changing the semicircle that is adjusted in an attempt to allow testing of
Vistech 3 and 4. However, the same unsuccessful result was obtained with 3 and 4 filters
stacked.

40
Figure 11. Normalized Preliminary BAT Results using Vistech Scattering Filters.
N=6. The Vistech filters showed a small trend warranting further exploration. Black
points represent filters in front of the left eye. Red points represent filters in front of the
right eye. Error bars are SD.

41
Tiffen Pro Mist Black Filters
An expected trend of ANK measurement using the TPM filters on the BAT is for the
ANK measurement to increase if the filter was placed in front of the left eye and increase
more with increasing filter density. The filters were mounted to the red green glasses
using Halberg clips and a special threaded adapter that allowed the filters to be fixed in
place. Additional filters could be screwed on to the filter attached to the adapter. CS and
VA were only mildly affected by the filters as seen in Tables 3 and 4. CS was affected to
a greater extent than VA. BAT data was normalized using the average of the
measurements taken using just the red/green glasses. The BAT results using the Tiffen
Pro Mist Black filters are illustrated in Figure 12.
Analyzing the BAT results using the TPM filters with a linear regression revealed
that using TPM 1, 2, and 3, 2 and 3 together (TPM5), as well as TPM1, 2, and 3 (TPM6)
did not produce a trend in ANK measurement on the BAT in front of the left eye
(p=0.0311, m=−0.0217, R=0.0498, R2=0.00248). However, as with the Bangerter foils
and the Vistech filters, the TPM filters in front of the right eye produced a produced a
significant trend in the right eye (p<0.001, m=0.0332, R=0.0967, R2=0.00727).

42
Figure 12. Normalized Preliminary BAT Results using Tiffen ProMist Black Filters.
N=6. The TPM filters did not show any significant trend between OD and OS. Error bars
are SD.

43
Table 3. Preliminary MARS Contrast Sensitivity Results of all Filters
Filter Type OD JW
OS JW
Binocular JW
OD LW
OS LW
Binocular LW
OD MS
OS MS
Binocular MS
No filter 1.56 1.44 1.72 1.68 1.68 1.68 1.64 1.60 1.72 1Vistech 1.20 1.20 1.64 1.16 1.12 1.68 1.20 1.20 1.68 2Vistech 0.76 0.76 1.64 0.76 0.76 1.68 0.72 0.72 1.68 3Vistech 0.32 0.32 1.60 0.36 0.36 1.68 0.28 0.24 1.68 4Vistech 0 0 1.44 0 0 1.68 0 0 1.68 0.6 Bangerter 1.20 1.24 1.64 1.08 1.20 1.68 1.16 1.12 1.68 0.4 Bangerter 1.24 1.24 1.64 1.36 1.20 1.68 1.20 1.20 1.68 0.3 Bangerter 1.28 1.28 1.64 1.32 1.28 1.68 1.20 1.20 1.68 +0.5D 1.64 1.64 1.64 1.68 1.68 1.68 1.64 1.56 1.68 +1.00D 1.60 1.56 1.68 1.68 1.64 1.68 1.56 1.44 1.68 TPM1 1.56 1.60 1.68 1.52 1.52 1.68 1.44 1.44 1.68 TPM2 1.56 1.60 1.68 1.52 1.52 1.68 1.44 1.44 1.68 TPM3 1.44 1.44 1.68 1.44 1.52 1.68 1.44 1.44 1.68 TPM5 1.40 1.36 1.68 1.40 1.28 1.68 1.20 1.20 1.68 TPM6 1.20 1.20 1.68 1.20 1.12 1.68 0.96 1.20 1.68
Filter Type OD NG
OS NG
Binocular NG
OD JB OS JB Binocular JB
OD KD
OS KD
Binocular KD
No Filter 1.72 1.72 1.72 1.72 1.72 1.76 1.60 1.64 1.68 1Vistech 1.12 1.12 1.68 1.20 1.20 1.68 1.16 1.16 1.56 2Vistech 0.72 0.72 1.60 0.72 0.72 1.64 0.72 0.76 1.60 3Vistech 0.24 0.44 1.60 0.40 0.20 1.64 0.36 0.24 1.56 4Vistech 0 0 1.60 0 0 1.68 0 0 1.68 0.6 Bangerter 1.16 1.16 1.64 1.16 1.08 1.64 1.12 1.08 1.64 0.4 Bangerter 1.16 1.20 1.64 1.20 1.16 1.68 1.24 1.20 1.56 0.3 Bangerter 1.16 1.24 1.64 1.24 1.24 1.64 1.24 1.2 1.60 +0.5D 1.44 1.56 1.72 1.64 1.56 1.72 1.60 1.64 1.72 +1.00D 1.56 1.6 1.64 1.60 1.56 1.75 1.68 1.60 1.68 TPM1 1.44 1.44 1.68 1.64 1.56 1.72 1.56 1.44 1.72 TPM2 1.44 1.44 1.68 1.48 1.52 1.72 1.60 1.48 1.68 TPM3 1.36 1.44 1.64 1.44 1.44 1.68 1.48 1.44 1.64 TPM5 1.32 1.40 1.68 1.36 1.36 1.72 1.32 1.32 1.68 TPM6 1.16 1.16 1.64 1.28 1.24 1.72 1.20 1.20 1.68
*Binocular indicates that test was performed with both eyes with one filter in front of the right eye.

44
Table 4a.
Preliminary Visual Acuity Results of all Filters
Filter Type OD JW OS JW Binocular JW OD LW OS LW
Binocular LW OD MS OS MS
Binocular MS
No Filter 20/20+1 20/15-1 20/15 20/20-1 20/25+2 20/20-1 20/20+2 20/20 20/20+3 1Vistech 20/20+1 20/20+2 20/15 20/25+3 20/25+2 20/20 20/30+3 20/25-2 20/20+3 2Vistech 20/20 20/20 20/15 20/25-2 20/40+2 20/20-2 20/30+3 20/25-2 20/20+3 3Vistech 20/30-1 20/30+2 20/20+2 20/40+2 20/60 20/20-2 20/50 20/50 20/20+3 4Vistech 20/60+1 20/60 20/20 20/70 20/70-1 20/20-2 20/70+1 20/70 20/20+3 0.6 Bangerter 20/60-1 20/60 20/20+1 20/60+2 20/50 20/20-2 20/70-1 20/70 20/20+3 0.4 Bangerter 20/50-1 20/50 20/20 20/50+2 20/50+2 20/20-1 20/50 20/60 20/15-2 0.3 Bangerter 20/60 20/50 20/20+1 20/40+1 20/60+2 20/20 20/50-2 20/50+1 20/20+3 +0.5D 20/20-1 20/20+3 20/15 20/20+2 20/15-2 20/20-1 20/20 20/20 20/20+3 +1.00D 20/30 20/25 20/15-2 20/25+3 20/25+3 20/25+5 20/20 20/20 20/20 TPM1 20/15 20/15 20/15 20/20-2 20/20-2 20/20-1 20/20 20/20 20/20+2 TPM2 20/15 20/15-1 20/15 20/20-1 20/20-1 20/20-1 20/20 20/20 20/20+3 TPM3 20/15 20/15-3 20/15 20/20 20/30-2 20/20 20/20 20/20 20/20+3 TPM23 20/20-1 20/20-1 20/15 20/20+1 20/20-1 20/20+3 20/25-1 20/25-1 20/20-1 TPM123 20/20-1 20/20+1 20/15 20/20-1 20/30 20/20+1 20/25-1 20/25-2 20/20
*Binocular indicates that test was performed with both eyes and with one filter in front of the right eye.

45
Table 4b.
Preliminary Visual Acuity Results of all Filters
Filter Type OD NG OS NG Binocular NG OD JB OS JB Binocular JB OD KD OS KD
Binocular KD
No Filter 20/20 20/20 20/20 20/20 20/25-1 20/20+2 20/20-1 20/20-2 20/20 1Vistech 20/20-2 20/25 20/20 20/20-1 20/20-1 20/15-2 20/20-1 20/25-1 20/25-1 2Vistech 20/30+3 20/25-2 20/20-2 20/25-2 20/25-1 20/15-2 20/50+2 20/25-2 20/25-2 3Vistech 20/40-2 20/50-1 2020-1 20/50 20/50-1 20/15-2 20/50-1 20/60 20/40-2 4Vistech 20/70-2 20/70-1 20/25+2 20/100+1 20/100 20/15-2 20/80 20/80 20/30-2 0.6 Bangerter 20/80+1 20/70-1 20/20+2 20/60-1 20/50-2 20/20+2 20/80 20/70 20/30-2 0.4 Bangerter 20/60 2/60+1 20/20+2 20/30 20/30 20/15-1 20/60-1 20/70-1 20/40 0.3 Bangerter 20/60-2 20/60+2 20/15+2 20/40 20/40 20/20+1 20/70-1 20/70 20/30-1 +0.5D 20/20-1 20/20-2 20/20+1 20/15-3 20/15-2 20/20+2 20/30 20/25 20/25-1 +1.00D 20/30-2 20/40-2 20/20 20/20-2 20/15-1 20/20+1 20/5-+1 20/25-2 20/25-2 TPM1 20/20-2 20/20-1 20/20+1 20/20-1 20/25+2 20/20+2 20/25 20/25-2 20/25+1 TPM2 20/20-2 20/20-2 20/20+1 20/20-2 20/20 20/20+3 20/25-1 20/25-1 20/20-1 TPM3 20/25+1 20/25+1 20/20 20/20-2 20/20-1 20/20+1 20/25-2 20/25-2 20/25-2 TPM5 20/25+2 20/25+3 20/20+3 20/20-2 20/25 20/20+2 20/25 20/40+2 20/20-1 TPM6 20/25-2 20/25+2 20/20+2 20/25-2 20/25 20/20 20/25 20/40+1 20/20-1
*Binocular indicates that test was performed with both eyes with one filter in front of the right eye

46
Final Selection of Cataract Simulation Filter
Table 5 shows the results of the tests performed to find the effect of each filter on
ANK measurement (using Tukey’s test) and to look for trends in ANK measurement as a
function of filter density to further investigate which filter would most likely produce an
effect on ANK measurement.
Selection of the filter to be used for the comprehensive cataract simulation study
was based on CS and VA measurements. Research performed by others (Chylack et al.
1993) and (Maraini et al. 1994) shows that while VA is not greatly affected by cataract,
CS is substantially reduced. Optical defocusing lenses produce different PERG amplitude
to that resulting from a light scattering device indicating that it has a different effect
(Back and Mathieu, 2004). The optical defocus lenses were therefore eliminated.
Bangerter foils were not chosen because of the uniform effect on VA and CS. They did
not produce a graded loss of VA and CS as the density of the filters increased. The Tiffen
Pro Mist Black filters and the Vistech filters were similar in that they mildly affected VA
and had a moderate affect on CS. This is consistent with the findings of Chylack et al.
(1993) and Maraini et al. (1994). Ultimately, the Vistech filters were chosen because they
had a greater effect on CS than the TPM filters.

47
Table 5.
Comparative Effect of each Filter Type on ANK Measurement
Number of Significant
Differences Subject Reliability TPM Bangerter Vistech JB 0.413 18 4 4 JW 0.759 0 4 1 KD 0.82 4 7 7 LW 0.54 20 5 4 MS 1.89 14 8 1 NG 0.735 10 14 5 Total SDs* 66 42 22
Total Comps 330 126 60
% SDs 20.00% 33.33% 36.67%
*Number of significant differences in ANK between filter combinations (Tukey’s test)
Vistech filters showed the greatest percentage of significant differences in ANK
measurement when all possible filter combinations were compared.
Simulation of Cataract using Vistech Filters
The participant CS and VA data is shown in tables 6 and 7. The results of the VA
measurements indicate that Vistech 1 simulates a mild cataract. The participants’ VA
changed by less than one line. However, CS is affected moderately, decreasing about 0.4
log units. Vistech 2 simulates a more severe cataract, degrading VA by a line, and
contrast sensitivity by about 0.8 log units compared to the “no filter” condition. Binocular
VA and CS were not significantly affected by either filter.

48
Student t tests comparing the ANK measurements obtained using the BAT with 1
Vistech filter in front of the left versus right eye reveal that while the Vistech 1 is not
significantly affecting ANK measurements, Vistech 2 significantly affected BAT
performance. Using a Mann-Whitney sum test for both conditions, comparing 1 filter OD
and OS resulted in a p value of 0.307. Using the same test comparing 2 stacked filters OD
or OS resulted in a p value of <0.001 Participants complained of image alignment
problems and difficulty keeping both semicircles in the same horizontal and/or vertical
position while performing the BAT with Vistech 2 in front of either eye. It is
hypothesized that this is a result of a greater influence of the patient’s heterophoria on
ANK measurement as the image becomes more degraded. The results indicate that the
eye with the filter placed in front of it has a reduced retinal image height. This is contrary
to the previously postulated theory that the blurred edges would make the images seen
through the filter appear larger. Figure 13 illustrates the BAT results of the simulated
cataract study using the Vistech filters to simulate cataract.
Linear regression analysis reveals a significant difference in the measurement of
ANK using the BAT with the filters in front of each eye. For Vistech filters 1 and 2 in
front of the left eye, a slope of 0.467 was obtained (R=0.244, R2=0.0597, p<0.001). For
Vistech filters 1 and 2 in front of the right eye, a slope of -0.396 was obtained (R=0.198,
R2=0.0394, p<0.001). The statistical powers for both tests were very high at P=1.000.
ANOVA tests comparing the “no filter” to Vistech OS and Vistech OD ANK
measurements revealed significant difference (p<0.001). Tukey’s test showed significant
difference (p<0.05) in all comparisons of ANK measurements except 1 Vistech filter in
front of the OS versus “no filter.”

49
Figure13. Normalized BAT ANK Results using Vistech Filters 1 and 2. N=20. Increasing
Vistech density showed a similar trend as the preliminary Vistech data. Black points
represent filters in front of the OS. Red filters represent filters in front of the OD. Error
bars are SD.

50
Table 6.
VA Results using Snellen Chart for Participants Enrolled in Simulated Cataract Study.
PATIENT VA OD VA OS VA OU VA OD V1 VA OS V1 VA OU V1 VA OD V2 VA OS V2 VA OU V2 MS-1 20/20 20/20 20/20-1 20/30+3 20/25-2 20/20+3 20/30+3 20/25-2 20/20+3 JW-2 20/20+1 20/15-1 20/15 20/20+1 20/20+2 20/15 20/20 20/20 20/15 LW-3 20/20-1 20/20-2 20/20-1 20/25+3 20/25+2 20/20 20/25-2 20/40+2 20/20-2 KD-4 20/20-1 20/20-2 20/20 20/20-1 20/25-1 20/25-1 20/50+2 20/25-2 20/25-2 NG-6 20/20 20/20 20/20 20/20-2 20/25 20/20 20/30+3 20/25-2 20/20-2 MC-7 20/15-2 20/15-3 20/15 20/25+3 20/20 20/20+3 20/25+1 20/25 20/20+3 KT-8 20/20-1 20/15-1 20/15 20/20-2 20/20-2 20/20-1 20/25-2 20/25-2 20/20-2 LT-9 20/20-1 20/20-1 20/15-2 20/20-1 20/25+1 20/20-1 20/25-1 20/40+3 20/20-1 AM-10 20/15-1 20/20 20/15-1 20/20-1 20/25+3 20/15-2 20/25+2 20/30-2 20/20 AW-11 20/15-1 20/15 20/15-1 20/20+1 20/20 20/15-2 20/25-1 20/25-1 20/15 TP-12 20/20+2 20/20-2 20/15-3 20/20 20/20 20/20 20/25 20/25-2 20/25-1 LK-13 20/15-2 20/15-2 20/15-2 20/20+3 20/20+2 20/15-1 20/25+2 20/25+2 20/15-1 PC-14 20/20+1 20/20 20/20+2 20/25+3 20/20-1 20/20 20/25-1 20/25-2 20/20+2 WR-15 20/20-3 20/20-2 20/20-3 20/30+3 20/25-3 20/20-2 20/30-2 20/30-2 20/15-2 NR-16 20/20 20/15-2 20/15-2 20/20+2 20-20 20/20 20/25-1 20/25-2 20/20-2 SP-17 20/20 20/20 20/20+1 20/25-2 20/25-1 20/20+1 20/25-2 20/30+3 20/20-2 SO-18 20/20 20/20-2 20/20 20/25-2 20/25-1 20/20-1 20/40-2 20/25 20/20+2 HM-19 20/15-2 20/15-2 20/15+2 20/20 20/20 20/15-2 20/25-2 20/25-1 20/15-1 CC-20 20/15-2 20/20+2 20/15-2 20/25+2 20/20 20/15-1 20/25-1 20/25 20/20+2 LL-21 20/20-2 20/20-1 20/15-1 20/20 20/20-1 20/15-2 20/25 20/25 20/15-1
* In OU, the filter was placed over the right eye with the left eye unoccluded.

51
Table 7.
CS Results using MARS Contrast Sensitivity Test for Participants Enrolled in Simulated Cataract Study.
PATIENT CS OD CS OS CS OU CS OD V1 CS OS V1 CS OU V1 CS OD V2 CS OS V2 CS OU V2 MS-1 1.64 1.60 1.68 1.20 1.20 1.68 0.72 0.72 1.68 JW-2 1.55 1.44 1.72 1.20 1.20 1.64 0.76 0.76 1.64 LW-3 1.68 1.68 1.68 1.16 1.12 1.68 0.76 0.76 1.68 KD-4 1.60 1.64 1.68 1.16 1.16 1.56 0.72 0.76 1.60 NG-6 1.72 1.72 1.72 1.12 1.12 1.68 0.72 0.72 1.60 MC-7 1.68 1.68 1.72 1.20 1.24 1.68 0.76 0.72 1.64 KT-8 1.64 1.64 1.68 1.20 1.20 1.56 0.72 0.72 1.56 LT-9 1.64 1.64 1.68 1.20 1.24 1.64 0.72 0.72 1.64 AM-10 1.64 1.64 1.68 1.20 1.16 1.60 0.76 0.84 1.64 AW-11 1.44 1.68 1.68 1.20 1.16 1.68 0.72 0.72 1.68 TP-12 1.68 1.68 1.72 1.36 1.32 1.68 0.96 0.96 1.68 LK-13 1.68 1.68 1.68 1.40 1.32 1.68 0.96 0.96 1.68 PC-14 1.60 1.64 1.72 1.24 1.28 1.72 0.76 0.68 1.68 WR-15 1.52 1.52 1.60 1.16 1.08 1.60 0.68 0.56 1.56 NR-16 1.60 1.60 1.68 1.12 1.12 1.60 0.72 0.72 1.60 SP-17 1.68 1.44 1.68 1.20 1.20 1.68 0.60 0.64 1.64 SO-18 1.64 1.64 1.68 1.28 1.24 1.64 0.80 0.72 1.64 HM-19 1.64 1.68 1.72 1.36 1.24 1.72 0.92 0.92 1.68 CC-20 1.68 1.68 1.68 1.20 1.20 1.68 0.76 0.76 1.68 LL-21 1.68 1.72 1.76 1.36 1.36 1.68 0.84 0.80 1.60
* In OU, the filter was placed over the right eye with the left eye unoccluded.

52
Cataract Patient Study: Specific Aim 2
Results from cataract patients are illustrated in Figure 14. The results indicated an
aniseikonic condition at the intermediate visit. Patients recorded close to 0% ANK on the
BAT at the preliminary visit. A shift in either the positive or negative direction develops
after the first surgery. Stereopsis was greatly reduced post surgery 1, with some patients
not able to perform the test. The spectacles each patient had at the presurgery visit were
used with the lens in front of the pseudophakic eye removed except where noted.
Stereopsis was restored, and in some cases improved, after post surgery 2. All patients
reported being very pleased with the quality of vision after bilateral cataract extraction.
Symptoms reported by the cataract patient questionnaire showed a reduction in severity
after unilateral cataract extraction and a mild reduction in severity after bilateral cataract
extraction as shown in Figure 15. The expected ANK measurements using the BAT on
cataract patients are listed in Table 8. The direction of the shift depends on if the patient
is hyperopic or myopic as well as which lens is extracted first. If the patient was
hyperopic and the left lens was extracted first, the ANK measurements were more
negative due to the decreased retinal image size in the left eye. If the patient was
hyperopic and the right lens was removed first, the ANK measurements were more
positive due to the smaller retinal image size in the right eye. If the patient was myopic
and had the left lens removed first, the ANK measurements were more positive due to the
increased retinal image size in the left eye. If the patient was myopic and had the right
lens removed first, the ANK measurements were more negative due to the increased
retinal image size in the right eye. ANK measurements return to ~0% at the final visit.
All data was analyzed using one way ANOVA.

53
Table 8.
Expected ANK Results using BAT on Cataract Patients.
Lens Extracted/Refractive Error
Retinal Image Height Change in eye after cataract extraction
ANK Measurement
OS Hyperope OS ↓ Negative OD Hyperope OD ↓ Positive OS Myope OS ↑ Positive OD Myope OD ↑ Negative

54
Figure 14. BAT Measurements from Cataract Patients. N=7.Each data point is from one
collection before extraction, after one extraction, and after 2 extractions.

55
Table 9 shows the results of the BAT measurements for the seven patients from
Vision America and UABSO. The type of ametropia along with the predicted ANK mean
change due to change in SM is shown. Also, whether or not the patients’ ANK mean
moved in the right direction is shown. Figure 14 is a graphical representation of the BAT
means for each study patient. Patients GAK, JKR, and BHS had changes in ANK
measurement consistent with predicted ANK as calculated using SM.
Patient NJC had a significant shift in the amount of ANK post surgery 1 in the
opposite direction than was predicted. However, the ANK results were variable when
comparing the mean ANK values of each visit (Pre surgery=0.150, Post Surgery 1=1.192,
Post Surgery 2=0.270) to the variance (Pre-surgery=1.134, Post Surgery 1=1.121, Post
Surgery 2=0.440). Extraction of the OD cataract caused a statistically significant shift in
the negative direction back to near baseline.
Patient KLN patient had 1.75 D anisometropia presurgery with equivalent sphere
refractive errors −4.25 DS OD and −2.50 DS OS, axial lengths 25.17mm OD and
24.73mm OS, 4 D exophoria, and an ANK measurement of -0.87%. Post surgery 1, the
patient did not have his spectacles, so a trial frame with his spectacle prescription was
used. This patient had 5.00D of anisometropia with equivalent sphere refractive errors of
-4.25 DS OD and +0.75 DS OS, 4 D exophoria, and -18.98% of ANK. This magnitude of
ANK is greater than expected given the presurgical ANK measurement and change of
SM due to the removal of the left spectacle lens. Post surgery 2, this patient had 1.50D
anisometropia with +1.00 DS OD and -0.50 DS OS, 2 D exophoria, and -4.84% ANK. As
with post surgery 1, the magnitude of ANK recorded is greater than predicted, indicating
that some other factors must have been influencing ANK measurement. This patient’s

56
extremely negative measurements may be due a vertical heterophoria, although vertical
heterophoria was not measured. Vertical displacement of the IOL could induce
heterophoria.
Patient BHD did not have her spectacles for the second visit, and reported that she
could not see clearly through the trial frame with her spectacle prescription in place. The
trial frame was adjusted several times and the patient confirmed that she did have an
unobstructed view of the BAT display. After extraction of the OS cataract, there was a
statistically significant shift of the ANK measurement in the positive direction. This is
contrary to expectation because removal of the hyperopic OS cataract should cause a shift
in the negative direction. After the OD cataract extraction, there was a significant shift in
the negative direction.
Patient MRE had an insignificant shift in ANK measurement in the opposite
direction of what would be expected post surgery 1. After having the OS cataract
extracted, the patient had a significant shift in the positive direction. This was also an
unexpected shift.
The calculated contribution of SM to ANK measurement is listed in Table 9.
Spectacle magnification is calculated using the formula in Figure 3 for each eye.
Expected ANK measurement is calculated using the formula in Figure 4. The main
concern of spectacle magnification is during visit 2 (post surgery 1), when the patient has
not had time to adapt to the lack of spectacle magnification in the operated eye. It appears
that spectacle magnification can account for some ANK recorded by the BAT. For four
of seven patients, direction and a degree of magnitude of ANK is predicted by taking into
account the change in SM.

57
Table 10 lists the global and contour stereopsis results for each patient for each
visit. Both global and contour stereopsis were reduced from pre surgery to post surgery 1,
with some patients not even able to perform the test. Stereopsis was improved post
surgery 2, often to presurgery 1 levels or better.

58
Table 9.
ANK Means of Patients with Ametropia Type, Consistency to Prediction, and Predicted ANK due to SM
Pre Surgery Post Surgery 1 Post Surgery 2
Patent Code
Extraction performed first Ametropia type ANK Mean
Predicted ANK Mean
Observed ANK Mean
Direction Consistent with prediction
Predicted ANK Mean
Observed ANK Mean
Direction Consistent with prediction
GAK1 OS Hyperope 0.77% -2.10% -1.13% Yes 0.84% 0.65% Yes NJK3 OS Hyperope 0.15% -4.49% 1.92% No 0.03% 0.27% No JKR5 OS Hyperope 0.35% -5.71% -6.10% Yes 0.22% -4.00% Yes KLN8 * OD Myope -0.87% -5.39% -18.98% Yes 1.20% -4.84% Yes BHS11 OS Myope -0.23% 4.28% 4.77% Yes 1.25% 3.75% Yes BHD12 ** OS Hyperope 0.67% -5.95% 3.36% No -0.05% 0.20% No MRE12 OD Hyperope 0.14% 6.06% -2.45% No -0.59% 2.68% No
*Patient crushed spectacles after pre surgery visit and a trial frame had to be used.
**Patient did not have spectacles and could not see through a trial frame.
Four out of seven patients showed change in ANK consistent with those predicted using SM.

59
Table 10.
Stereopsis Results of Cataract Patients
Patient Code Pre Surgery Post Surgery 1 Post Surgery 2 Global Contour Global Contour Global Contour GAK1 250 100 250 100 250 50 NJC3 250 140 250 70 250 70 JKR5 250 100 500 400 250 140 KLN8 250 40 >500 140 250 70 BHS11 500 140 >500 >400 250 40 BHD12 >500 >400 >500 >400 250 30 MRE13 500 50 >500 100 250 30
The results of the cataract patient questionnaire given at each visit are illustrated
in Figure 15. The results showed that patients experienced a significant reduction in
headaches between pre surgery and post surgery 2. Light sensitivity was reduced
significantly between post surgery 1 and post surgery 2 (p=0.031). Reading difficulty was
significantly reduced between pre surgery and post surgery 2. There were slight, but not
significant, reductions in the following symptoms: vertigo and dizziness, closing one eye
to read, nervousness, vertigo and dizziness, fatigue, and distorted space perception.

60
Figure 15. Cataract Patient Questionnaire Results. N=7. Significant difference was seen in the reduction of the severity of headaches,
light sensitivity, and reading difficulty.

61
Table 11 lists the significance of each symptom asked in the cataract patient
questionnaire as the result of a one way ANOVA test. If the data was nonparametric, a
Kruskal-Wallis one way ANOVA test was used. While no significant differences were
found for any symptom through the ANOVA, headaches, light sensitivity, reading
difficulty, nervousness, vertigo and dizziness, and distorted space perception were the
most significant. These symptoms were further investigated by t test comparing pre
surgery questionnaire scores to post surgery 2 scores. The results of the t tests show that
there is a significant change in the severity of headaches, and reading difficulty between
pre surgery and post surgery 2. A significant reduction was also found in the reduction of
severity of light sensitivity between post surgery 1 and post surgery 2.

62
Table 11. Results of One Way ANOVA and t test on Cataract Patient Questionnaire Results
Means
Pre Surgery Mean Post Surgery 1 Mean Post Surgery 2 Mean ANOVA P Value T Test P Value Between Pre Surgery and Post Surgery 2
Headaches 2.4 1.9 1.1 0.157* 0.047**
Eye ache, pain, or pulling 1.6 1.3 1.4 0.892
Light sensitivity 3.3 3.3 1.7 0.057* 0.051
Reading difficulty 3.9 2.4 1.8 0.002* <0.001**
Closes one eye to read 1.6 2.0 1.1 0.429
Double vision 1.4 1.3 1.1 0.990
Nervousness 1.7 1.7 1.1 0.117* 0.165
Vertigo and dizziness 2.0 1.3 1.1 0.163* 0.099
General fatigue 2.3 1.9 1.6 0.240
Distorted space perception 1.6 1.4 1.0 0.138* 0.209
* Warranted further investigation through t test
** Showed statistical significance in t test

63
CHAPTER 5
DISCUSSION
Key Findings
1. The Basic Aniseikonia Test (BAT) provided a reasonable, but imperfect,
measurement for ANK when applied in the vertical meridian in the dark.
2. Vernier alignment was not significantly affected by any of the tested scattering
devices.
3. Of the devices tested, the Vistech filters were the most accurate representation of
cataract judging by induced changes in VA and CS.
4. ANK measurement using the BAT was affected by the light scattering effects of
the Vistech filters.
5. Previously ametropic cataract patients showed a change in ANK measurement
after the first cataract extraction, with a return to near baseline after the second
extraction. However, there was increased variability between patients when
compared to presurgical ANK measurements.
Validating the Basic Aniseikonia Test
Using size lenses to validate the accuracy of the BAT indicated that the test
underestimates ANK measurement. Results also indicated a significant change in ANK
measurement when the afocal size lenses were moved from one eye to another. Figure 5

64
shows this trend for the afocal size lenses. Overall, the BAT was confirmed to be
underestimating size lens-induced ANK in the vertical meridian in the dark. These
results are in agreement with previous studies (Fullard et al. 2007, Rutstein et al. 2007)
because they both showed slopes for ANK measurement versus size lens
magnification that were less than 1. The lowest amount of underestimation was
previously found in the vertical meridian in the dark (Fullard et al. 2007). However, the
BAT proved to be the best available method for the conditions of the study in agreement
with the conclusions of Fullard et al (2007), that there is no more suitable alternative to
the BAT test for measurement of ANK.
Vernier Alignment
No significant differences were found between each filter type and the “No Filter”
condition results of the vernier alignment test (ANOVA). Figures 6-8a illustrated that all
unilaterally placed filter types and densities maintained the same curve as the “No Filter”
condition indicating that scatter-degraded edges created by simulated cataract are not
affecting the vernier alignment component of the BAT. However, for several reasons, the
vernier alignment test provided an incomplete assessment of the alignment task involved
in the BAT: (1) the challenging nature of the test, (2) high variability of data, (3)
inconsistency between results for upward versus downward displacement of the movable
vernier target, (4) the fact that the subjects were unable to perform the test for some of the
filters, and (5) because the results were expressed as incremental rather than continuously
variable values, the ANOVA test may not have been as robust. The effects of light scatter
on ANK measurement is a result of light scatter on the overall image, not just the top and

65
bottom edges of the semicircles. In addition, while vernier alignment is useful in judging
the alignment of the semicircles, the overall image combined with the strong fixation
point are probably equally, if not more, important.
Simulated Cataract
The ideal cataract simulator is a filter that affects both VA and CS, but has a
greater effect on CS. These effects should also increase with increasing filter density. The
Bangerter foils did not produce a progressive degradation of VA and CS. Thus, they were
eliminated from the study. The optical defocusing lenses were eliminated because that
they did not produce VA and CS loss consistent with cataract. Defocus has also been
reported by others to affect the retinal image by a different mechanism than light
scattering as demonstrated by Bach and Matheau (2004) using PERG. Vistech filters and
Tiffen Pro Mist Black filters both produced cataract-like effects on VA and CS. Of the
two, Vistech filters more closely resembled the CS loss of real cataract. Significant
changes in the ANK measurement with both filter types indicated that the light scattering
effects of cataract may influence ANK measurements on actual cataract patients.
Vistech filters were ultimately selected due to their more cataract-like impact on
CS rather than their effect on visual acuity, which is consistent for cataract according to
literature reports (Hess and Woo, 1978, Shandiz et al. 2011, Chylack et. al 1993.)
Vistech filters have also been found to scatter light with a similar angular distribution to
that of cataract (Elliot et al. 1996).
Twenty subjects were used to investigate how the Vistech filters affect ANK
measurement with the BAT. A Student t test comparing the normalized ANK

66
measurements with each filter on each eye showed that a single filter did not produce a
statistically significant difference in ANK measurement on either eye, while two stacked
filters in front of either eye did show a significant change in ANK measurement.
ANOVA tests comparing ANK measurements with no filter and with one or two filters in
front of either eye showed a significant effect on ANK measurements. Tukey’s test
revealed significant changes in ANK measurement when two filters were placed in front
of either eye and no filter in front of the contralateral eye. Because two filters produced a
significant change in measured ANK, the presence of cataract itself may influence ANK
measurements. This may be of little importance for bilateral cataract because the similar
light scattering effects OD and OS may cancel. However, when measuring ANK after
one cataract has been removed, the situation would more closely resemble that of the
unilateral scattering filters. Because a single Vistech filter showed a less consistent effect
on ANK, a mild cataract may not affect ANK measurement.
As reported by deWarrd et al (1992) forward scattering of light in the eye
produces a “veiling illuminance” superimposed on the retinal image that reduces retinal
image contrast. They cite cataract as a condition in which forward scattering is increased.
It was therefore expected in the current study that this “veiling illuminance” would make
the retinal image of the BAT target appear larger. However, based on the outcomes of the
cataract simulation study, the exact opposite was found. Instead of appearing larger,
ANK measurement results showed that that the image seen through the filter was
perceived as smaller, indicating that simulated cataract caused by Vistech filters has a
minifying effect on retinal image height. The finding of significant minification may have

67
been due in part to the large number of data points, but this does not alter the fact that the
minification effect was significant.
Cataract Patients
There are three possible factors that could be influencing ANK measurement
using the BAT on cataract patients:
1. The light scattering effects of cataract
2. The magnification and placement of the IOL
3. The inherent underestimation of ANK measured by the BAT
Patients showed a trend in changing ANK measurement depending on which lens
was extracted as well as if they were hyperopic or myopic. This is listed in Table 9. The
amount of measured ANK change is very close in magnitude to predicted ANK taking
into account SM. However, not all of the measured ANK can be accounted for based on
SM alone. Other factors may be influencing the ANK measurement. Inconsistent
measurements taken by patients NJC and MRE at post surgery 1 could have been a result
of the test being more challenging for them than others. The extremely negative
measurements recorded by patient KLN could have been due in to exophoria, as
heterophoria has been shown to affect ANK measurement with other devices (Lancaster,
1942). Lancaster, the originator of the term “aniseikonia”, reported that when using a
direct comparison eikonometer in patients with heterophoria, the heterophoria was
measured and not the ANK. In the current study, patient KLN’s ANK measurements may
have been affected by using a trial frame instead of his spectacles. It was necessary to use
a trial frame as his spectacles were irreparably damaged between pre surgery and post

68
surgery 1. Trial frame lenses could produce a different SM than spectacles and thus affect
the ANK measurement. This would be due to shape factor differences. Lens curvatures
and central thickness differ between trial lenses and typical positive meniscus ophthalmic
spectacle lenses. For four of the seven patients, the data corresponds with results from
the literature (Gobin et al. 2008) as the appropriate ANK change took place given which
lens was extracted, and the results were in the direction predicted using SM, although the
magnitude was not the same. Other factors may be having an effect on ANK
measurement such as light scatter or IOL placement and magnification. In the other three
cases, the trend was not as expected. Clearly, with the small number of patients in the
cataract study and the difficulty experienced by three of the seven, a larger patient
number should be investigated to be able to draw conclusions about the impact of
emmetropizing cataract surgery on ANK.
Correction of Refractive Error for Working Distance of BAT
Correction of refractive error for the working distance (77cm) of the BAT was not
performed due to the change in SM the lenses produce. However, preliminary results on
the BAT using defocusing lenses above +1.00D increased the difficulty of the task when
performed by normal healthy subjects, and younger participants would have more
accommodation than the older patients enrolled in the Cataract Patient study. Therefore,
the under corrected subjects in the Cataract Patient study with no correction for the
working distance would have a more difficult time performing the BAT than younger
patients. However, adding the appropriate lens (+1.25D) would change SM, and this
would need to be addressed.

69
Light scattering may be having a minifying effect on retinal image size and
subsequent ANK measurement judging by the results of the simulated cataract study
using Vistech filters. IOL’s do cause a change in retinal image magnification as reported
by Atebara et al (2009), and this is not accounted for in the calculations from the current
study. It is not only IOL power, but anterior-posterior position and tilt that may affect
retinal image height and therefore the subsequent ANK measurement (Atebara et al,
2009).
The cataract patient questionnaire showed a reduction in the severity of headaches
and reading difficulty between presurgery and post surgery 1. The severity of light
sensitivity was reduced between post surgery 1 and post surgery 2. These symptoms were
reported as being prevalent in patients with ANK (Bannon, 1945). Reading difficulty was
reported as being a symptom of contrast sensitivity loss (Whittaker and Lovie-Kitchin,
1993), and loss of contrast sensitivity is reported in the literature as being a result of
cataract (Maraini et al. 1993, Chylack et al. 1994). This could be due to going from a
light scattered condition to an aniseikonic condition, to an emmetropic condition. There
was little change in eye ache, pain, or pulling, double vision, and distorted space
perception. There was an increase in tendency to close one eye to read from presurgery to
post surgery 1, and a reduction in this tendency post surgery 2. After the first surgery, it
makes sense that patients would be more likely to read with one eye closed. This could
either be the unoperated eye, in particular if the eye is myopic, or the pseudophakic eye.
Patients only experienced decreased nervousness post surgery 2, indicating that they were
equally nervous in both the cataract and aniseikonic conditions. Vertigo and dizziness
was higher presurgery, but equal post-surgery 1 and 2. There was no increase in distorted

70
space perception post surgery 1. General fatigue decreased slightly over the course of the
surgeries, possibly due to first having to cope with the cataracts, then having to adapt to
the aniseikonic condition. It has been reported that even in patients with early stage
cataract, improved quality of life can be obtained by performing bilateral cataract surgery
over unilateral cataract surgery (Elliot et al. 2000). Expanding this to patients with
induced ANK after unilateral cataract surgery, the quality of life could be increased if the
detrimental effects of both unilateral cataract surgery and ANK are removed.
Spectacle magnification is of great importance in measuring ANK due to the
influence of SM on retinal image height (Achiron et al, 1997). In all patients except three,
the predicted spectacle magnification change could account for the change in direction of
ANK measurement in post surgery 1 as well as most of the magnitude. The remainder
could be due to inconsistency in ANK measurement, light scattering caused by the
remaining cataract, IOL power, or IOL position. It appears important for the patient to
perform the BAT with their habitual lenses because measurement of ANK using trial
frames was generally less successful.
However, the results of the simulated cataract study using Vistech filters indicate
that using the BAT to test ametropic cataract patients after unilateral cataract extraction
may be compromised due to the light scattering effects of cataract. The underestimation
of ANK measurement and minifying effect of light scatter indicated by the results of the
simulated cataract study suggest that ANK measurement on cataract patients may be
inherently inaccurate.
The decrease in both global and contour stereopsis after unilateral cataract
extraction and the improvement after bilateral cataract extraction are consistent with

71
other studies that found that loss of stereopsis is associated with the presence of ANK
(Lovasik and Szymkiw, 1985).
Limitations and Possible Future Studies
Simulated Cataract
This project had several limitations. Finding a scattering device that accurately
represented the contrast sensitivity and visual acuity loss caused by cataract, and that
could be adjusted in several increments, was challenging. Because the scattering device is
not within the crystalline lens, it may be producing effects that differ from those of
cataract. A simple filter cannot simulate the light scattering effects of all types of
cataract: for example nuclear, cortical, anterior subcapsular and posterior subcapsular.
The BAT has been shown to underestimate ANK measurements in the vertical meridian,
even in the dark (Fullard et al, 2007). It has also been shown to produce an even greater
underestimation in the horizontal meridian, which is the reason this meridian was not
tested in the current study (Fullard et al, 2007). While it is very convenient and portable,
it is not an ideal device for measuring ANK. The effects of short duration light scatter
caused by the various scattering devices may not be the same as the long term light
scatter experienced by cataract.
Cataract Patient Study
The difficulty in recruiting suitable cataract patients decreased the likelihood of
establishing significant trends in this part of the cataract patient study. Placement or
design of the IOL may have a confounding effect on ANK measurements. Data from the

72
simulated cataract study indicates that light scattering may be causing a minifying artifact
when measuring ANK using the BAT. Patients were under corrected for the working
distance of the BAT. Future studies involving cataract patients will include adding a lens
to correct for this distance. However, the preliminary BAT data using optical defocusing
lenses showed that defocusing lenses have an effect on BAT measurement. This will need
to be taken into consideration. Vertical heterophoria was not recorded and should be with
related studies. As with the simulated cataract study, the BAT is inherently flawed as it
has been proven to underestimate ANK in the vertical meridian in the dark and is unable
to accurately measure in the horizontal meridian (Fullard et al. 2007). Because these
patients are induced refractive anisometropes, they may not be experiencing ANK in the
same way as native anisometropes.
Future Studies
More sophisticated cataract simulating devices may provide more complete
information about the apparent minification produced by light scattering. Polymer-
dispersed liquid-crystal scattering devices are being investigated by several groups as
potential cataract simulators (Ozolinsh and Papelba, 2004). With the ability to
continuously vary the amount of scattering, these devices show potential. Measuring the
full contrast sensitivity function using an instrument that tests across several spatial
frequencies, such as Vistech Contrast Sensitivity Charts, would be useful. This approach
could provide a better assessment of parallels between a cataract simulator and real
cataract. Further investigation of the influence of light scatter on vernier alignment would
also be an option for further study.

73
Expanding the cataract study patient numbers to allow more definite conclusions
to be drawn is important. Including a criterion for reliability similar to the Repeatability
Coefficient Test that was used in the simulated cataract study as well as measuring
vertical heterophoria could decrease the number of patients who perform unreliably on
the BAT. Increasing the number of ANK measurements taken by the cataract patients
should not be a problem because the patients did not complain of fatigue after performing
the task.
The Metrovision device (Gobin et al., 2008) is a computer based direct
comparison eikonometer that utilized liquid crystal spectacles that oscillate at 120 Hz, a
frequency undetectable by the human eye, and a synchronized computer screen. As one
spectacle lens becomes transparent, a semicircle is presented, and as the other spectacle
lens becomes transparent, another semicircles is presented. The participant adjusts one
semicircle stepwise until the two semicircles appear the same, similar to the BAT. This
method may be more appropriate as it does not rely on anaglyph glasses. If found to be
more accurate in ANK measurement than the BAT, it would be a more suitable test for
measuring ANK in cataract patients as well as determining the light scattering effects of
simulated cataract on ANK.
Conclusions
In conclusion, the BAT was shown to underestimate ANK measurement in the
vertical meridian in the dark. Vernier alignment was not affected by any of the scattering
devices tested; indicating that some other aspect of the BAT must be influenced by light

74
scattering. Vistech filters showed VA and CS loss similar to losses seen in cataract,
proving that they were the optimal cataract simulator. These filters minified retinal image
height as measured by the BAT. Therefore, ANK measurements in ametropic cataract
patients may be underestimated due to both the BAT as well as light scattering caused by
cataract. Despite these shortcomings, for 4 of 7 cataract patients, ANK measurements
were in the predicted direction showing that ANK is produced by emmetropizing cataract
surgery on ametropic cataract patients. The combination of reduced stereopsis, results of
the questionnaire, and ANK measurements shows the advantage of bilateral over
unilateral cataract extraction in patients where ANK may develop after unilateral
extraction.

75
LIST OF REFERENCES
Achiron L, Witkin N, Primo S, Broocker G. Contemporary Management of Aniseikonia. Survey of Ophthalmology 1997.41: 4, 331-330.
Antona B, Barra F, Barrio A, Gonzalez E, Sanchez I. The validity and repeatability of the
New Aniseikonia Test. Optometry and Vision Science 2006. 83, 903–9. Arditi, A, Improving the design of the letter contrast sensitivity test. Investigative
Ophthalmology 2005.46,6, 2225-2229 Atebara N, Asbell P, Azar D, Ellis F, Faye E, Hoffer K, Wiggins R. Clinical Optics
Section 3, Singapore,.2009; 223. Bach M, Matheau M. Different effect of dioptric defocus vs. light scattering on the
Pattern Electroretinalgram. Documenta Ophthalmolgica 2004. 108; 99-106. Bangerter A. Occlusion in pleoptics and orthoptics. Kiln Monatsbl Augenheilkd 1960.
136, 305–31. Bannon R. Clinical Manual on Aniseikonia 1954. Buffalo, NY: American Optical
Corporation. Bannon R, Triller W. Aniseikonia-A clinical report covering a ten year period. American
Journal of Optometry 1944. 21; 171-182. Benjamin W. Borish’s Clinical Refraction. 1998. 1142–1159. Burian H. Clinical significance of Aniseikonia. Archives of Ophthalmology 1944. 29,
116–33. Chylack L, Padhye N, Khu P, et al. Loss of contrast sensitivity in diabetic patients with
LOCS II classified cataracts. British Journal of Ophthalmology. 1993. 77, 7-11. De Warrd P, IJspeert J, van den Berg T, de Jong P. Intraocular Light Scattering in Age-
Related Cataracts. Investigative Ophthalmology and Visual Science 1992. 33; 3, 618-625.

76
de Wit, G, Franssen, L, Commens, J, van den Berg, T. Simulating the Straylight effects of Cataracts. Cataract Refractive Surgery 2006. 32, 294-300.
Dougherty B, Flom R, Bullimore M. An evaluation of the Mars Letter Contrast
Sensitivity Test. Optometry and Vision Science 2005. 82: 11, 970-5. Elliot D, Bullimore M, Patla A, Whitaker D. Effect of a cataract simulation on clinical
and real world vision. British Journal of Ophthalmology 1996. 80, 799-804. Elliot D, Patla A Furniss M, Adkin A. Improvements in clinical and functional vision and
quality of life after second cataract surgery. Optometry and Vision Science 2000. 77; 1, 13-24
Elliot D, Situ P. Visual acuity versus letter contrast sensitivity in early cataract. Vision
Research 1998. 38, 2047-52. Essock, E, Williams, R, Enoch, J, Raphael, S. Effects of Image Degradation by Cataract
on Vernier Acuity. Investigative Ophthalmology and Visual Science 1984. 24, 1043-1050.
Fullard R, Rutstein R, Corliss D. The Evaluation of Two New Computer-Based Tests for
Measurement of Aniseikonia; Optometry and Vision Science 2007. 84; 12, 1093-1100.
Gobin L, Rozema J, Tassignon M. Predicting refractive aniseikonia after cataract surgery
in anisometropia. Journal of Cataract Refractive Surgery 2008. 35; 1353-1361 Guyton D, Rubin G (Eds). Contrast Sensitivity and glare testing in the evaluation of
anterior segment disease. Ophthalmology 1990. 97, 1233-7. Hess R, Woo G. Vision through cataracts. Investigative Ophthalmology and Visual
Science 1978. 17: 428-435. Jimenez J, Ponce A, delBarco L, Diaz J, Perez-Ocon F. Impact of Induced Aniseikonia
on Stereopsis with Random-dot Stereogram; Optometry and Vision Science 2002.79, 121–5.
Klein B, Moss S, Klein R, Lee K, Cruichshanks, K. Associations of visual function with
physical outcomes and limitation 5 years later in an older population; The Beaver Dam eye study. Ophthalmology 2003. 110, 644-50.
Kramer P, Lubkin V, Pavlica M, Covin R. Symptomatic Aniseikonia in Unilateral and
Bilateral Pseudophakia. A Projection Space Eikonometer study. Binocular Vision and Strabismus Quarterly 1999. 14; 3, 183-190.

77
Lancaster W. A Reply to Criticisms of Aniseikonia. Transactions of the American Ophthalmological Society 1942. 40; 82-117
Lang J. An efficient treatment and new criteria for cure of strabismic amblyopia: reading
and Bangerter foils. Binocular Vision and Strabismus Quarterly 1999. 14: 9–10. Linksz A, Bannon R. Aniseikonia and refractive problems. International Ophthalmology
Clinics 1965.5,515-534. Lovasik J, Svymkiw M. Effects of Aniseikonia, Anisometropia, accommodation, retinal
illuminance, and pupil size on stereopsis. Investigative Ophthalmology and Visual Science 1985.26;5,741-750.
Maraini G, Rosmini F, Graziosi, P, Tomba, M, Bonacini M, Cotichini, R, Pasquini, P,
Sperduto, R. and the, Italian American Cataract Study Group. Influence of Type and Severity of Pure Forms of Age- Related Cataract on Visual Acuity and Contrast Sensitivity. Investigative Ophthalmology & Visual Science 1994. 35, 262-267.
Mangione C, Phillips R, Lawrence M, Seddon J, Orav E, Godman, L. Improved Visual
Function and Attenuation of Declines in Health-Related Quality After Cataract Extraction. Archives of Ophthalmology 1994.112:1419-25.
Marron J, Bailey I. Visual factors and orientation: Mobility Performance. American
Journal of Optometry and Physiological Optics 1982.59; 413-26. McCormack G, Peli E, Stone P. Differences in Tests of Aniseikonia. Investigative
Ophthalmology and Visual Science 1992. 33:2063–7. Miller D, Benedeck G. Intraocular Scattering: Theory and Clinical Application 1973.29-
32, 61-65. Odell N, Leske D, Hatt S, Adams W, Holmes J. The effect of Bangerter filters on
optotype acuity, Vernier acuity, and contrast sensitivity. Journal of AAPOS 2008. 12, 555–559.
Ogle K, Researches in Binocular Vision, New York, Hafner, 1972, 304 Ozolinsh M, Papelba G. Eye cataract simulation using polymer dispersed liquid crystal.
scattering obstacles. Ferroelectrics 2004.51,609-613. Perez G, Archer S, Artal P. Optical Characterization of Bangerter Foils. Investigative
Ophthalmology and Visual Science 2010. 51,609-13. Phillips C. Strabismus, Anisometropia, and Amblyopia. British Journal of
Ophthalmology 1959.43, 449-460

78
Rubin G. Reliability and sensitivity of clinical contrast sensitivity test. Clinical Vision
Science 988.2,169-77. Rubin G, West S, Munoz B Bandeen-Roche K, Zeger S, Schein O, Fried L. A
comprehensive assessment of visual impairment in a population of older Americans, The SEE study. Salisbury Eye Evaluation Project, Investigative Ophthalmology and Visual Science 1997. 38: 557-68.
Rutstein R, Corliss D, Fullard R; Comparison of Aniseikonia as Measured by the
Aniseikonia Inspector and the Space Eikonometer; Optometry and Vision Science 2006. 83, 11, 836-842
Rutstein R, Daum K. Anomalies of Binocular Vision: Diagnosis and Management. St.
Louis: Mosby; 1998. Shandiz J, Derakhshan A, Daneshyar A, Azimi A, Moghaddam H, Yekta A, Yazdi S,
Esmaily H. Effect of cataract type and severity of visual acuity and contrast sensitivity. Journal of Ophthalmic and Vision Research 2011. 6; 1, 26-31.
Tan A, Wang J, Rochtchina E, Mitchell. Comparison of age-specific cataract prevalence
in two population-based surveys 6 years apart. BMC Ophthalmology 2006. 6:17 Troutman R. Artiphakia and Aniseikonia. More evidence of aniseikonia in pseudophakia
from another expert, with a "seconding" of a warning to corneal, refractive and implant surgeons. Binocular Vision and Strabismus Quarterly 1999. 263
Weise K, Marsh-Tootle W, Corliss D. Evaluation of Computer- Based Testing for
Aniseikonia in Children. Optometry and Visual Science 2010.87; 11,883-88. West S, Rubin G, Broman A, Munoz B, Bandeen-Roche K, Turano K. How does visual
impairment affect performance on tasks of everyday life? The SEE Project. Salisbury Eye Evaluation. Archives Ophthalmology 200. 120:774-780.
Whittaker S, Lovie-Kitchin J. Visual Requirements for Reading. Optometry and Visual
Science 1993. 70, 54-65. Wood J, Troutbeck R. Elderly drivers and simulated visual impairment. Optometry and
Visual Science 1995. 72:115-124. Yoshida M, Sato M, Awaya S. Evaluation of the clinical usefulness of the New
Aniseikonia Tests. Nippon Ganka Gakkai Zasshi 1997. 101,718–22.

79
APPENDIX A
INSTITUTIONAL REVIEW BOARD APPROVAL LETTER


80
APPENDIX B
CATARACT PATIENT DATA COLLECTION FORMS

81
Presurgical Evaluation (Visit A) - 1 week pr ior to surgery Date: ______________ Patient Code:____/_____/____/___# Gender : ______ Race: _______ Age:_________
Patient’s habitual refractive correction (what type of correction they wear most of
the time): glasses or contact lenses ______________
Spectacle lens parameters:
Habitual Rx: OD_____________ OS_______________
Base Curve: OD_____ OS______
Center thickness: OD______ OS_______
n’: OD______ OS_____
Vertex distance: OD_______ OS_________
Visual Acuity with Habitual Rx: OD_______________ OS________________
Refractive Er ror : OD________(VA 20/ ) OS__________(VA 20/ )
Alternate pr ism cover test at distance and near : __________ (with Habitual Rx)
Axial Length: OD___________ OS__________

82
Corneal Topography with simulated keratometry: OD_________________
OS___________________________
Stereopsis: Contour_________ Global__________ (with habitual Rx)
Aniseikonia Measurements (with habitual Rx, green filter before OD)
1. Ver tical 1 ____________
2. Ver tical 2 ____________
3. Ver tical 3 ____________
4. Ver tical 4 ____________
5. Ver tical 5 ____________
6. Ver tical 6 ____________
7. Ver tical 7 ____________
8. Ver tical 8 ____________
9. Ver tical 9 ____________
10. Ver tical 10 ___________
Patient must demonstrate reasonable repeatability during preliminary Aniseikonia
testing. If investigator finds that patient demonstrates difficulty, he/she should not be
enrolled in the study.
# First initial/middle initial/last initial/patient number
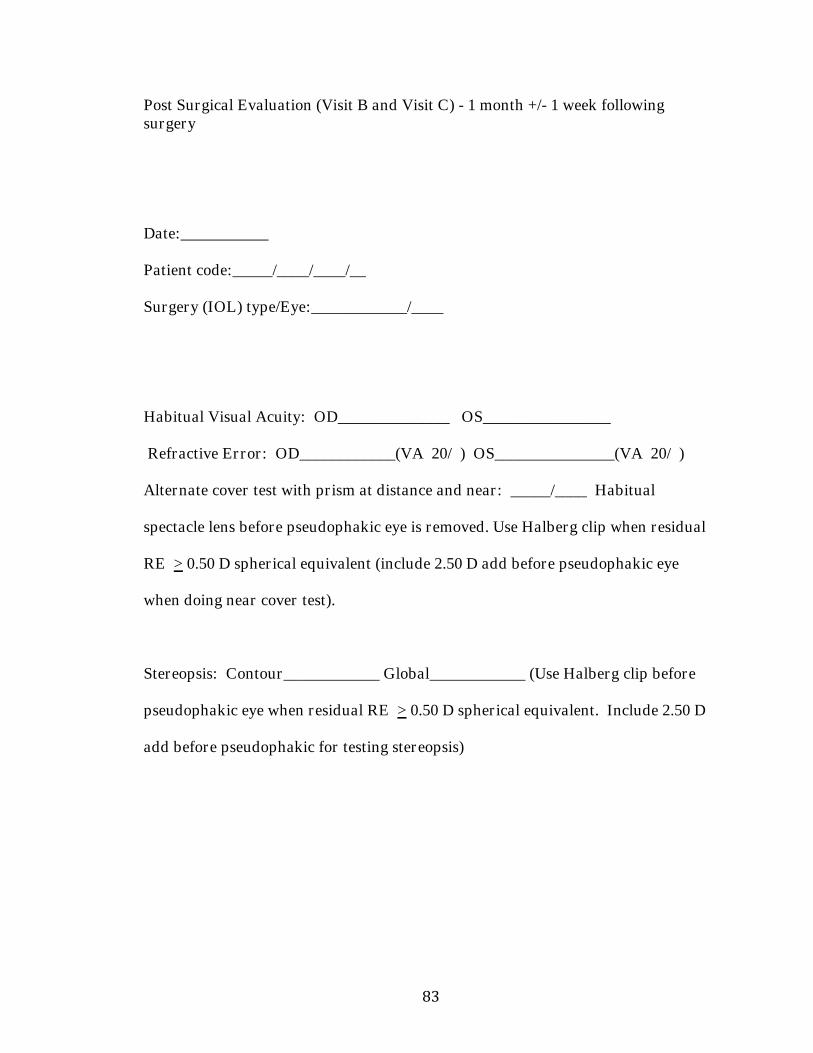
83
Post Surgical Evaluation (Visit B and Visit C) - 1 month +/- 1 week following surgery Date:___________ Patient code:_____/____/____/__ Surgery (IOL) type/Eye:____________/____
Habitual Visual Acuity: OD______________ OS________________
Refractive Er ror : OD____________(VA 20/ ) OS_______________(VA 20/ )
Alternate cover test with pr ism at distance and near : _____/____ Habitual
spectacle lens before pseudophakic eye is removed. Use Halberg clip when residual
RE > 0.50 D spher ical equivalent (include 2.50 D add before pseudophakic eye
when doing near cover test).
Stereopsis: Contour____________ Global____________ (Use Halberg clip before
pseudophakic eye when residual RE > 0.50 D spher ical equivalent. Include 2.50 D
add before pseudophakic for testing stereopsis)

84
Aniseikonia Measurements: (Use Halberg clip before pseudophakic eye when
residual RE > 0.50 D, green filter before OD)
1. Ver tical 1 ______________
2. Ver tical 2 ______________
3. Ver tical 3 ______________
4. Ver tical 4 ______________
5. Ver tical 5 ______________
6. Ver tical 6 ______________
7. Ver tical 7 ______________
8. Ver tical 8 ______________
9. Ver tical 9 ______________
10. Ver tical 10 ____________

85
Questionnaire for Aniseikonia Study
Patient Code :___/___/___/___(first, middle, last name, and enrollment #)
Date:__________
The following lists 10 visual symptoms that you may have. Please grade them as
1(. never), 2. (a little), 3. (sometimes), 4. (a lot), 5. (always).
1. Headaches-
2. Eye ache, pain, or pulling-
3. Light sensitivity-
4. Reading difficulty-
5. Closes one eye to read-
6. Double vision-
7. Nervousness-
8.Vertigo and dizziness-
9. General fatigue-
10. Distorted space perception-

86
APPENDIX C
CATARACT PATIENT DATA

87
Initial Visit Post Surgery 1 (OS) Post Surgery 2 (OD) Patient Code: G/A/K/01 Gender: Male Race: White Age: 54 Habitual Correction: Glasses Habitual Rx: OD +1.25 OS +1.25 Base Curve: OD +5.25 OS +5.25 Center Thickness: OD 3.2 OS 3 Refractive Index: OD 1.49 OS 1.49 Vertex Distance: OD 15mm OS 15mm
Visual Acuity w/ Habitual: OD 20/80 OS 20/20 OD 20/80 OS 20/20 OD 20/40 OS 20/30
Refractive Error: OD +2.00 20/20 OS +2.00 20/20 OD +2.25 -.050 x175 20/20
OS +.75 -0.75 x 180 20/20
OD +1.00 - 1.50 x 170
OS +0.75 - 1.00 x 180
Alternate Prism Test: Distance Ortho Near Ortho Distance Ortho Near Ortho Distance Ortho Near Ortho Axial Length: OD 22.11mm OS 22.12mm
Corneal Topography:
OD 45.67D/7.29mm @ 83 43.77D/7.71mm @ 173
OS 43.77D/7.71mm@179 44.70D/7.55mm@89
OD 45.49D/7.42mm @87 * 44.00D/7.67mm @177
OS 43.72D/7.72mm @ 8 * 44.41D/7.00mm @ 98
Stereopsis: Global 250 Contour 100 Global 250 Contour 100 Global 250 Contour 50
* Corneal Topography and axial length not routinely taken after surgery

88
Initial Visit Post Surgery 1 (OS) Post Surgery 2 (OD) Patient Code: J/K/R/05 Gender: Female Race: White Age: 74 Habitual Correction: Glasses Habitual Rx: OD +3.00-0.75x75 OS+2.75-0.75x98 Base Curve: OD +8.20 OS+8.20 Center Thickness: OD 4.50 OS 4.75 Refractive Index: OD 1.49 OS 1.49 Vertex Distance: OD 14 mm OS 14 mm
Visual Acuity w/ Habitual: OD 20/20 OS 20/40 OD 20/30 OS 20/20 OD 20/20 OS 20/20
Refractive Error: OD +4.25 - 1.25 x 100 OS +3 - 1.25 x 100
OD +.75-0.25x134
OS +3.50-0.75x83
OD +0.25-0.50x90
OS +0.75-0.50x130
Alternate Prism Test: Distance Ortho Near Ortho Distance Ortho Near Ortho
Distance Ortho Near Ortho
Axial Length: OD 24.18mm OS 24.18mm
Corneal Topography:
OD 40.86/8.26mm@51 41.21/8.19@141
OS 41.26/8.18mm@147 41.82/8.07@57
Stereopsis: Global 250 Contour 100 Global 500 Contour 400 Global 250 Contour 150

89
Initial Visit Post Surgery 1 (OS) Post Surgery 2 (OD) Patient Code: K/L/N/08 Gender: M Race: White Age: 64 Habitual Correction: Glasses
Habitual Rx: OD -4.25-0.25x141
OS -2.25-0.75x150
Base Curve: OD +4 OS+4 Center Thickness: OD 1.8 OS 2 Refractive Index: OD 1.49 OS 1.49 Vertex Distance: OD 12mm OS 12mm Visual Acuity w/ Habitual: 20/40+2 20/25- OD 20/40+2 OS 20/20-1 OD 20/25 OS 20/20-2
Refractive Error: OD -4.25-0.25x141
OS -2.25-0.75x150 OD -4.25
OS +1.-.50x177
OD +1.25-.75x165 OS -.25-.50x155
Alternate Prism Test: Distance 2exo Near 4 exo Distance 4 exo Near 0 Distance 2xp Near 0
Axial Length: OD 25.17mm OS 24.73mm
Corneal Topography: OD 43.10 42.90
OS 44.18 44.35
Stereopsis: Global 250 Contour 40 Global >500 Contour 140 Global 250 Contour 70

90
Initial Visit Post Surgery 1 (OS) Post Surgery 2 (OD) Patient Code: B/H/S/11 Gender: Female Race: White Age: 71 Habitual Correction: Glasses
Habitual Rx: OD -3.25-0.50x117 OS-4.25
Base Curve: OD +6.5 OS +5.8 Center Thickness: OD 1.4 OS 1.8 Refractive Index: OD 1.49 OS 1.49 Vertex Distance: OD 12mm OS 12mm
Visual Acuity w/ Habitual: 20/50-2 20/50-2 OD 20/60 OS 20/30 OD20.25 OS 20/25
Refractive Error: OD -3.25-0.50x117 OS -4.25
OD -3.00-0.75x110
OS 0-0.75x75
OD -1.00 -1.25 x 121
OS 0 -0.75 x75
Alternate Prism Test: Distance Ortho Near Ortho Distance Ortho Near Ortho Distance Ortho Near Ortho Axial Length: OD 23.29mm OS 23.47mm
Corneal Topography: OD 44.50/45.75 @ 42
OS45.50/46.00 @ 77
Stereopsis: Global 500 Contour 140 Global >500 Contour >400 Global 250 Contour 40

91
Initial Visit Post Surgery 1 (OS) Post Surgery 2 (OD) Patient Code: B/H/D/12 Gender: Female Race: White Age: 71 Habitual Correction: Glasses Habitual Rx: OD +4.50 -1.00x85 OS +4.50-0.75x93 Base Curve: OD +7.5 OS+7.75 Center Thickness: OD 3.75 OS3.50 Refractive Index: OD 1.49 OS 1.49 Vertex Distance: OD 12mm OS 12mm Visual Acuity w/ Habitual: OD 20/40 OS 20/50 OD 20/40 OS 20/25-1 OD 20/20 +
OS 20/30 -2
Refractive Error: OD +4.50-1.00x85 OS +4.50-.75x95 OD +4.50-1.00x85 OS PL
OD +0.25-0.25x115 OS +1.00-0.75x90
Alternate Prism Test: Distance Ortho Near Ortho Distance Ortho Near Ortho Distance Ortho Near Ortho
Axial Length: OD 22.98mm OS 22.75mm
Corneal Topography: OD43.32/7.79@123 44.06/7.66@33
OS44.18/7.64@105 44.64/7.56@15
Stereopsis: Global >500 Contour >400 Global >500 Contour >400 Global 250
Contour 30

92
Initial Visit Post Surgery 1 (OD) Post Surgery 2 (OD) Patient Code: M/R/E/13 Gender: M Race: W Age: 75 Habitual Correction: Glasses Habitual Rx: OD OS Base Curve: OD +7.5 OS +7.75 Center Thickness: OD 5 OS 4 Refractive Index: OD 1.49 OS 1.49 Vertex Distance: OD 12mm OS 12mm
Visual Acuity w/ Habitual: OD 20/30 OS 20/30 OD 20/20 OS 20/50 OD 20/25 OS 20/25
Refractive Error: OD+3.00-2.00x090 OS+3.00-1.25x090
OD P+1.00x090
OS+3.00-2.00x90
OD PL-0.75x90
OS +0.50-1.25 x 80
Alternate Prism Test: Distance Ortho Near Ortho Distance Ortho Near Ortho
Distance Ortho Near Ortho
Axial Length: OD 24.23 OS24.28
Corneal Topography: OD41.46/8.14@106, 42.94/7.86 @16
OS 41.31/8.17 @82 42.83/7.88@ 172
Stereopsis: Global 500 Contour 50 Global >500 Contour 100 Global 250 Contour 30