measuring antibiotic use in ltcfs - qio) program · measuring antibiotic use in ltcfs elizabeth...
TRANSCRIPT

MEASURING ANTIBIOTIC USE IN LTCFSELIZABETH DODDS ASHLEY, PHARMD, MHS
LIAISON CLINICAL PHARMACIST
dason.medicine.duke.edu


Sources for Antibiotic Datain Nursing HomesPurchasing data -Can be difficult for dispensing from a central pharmacy location to
many facilities
Dispensing data Can be difficult with a lot of floor stock
Electronic MARPaper and pencil Point prevalence survey
3

Are Additional Metrics Available?Courses/starts per 1,000 resident days
Advantages: easier to measure Disadvantages: does not tell the whole picture- what about durations and overall exposure Remember- a single course of chronic UTI prophylaxis is only started once!!!
Benoit SR et al. JAGS 2008;56:2039-44.

Are Additional Metrics Available?
5
Number (or percentage) of patients receiving antimicrobialsAdvantages:This number can help target education.
Disadvantages:This can still underestimate key prescribing practices.
Myelotte JM and Neff M. AJIC 2003;18-25.

Measuring Antibiotic Use:Defined Daily Dose
6
Standardized definition of daily antibiotic dose Created by the World Health Organization Correction factor: Total Units (i.e. mg) Drug
DDD Correction Factor
Pros: Attempts to convert raw
purchasing data into utilization data Allows comparisons with other
institutions Easy to calculate
Cons: Not everyone agrees with the
DDD correction factors Many use institution-specific
correction factors (prescribed daily dose) Not patient level information

Measure Antibiotic Use:Antibiotic Days and Days of TherapyNumber of antibiotic days AND Days of Therapy Note: this is not the same as Days of Therapy
DOT: Piperacillin/tazobactam= 2 Vancomycin = 4 Antibiotic days: Overall = 4
Polk et al. CID 2011;53(11):1100–10
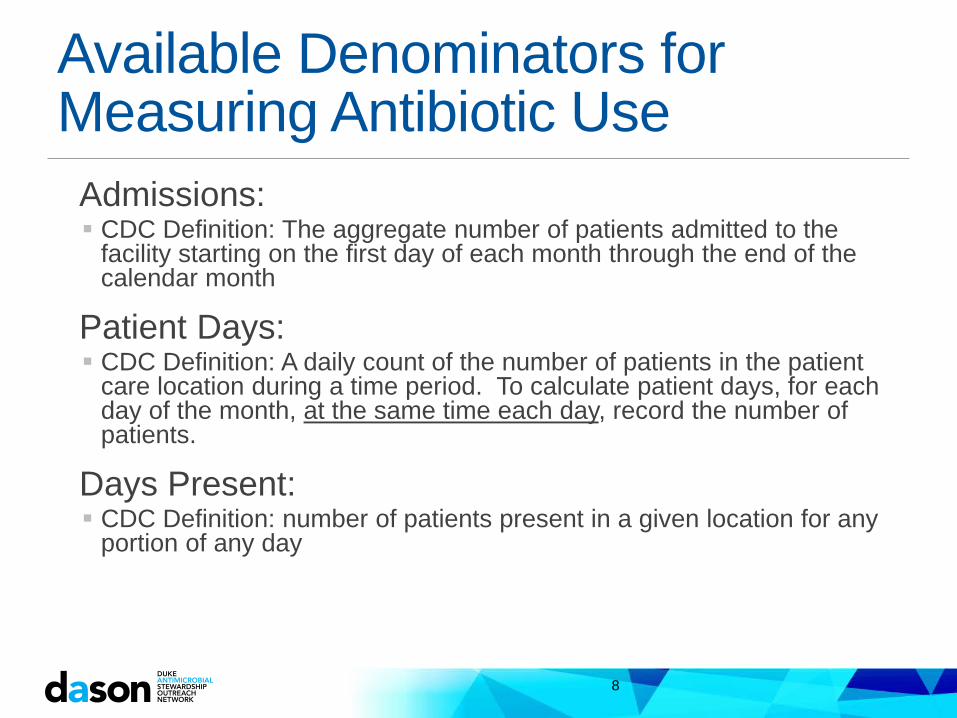
Available Denominators for Measuring Antibiotic Use
Admissions: CDC Definition: The aggregate number of patients admitted to the
facility starting on the first day of each month through the end of the calendar month
Patient Days: CDC Definition: A daily count of the number of patients in the patient
care location during a time period. To calculate patient days, for each day of the month, at the same time each day, record the number of patients.
Days Present: CDC Definition: number of patients present in a given location for any
portion of any day
8

Data ExampleDRUG NAME SIG DATE WRITTEN
QTY AUTH
QTY DISP
DOXYCYCLINE 100 MG CAPSULETAKE ONE CAPSULE PO TWICE DAILY X 7 DAYS (BRONCHITIS/COPD) 27-Jan-16 14 14
CIPROFLOXACIN 500MG TABS(*) ONE TABLET PO TWICE DAILY. (OSTEOMYELITIS) (DC 2/8/16) 4-Jan-16 70 55VANCOMYCIN 1 GM ADD-VAN VIA INFUSE 1GM I.V. EVERY 12 HOURS OVER 60-90 MINUTES (*Activate before use*) 12-Jan-16 60 8VANCOMYCIN 1 GM ADD-VAN VIA INFUSE 1GM I.V. EVERY 12 HOURS OVER 60-90 MINUTES (*Activate before use*) 25-Jan-16 28 8SULFAMETHOXAZOLE/TMP DS TAB TAKE 1 TABLET BY MOUTH TWICE DAILY X 14 DAYS. (PYELONEPHRITIS) 11-Jan-16 28 2CEFPODOXIME 200 MG TABLET TAKE ONE TABLET PO EVERY 12 HOURS FOR 10 DAYS (PYELONEPHRITIS) 12-Jan-16 20 5
9
Calculations:Doxycycline: 7 DOTCiprofloxacin: 55/2= 27.5- 28 DOTVancomycin: 8/2= 4 DOT
QTY QTY DRUG NAME SIG DATE WRITTEN AUTH DISP DOT
TAKE ONE CAPSULE PO DOXYCYCLINE 100 MG CAPSULE TWICE DAILY X 7 DAYS (BRONCHITIS/COPD) 27-Jan-16 14 14 7CIPROFLOXACIN 500MG TABS(*) ONE TABLET PO TWICE DAILY. (OSTEOMYELITIS) (DC 2/8/16) 4-Jan-16 70 55 28
HOURS OVER 60-90 VANCOMYCIN 1 GM ADD-VAN VIA INFUSE 1GM I.V. EVERY 12 MINUTES (*Activate before use*) 12-Jan-16 60 8 4
HOURS OVER 60-90 VANCOMYCIN 1 GM ADD-VAN VIA INFUSE 1GM I.V. EVERY 12 MINUTES (*Activate before use*) 25-Jan-16 28 8 4SULFAMETHOXAZOLE/TMP DS TAB TAKE 1 TABLET BY MOUTH TWICE DAILY X 14 DAYS. (PYELONEPHRITIS) 11-Jan-16 28 2 1CEFPODOXIME 200 MG TABLET TAKE ONE TABLET PO EVERY 12 HOURS FOR 10 DAYS (PYELONEPHRITIS) 12-Jan-16 20 5 3

Antibiotic Use by Nursing Home
403.20 417.47
266.28
647.02719.53
0
100
200
300
400
500
600
700
800
1 2 3 4 5
DD
D/1
0,00
0 re
side
nt d
ays
Based on Aggregate Purchasing Data
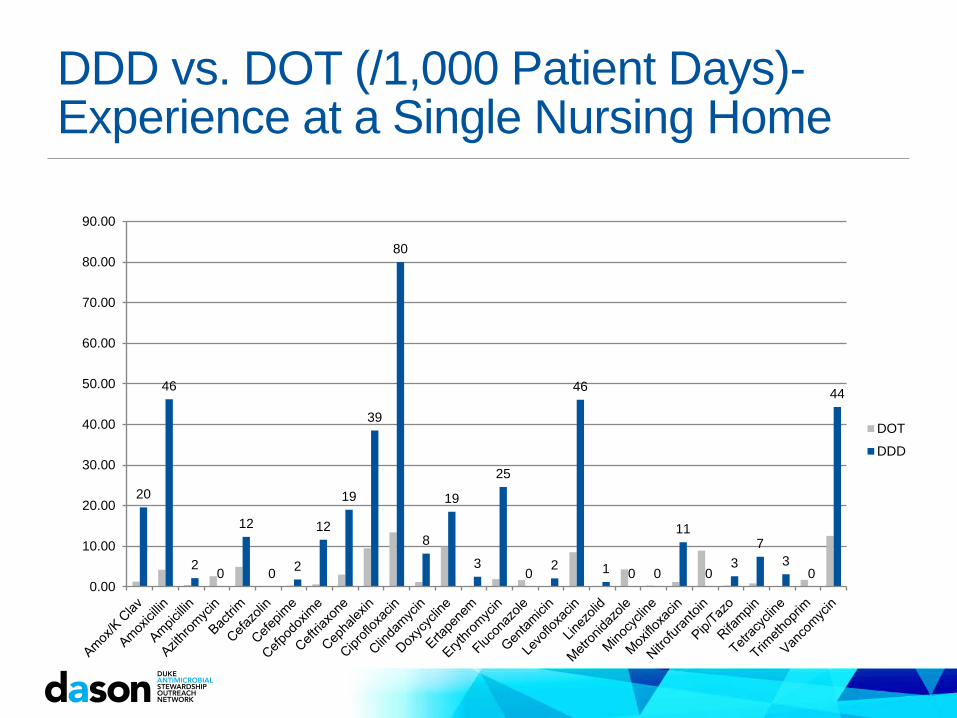
DDD vs. DOT (/1,000 Patient Days)-Experience at a Single Nursing Home
20
46
2 0
12
0 2
12
19
39
80
8
19
3
25
0 2
46
1 0 0
11
03
73
0
44
0.00
10.00
20.00
30.00
40.00
50.00
60.00
70.00
80.00
90.00
DOTDDD

Days of Therapy/1,000 Patient Days
171183
7866
79
102
7461
020406080
100120140160180200
2014 Q1 2014 Q2 2014 Q3 2014 Q4
AA no TCCE
Based on Dispensing Data
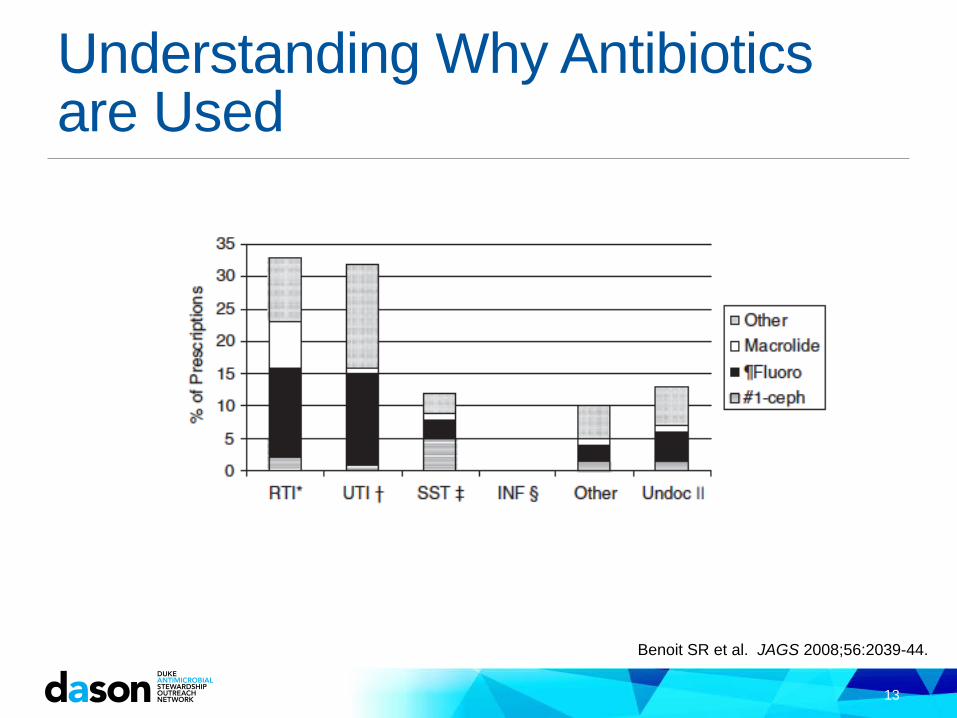
Understanding Why Antibiotics are Used
13
Benoit SR et al. JAGS 2008;56:2039-44.

There is no substitute for chart review (in some cases)…
14
CDC. Core Elements of Antibiotic Stewardship in Nursing Homes- Appendix B 2015.

Most Common Indication for Antibiotic Use In Nursing Homes
0 50 100 150 200 250 300
UTI 252
Cellulitis 157
Pneumonia 91
Bone/joint infection 49
Thrush 40
C. diff 30
Wound infection 26
Intra-abdominal 13
Based on Dispensing Data

Beyond Just How Much Drug..
CDC. Core Elements of Antibiotic Stewardship in Nursing Homes- Appendix B 2015.


18
CDC. Core Elements of Antibiotic Stewardship in Nursing Homes- Appendix B 2015.

Do we know our target?Less is better:
19
Daneman N et al. JAMA Internal Medicine 2015;175:1331-9.

Making the Data ActionableData alone will not answer all the questions, but is allows more refined reviews Who?- Who is writing for the antibiotics? What?- What is the most frequently used antibiotic? Where?- Are there units that tend to use the most antibiotics? When?- Are there times when antibiotics are most likely to be
prescribed? Why? - What is the most common reason antibiotics are used?
From there Conversations become more productive Guidelines for use can be created with provider input Remember- always ask why- the reasons behind the use might not be
what you had guessed!

21