measuring brand loyalty in the pharmaceutical industry of
TRANSCRIPT
Measuring brand loyalty in the Pharmaceutical industry of South Africa
by
Hilde du Plooy 13012061
Mini-dissertation submitted in partial fulfillment of the requirements for
the degree Masters in Business Administration at the
Potchefstroom Business School, Potchefstroom Campus
of the North-West University
Supervisor: Prof. C.A. Bisschoff
November 2012
ii
ABSTRACT
Brands are recognised as one of the most valuable assets that a company can
possess and therefore brands are key role-players in the business strategies of
organisations. The rivalry amongst competitors in the pharmaceutical industry is
fierce and companies should design their strategies in such a way in order to
achieve competitive advantage. Brand loyalty is regarded as a powerful tool in the
development of pharmaceutical brands.
The main aim of this study was to measure brand loyalty in the pharmaceutical
industry of South Africa and to establish whether patients are brand loyal to original
pharmaceutical brands and the influence of generics on pharmaceutical brand
loyalty. The measurement of brand loyalty in the pharmaceutical industry is based on
Moolla’s brand loyalty framework for the FMCG (fast moving consumer goods)
industry. This study also aimed to determine whether Moolla’s FMCG brand loyalty
framework is applicable to the pharmaceutical industry. The twelve brand loyalty
influences identified by Moolla are: Customer satisfaction; Switching costs; Brand
trust; Repeat purchase; Involvement; Perceived value; Commitment; Relationship
proneness; Brand affect; Brand relevance; Brand performance and Culture.
The empirical study was conducted among 250 over-the-counter medicine
consumers with different demographic profiles. The methodology included the
sampling procedure, data collection, questionnaire development and statistical
techniques used. Results were analysed with regards to Factor analysis; the Kaiser-
Meyer-Olkin measure of sampling adequacy; Cronbach Alpha coefficients; Bartlett’s
test of sphericity, mean values and effect sizes. The Empirical results through
quantitative analysis included the validity of the research instruments, the calculation
of the reliability coefficients which reported on the significance of the research
variables. The results were presented in a conceptual framework to measure
pharmaceutical brand loyalty.
The results of this study concluded that the brand loyalty influences as identified by
Moolla are important for measuring pharmaceutical brand loyalty. The results of this
study also concluded that patients are indeed brand loyal and do prefer branded
iii
pharmaceuticals to generic pharmaceuticals in the over-the-counter medicine
industry of South Africa. The importance of this study is the contribution of a brand
loyalty framework to measure pharmaceutical brand loyalty which will aid
pharmaceutical companies in the strategic management thereof.
Keywords: Brand loyalty; over-the-counter medicine; branded pharmaceuticals;
generic pharmaceuticals; pharmaceutical industry.
iv
ACKNOWLEDGEMENTS
An accomplishment like this doesn’t happen without support. It has been a long
journey and I couldn’t have achieved this MBA without the support of the following
people:
My father, Martin du Plooy and mother, Antoinette du Plooy who taught me
that nothing is impossible and who planted the seed of ambition since I was
small. Thank you for your support with every test, exam and finally this
dissertation; thank you for teaching me to never give up and to dream big.
Thank you for always encouraging me and for believing in me every step of
the way. Thank you for all the calls late at night, all the prayers. Thank you for
bringing out the best in me and all the opportunities. I couldn’t have achieved
this without the support of my parents and will be forever grateful to them.
My sister, Talita and my brother, Ryno, for their support and faith in me.
My promoter, Prof. C.A. Bisschoff for his guidance, wisdom and knowledge.
Thank you for your time and for always being willing to help.
Antoinette Bisschoff, for the language, technical and typographical editing of
this dissertation.
The Statistical Services department at the NWU Potchefstroom campus,
especially Dr. S. Ellis for the calculation of the statistical measures.
Francois Hoffmann, an expert in the pharmaceutical marketing industry, for
providing the marketing data of the South African pharmaceutical industry.
All the respondents who completed the questionnaire.
Most importantly, I would like to thank God for guiding me on this path, the road
wasn’t easy but He was there to carry me every step of the way. Thank You for
giving me the talents and the determination to achieve this, this one is for You. It is
my wish that with this MBA I will make a difference to honour God and achieve the
great plans that He has for me.
v
TABLE OF CONTENTS
ABSTRACT...........................................................................................ii
ACKNOWLEDGEMENTS.....................................................................iv
LIST OF FIGURES ...............................................................................ix
LIST OF TABLES..................................................................................x
LIST OF APPENDICES.........................................................................xii
CHAPTER 1: NATURE AND SCOPE OF THE STUDY....….……........1 1.1 INTRODUCTION................................................................................................1
1.2 PROBLEM STATEMENT..................................................................................3
1.3 RESEARCH OBJECTIVES................................................................................4
1.3.1 Primary objectives.........................................................................................4
1.3.2 Secondary objectives....................................................................................4
1.4 RESEARCH METHODOLOGY..........................................................................4
1.4.1 Literature and theoretical review..................................................................4
1.4.2 Empirical Study.............................................................................................5
1.5 LIMITATIONS....................................................................................................5
1.6 CHAPTER DIVISION..........................................................................................6
1.7 DEFINING MAJOR CONCEPTS........................................................................7
1.8 CONCLUSION..................................................................................................10
CHAPTER 2: LITERATURE REVIEW..................................................11
2.1 INTRODUCTION OF BRAND LOYALTY..........................................................11
2.2 PHARMACEUTICAL INDUSTRY OF SOUTH AFRICA....................................12
2.2.1 Over-the-counter medicine in South Africa................................................14
vi
2.2.2 Generic pharmaceuticals in South Africa...................................................17
2.3 MODELS TO MEASURE BRAND LOYALTY...................................................20
2.3.1. Punniyamoorthy & Raj (2007)....................................................................21
2.3.2 Roy (2011).....................................................................................................22
2.4 BENEFITS OF BRAND LOYALTY ...................................................................23
2.5 MOOLLA’S CONCEPTUAL FRAMEWORK TO MEASURE BRAND LOYALTY….............................................................................................................27
2.5.1 Customer satisfaction...................................................................................28
2.5.2 Switching cost/risk aversion........................................................................29
2.5.3 Brand trust.....................................................................................................30
2.5.4 Repeat purchase...........................................................................................32
2.5.5 Involvement...................................................................................................33
2.5.6 Perceived value.............................................................................................34
2.5.7 Commitment..................................................................................................36
2.5.8 Relationship proneness...............................................................................38
2.5.9 Brand affect...................................................................................................38
2.5.10 Brand relevance..........................................................................................39
2.5.11 Brand performance.....................................................................................40
2.5.12 Culture..........................................................................................................41
2.6 CONCLUSION..................................................................................................42
CHAPTER 3: RESEARCH FINDINGS AND DISCUSSION..................43
3.1 INTRODUCTION................................................................................................43
3.2 RESEARCH METHODOLOGY..........................................................................44
3.2.1 Sampling procedure......................................................................................44
3.2.2 Data collection...............................................................................................44
3.2.3 Quesionnaire development..........................................................................45
3.2.4 Data analysis and statistical techniques....................................................46
vii
3.3 EMPIRICAL RESULTS.....................................................................................47
3.3.1 Demographic profile.....................................................................................47
3.3.2 Quantitative analysis...................................................................................51
3.3.2.1 Validity of research instruments..................................................................51
3.3.2.1.1 Customer satisfaction (CUS)...................................................................53
3.3.2.1.2 Switching costs (SCR).............................................................................54
3.3.2.1.3 Brand trust (BTS).....................................................................................56
3.3.2.1.4 Repeat purchase (RPR)...........................................................................57
3.3.2.1.5 Involvement (INV)....................................................................................58
3.3.2.1.6 Perceived value (PVL).............................................................................60
3.3.2.1.7 Commitment (COM).................................................................................61
3.3.2.1.8 Relationship proneness (RPS).................................................................62
3.3.2.1.9 Brand affect (BAF)...................................................................................64
3.3.2.1.10 Brand relevance (BRV)..........................................................................65
3.3.2.1.11 Brand performance (BPF)......................................................................66
3.3.2.1.12 Culture (CUL).........................................................................................67
3.4 RELIABILITY OF RESULTS.............................................................................69
3.5 IMPORTANCE OF RESEARCH VARIABLES..................................................72
3.5.1 Customer satisfaction (CUS).......................................................................73
3.5.2 Switching costs (SCR).................................................................................74
3.5.3 Brand trust (BTS).........................................................................................75
3.5.4 Repeat purchase (RPR)………………………………………………………...76
3.5.5 Involvement (INV)……………………………………………………………......77
3.5.6 Perceived value (PVL)………………………………………………………......78
3.5.7 Commitment (COM)…………………………………………………………......79
3.5.8 Relationship proneness (RPS)……………………………………………......80
3.5.9 Brand affect (BAF)……………………………………………………………....81
3.5.10 Brand relevance (BRV)…………………………………………………….....82
3.5.11 Brand performance (BPF)…………………………………………………....83
viii
3.5.12 Culture (CUL)…………………………………………………………………...84
3.6 SUMMARY OF MEAN VALUES………………………………………………......85
3.6 EFFECT SIZES……………………………………………………………………....87
3.7 CONCLUSION…………………………………………………………………….....89
CHAPTER 4: CONCLUSIONS AND RECOMMENDATIONS…….…..91
4.1 INTRODUCTION………………………………………………………………….... 91
4.2 CONCLUSIONS………………………………….……………………………….....91
4.2.1 Conclusions regarding statistical procedures………………………….....92
4.2.2 Conclusions based on the results for pharmaceutical brand loyalty....93
4.2.3 Conclusions with regards to future research……………………………...95
4.3 RECOMMENDATIONS…………………………………………………………....95
4.3.1 Recommendations regarding statistical procedures………………….....95
4.3.2 Recommendations based on the results for pharmaceutical brand loyalty………………………………………………………………………………….....96
4.3.3 Recommendations with regards to future research………………...…....97
4.4 BRAND LOYALTY FRAMEWORK OF THE PHARMACEUTICAL INDUSTRY……………………………………………………………………................98
4.5 AREAS FOR FUTURE RESEARCH………………………………………….......99
4.6 CONCLUSION……………………………………………………………………....100
REFERENCES………………………………………………………….....101
APPENDIX A……………………………………………………………....107
APPENDIX B……………………………………………………….….......116
APPENDIX C……………………………………………………………....117
ix
LIST OF FIGURES
Figure 2.1: Emerging economies representing the fastest growing pharmaceutical markets…………………......................……….........12
Figure 2.2: Market segmentation of the private retail market of South Africa..................................................................................................13
Figure 2.3: Breakdown of the pharmaceutical industry of South Africa.........14
Figure 2.4: Leading OTC corporations in South Africa …………………..........16
Figure 2.5: Generic and non-generic segmentation of the South African pharmaceutical market....……………………………….......……........19
Figure 2.6: Leading generic companies of South Africa ………………...….....20
Figure 2.7: Model for measuring brand loyalty: Punniyamoorthy and Raj...............................................................................................…....22
Figure 2.8: Three-dimensional model of brand loyalty: Roy............................23
Figure 2.9: A conceptual brand loyalty framework: Moolla …….....................28
Figure 3.1: Gender profile ………………....................………………………….....47
Figure 3.2: Age of participants ……………………………...................................48
Figure 3.3: Income segment of the participants per annum ...........................48
Figure 3.4: Industry of employment of participants ………………...................49
Figure 3.5: Geographic distribution of participants …………..........................50
Figure 3.6: Ethnicity of participants ……………………......................................51
Figure 3.7: Summary of brand loyalty influences of Gaviscon and Gelacid..86
Figure 4.1: A conceptual pharmaceutical brand loyalty framework...….…....98
x
LIST OF TABLES
Table 3.1: Number of items per influence ...............…………………………....46
Table 3.2: KMO and Bartlett's test of customer satisfaction ………..............53
Table 3.3: Factor analysis of customer satisfaction ………………………......53
Table 3.4: KMO and Bartlett’s test of switching costs ….................………...54
Table 3.5: Factor analysis of switching costs …………….............…………...55
Table 3.6: KMO and Bartlett’s test of brand trust ……………………..…........56
Table 3.7: Factor analysis of brand trust ………………………………….........56
Table 3.8: KMO and Bartlett’s test of repeat purchase ………………….........57
Table 3.9: Factor analysis of repeat purchase ……………..………………......57
Table 3.10: KMO and Bartlett test’s of involvement ……………………..….…..58
Table 3.11: Factor analysis of involvement …………………………….………...59
Table 3.12: KMO and Bartlett’s test of perceived value ………………….….....60
Table 3.13: Factor analysis of perceived value ……………………………….....60
Table 3.14: KMO and Bartlett’s test of commitment …………………..……......61
Table 3.15: Factor analysis of commitment ………………………………….......62
Table 3.16: KMO and Bartlett’s test of relationship proneness ……………....62
Table 3.17: Factor analysis of relationship proneness ………………………...63
Table 3.18: KMO and Bartlett’s test of brand affect ……………………….........64
Table 3.19: Factor analysis of brand affect ……………………………………....64
Table 3.20: KMO and Bartlett’s test of brand relevance …………………….....65
Table 3.21: Factor analysis of brand relevance ………………………………....65
Table 3.22: KMO and Bartlett’s test of brand performance ……….....……......66
Table 3.23: Factor analysis of brand performance …………………………......67
Table 3.24: KMO and Bartlett’s test of culture ………………………………......67
Table 3.25: Factor analysis of culture …….....…………………………………....68
xi
Table 3.26: Cronbach alpha coefficient classification………………….............69
Table 3.27: Reliability of the influences and their factors………………….......70
Table 3.28: Interpretation of mean percentage values…………………............72
Table 3.29: Mean scores of customer satisfaction……………………………....73
Table 3.30: Mean scores of switching costs………………………………...........74
Table 3.31: Mean scores of brand trust…………………………………………....75
Table 3.32: Mean scores of repeat purchase…………………………………......76
Table 3.33: Mean scores of involvement………………………………………......77
Table 3.34: Mean scores of perceived value……………….....……………….....78
Table 3.35: Mean scores of commitment…………………………………….........79
Table 3.36: Mean scores of relationship proneness………………………….....80
Table 3.37: Mean scores of brand affect………………………………………......81
Table 3.38: Mean scores of brand relevance…………………………………......82
Table 3.39: Mean scores of brand performance……………..............................83
Table 3.40: Mean scores of culture………………...............................................84
Table 3.41: Summary of mean values of brand loyalty influences….………..85
Table 3.42: Effect size classification………...……..……………….....................87
Table 3.43: Effect sizes of brand loyalty influences…..……………………......88

xii
LIST OF APPENDICES
APPENDIX A: Research questionnaire............................................107
APPENDIX B: Antacid market summary for Gaviscon...................116
APPENDIX C: Antacid market summary for Gelacid......................117
1
CHAPTER ONE
NATURE AND SCOPE OF THE STUDY
1.1 INTRODUCTION
One of the most valuable assets a firm can possess is a well-recognised and
accepted brand (Wang, Wei & Yu, 2008:313). Brands are regarded as key role-
players in the business strategy of leading organisations (Herstein & Zvilling,
2011:188). A brand adds emotional differentiation to the product characteristics and
benefits, it can therefore slow down, stop or prolong commoditisation of a product
(Griffiths, 2008:114). The main purpose of branding is to enhance new products, to
identify the brand and increase repeat purchases (Moolla, 2010:2). Pharmaceutical
brands are relatively young when compared to consumer brands of which 64% of the
best known consumer brands are more than 50 years old (Griffiths, 2008:114).
Branding is important in the pharmaceutical industry due to rising costs of research
and development and therefore it is crucial to build the brand (Blackett & Harrison,
2001:39).
The rivalry amongst competitors in the pharmaceutical industry is fierce and
companies should design their strategies in such a way in order to achieve
competitive advantage (Arranz et al., 2004:17). The pharmaceutical industry is
changing constantly due to new products being introduced continuously. New
product entrants have patent protection but still experience competition from new
improved therapeutic entrants even before the patent expires and generic
alternatives enter the market (Hudson, 1992:111). Low brand loyalty towards a
product will make it easier for new entrants to gain market share (Hudson,
1992:106). Consumer loyalty created through strong brands enhances shareholder
value (Blackett & Harrison, 2001:40). When consumers are loyal to a pharmaceutical
brand, they are willing to pay a higher price for that brand and thereby rewarding
those pharmaceutical companies who offer better products to attend to their needs
(Arranz et al., 2004:10, 15). The reason for practitioners to prescribe more expensive
2
branded medicines rather than inexpensive generic alternatives is due to brand
loyalty (Griffiths, 2008:113).
Brand loyalty can be defined as the extent of faithfulness to a particular brand
(Moolla, 2010:5). Roy (2011:113) defines brand loyalty as the likeliness of the
consumer to switch to another brand when that brand changes its price or product
features. He also states that loyalty is a main indicator of long term financial
performance of companies and has several benefits: greater sales and revenue; a
substantial entry barrier to competitors; increase in a company’s ability to respond to
competitive threats and lower consumer price sensitivity.
Due to the growth in direct-to-consumer marketing and the internet the
pharmaceutical marketers have the ability to go beyond the prescribing practitioner
and target the end user, the consumer who now holds the power (Blackett &
Harrison, 2001:47). Some patients do their own research with regards to what type
of medication and which brand they should use (Saxton, 2011:382).
The South African healthcare industry can be divided into the public and private
sector. In the public sector, medication is either free or a small fee is charged to all
patients in government hospitals, primary healthcare sectors and public healthcare
clinics. Medicine dispensed in the government sector consists of mainly generic
brands. In private pharmacies or hospitals, patients’ medication is mainly paid for by
their medical aid or by the patient. In the private sector the patient has an option to
either choose the generic or the original pharmaceutical brand. Almost half of South
Africa’s healthcare expenditure is accounted for by private insurance schemes, but
the private sector accounts for only 20% of the South African population. The public
sector provides healthcare for up to 80% of the South African population due to the
increase of private healthcare costs, which is beyond the financial reach of most
people (BMI, 2012:32).
The purpose of this study is to measure the brand loyalty of pharmaceutical brands
and determine the factors influencing this phenomenal concept. The problem
statement gives a clear need for further research to determine whether patients are
loyal to original or generic pharmaceutical brands. Objectives are proposed and
divided into primary and secondary objectives. Next, the research methodology will
3
be introduced which includes a literature review and empirical study. In chapter four,
limitations are identified as well as areas for future research and a brief chapter
division is introduced.
1.2 PROBLEM STATEMENT
According to Griffiths (2008:113), there is a lack of academic research connecting
pharmaceutical branding to traditional branding literature. Despite the lack of
research of pharmaceutical brand management, the existence of brands is clear in
the pharmaceutical industry and little has been done to establish brands properly.
Problems associated with regards to establish or build brands in the pharmaceutical
industry are due to patent protection. Once the patent life of the brand expires and
generic alternatives enter the market, brands are rarely further promoted after patent
expiry (Griffiths, 2008:114).
Due to the complexity of pharmaceutical branding, marketers have pursued a new
avenue in pharmaceutical brand management by focusing on patient influence over
recent years. Brand loyalty amongst patients is a powerful tool to influence not only
medical practitioners but also in the development of pharmaceutical brands. The
concept of brand loyalty and the belief in brands are recognised by consumers
(Griffiths, 2008:115, 116).
The main reason for generic substitution is to reduce consumers’ expenditures on
medicines (Sharrad & Hassali, 2011:109). However, generic substitution may not
always be appropriate in certain circumstances where only a branded drug will be
suitable for the patient (Sanyal & Datta, 2011:605). Consumers who are brand loyal
are not willing to compromise drug safety and efficacy for lower prices (Arranz et al.,
2004:17). Some patients refuse to use certain brands even if it is recommended by
their physician, due to the perception that the patient has about that specific brand.
Other consumers are price sensitive and are unwilling to pay expensive prices for
medication (Saxton, 2011:382). Although numerous research has been done to
identify and establish consumer loyalty, there is a need for further research regarding
the development and existence of consumer loyalty within the pharmaceutical
industry (Griffiths, 2008:117).
4
1.3 RESEARCH OBJECTIVES
1.3.1 Primary objectives
The main aim of this study is to measure brand loyalty from a consumer perspective
in the pharmaceutical industry. Secondly, to establish whether patients are brand
loyal to original pharmaceutical brands, and thirdly, to determine the influence of
generic brands on brand loyalty.
1.3.2 Secondary objectives
In order to achieve the primary objectives as mentioned above, the following
secondary objectives are:
Measuring the brand loyalty of the original pharmaceutical brand, Gaviscon.
Measuring the brand loyalty of the generic equivalent of Gaviscon, namely
Gelacid.
Establishing the difference between the brand loyalty of the original
pharmaceutical brand, Gaviscon, compared to the generic pharmaceutical
brand, Gelacid.
To evaluate the measuring instrument used to determine the brand loyalty of
these pharmaceutical medicines.
To determine the reliability of the data presented.
To make recommendations based on the literature review and analysis of
research data in order to measure brand loyalty.
1.4 RESEARCH METHODOLOGY
1.4.1 Literature and theoretical review
A literature review was done to determine the factors influencing brand loyalty.
Secondly, literature was reviewed to determine whether patients are brand loyal to
original pharmaceutical brands and the influence of generic brands on brand loyalty.
5
1.4.2 Empirical study
The study focuses on the measurement of pharmaceutical brand loyalty and based
on the research problem and the objectives of the research the following empirical
research approach was followed:
Quantitative research was conducted by using a questionnaire as a measuring
instrument to test the hypothesis in the context of two pharmaceutical brands, one
being the original brand, Gaviscon compared to its generic equivalent, Gelacid. The
sample used to conduct the research was based in South Africa, ranging across
different age, socio-economic, ethnicity and gender groups. The quantitative
research was used to find solutions to the following research questions:
1. Which factors influence brand loyalty in the consumers’ choice of
pharmaceutical brands?
2. Do patients prefer original pharmaceutical brands to generic brands?
3. Is Moolla’s brand loyalty framework relevant to pharmaceutical brands?
The questionnaire measured brand loyalty based on Moolla’s brand loyalty
framework, which proposed twelve factors which determine the level of brand loyalty.
Moolla (2010:11) developed the questionnaire based on marketing literature and
through consultations with academics specialising in the marketing field. The
questionnaire included 50 closed questions which were based on the 12 factors
identified.
1.5 LIMITATIONS
Firstly, the research was conducted using over-the-counter medicine brands and the
results may not be applicable to prescription brands. Secondly, the proposed model
is only tested in the South African culture and further studies should be conducted to
get a global perspective. Thirdly, other factors influencing brand loyalty like the role
of the prescribers, pharmaceutical sales representatives and pharmacists have not
been included in this study. Resultantly, this study is performed from a consumer
6
perspective and the results, therefore, should be interpreted with this limitation in
mind.
1.6 CHAPTER DIVISION
The dissertation is divided into the following chapters:
CHAPTER 1: NATURE AND SCOPE OF THE STUDY Chapter one identified the primary and secondary objectives of this study and also
addresses the need to measure brand loyalty in the pharmaceutical industry of South
Africa. Chapter one also further elaborated on the structure of this study.
CHAPTER 2: LITERATURE REVIEW Chapter two included a literature review of the South African pharmaceutical
industry, and especially focused on the generic pharmaceutical industry and the
over-the-counter medication industry. Chapter two also reflected on the concept of
brand loyalty, the benefits of brand loyalty and Moolla’s brand loyalty framework for
the fast moving consumer goods industry.
CHAPTER 3: RESEARCH FINDINGS AND DISCUSSION Chapter three presented the research methodology and elaborated on the methods
used to conduct this study. It also included the analysis of the data and the empirical
results of this study. The empirical results focused on the demographic profile of the
respondents, the validity of the questionnaire, the reliability of the results as well the
importance of the research variables.
CHAPTER 4: CONCLUSIONS AND RECOMMENDATIONS Chapter four, which is the final chapter of this study, presented the adapted
framework to measure pharmaceutical brand loyalty. Chapter four provided
conclusions and recommendations with regards to the statistical procedures used
and the results obtained within this study as well as areas for future research.
7
1.7 DEFINING MAJOR CONCEPTS
Brand: “A name, term, sign, symbol, design, or a combination of these that identifies
the product or services of one seller or a group of sellers and differentiates them
from those of competitors” (Kotler & Armstrong, 2010:255).
Brand affect: The total positive or negative evaluation of the brand (Matzler et al.,
2006:428).
Brand commitment: An inclination to resist change and the desire to maintain a
relationship (Jang et al., 2008:61).
Brand equity: Aaker (quoted by Ambler et al., 2002:14) defines brand equity as “a
set of assets and liabilities linked to a brand, its name and symbol that add to or
subtract from the value provided by a product or service to a firm and/or that firm’s
customers”.
Brand involvement: A state of interest towards a brand that cannot be observed
and it is related to behaviour and purpose (Moolla, 2010:131).
Brand loyalty: The likeliness of the consumer to switch to another brand when that
brand changes its price or product features (Roy, 2011:113).
Brand performance: A measurement of a brand’s success (O’Cass & Ngo,
2007:15).
Brand relevance: The alignment of a brand, its brand identity and personality with
the needs and wants of its target market and therefore satisfies a specific need of
the consumer (Moolla & Bisschoff, 2012b:83).
Brand trust: A multi-dimensional concept which includes psychological variables
that portray a collection of combined presumptions which all relate to the integrity,
benevolence and trustworthiness that the consumer assigns to a brand (Louis &
Lombart, 2010:117).
Competitive advantage: “An advantage over competitors gained by offering great
customer value, either through lower prices or by providing more benefits that justify
higher prices” (Kotler & Armstrong, 2010:234).
8
Competitive marketing strategies: “Strategies that strongly position the company
against competitors and that give the company the strongest possible strategic
advantage” (Kotler & Armstrong, 2010:552).
Consumer buyer behaviour: “The buying behaviour of final consumers (individuals
and households) that buy goods and services for personal consumption” (Kotler &
Armstrong, 2010:159).
Consumer involvement: A consumer’s perceived relevance of the product which is
based on the consumer’s intrinsic values, interests and needs (Xue, 2008:87;
Boisvert & Ashill, 2011:519).
Culture: The combined mindset that differentiates one group of people from another
(Lam, 2007:8).
Customer equity: “The total combined customer lifetime values of all of the
company’s customers” (Kotler & Armstrong, 2010:47).
Customer satisfaction: “The extent to which a product’s perceived performance
matches a buyer’s expectations” (Kotler & Armstrong, 2010:37).
Drug: A specific chemical entity with therapeutic effects with a proprietary or non-
proprietary name (Scott Morton, 2000:1090).
Generic: “a Class of substances bearing the same biological properties and is a
synonym for recognised or non-proprietary names” (Sanyal & Datta, 2011:606).
IMS: A firm which collects and processes different types of pharmaceutical data and
sells the information to customers, which are mostly pharmaceutical companies
(Scott Morton, 2000:1090).
Market share: “Company sales divided by market sales” (Kotler & Armstrong,
2010:G5).
Marketing: “The process by which companies create value for customers and build
strong customer relationships in order to capture value from customers in return”
(Kotler & Armstrong, 2010:29).
9
Marketing strategy: “The marketing logic by which the business unit hopes to
create customer value and achieve profitable customer relationships” (Kotler &
Armstrong, 2010:72).
OTC: Over-the-counter medication is medication that does not require a prescription
from a medical practitioner; it can be purchased freely and is regulated by health
authorities through over-the-counter monographs which contain the approved
ingredients, dosage instructions, formulation and labelling of medication (DeLorme et
al., 2010:209).
Patented medication: An innovative medicine granted intellectual property
protection by the patent and trademark office. The patent may encompass a wide
range of claims – such as active ingredient, formulation and mode of action, giving
the patent holder the sole right to sell the drug while the patent is in effect (BMI,
2012:99).
Perceived value: The outcome derived from evaluating the product’s features by the
consumer or the consumer’s verdict about the supremacy or excellence of the
product (Sanyal & Datta, 2011:606).
Pharmaceutical market: The sum of revenues generated by generic, patented, and
over-the-counter (OTC) medication through hospitals, retail pharmacies and other
channels (BMI, 2012:99).
Prescription medication: Patented and generic medication regulated by legislation
that requires a physician’s prescription before they can be sold to a patient (BMI,
2012:99).
Relationship proneness: A consumer’s deliberate and constant tendency to
connect with a particular product through a relationship with that product (Bloemer et
al., 2003:231).
Repeat purchase: The degree to which consumers re-purchase the same brand
measured through an equal-length time period (Punniyamoorthy & Raj, 2007:225).
Switching costs: The costs incurred by the consumer due to switching from one
brand to another (Dick & Basu, 1994:104; Rhodes, 2012).
10
1.8 CONCLUSION
This chapter concluded the nature and the scope of this study and identified the
following:
The purpose of this study.
The problem statement and the need to measure brand loyalty in the
pharmaceutical industry.
The primary and secondary objectives were identified based on the problem
statement.
The research methodology used to conduct this study which included a
literature review and an empirical study.
Limitations were identified and presented.
A description of the structure of this dissertation with a brief overview of each
chapter and the areas of research conducted in each.
Major concepts were defined.
Chapter two reflects on the South African pharmaceutical industry which includes an
overview of the over-the-counter medication industry and the generic pharmaceutical
industry. Chapter two will also discuss the literature of brand loyalty and the
development thereof from a single-dimension to a multi-dimensional construct. The
benefits of brand loyalty to both consumers and companies will be discussed and the
conceptual framework developed by Moolla for the FMCG (fast moving consumer
goods) industry.
11
CHAPTER 2
LITERATURE REVIEW
2.1 INTRODUCTION OF BRAND LOYALTY
One of the predicaments that companies are facing today is how to make consumers
more loyal to their brand (Kim et al., 2008:99; SAS, 2012). Brand loyalty has been
debated in academic literature over the past eight decades (Punniyamoorthy & Raj,
2007:222, 223; Kim et al., 2008:99). The first time research on brand loyalty was
published, was in 1923 through the work of Copeland and since then several
definitions and measurement tools have been developed (Knox & Walker, 2001:111;
Lam, 2007:8). Researchers have investigated this phenomenon in order to identify
the elements that form the foundation of this consumer-brand relationship
(Punniyamoorthy & Raj, 2007:223).
Brand loyalty has also been used by companies as a tool to measure the success of
a marketing strategy and to measure brand equity (Knox & Walker, 2001:111).
Jacoby and Chestnut, as quoted by Kim et al. (2008:100), define brand loyalty as an
influenced behavioural reaction over a certain period of time by a decision-making
authority from a selection of brands, which includes psychological processes. Thus
brand loyalty includes both behavioural and psychological measurements (Knox &
Walker, 2001:113).
Brand loyalty, according to Aaker, in Roy (2011:112), reflects how likely a customer
will switch to another brand, when that brand changes its price or enhances its
product features. Brand loyalty leads to brand equity, which in turn leads to business
profitability (Roy, 2011:113).
12
2.2 PHARMACEUTICAL INDUSTRY OF SOUTH AFRICA
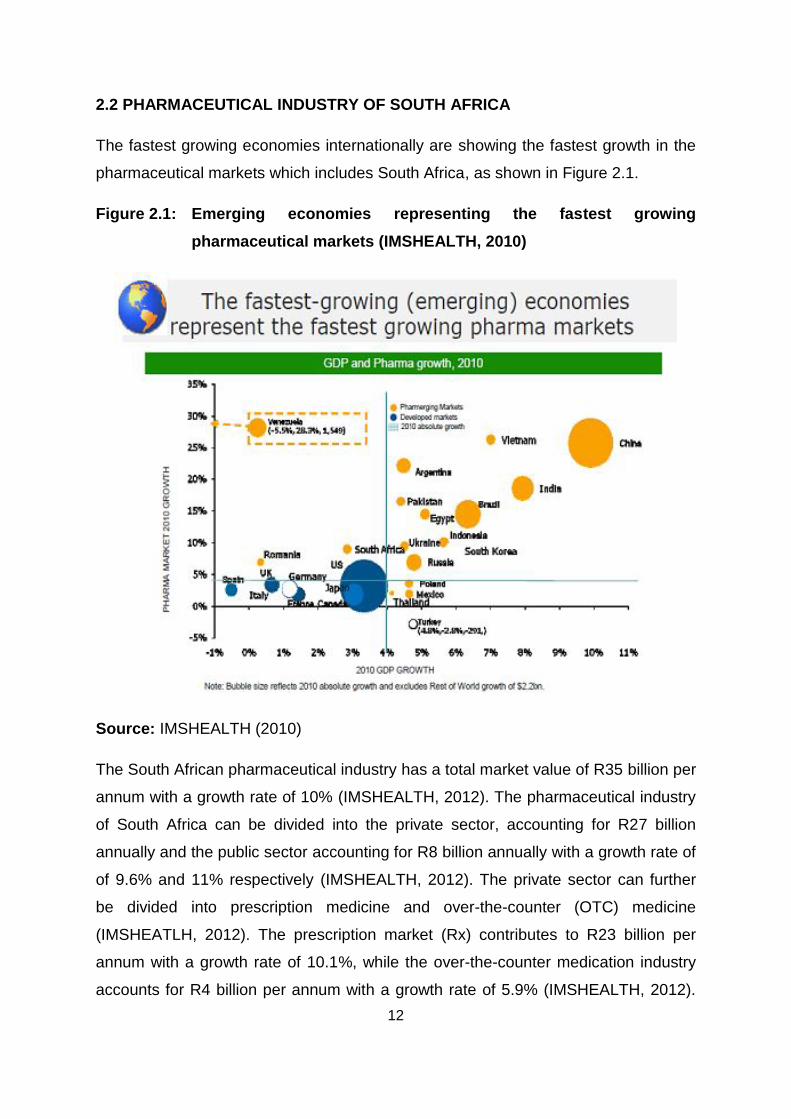
The fastest growing economies internationally are showing the fastest growth in the
pharmaceutical markets which includes South Africa, as shown in Figure 2.1.
Figure 2.1: Emerging economies representing the fastest growing pharmaceutical markets (IMSHEALTH, 2010)
Source: IMSHEALTH (2010)
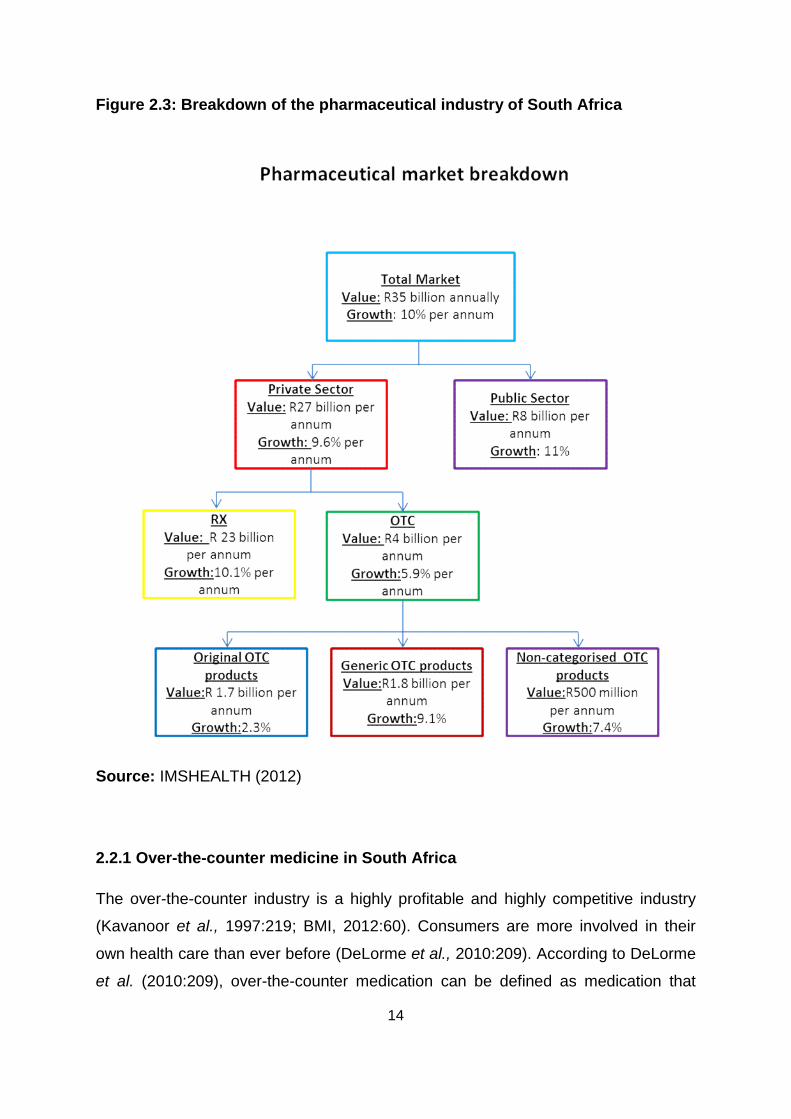
The South African pharmaceutical industry has a total market value of R35 billion per
annum with a growth rate of 10% (IMSHEALTH, 2012). The pharmaceutical industry
of South Africa can be divided into the private sector, accounting for R27 billion
annually and the public sector accounting for R8 billion annually with a growth rate of
of 9.6% and 11% respectively (IMSHEALTH, 2012). The private sector can further
be divided into prescription medicine and over-the-counter (OTC) medicine
(IMSHEATLH, 2012). The prescription market (Rx) contributes to R23 billion per
annum with a growth rate of 10.1%, while the over-the-counter medication industry
accounts for R4 billion per annum with a growth rate of 5.9% (IMSHEALTH, 2012).
13
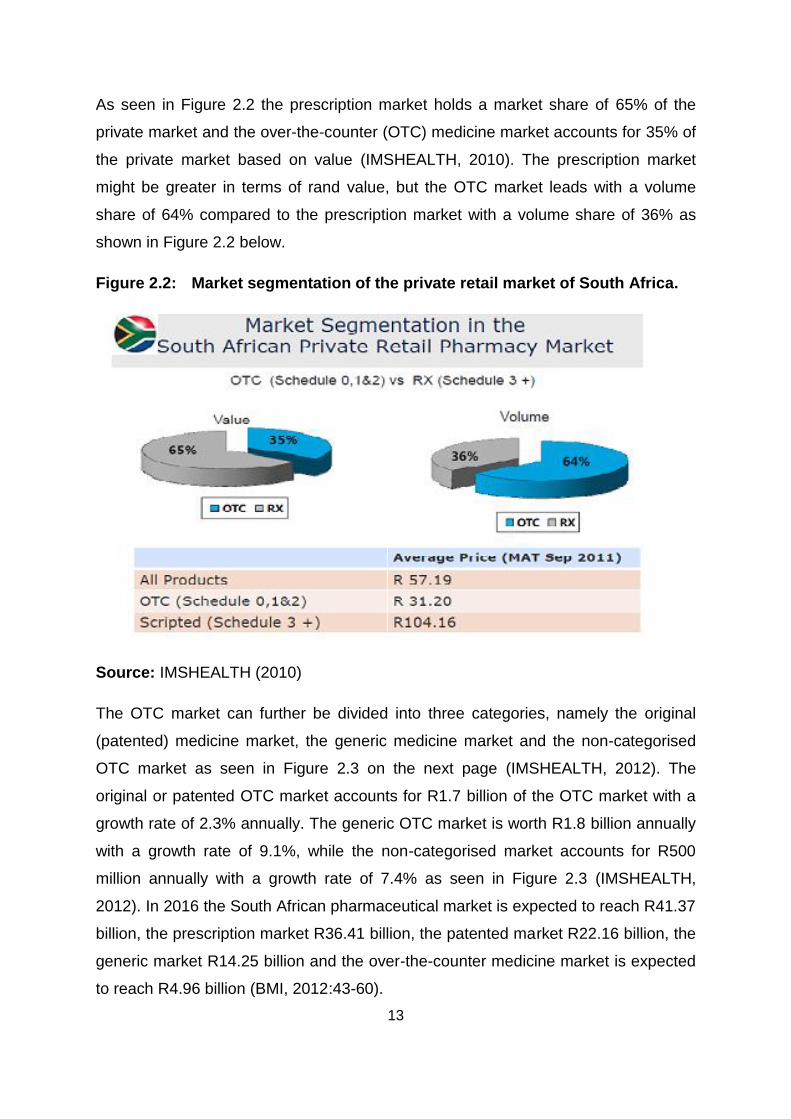
As seen in Figure 2.2 the prescription market holds a market share of 65% of the
private market and the over-the-counter (OTC) medicine market accounts for 35% of
the private market based on value (IMSHEALTH, 2010). The prescription market
might be greater in terms of rand value, but the OTC market leads with a volume
share of 64% compared to the prescription market with a volume share of 36% as
shown in Figure 2.2 below.
Figure 2.2: Market segmentation of the private retail market of South Africa.
Source: IMSHEALTH (2010)
The OTC market can further be divided into three categories, namely the original
(patented) medicine market, the generic medicine market and the non-categorised
OTC market as seen in Figure 2.3 on the next page (IMSHEALTH, 2012). The
original or patented OTC market accounts for R1.7 billion of the OTC market with a
growth rate of 2.3% annually. The generic OTC market is worth R1.8 billion annually
with a growth rate of 9.1%, while the non-categorised market accounts for R500
million annually with a growth rate of 7.4% as seen in Figure 2.3 (IMSHEALTH,
2012). In 2016 the South African pharmaceutical market is expected to reach R41.37
billion, the prescription market R36.41 billion, the patented market R22.16 billion, the
generic market R14.25 billion and the over-the-counter medicine market is expected
to reach R4.96 billion (BMI, 2012:43-60).
14
Figure 2.3: Breakdown of the pharmaceutical industry of South Africa
Source: IMSHEALTH (2012)
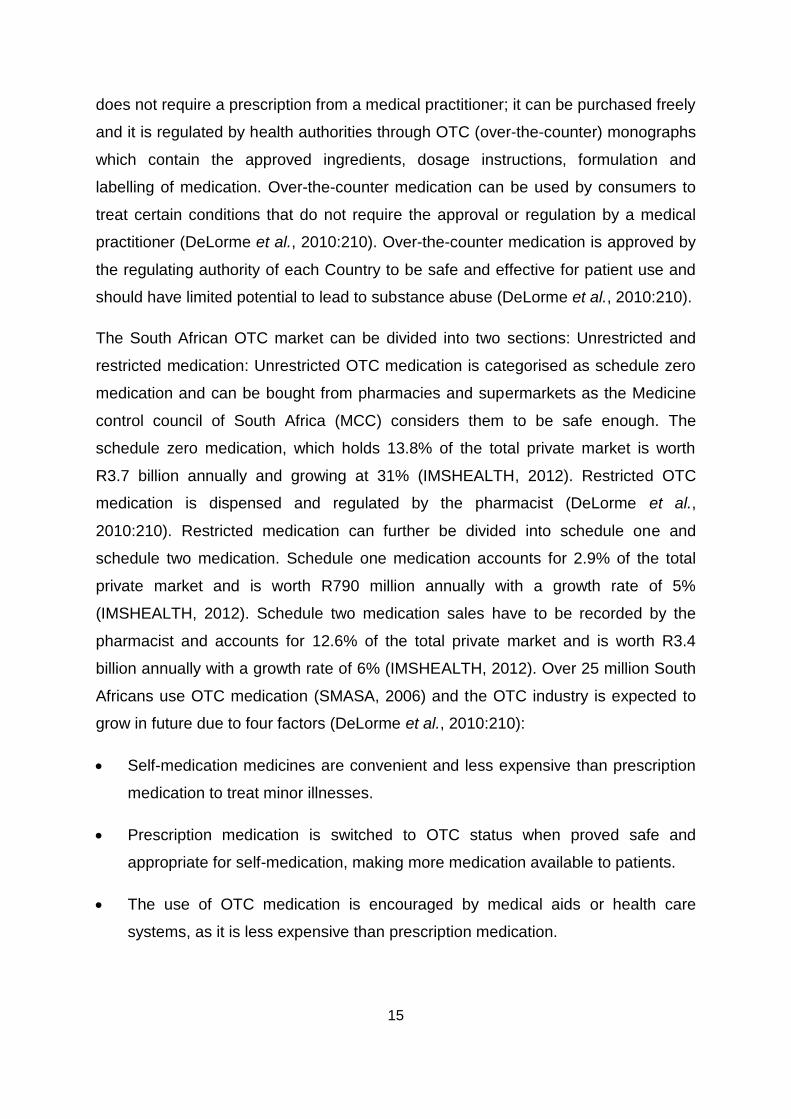
2.2.1 Over-the-counter medicine in South Africa
The over-the-counter industry is a highly profitable and highly competitive industry
(Kavanoor et al., 1997:219; BMI, 2012:60). Consumers are more involved in their
own health care than ever before (DeLorme et al., 2010:209). According to DeLorme
et al. (2010:209), over-the-counter medication can be defined as medication that
15
does not require a prescription from a medical practitioner; it can be purchased freely
and it is regulated by health authorities through OTC (over-the-counter) monographs
which contain the approved ingredients, dosage instructions, formulation and
labelling of medication. Over-the-counter medication can be used by consumers to
treat certain conditions that do not require the approval or regulation by a medical
practitioner (DeLorme et al., 2010:210). Over-the-counter medication is approved by
the regulating authority of each Country to be safe and effective for patient use and
should have limited potential to lead to substance abuse (DeLorme et al., 2010:210).
The South African OTC market can be divided into two sections: Unrestricted and
restricted medication: Unrestricted OTC medication is categorised as schedule zero
medication and can be bought from pharmacies and supermarkets as the Medicine
control council of South Africa (MCC) considers them to be safe enough. The
schedule zero medication, which holds 13.8% of the total private market is worth
R3.7 billion annually and growing at 31% (IMSHEALTH, 2012). Restricted OTC
medication is dispensed and regulated by the pharmacist (DeLorme et al.,
2010:210). Restricted medication can further be divided into schedule one and
schedule two medication. Schedule one medication accounts for 2.9% of the total
private market and is worth R790 million annually with a growth rate of 5%
(IMSHEALTH, 2012). Schedule two medication sales have to be recorded by the
pharmacist and accounts for 12.6% of the total private market and is worth R3.4
billion annually with a growth rate of 6% (IMSHEALTH, 2012). Over 25 million South
Africans use OTC medication (SMASA, 2006) and the OTC industry is expected to
grow in future due to four factors (DeLorme et al., 2010:210):
Self-medication medicines are convenient and less expensive than prescription
medication to treat minor illnesses.
Prescription medication is switched to OTC status when proved safe and
appropriate for self-medication, making more medication available to patients.
The use of OTC medication is encouraged by medical aids or health care
systems, as it is less expensive than prescription medication.
16
With the use of the internet, people are more involved and empowered with their
own health which increases self-medicating.
Patients are more likely to switch to over-the-counter medicines during economic
recessions, as they are easier to obtain, less expensive and may postpone
expensive treatments by temporarily treating the patient’s problematic symptoms
(BMI, 2012:16). Therefore, despite difficult economic conditions, consumers have
remained loyal to certain branded OTC medicines, especially to older brands that
they trust (DeLorme et al., 2010:210).
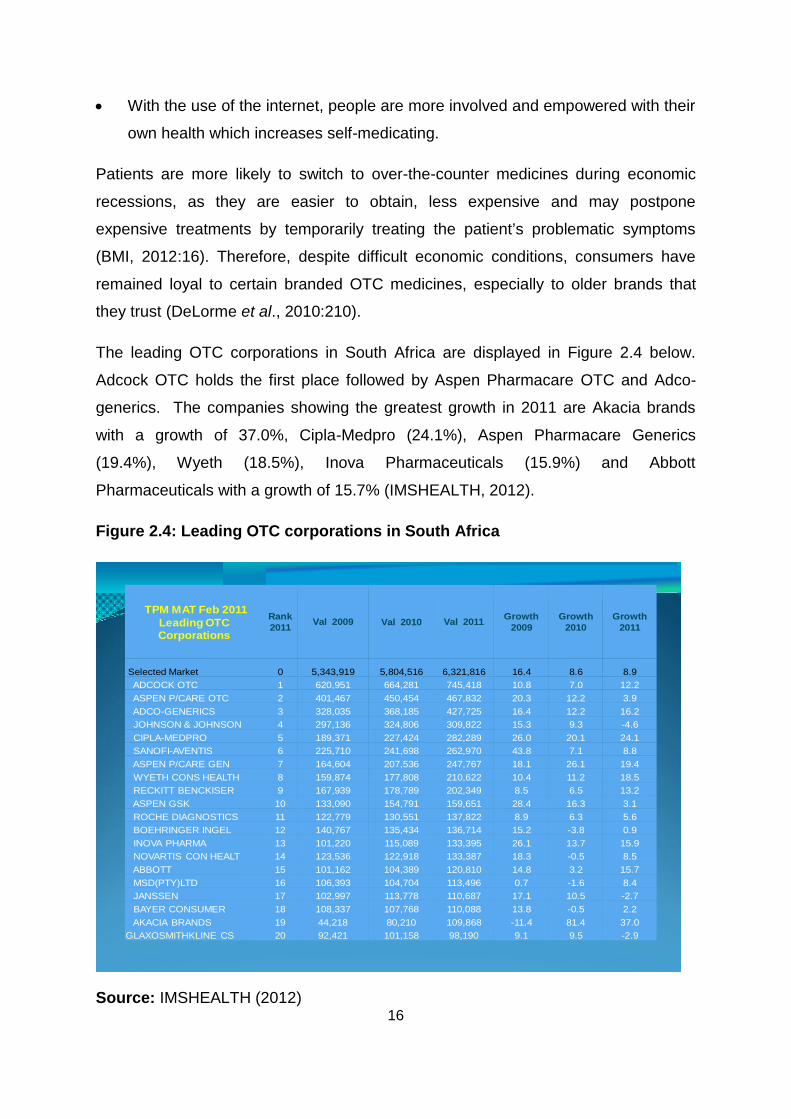
The leading OTC corporations in South Africa are displayed in Figure 2.4 below.
Adcock OTC holds the first place followed by Aspen Pharmacare OTC and Adco-
generics. The companies showing the greatest growth in 2011 are Akacia brands
with a growth of 37.0%, Cipla-Medpro (24.1%), Aspen Pharmacare Generics
(19.4%), Wyeth (18.5%), Inova Pharmaceuticals (15.9%) and Abbott
Pharmaceuticals with a growth of 15.7% (IMSHEALTH, 2012).
Figure 2.4: Leading OTC corporations in South Africa
TPM MAT Feb 2011 Leading OTC Corporations
Rank 2011 Val 2009 Val 2010 Val 2011 Growth
2009Growth
2010Growth
2011
Selected Market 0 5,343,919 5,804,516 6,321,816 16.4 8.6 8.9ADCOCK OTC 1 620,951 664,281 745,418 10.8 7.0 12.2ASPEN P/CARE OTC 2 401,467 450,454 467,832 20.3 12.2 3.9ADCO-GENERICS 3 328,035 368,185 427,725 16.4 12.2 16.2JOHNSON & JOHNSON 4 297,136 324,806 309,822 15.3 9.3 -4.6CIPLA-MEDPRO 5 189,371 227,424 282,289 26.0 20.1 24.1SANOFI-AVENTIS 6 225,710 241,698 262,970 43.8 7.1 8.8ASPEN P/CARE GEN 7 164,604 207,536 247,767 18.1 26.1 19.4WYETH CONS HEALTH 8 159,874 177,808 210,622 10.4 11.2 18.5RECKITT BENCKISER 9 167,939 178,789 202,349 8.5 6.5 13.2ASPEN GSK 10 133,090 154,791 159,651 28.4 16.3 3.1ROCHE DIAGNOSTICS 11 122,779 130,551 137,822 8.9 6.3 5.6BOEHRINGER INGEL 12 140,767 135,434 136,714 15.2 -3.8 0.9INOVA PHARMA 13 101,220 115,089 133,395 26.1 13.7 15.9NOVARTIS CON HEALT 14 123,536 122,918 133,387 18.3 -0.5 8.5ABBOTT 15 101,162 104,389 120,810 14.8 3.2 15.7MSD(PTY)LTD 16 106,393 104,704 113,496 0.7 -1.6 8.4JANSSEN 17 102,997 113,778 110,687 17.1 10.5 -2.7BAYER CONSUMER 18 108,337 107,768 110,088 13.8 -0.5 2.2AKACIA BRANDS 19 44,218 80,210 109,868 -11.4 81.4 37.0
GLAXOSMITHKLINE CS 20 92,421 101,158 98,190 9.1 9.5 -2.9
Source: IMSHEALTH (2012)
17
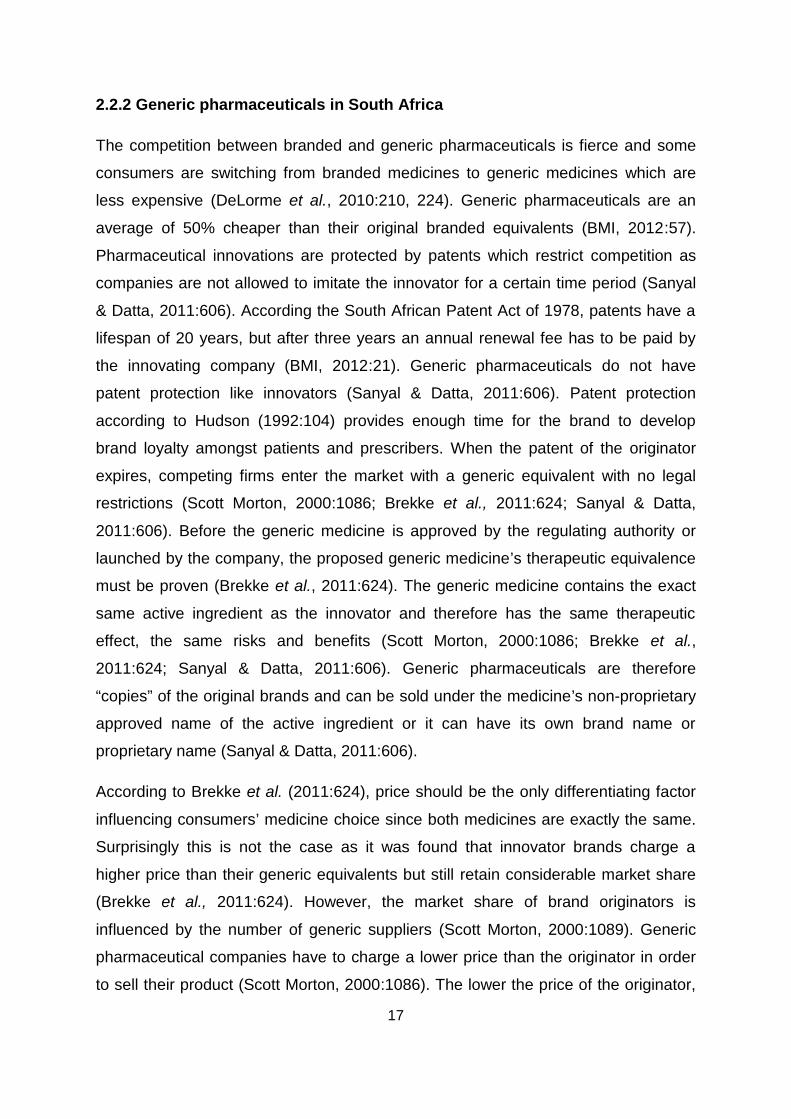
2.2.2 Generic pharmaceuticals in South Africa
The competition between branded and generic pharmaceuticals is fierce and some
consumers are switching from branded medicines to generic medicines which are
less expensive (DeLorme et al., 2010:210, 224). Generic pharmaceuticals are an
average of 50% cheaper than their original branded equivalents (BMI, 2012:57).
Pharmaceutical innovations are protected by patents which restrict competition as
companies are not allowed to imitate the innovator for a certain time period (Sanyal
& Datta, 2011:606). According the South African Patent Act of 1978, patents have a
lifespan of 20 years, but after three years an annual renewal fee has to be paid by
the innovating company (BMI, 2012:21). Generic pharmaceuticals do not have
patent protection like innovators (Sanyal & Datta, 2011:606). Patent protection
according to Hudson (1992:104) provides enough time for the brand to develop
brand loyalty amongst patients and prescribers. When the patent of the originator
expires, competing firms enter the market with a generic equivalent with no legal
restrictions (Scott Morton, 2000:1086; Brekke et al., 2011:624; Sanyal & Datta,
2011:606). Before the generic medicine is approved by the regulating authority or
launched by the company, the proposed generic medicine’s therapeutic equivalence
must be proven (Brekke et al., 2011:624). The generic medicine contains the exact
same active ingredient as the innovator and therefore has the same therapeutic
effect, the same risks and benefits (Scott Morton, 2000:1086; Brekke et al.,
2011:624; Sanyal & Datta, 2011:606). Generic pharmaceuticals are therefore
“copies” of the original brands and can be sold under the medicine’s non-proprietary
approved name of the active ingredient or it can have its own brand name or
proprietary name (Sanyal & Datta, 2011:606).
According to Brekke et al. (2011:624), price should be the only differentiating factor
influencing consumers’ medicine choice since both medicines are exactly the same.
Surprisingly this is not the case as it was found that innovator brands charge a
higher price than their generic equivalents but still retain considerable market share
(Brekke et al., 2011:624). However, the market share of brand originators is
influenced by the number of generic suppliers (Scott Morton, 2000:1089). Generic
pharmaceutical companies have to charge a lower price than the originator in order
to sell their product (Scott Morton, 2000:1086). The lower the price of the originator,
18
the lower the price of the generic product has to be (Scott Morton, 2000:1086). In
certain circumstances a branded drug is more suitable for the patient than the
generic; this is due to the perception of the brand, its respective name and the most
recent innovation of medication available (Sanyal & Datta, 2011:604). Another
limiting factor to the growth in the generic market’s share will be the reluctance of
consumers and prescribers to change consumptions patterns, as branded
pharmaceuticals continue to be regarded as superior (BMI, 2012:57). Medical
practitioners like doctors and pharmacists play an important role in deciding whether
patients receive the brand or the generic equivalent (Scott Morton, 2000:1088).
In the South African pharmaceutical market, the use of generic medicine is promoted
strongly. By law, a pharmacist is required to offer the generic alternative to the
patient for any branded medicine if available (SMASA, 2006). Exceptions can be
made if the patient refuses substitution or if the prescribing doctor has forbidden
generic substitution. Substitution is also excluded if the generic version costs more
than the original prescribed medication or if the generic has been declared as non-
suitable by the Medicine Control Council (MCC) of South Africa (BMI, 2012:58). The
pharmacist is also required to inform the patient about the benefits of generic
substitution which mainly is a cost benefit. The patient has the right to decide
whether or not to substitute the branded medicine for a generic medicine and
substitution will always take place with the patient’s consent (SMASA, 2006). The
price elasticities of demand of the product’s consumers also determine whether the
patient will purchase the brand or the generic equivalent (Scott Morton, 2000:1095).
If the patient has a medical aid which covers the cost of the medication and if the
patient is more concerned with the quality of the medication, the patient may not buy
a generic product even though it is available (Scott Morton, 2000:1088).
The South African government compiled the National Drug Policy for South Africa in
order to ensure that the medication patients receive is effective, safe and meet
certain standards and specifications as governed by the legislative council, the MCC
(Medicine Control Council). What is interesting is that the South African government
promotes the use of generic medication in order to achieve their aim which is to
promote the availability of safe, effective medication at the lowest possible cost
(SMASA, 2006). The demand for generic entry is further promoted by the increasing
19
number of consumers with an elastic demand like chronic patients and hospital
buyers (Scott Morton, 2000:1087).
Due to the increase in generic competition, new pharmaceutical product launches by
originator pharmaceutical companies are not generating enough revenue to account
for the loss experienced due to generic competition (IMSHEALTH, 2010).
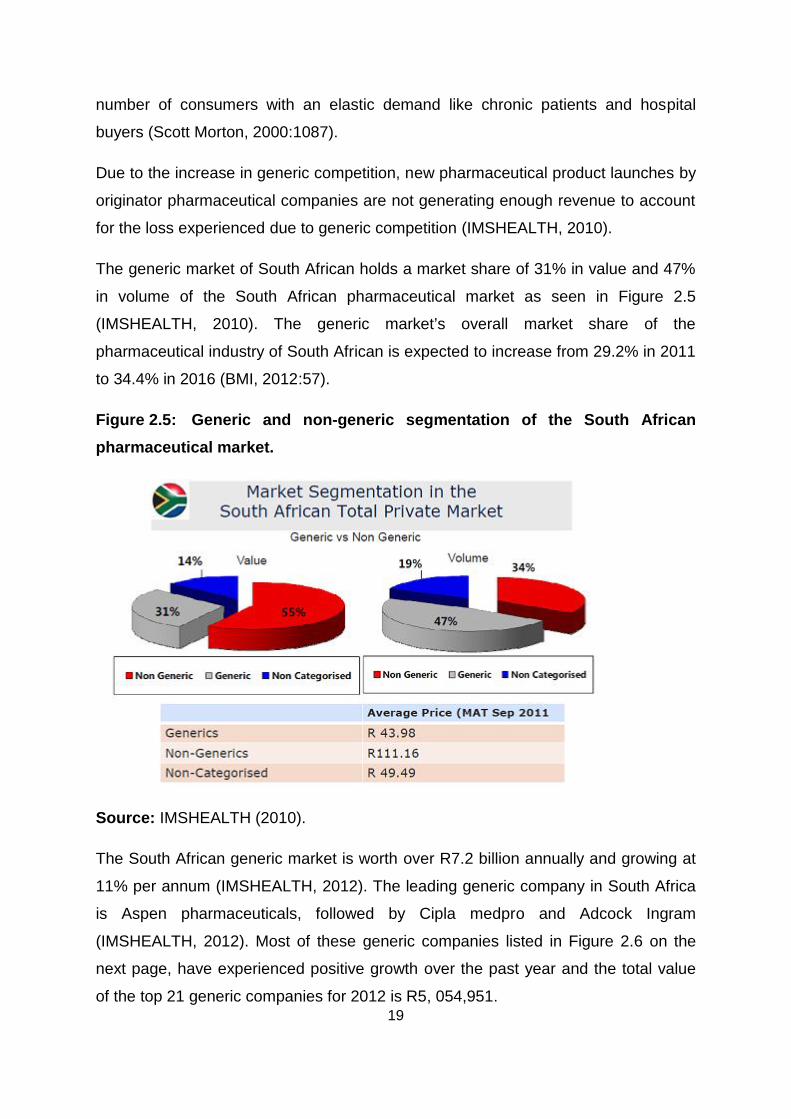
The generic market of South African holds a market share of 31% in value and 47%
in volume of the South African pharmaceutical market as seen in Figure 2.5
(IMSHEALTH, 2010). The generic market’s overall market share of the
pharmaceutical industry of South African is expected to increase from 29.2% in 2011
to 34.4% in 2016 (BMI, 2012:57).
Figure 2.5: Generic and non-generic segmentation of the South African pharmaceutical market.
Source: IMSHEALTH (2010).
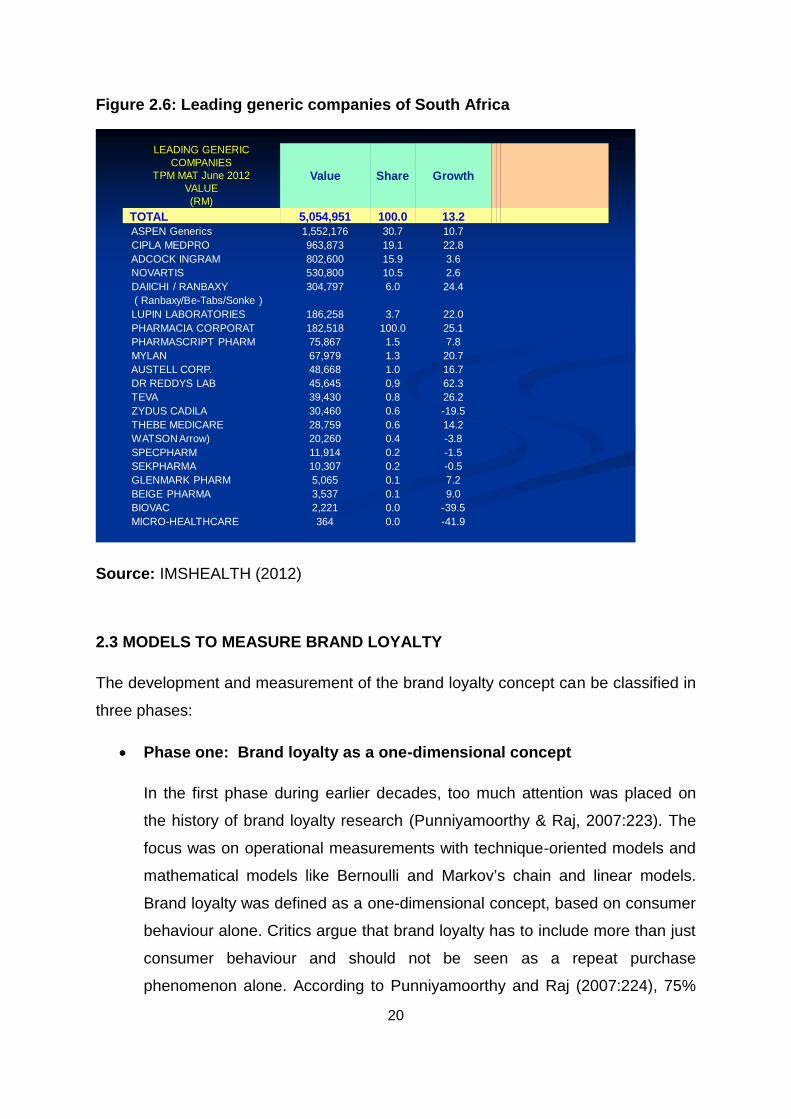
The South African generic market is worth over R7.2 billion annually and growing at
11% per annum (IMSHEALTH, 2012). The leading generic company in South Africa
is Aspen pharmaceuticals, followed by Cipla medpro and Adcock Ingram
(IMSHEALTH, 2012). Most of these generic companies listed in Figure 2.6 on the
next page, have experienced positive growth over the past year and the total value
of the top 21 generic companies for 2012 is R5, 054,951.
20
Figure 2.6: Leading generic companies of South Africa
LEADING GENERIC COMPANIES
TPM MAT June 2012VALUE(RM)
Value Share Growth
TOTAL 5,054,951 100.0 13.2ASPEN Generics 1,552,176 30.7 10.7CIPLA MEDPRO 963,873 19.1 22.8ADCOCK INGRAM 802,600 15.9 3.6NOVARTIS 530,800 10.5 2.6DAIICHI / RANBAXY 304,797 6.0 24.4( Ranbaxy/Be-Tabs/Sonke )LUPIN LABORATORIES 186,258 3.7 22.0PHARMACIA CORPORAT 182,518 100.0 25.1PHARMASCRIPT PHARM 75,867 1.5 7.8MYLAN 67,979 1.3 20.7AUSTELL CORP. 48,668 1.0 16.7DR REDDYS LAB 45,645 0.9 62.3TEVA 39,430 0.8 26.2ZYDUS CADILA 30,460 0.6 -19.5THEBE MEDICARE 28,759 0.6 14.2WATSON Arrow) 20,260 0.4 -3.8SPECPHARM 11,914 0.2 -1.5SEKPHARMA 10,307 0.2 -0.5GLENMARK PHARM 5,065 0.1 7.2BEIGE PHARMA 3,537 0.1 9.0BIOVAC 2,221 0.0 -39.5MICRO-HEALTHCARE 364 0.0 -41.9
Source: IMSHEALTH (2012)
2.3 MODELS TO MEASURE BRAND LOYALTY
The development and measurement of the brand loyalty concept can be classified in
three phases:
Phase one: Brand loyalty as a one-dimensional concept
In the first phase during earlier decades, too much attention was placed on
the history of brand loyalty research (Punniyamoorthy & Raj, 2007:223). The
focus was on operational measurements with technique-oriented models and
mathematical models like Bernoulli and Markov’s chain and linear models.
Brand loyalty was defined as a one-dimensional concept, based on consumer
behaviour alone. Critics argue that brand loyalty has to include more than just
consumer behaviour and should not be seen as a repeat purchase
phenomenon alone. According to Punniyamoorthy and Raj (2007:224), 75%
21
of consumers’ purchase decisions are based on both emotion and attitude.
Just as behavioural patterns cannot be used as a single measurement,
attitudinal measures alone are also insufficient. Therefore it can be argued
that both of these measures should be used together to determine consumer
brand loyalty, which leads to the second phase in the development of the
brand loyalty concept.
Phase 2: Brand loyalty as a two-dimensional concept
Oliver, as quoted by Punniyamoorthy and Raj (2007:224) defines brand
loyalty as a commitment to rebuy a specific product or service repeatedly in
future and therefore instigates same-brand purchasing regardless of
situational influences and promotional variations which can lead to switching
behaviour. Thus both attitudinal and behavioural measures are included in
Oliver’s definition which is also re-enforced by Jacoby and Chestnut, as
quoted by Punniyamoorthy and Raj (2007:224), that brand loyalty is an
influenced, behavioural response which occurs over a period of time, by a
decision-making unit with a wide range of brands and it is a function of
psychological processes.
Phase 3: Brand loyalty as a multi-dimensional concept
In the third phase of the development of the brand loyalty concept, it can be
viewed as a multi-dimensional construct which includes many psychological
processes and a variety of measurements.
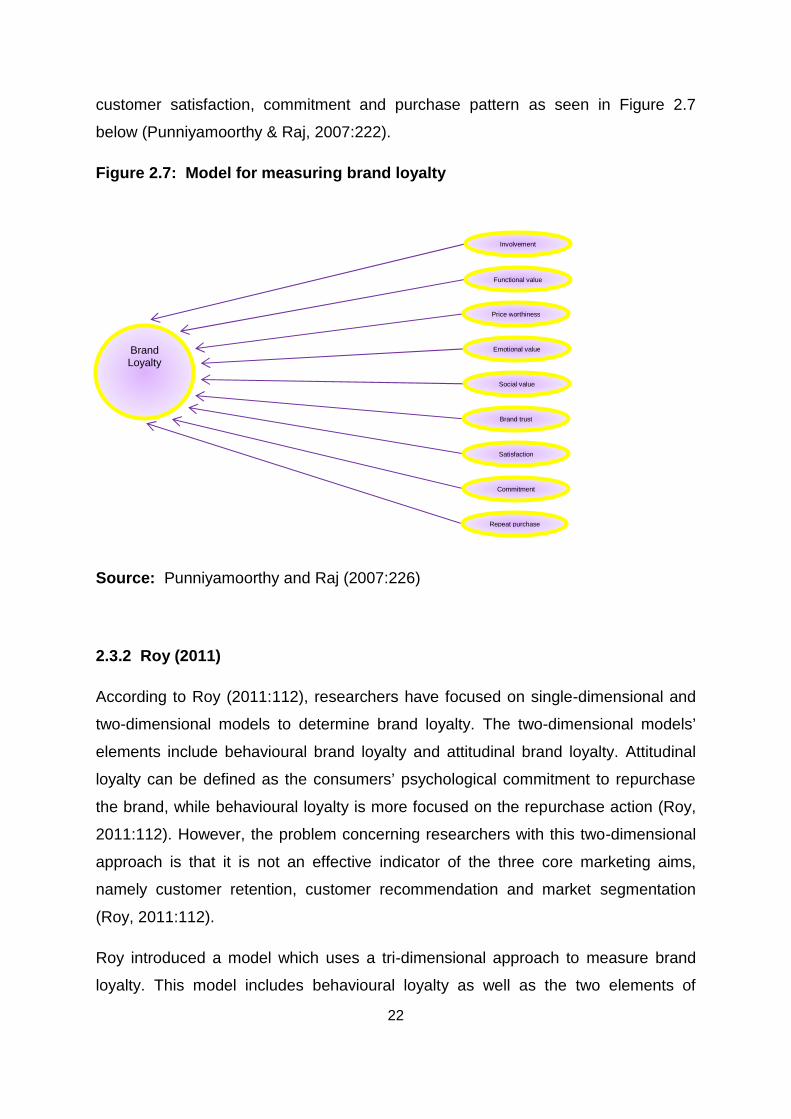
2.3.1. Punniyamoorthy and Raj (2007)
Punniyamoorthy and Raj (2007:222, 223) developed an empirical model for
measuring brand loyalty. The model identifies factors which influence brand loyalty
with regards to consumer behaviour. This empirical model includes both behavioural
and attitudinal attributes, since the consumer has a strong psychological attachment
to the brand consumed. They identified several factors that have an effect on the
level of consumer brand loyalty, namely: involvement, perceived value, brand trust,
22
customer satisfaction, commitment and purchase pattern as seen in Figure 2.7
below (Punniyamoorthy & Raj, 2007:222).
Figure 2.7: Model for measuring brand loyalty
Source: Punniyamoorthy and Raj (2007:226)
2.3.2 Roy (2011)
According to Roy (2011:112), researchers have focused on single-dimensional and
two-dimensional models to determine brand loyalty. The two-dimensional models’
elements include behavioural brand loyalty and attitudinal brand loyalty. Attitudinal
loyalty can be defined as the consumers’ psychological commitment to repurchase
the brand, while behavioural loyalty is more focused on the repurchase action (Roy,
2011:112). However, the problem concerning researchers with this two-dimensional
approach is that it is not an effective indicator of the three core marketing aims,
namely customer retention, customer recommendation and market segmentation
(Roy, 2011:112).
Roy introduced a model which uses a tri-dimensional approach to measure brand
loyalty. This model includes behavioural loyalty as well as the two elements of
Brand Loyalty
Involvement
Functional value
Price worthiness
Emotional value
Social value
Brand trust
Satisfaction
Commitment
Repeat purchase
23
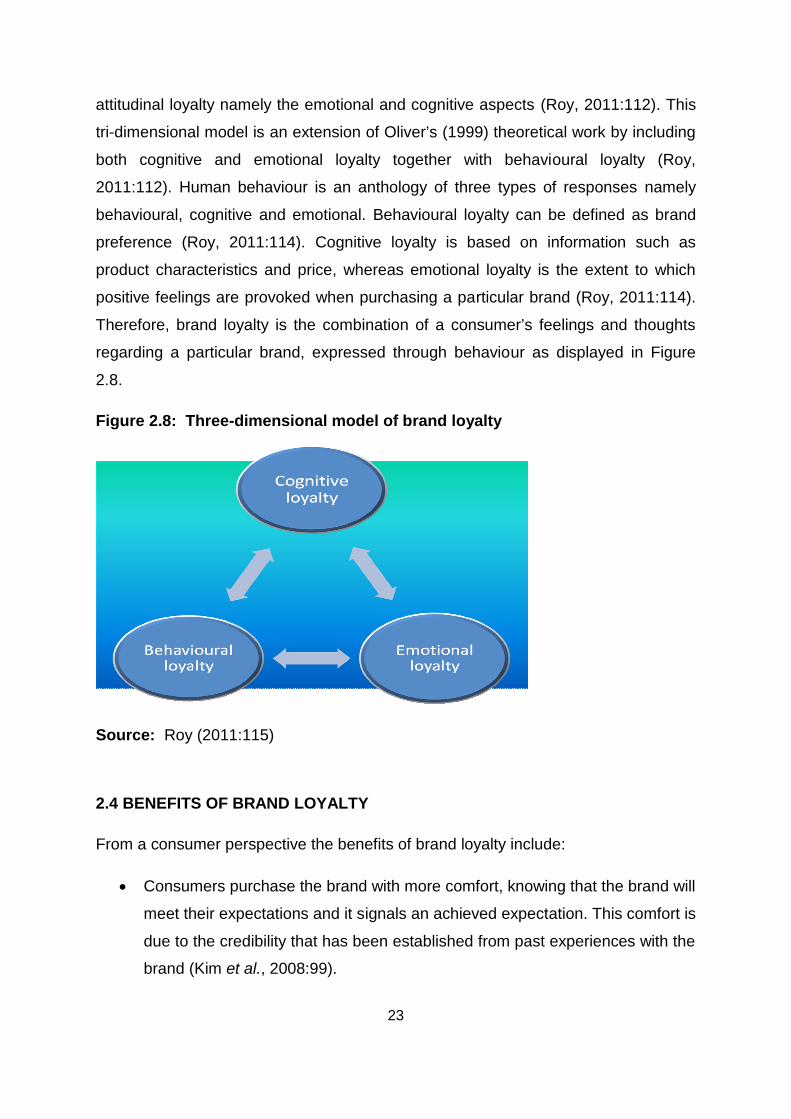
attitudinal loyalty namely the emotional and cognitive aspects (Roy, 2011:112). This
tri-dimensional model is an extension of Oliver’s (1999) theoretical work by including
both cognitive and emotional loyalty together with behavioural loyalty (Roy,
2011:112). Human behaviour is an anthology of three types of responses namely
behavioural, cognitive and emotional. Behavioural loyalty can be defined as brand
preference (Roy, 2011:114). Cognitive loyalty is based on information such as
product characteristics and price, whereas emotional loyalty is the extent to which
positive feelings are provoked when purchasing a particular brand (Roy, 2011:114).
Therefore, brand loyalty is the combination of a consumer’s feelings and thoughts
regarding a particular brand, expressed through behaviour as displayed in Figure
2.8.
Figure 2.8: Three-dimensional model of brand loyalty
Source: Roy (2011:115)
2.4 BENEFITS OF BRAND LOYALTY
From a consumer perspective the benefits of brand loyalty include:
Consumers purchase the brand with more comfort, knowing that the brand will
meet their expectations and it signals an achieved expectation. This comfort is
due to the credibility that has been established from past experiences with the
brand (Kim et al., 2008:99).
24
The benefits of brand loyalty which emphasise its importance to companies,
according to Delgado-Ballester & Munuera-Aleman (2005:188) are:
An extensive barrier to entry to competitors.
An increase in net revenue and sales.
Improvement in the company’s’ ability to respond to competitive threats.
Customers are less sensitive to competitors’ promotional efforts.
Roy (2011:114) agrees with the above stated benefits and adds that brand loyalty
leads to an increase in organisational profitability; reduction in customer price
sensitivity and a reduction of costs to attract new customers.
Brand loyalty also increases brand equity by lowering vulnerability to competitors’
marketing strategies, it increased profit margins, increases the effect of marketing
communication and generates more opportunities for licensing or brand extensions
(Jang et al., 2008:62; Kim et al., 2008:99). Brand loyalty also allows the company to
charge premium brand prices and greater trade leverage (Degado-Ballester &
Munuera-Aleman, 2005:189).
Amine (1998:313) states two benefits of brand loyalty: consumers’ confidence in the
brand which enhances brand support and a positive word of mouth about the brand.
If consumers have confidence in a brand they purchase, they are less likely to switch
to other brands despite influences like price, availability or the entrance of new
competitive brands. Consumers will also defend their brand against negative rumors,
which is an added benefit to companies in a time of crisis or when the brand is out of
stock. It was also found that in highly competitive industries, brand loyalty can benefit
the company by securing a sustainable position in the marketplace which leads to a
competitive advantage (Amine, 1998:305).
Moolla (2010:89) identified the following benefits of brand loyalty:
Higher sales volume (Moolla, 2010:89)
One of the greatest challenges that companies are facing today is the loss of
their consumers. The average company loses 13% of their consumers
25
annually. By building brand loyalty amongst consumers it will enhance not
only the consumer retention rate but also lead to business growth.
Premium pricing ability and lower price elasticity (Moolla, 2010:89)
Consumers who are brand loyal are less sensitive to price fluctuations than
those who are not brand loyal. These loyal consumers are also willing to pay
a premium price for their preferred brand, as they believe it offers them a
distinctive value which other brands cannot.
Retain rather than seek customer acquisition (Moolla, 2010:89)
It is four to six times less expensive for companies to retain their existing
consumers than to attract new ones. Brand loyal consumers are less likely to
switch to competitive brands and are therefore less sensitive to competitors’
marketing efforts.
Creating perceptions (Moolla, 2010:91)
The price and quality of a product has a direct influence on the consumer’s
perception of the product, as premium pricing creates the perception of a
higher quality product and therefore a greater value to the consumer.
Companies and especially brand managers should bear this in mind when
setting brand prices. It is also important to note that the importance of the
price of the product is linked to the situation of the consumer and the
availability of time to search for alternative products.
Increased usage and spending (Moolla, 2010:91)
Research has shown that the perceived quality of a product has an effect on
consumers’ expenditures and usage of the product as consumers are more
inclined to purchase brands which they perceive as a quality brand. The
perceived quality of a brand is therefore linked to brand loyalty and will
influence the repeat purchase behaviour of consumers. Consumers are more
likely to purchase brands which portray value as to repeating the selection
process of brands with every shopping experience. A positive brand
experience will also lead to more consistent purchasing patterns and the
26
consumer is more likely to purchase line extensions of that brand due to trust
in the reputation of the company.
Contribution to Return on Investment (ROI) and enhanced return
Aaker (2012:43) explains that the perceived quality or value of a product
contributes more to the company’s return on investment (ROI) than marketing
overheads, product development or market share. Thus by increasing the
perceived quality of a brand, a company will indirectly be increasing their
return on investment.
Financial benefits
Research has shown that financial benefits to companies follow consumer
brand loyalty. The longer the relationship exists between the company and the
consumer, the greater the financial benefits of brand loyalty will be to the
company (Moolla, 2010:91). Other financial benefits to the company include
referrals, cost savings, revenue growth, an increase in base profit and the
ability to charge premium prices (Moolla, 2010:92). According to Kim et al.,
(2008:99), a general study performed by Bain & Co. showed that a 5%
increase in consumer loyalty can increase the profitability of a company by
40% to 95% and an increase of consumer loyalty of 1% is equivalent to a cost
reduction of 10%.
Referrals
Loyal consumers are satisfied customers and will therefore act as
representatives for companies through positive word of mouth referrals
(Moolla, 2010:94). Not only is this beneficial to companies in terms of
reducing advertising expenditures needed but it also reduces customer
acquisition costs (Moolla, 2010:94).
27
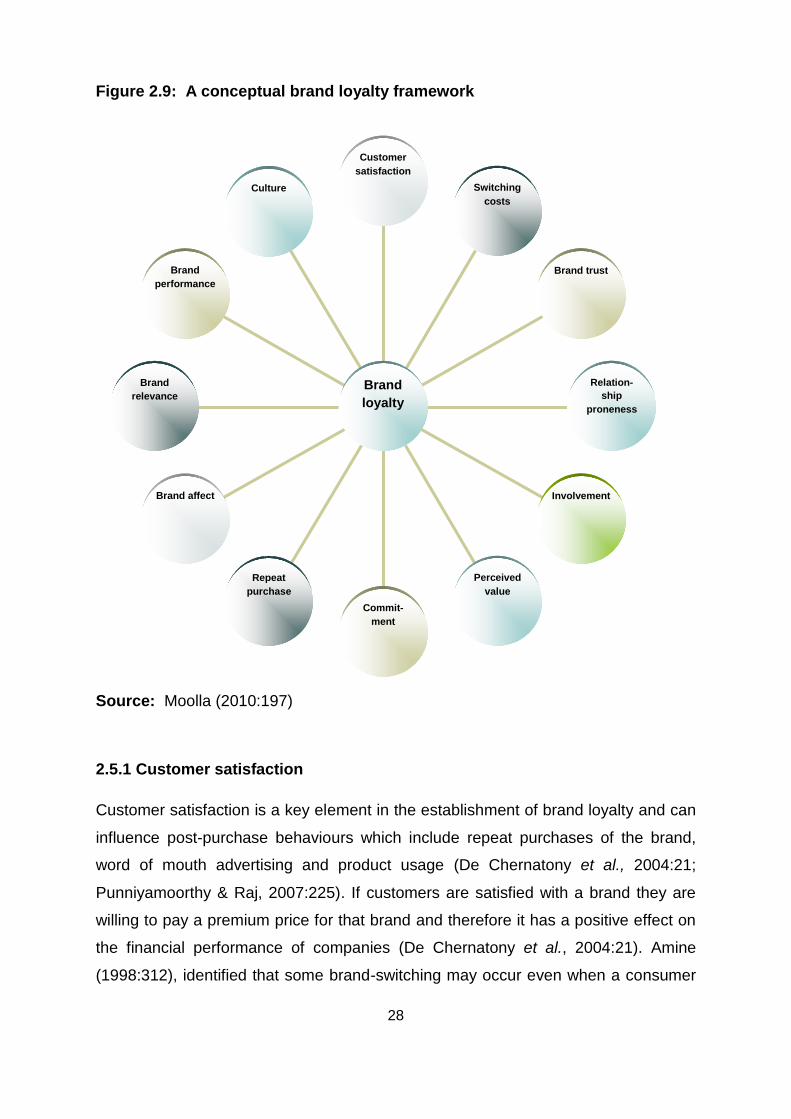
2.5 MOOLLA’S CONCEPTUAL FRAMEWORK TO MEASURE BRAND LOYALTY
Moolla developed a brand loyalty conceptual framework to identify the factors that
influence behaviour related to brand loyalty. The conceptual framework was
developed through research of historical brand loyalty models and identified the
twelve most important influences of brand loyalty (Moolla & Bisschoff, 2012b:75).
Moolla’s conceptual framework to measure consumer brand loyalty includes the
following twelve factors as shown in Figure 2.9 on the next page: customer
satisfaction; brand trust; switching costs; involvement; commitment; perceived value;
repeat purchase; brand affect; relationship proneness; brand relevance; brand
performance and culture (Moolla, 2010:197).
The aim of the study was to identify the most significant factors that are playing a
role when measuring brand loyalty in the fast moving consumer goods (FMCG)
industry. Moolla conducted an empirical study among a sample of 550 consumers
who all had access to a diverse range of fast moving consumer goods (Moolla &
Bisschoff, 2012a:101). The empirical study measured the twelve factors influencing
brand loyalty as well as the interrelationship between these factors (Moolla,
2010:12).
The results confirmed that brand loyalty is influenced differently by each of these
twelve factors in the FMCG industry. It was also found that the psychological
influences had a greater effect on brand loyalty than the brand performance
influences (Moolla, 2010:IV). The importance of this study is the establishment of a
conceptual framework in order to measure and therefore manage consumer brand
loyalty.
The conceptual framework is applicable to marketing and brand managers to
determine which specific brand loyalty influences are the most important for their
products and to identify where their products fall short (Moolla & Bisschoff,
2012b:75).
28
Source: Moolla (2010:197)
2.5.1 Customer satisfaction
Customer satisfaction is a key element in the establishment of brand loyalty and can
influence post-purchase behaviours which include repeat purchases of the brand,
word of mouth advertising and product usage (De Chernatony et al., 2004:21;
Punniyamoorthy & Raj, 2007:225). If customers are satisfied with a brand they are
willing to pay a premium price for that brand and therefore it has a positive effect on
the financial performance of companies (De Chernatony et al., 2004:21). Amine
(1998:312), identified that some brand-switching may occur even when a consumer
Culture
Brand performance
Brand relevance
Brand affect
Repeat purchase
Commit-ment
Perceived value
Involvement
Relation-ship
proneness
Brand trust
Switching costs
Customer satisfaction
Brand loyalty
Figure 1: Conceptual Brand Loyalty Framework
Figure 2.9: A conceptual brand loyalty framework
29
is satisfied with a brand due to other influences like lower prices. Fullerton (2005:97),
found that commitment intercedes the relationship between customer satisfaction
and repeat purchase intentions of consumers. Customer satisfaction is seen as an
attitude-like measurement after a customer purchases a brand and predecessors of
customer satisfaction are perceived quality, customer expectations and perceived
value (De Chernatony et al., 2004:22).
Fullerton (2005:97), defines customer satisfaction as the customer’s overall
measurement of the experience of owning or consuming a product. The relationship
between customer satisfaction and repeat purchases of a brand is positively related
to customer retention (Fullerton, 2005:97). It was also found that consumers’ positive
emotional relations with a brand are driven by a series of satisfactory experiences
(Fullerton, 2005:97).
Most of the companies today have a measurement system for customer satisfaction
to ensure their performance is in line or better than their competitors’. Customer
satisfaction is also a predictor of the possible success and profits that a company
can expect to earn. If consumers are loyal, the customer retention rate is high and
therefore business performance is likely to follow (Adams, 2003).
Customer satisfaction is the most frequently used variable to measure brand loyalty.
It is also the total effect of several encounters over a certain time period between the
consumer and the brand (Moolla, 2010:127). If consumers perceive a product to be
of a good quality it leads to customer satisfaction towards that product (Sanyal &
Datta, 2011:605).
2.5.2 Switching cost/risk aversion
Switching costs can be defined as the costs incurred by the consumer due to
switching from one brand to another (Dick & Basu, 1994:104; Rhodes, 2012).
Consumers will switch to another or a cheaper brand if their attitudinal loyalty
towards their current brand is low. The difference in price between two brands can
be used as an indication to test the reason for the repurchase of a brand and
determine whether the consumer has a high brand loyalty towards a particular brand
(Amine, 1998:307).
30
Two factors influencing switching behaviour is the product quality and product
features of the brand (Knox & Walker, 2001:120). Brand switching may be
encouraged when there is a change in the buying habits of the consumer and brand
loyalty is low (Amine, 1998:308). When consumers are brand loyal, they are less
likely to switch to another brand even though small price fluctuations occur within
their preferred brand (Amine, 1998:314). According to Scott Morton (2000:1095),
switching costs is one of the key influences which will determine how quickly generic
brands gain market share from the original pharmaceutical brands.
Companies can increase the perceived risk associated with brand substitution in
order to make consumers more committed to their brand (Amine, 1998:314, 315).
Moolla (2010:128), identified three types of switching costs: transaction costs,
learning costs and artificial costs. Transaction costs can be defined as those costs at
the beginning of a relationship with a supplier. Learning costs can be defined as the
effort or energy required by the consumer to establish the same degree of comfort
with a new brand as they had with a previous brand (Moolla, 2010:128). Artificial or
contractual costs are costs occurring through intentional measures by companies
like discounts and loyalty rewards (Moolla, 2010:128). Switching costs can be a
barrier when the consumer considers switching to another brand, especially if the
buyer anticipates high switching costs (Moolla, 2010:128).
2.5.3 Brand trust
Brand trust can be defined as the inclination by the typical consumer to rely on the
brand’s ability to execute the function for which it is purchased for (Chaudhuri &
Holbrook, 2001:83). Another definition states that brand trust is the confidence that
one will find what is preferred and not what is feared and that one’s vulnerability will
not be exploited (Delgado-Ballester & Munuera-Aleman, 2005:188).
Brand trust is a multi-dimensional concept which includes psychological variables
that portray a collection of combined presumptions which all relate to the integrity,
benevolence and trustworthiness that the consumer assigns to the brand (Louis &
Lombart, 2010:117). Based on this definition, a brand will be perceived as credible if
it meets the expected performance that is assumed by the consumer; a brand will be
of integrity if it is perceived as honest and delivers the claims promised; a brand is
31
benevolent if it takes consumers’ interests to heart (Louis & Lombart, 2010:117). For
consumers to trust a brand, it means that there is a high expectancy that the brand
will bring a positive outcome to the customer (Delgado-Ballester & Munuera-Aleman,
2005:188).
The development of brand trust leads to a positive and encouraging attitude towards
a brand and it is therefore a central element to build a long term relationship with the
consumer. Brand trust is the key factor on which relationships are built and it
requires an emotional commitment from the consumer which in turn leads to
sustainable brand loyalty (Delgado-Ballester & Munuera-Aleman, 2005:187;
Punniyamoorthy & Raj, 2007:225; Louis & Lombart, 2010:119).
A trustworthy brand is one that keeps its promise of value to its customers; this is
done through the way the product is developed, serviced, advertised, produced and
sold (Delgado-Ballester & Munuera-Aleman, 2005:188). Brand trust is a two-
dimensional concept which includes (Delgado-Ballester & Munuera-Aleman,
2005:188):
The first dimension: Reliability, the ability and willingness to keep promises
and satisfy consumers’ needs.
The second dimension: Intentions, the attribution of good intentions to the
brand which is in line with the needs of the consumer.
When consumers have trust in the brand they purchase it can be seen as a leverage
of the brand’s credibility which will reinforce consumers’ repeat purchases of the
brand and enhance their level of brand loyalty towards the brand (Amine, 1998:314).
Trust is the fundamental driver of loyalty as it creates an exchange relationship that
is valued by both parties (Delgado-Ballester & Munuera-Aleman, 2005:189).
Therefore in this case, brand loyalty focuses on the consumer’s attitude towards the
brand and not only on repeat purchase behaviour (Delgado-Ballester & Munuera-
Aleman, 2005:189). The higher the degree of trust in a brand, the higher the
consumer loyalty to that brand and the higher the degree of brand loyalty (Moolla,
2010:129).
32
Brand trust does not only influence the consumer’s brand loyalty but also that of
medical practitioners. Sanyal and Datta (2011:605), state that doctors’ prescription
behaviour is influenced by numerous aspects of which brand trust in the
pharmaceutical company is one of the key influences.
Company reputation is an important factor to develop brand trust amongst
consumers as a good reputation reduces the perceived risk of making a wrong
choice (Moolla, 2010:129). A good reputation of a company increases exit barriers
for current consumers, while it lowers entry barriers for new customers (Moolla,
2010:129). If consumers have trust in the brand, they are also willing to give the
brand a second chance should there be any mistakes on the part of the company
like during out of stock situations. For companies, the ultimate marketing aim is to
create a bond between the brand and the consumer which is built on brand trust
(Delgado-Ballester & Munuera-Aleman, 2005:189, 193).
Companies should position their brands in such a way that it offers a promise of a
certain level of value to consumers. Company resources such as brand trust and
brand loyalty cannot be purchased or replicated by competitors. When brand trust
and brand loyalty are combined, it forms a greater resource namely brand equity,
which leads to a sustainable, resourced-based competitive advantage (Delgado-
Ballester & Munuera-Aleman, 2005:192-195).
2.5.4 Repeat purchase
The continuous repurchase of a brand is a loyalty-prone behaviour which is the
foundation of brand loyalty (Punniyamoorthy & Raj, 2007:226). Repeat purchase
behaviour can also be defined as the degree to which consumers re-purchase the
same brand measured through an equal-length time period (Knox & Walker,
2001:113; Punniyamoorthy & Raj, 2007:226).
After a series of frequent repeat purchases of a brand, the consumer forms a habit of
buying that brand which leads to the establishment of brand loyalty. Once this
behavioural brand loyalty has been founded, it is unlikely for the consumer to switch
to a different brand (Punniyamoorthy & Raj, 2007:226). Repeat purchases depend
on the consumer’s evaluation of the perceived value that a brand offers. Loyal
consumers use repeat purchasing of a brand to reduce the risk involved in product
33
purchases (Knox & Walker, 2001:121). The ultimate success of a brand is
dependent on the loyal customers who purchase the brand frequently (Amine,
1998:206).
One of the aims of a company’s marketing strategy is to assist the process of
consumers repurchasing a brand (Knox & Walker, 2001:112). The importance of
repeat purchasing behaviour is important to companies, because it requires less
marketing resources to retain consumers than to recruit new ones (Knox & Walker,
2001:112).
Repeat purchases can also be made due to the habit of buying the same brand; this
reduces search efforts and is less time consuming for consumers. It is therefore
important to establish whether repeat purchases are made due to brand commitment
which underlies brand loyalty or just to reduce search efforts which would indicate a
lower level of brand loyalty and a more likely chance to switch to other brands
(Amine, 1998:306, 309). Research has shown diverse sources for repeat purchase
behaviour which can be categorised into three sections: cognitive motives, affective
motives and purchase decisions due to a lack of alternative choices, store loyalty or
lower prices (Amine, 1998:310). The former group of repeat purchase behaviour is
not an indication of brand loyalty as it does not meet the requirements as defined in
the definition of brand loyalty: a behavioural response which includes psychological
processes (Moolla, 2010:60). Consumer loyalty is based on a high level of
commitment which leads to the repurchasing of a brand by the consumer (Jang et
al., 2008:62).
2.5.5 Involvement
The level of consumer involvement in a brand category has been identified as a
major influence relevant to strategy and in the building of strong brands (Shukla,
2004:84; Swoboda et al., 2009:953). Involvement includes a continuous commitment
of the consumer which incorporates thoughts, emotions and behaviour towards a
product and it is a multi-dimensional construct (Quester & Lim, 2003:24, 25).
Consumer involvement can be defined as the degree of personal significance of a
brand to the consumer (McWilliam, 1997:60; Knox & Walker, 2001:115). Product
involvement can also be seen as the degree to which a product is rooted and driven
34
by the consumer’s value system (Quester & Lim, 2003:24). Certain conditions like
financial, physical or psycho-social risk factors stimulate the need for involvement
(McWilliam, 1997:60). Consumer involvement is also identified as a consumer’s
perceived relevance of the product which is based on the consumer’s intrinsic
values, interests and needs (Xue, 2008:87; Boisvert & Ashill, 2011:519). Involvement
reveals the perceived relevance of the product to the consumer on a continuous
basis (Quester & Lim, 2003:24). Involvement is important as it prevents consumers
from switching to other brands (Shukla, 2004:97).
Several researchers support the relationship between involvement and brand loyalty,
especially attitudinal loyalty was highly correlated with involvement (Quester & Lim,
2003:22; Punniyamoorthy & Raj, 2007:224; Moolla, 2010:131). The greater the level
of involvement, the greater the level of brand loyalty (Punniyamoorthy & Raj,
2007:224). High product involvement also signals a greater emotional attachment to
the brand involved (Swoboda et al., 2009:956).
Consumer involvement is seen as an indirect source and predecessor for true brand
loyalty, which can be seen as something important and relevant to the consumer
(Amine, 1998:311). Moolla (2010:130), states that brand involvement is a state of
interest towards a brand that cannot be observed and it is related to behaviour and
purpose. Numerous research studies show that consumer involvement may enhance
brand loyalty and that consumers display a low level of brand loyalty when brand
involvement is low and vice versa (Amine, 1998:312; Moolla, 2010:131).
2.5.6 Perceived value
Perceived value is defined as the customer’s measurement of the effectiveness or
benefit of the product compared to the price paid to obtain the product. Research
strongly proposes that perceived value contributes to brand loyalty. Thus the higher
the perceived value perceived by customers, the higher the level of brand loyalty
towards that brand (Punniyamoorthy & Ray, 2007:225). A positive relationship
therefore exists between brand loyalty and the perceived quality of a brand (Sanyal
& Datta, 2011:609). Perceived value can be classified into four categories: functional
value, emotional value, price-worthiness factor and social value (Punniyamoorthy &
Raj, 2007:225; Moolla, 2010:131-132).
35
Functional value
Functional value can be defined as the product value, efficacy and product
performance, which influences consumer purchase decisions.
Punniyamoorthy and Raj (2007:225), found that functional value is a key
influence on the purchase decisions that consumers make and it is
established by factors such as robustness and trustworthiness. The greater
the degree of functional value, the greater the degree of brand loyalty towards
a brand (Punniyamoorthy & Raj, 2007:225).
Emotional value
Emotional value results from the feelings of affection that the consumer has
towards a brand and therefore it influences the consumer’s purchase
decisions. The greater the emotional value that a consumer feels towards a
brand, the higher the level of brand loyalty (Punniyamoorthy & Raj, 2007:225).
Price-worthiness factor
Punniyamoorthy and Raj (2007:225), state that the price-worthiness factor
results from the decrease in the perceived cost of a brand. The price-
worthiness factor is when the value of a product purchased seems higher than
the price paid, thus value for money. The greater the level of the price-
worthiness factor, the higher the degree of brand loyalty (Punniyamoorthy &
Raj, 2007:225).
Social value
The social value of a brand or product involves the self-concept of the
consumer who purchased the brand, thus the product enhances the
consumer’s self-concept. The higher the social value level, the greater the
degree of brand loyalty (Punniyamoorthy & Raj, 2007:225).
The perceived value of a particular brand is derived from the trust that the consumer
has in that brand and the belief that other brands do not provide that same quality or
value (Delgado-Ballester & Munuera-Aleman, 2005:189). Sanyal and Datta
(2011:605), state that customer satisfaction plays an important role in how
36
customers perceive the quality of a brand. Perceived value can also be defined as
the outcome derived from evaluating the product’s features by the consumer or the
consumer’s verdict about the supremacy or excellence of the product (Sanyal &
Datta, 2011:605, 606). Higher quality perceptions lead to an increase in profits due
to the willingness of the consumer to pay a premium price in the short term. In the
long term, high quality perceptions lead to business growth and an increase in
market share gains and market expansions (Sanyal & Datta, 2011:607).
2.5.7 Commitment
Consumer commitment to a brand is an essential element to establish brand loyalty
(Amine, 1998:305; Knox & Walker, 2001:111; Jang et al., 2008:65; Kim et al.,
2008:100). It is important for companies to know that the purchase of a brand is
intentional and will continue in future (Amine, 1998:307). Commitment is an
attachment between parties that leads to the need to sustain a relationship
(Fullerton, 2005:98). Brand commitment is viewed as a behavioural intention with
affective and cognitive motives (Kim et al., 2008:99). Brand commitment explains the
relationship or attitudinal strength between the consumer and the brand which leads
to brand loyalty rather than just the simple repeat purchase of a brand which is a
behavioural occurrence (Amine, 1998:309). Commitment from an attitudinal
perspective can be used to distinguish between true brand loyalty and other buying
behaviours (Amine, 1998:309).
Commitment can therefore be established due to two reasons: affective and
cognitive motives experienced by the consumer towards the brand (Amine,
1998:309; Fullerton, 2005:99). Commitment from an affective origin includes
emotional attachment to the brand, whereas commitment from a cognitive origin or
calculative commitment consists of motives such as perceived risk or changes in the
performance between competing brands (Amine, 1998:309). Affective commitment
can be defined as the degree to which a consumer maintains a relationship with a
brand due to the affective connection to the brand. This affective connection is not
based on the brand features but rather on the affection, attachment and shared
values that the consumer has towards the brand and therefore reduces the likeliness
of the consumer to switch to other brands (Amine, 1998:310). Affective commitment
37
is the centre of the relationship between consumers and brands due to the
involvement with the brand on a frequent basis. Affective commitment can also be
used to describe the process of loyalty towards a brand, as the consumer is a
regular buyer of the brand and has a favourable attitude towards the brand (Louis &
Lombart, 2010:118).
Calculative commitment on the other hand is based purely on the value that the
consumer attaches to the brand, thus the consumer will stay loyal as long as the
benefits of the brand exceeds those offered by competitors (Amine, 1998:310).
Continuance or calculative commitment develops when there is a lack of alternative
purchase options available to the consumer. It is then also difficult for consumers to
end the relationship with the brand due to the limited options available. Calculative
commitment is linked to opportunistic behaviour and consumers will continue to
search for better or more valuable alternatives (Louis & Lombart, 2010:118).
Brand commitment therefore determines the length of the relationship that the
consumer has with the brand and is essential to establish brand loyalty (Knox &
Walker, 2001:120; Jang et al., 2008:61). Consumers with a low level of brand
commitment will be more tempted to purchase another brand, offering a better deal,
discount or if that brand is more visible from the point of purchase (Knox & Walker,
2001:120). Committed consumers on the other hand will make short term sacrifices
to defend the durability of their long term use of the product (Louis & Lombart,
2010:118).
Commitment is a key component in order to sustain a worthwhile business-to-
consumer relationship and can also be defined as an inclination to resist change and
the desire to maintain a relationship (Jang et al., 2008:61). Brand commitment can
be viewed as a long term goal for companies which will lead to a competitive
advantage. Companies should have the strategic goal to retain their regular
consumers which enhances commitment and will make consumers’ purchase
patterns less volatile and more predictable (Amine, 1998:310, 314).
38
2.5.8 Relationship proneness
Relationship proneness can be defined as an individual attribute of the buyer and the
buyer’s tendency to build a relationship with sellers of a particular brand (Moolla,
2010:129). Relationship proneness therefore is part of the consumer’s personality
(Moolla, 2010:129). Proneness refers to the belief that consumers have a
predisposition towards some activity, something or an “increased likelihood” (Parish
& Holloway, 2012:62). Parish and Halloway (2010:61), state that some consumers
are more “psychologically predisposed” to develop relationships than others.
According to Kim et al., (2012:376), relationship-prone consumers have higher levels
of trust and commitment than those who are not relationship-prone. Consumer
relationship proneness intercedes the relationship between social attachment and
the behavioural intentions of consumers (Bloemer et al., 2003:231). The need for
both parties to sustain the relationship indicates that relationship proneness has an
effect on behavioural intentions (Bloemer et al., 2003:233). Consumers’ relationship
proneness is also seen as a precursor for commitment and has a positive impact on
the purchase behaviour of the consumer (Bloemer et al., 2003:233, 238).
Relationship proneness can also be defined as a customer’s deliberate and constant
tendency to connect with a particular product through a relationship with that product
(De Wulf et al., 2001:38; Bloemer et al., 2003:231). It is also emphasised that this
relationship is a conscious decision and not merely based on convenience (De Wulf
et al., 2001:38). Therefore, it can be derived that relationship proneness has an
influence on the development of brand loyalty within consumers (Moolla, 2010:129).
2.5.9 Brand affect
Brand affect is characterised by two autonomous elements: positive and negative
affects. There is a positive relationship between the positive affect a consumer feels
towards a product and the willingness to purchase that product (Moolla, 2010:133).
The concept “affect” refers to the feelings or emotions of the consumer (Matzler et
al., 2006:428). Emotions can be defined as a response to a stimulus and are usually
powerful and long-lasting whereas feelings are perceived as less intense and more
temporary than emotions (Matzler et al., 2006:428). Brand affect can be defined as
the total positive or negative evaluation of the brand (Matzler et al., 2006:428).
39
Chaudhuri and Holbrook (2001:81) state that brands which are high in consumer
affect have a greater consumer attitudinal and purchase loyalty and therefore enjoy a
greater market share and companies can charge premium prices for their brands
(Chaudhuri & Holbrook, 2001:81; Matzler et al., 2006:427).
Consumers should not only buy a brand repeatedly but should also develop a
positive attitude towards the brand to be considered truly brand loyal (Louis &
Lombart, 2010:114). Brand attitudes are a central element to build a consumer-brand
relationship. Attitudes symbolise the overall evaluation of a brand that tends to direct
behaviour towards that brand (Fullerton, 2005:100). Consumers develop an affective
response through their usage and ownership of a brand that can be expressed as an
attitude. Brand attitudes also represent the degree of satisfaction of consumers’
experience with a brand (Fullerton, 2005:100).
Brand affect can therefore be defined as the potential of a brand to provoke a
positive emotional response within the consumer as a result of the usage thereof
(Chaudhuri & Holbrook, 2001:82). Brand affect leads to a higher level of commitment
towards a brand which can lead to an increase in the usage frequency of that brand
(Chaudhuri & Holbrook, 2001:82). Brand affect is an essential component that leads
to brand loyalty (Matzler et al., 2006:427).
2.5.10 Brand relevance
Brands have to be relevant to ensure brand loyalty amongst consumers (Moolla,
2010:133). Companies are increasing their marketing expenditures and attaching
more meaning to brand messages in order to establish brand relevance (Moolla,
2010:134). Brand relevance is thus the alignment of a brand, its brand identity and
personality with the needs and wants of its target market and therefore satisfies a
specific need of the consumer (Moolla & Bisschoff, 2012b:83).
Aaker (2012:43) states that the only way companies can achieve real growth is to
win the brand relevance competition by developing product offerings that are
innovative and therefore making competitors irrelevant. New categories of a brand
should be developed by adding a “must have” benefit which competitors lack. Aaker
(2012:44) defines these “must have” benefits as the uniqueness of the product which
includes personality, company values or community benefits. Therefore the offering
40
must be so appealing to a target segment that any other offering that lacks these
benefits will not be considered by consumers. Products should therefore be chosen
by consumers due to the irrelevance of competitor’s products not because they are
not preferred.
Customers recognise brands that are visible, appealing and trustworthy and
therefore relevant to the specific product category. The brand relevance strategy
involves both transformational and substantial innovation to create new offerings to
consumers. In order to achieve brand relevance, companies should be willing to
support more ruthless and risky innovations to satisfy unmet needs of the consumer
(Aaker, 2012:46, 48).
2.5.11 Brand performance
Companies can achieve greater business performance by enhancing the
performance of their brands (De Chernatony et al., 2004:16). Brand performance can
be defined as the evaluation of the central product by the consumer after the usage
thereof (Moolla, 2010:134). By establishing a better brand performance than
competitors, companies can increase their market share and charge a premium price
(Chaudhuri & Holbrook, 2001:81). According to Weerawardena et al., (2006:40),
innovation leads to greater brand performance.
Brand performance can also be seen as an indicator that the company has reached
its objectives in the industry or marketplace. Therefore, brand performance can be
defined as a measurement of a brand’s success (O’Cass & Ngo, 2007:15). Brand
performance was found to be related to brand awareness rather than based on
brand differentiation (Oliveira-Castro et al., 2008:447).
It has been found that brand loyalty contributes to profitable brand performance
outcomes (Chaudhuri & Holbrook, 2001:91). Chaudhuri (1999:2) defines brand
performance as the profit potential of a brand which can be expressed through price
and market level outcomes. Brand performance can be measured through two ways:
the first is the result of brand attitudes and purchase intentions which leads to sales
related outcomes. The second is derived from brand attitudes and brand loyalty
which enables the firm to charge a premium price. It can therefore be said that brand
41
performance is influenced by both brand attitudes and brand loyalty (Chaudhuri,
1999:7).
2.5.12 Culture
Culture has an effect on consumers’ attitudes, behaviour, values and perceptions.
This affects the consumer’s decision-making and purchase behaviour. According to
Lam (2007:7), there is a lack of research to determine the influence of culture on
consumer brand loyalty.
Culture plays a significant role in companies operating in international markets and
will influence product development, distribution, pricing and communication
strategies (Lam, 2007:7). Lam (2007:8) defines culture as the combined mindset that
differentiates one group of people from another. Hofstede, in Lam (2007:8), identified
four dimensions that differ among cultural groups, namely: individualism, uncertainty
avoidance, masculinity or femininity and power distance. Individualism can be
defined as the degree to which individuals within a society are incorporated into
groups. The higher the sense of individualism within a person, the less likely that
individual is to switch brands. The lower the level of individualism, the more likely a
person will follow group norms and thus brand loyalty will be determined by that
group (Lam, 2007:15). Uncertainty avoidance can be described as the degree to
which a culture influences its members to feel uncomfortable in uncertain situations.
It was found that the higher the level of uncertainty avoidance, the higher the level of
proneness to brand loyalty. Masculinity is a predilection for wealth, boldness and
achievement, while femininity is a preference for humility and relationships.
Individuals with a high level of masculinity tend to be less influenced by the cultural
group and therefore a brand loyalty decision will be based on those individuals’ own
decision-making processes. People with a high level of masculinity were also found
to be more brand loyal and tended to stay loyal to certain brands. Power distance
can be defined as the extent to which individuals within a group accept and
anticipate that power in society but also in organisations (Lam, 2007:12). The greater
the power distance within individuals the higher the brand loyalty level to brands,
expressed by these individuals (Lam, 2007:16).
42
The cultural aspect of brand loyalty is therefore an important factor and organisations
should take this aspect into consideration when identifying the customer’s proneness
to be brand loyal (Lam, 2007:16).
2.6 CONCLUSION
This chapter concluded the literature review and reported on the following:
The pharmaceutical industry of South Africa, which focused on the over-the-
counter medication industry and the use of generic pharmaceuticals in South
Africa.
The literature review of the history of brand loyalty and how it developed from
a single-dimension to a multi-dimensional construct was discussed at length.
An overview of the brand loyalty models developed by Punniyamoorthy & Raj
(2007) and Roy (2011) was given.
The benefits of brand loyalty to both consumers and companies were
analysed.
The conceptual framework developed by Moolla identified twelve influences of brand
loyalty, which included: Customer satisfaction, Switching costs, Brand trust, Repeat
purchase, Involvement, Commitment, Relationship proneness, Brand affect, Brand
relevance, Brand performance and Culture.
Chapter three will discuss the research methodology which includes the data
analysis and statistical techniques used to conduct this study. Next, the empirical
results will validate the questionnaire before it can be used to measure brand loyalty
for pharmaceuticals. The validation is required because the questionnaire was
initially developed by Moolla for the FMCG industry, which will now be adapted for
the pharmaceutical industry (see Appendix A). Chapter three also provides the
quantitative analysis, including the reliability of the data.
43
CHAPTER 3
RESEARCH FINDINGS AND DISCUSSION
3.1 INTRODUCTION
This chapter presents the results of the empirical study, namely to validate the
questionnaire, and then, by means of the validated questionnaire, analyse the data
on brand loyalty in the Pharmaceutical industry of South Africa. The fast moving
consumer goods (FMCG) brand loyalty model developed by Moolla (2010:197) is
employed to do so. More specifically, this chapter reports on:
Research methodology which includes the demographic analysis, the
sampling procedure, questionnaire development, data collection and data
analysis.
Statistical analysis to validate the questionnaire (which includes factor
analysis, Cronbach Alpha coefficients, Kaiser-Meyer-Olkin measure of
sampling adequacy and Bartlett’s test of sphericity).
Empirical measurement of the brand loyalty factors by means of descriptive
statistics.
The determination of the reliability coefficients of the data (Cronbach Alpha).
Discussion of the results.
The aim of this chapter is to state the results of the empirical study regarding the
following:
Whether Moolla’s brand loyalty model can be applied to measure brand
loyalty for medicine in the pharmaceutical industry,
Whether patients prefer the original pharmaceutical brand (Gaviscon) or do
they prefer the generic brand (Gelacid). For the purpose of this study only
one original and one generic brand was used.
44
Which factors influence brand loyalty in the consumer’s choice of
pharmaceutical brands.
To measure pharmaceutical brand loyalty in the over-the-counter medicine market of
South Africa the well-known brand, Gaviscon and its generic, Gelacid were chosen
for this study. The antacid market is worth R147 million and growing at 8% per
annum. Both Gaviscon and Gelacid compete in the plain antacid category which is
worth R110 million. Gaviscon is the market leader in the plain antacid category with
sales of R67,1 million and growing at 11% per annum (Appendix B: IMSHEALTH,
2012), while the generic Gelacid is worth R9 million and growing at 61% per annum
(Appendix C: IMSHEALTH, 2012).
3.2 RESEARCH METHODOLOGY
3.2.1 Sampling procedure
A randomly selected sample of 250 individuals was chosen which included
participants from various economic industries. The sample size was adequate as the
number of respondents should be a ratio of 14 observations per variable identified to
perform factor analysis. When multiplying the 12 variables with the recommended 14
observations, a sample size of 168 is suggested. Therefore the sample size exceeds
the recommended size as suggested by Hair as quoted by Moolla (2010:149). The
Kaiser-Meyer-Olkin measure of sampling adequacy also confirms the sample size as
this value was above 0.700 (Field, 2005:668).
The sample included participants from various provinces in South Africa which
included Gauteng; Kwazulu-Natal; North West; Free State; Limpopo; Mpumalanga
and the Eastern Cape.
3.2.2 Data collection
The data was collected through a questionnaire developed by Moolla (2010:262) and
was distributed in a direct approach and electronically via email or social network
platforms like Facebook and LinkedIn. The electronic questionnaire was hosted on
the questionnaire service provider www.instant.ly’s domain. The questionnaire was
45
accompanied by a covering letter that explained the purpose of the study and how
the questionnaire should be completed. It also explained the difference between a
pharmaceutical brand and the generic equivalent thereof. A favourable return rate of
81.2% (203 out of 250 questionnaires) was achieved.
3.2.3 Questionnaire development
Moolla (2010:150) developed a questionnaire to indicate the relevance of 12 factors
influencing brand loyalty. Each respondent had to evaluate the magnitude of each of
these factors by using a 7-point Likert scale as measuring instrument (Moolla,
2010:150). The Likert scale ranged from strongly agree to strongly disagree. The
adapted questionnaire is attached in Appendix A.
The number of items per influence ranged from a minimum of three influences, to a
maximum of five (Moolla, 2010:146). The influences per item are displayed in Table
3.1, which follows on the next page.
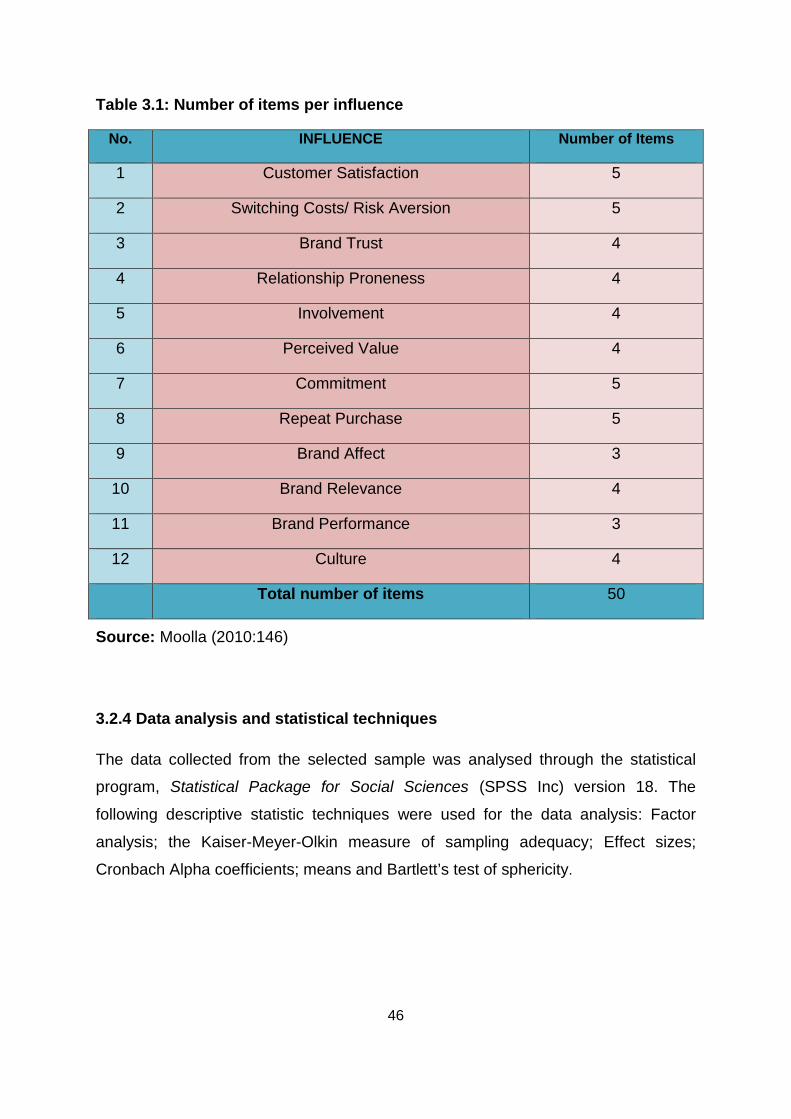
46
Table 3.1: Number of items per influence
No. INFLUENCE Number of Items
1 Customer Satisfaction 5
2 Switching Costs/ Risk Aversion 5
3 Brand Trust 4
4 Relationship Proneness 4
5 Involvement 4
6 Perceived Value 4
7 Commitment 5
8 Repeat Purchase 5
9 Brand Affect 3
10 Brand Relevance 4
11 Brand Performance 3
12 Culture 4
Total number of items 50
Source: Moolla (2010:146)
3.2.4 Data analysis and statistical techniques
The data collected from the selected sample was analysed through the statistical
program, Statistical Package for Social Sciences (SPSS Inc) version 18. The
following descriptive statistic techniques were used for the data analysis: Factor
analysis; the Kaiser-Meyer-Olkin measure of sampling adequacy; Effect sizes;
Cronbach Alpha coefficients; means and Bartlett’s test of sphericity.
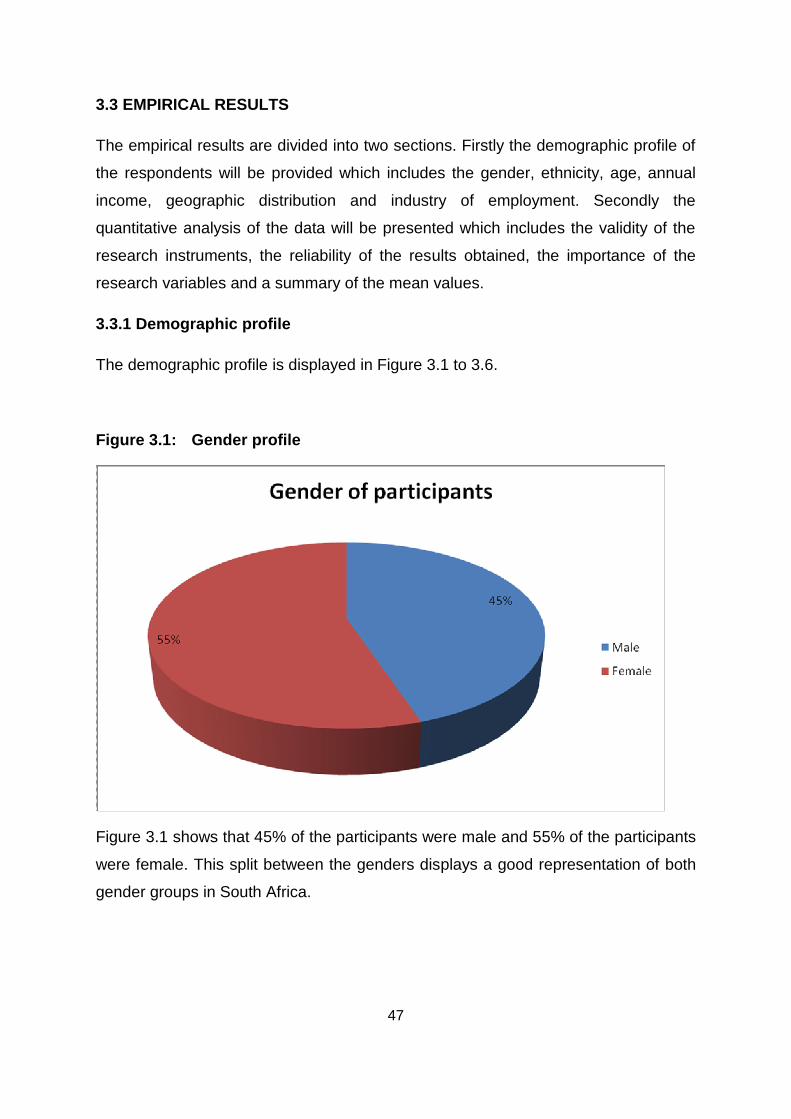
47
3.3 EMPIRICAL RESULTS
The empirical results are divided into two sections. Firstly the demographic profile of
the respondents will be provided which includes the gender, ethnicity, age, annual
income, geographic distribution and industry of employment. Secondly the
quantitative analysis of the data will be presented which includes the validity of the
research instruments, the reliability of the results obtained, the importance of the
research variables and a summary of the mean values.
3.3.1 Demographic profile
The demographic profile is displayed in Figure 3.1 to 3.6.
Figure 3.1: Gender profile
Figure 3.1 shows that 45% of the participants were male and 55% of the participants
were female. This split between the genders displays a good representation of both
gender groups in South Africa.
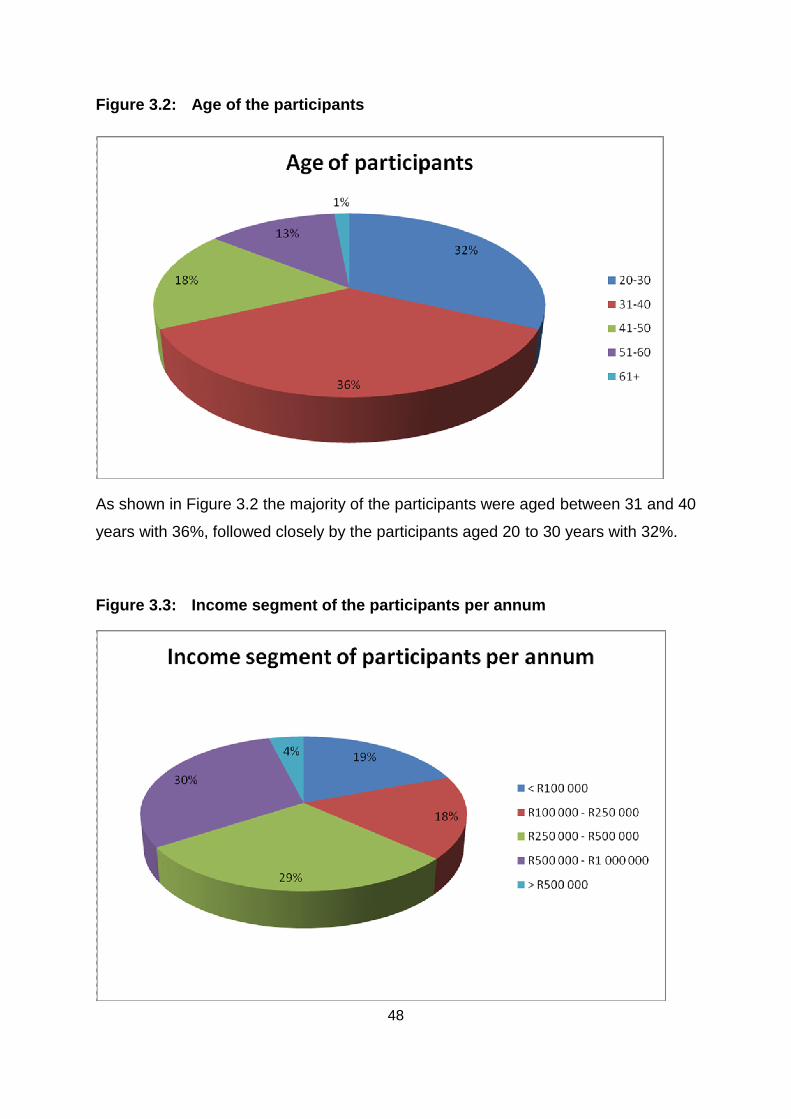
48
Figure 3.2: Age of the participants
As shown in Figure 3.2 the majority of the participants were aged between 31 and 40
years with 36%, followed closely by the participants aged 20 to 30 years with 32%.
Figure 3.3: Income segment of the participants per annum
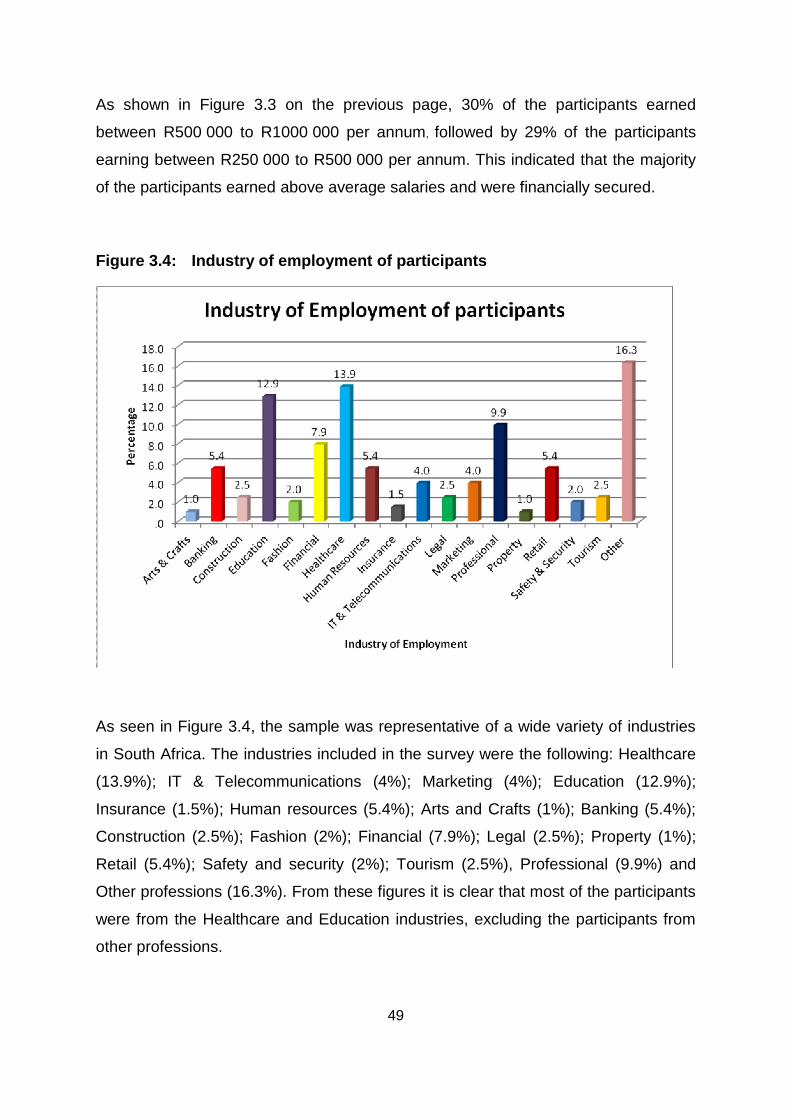
49
As shown in Figure 3.3 on the previous page, 30% of the participants earned
between R500 000 to R1000 000 per annum, followed by 29% of the participants
earning between R250 000 to R500 000 per annum. This indicated that the majority
of the participants earned above average salaries and were financially secured.
Figure 3.4: Industry of employment of participants
As seen in Figure 3.4, the sample was representative of a wide variety of industries
in South Africa. The industries included in the survey were the following: Healthcare
(13.9%); IT & Telecommunications (4%); Marketing (4%); Education (12.9%);
Insurance (1.5%); Human resources (5.4%); Arts and Crafts (1%); Banking (5.4%);
Construction (2.5%); Fashion (2%); Financial (7.9%); Legal (2.5%); Property (1%);
Retail (5.4%); Safety and security (2%); Tourism (2.5%), Professional (9.9%) and
Other professions (16.3%). From these figures it is clear that most of the participants
were from the Healthcare and Education industries, excluding the participants from
other professions.
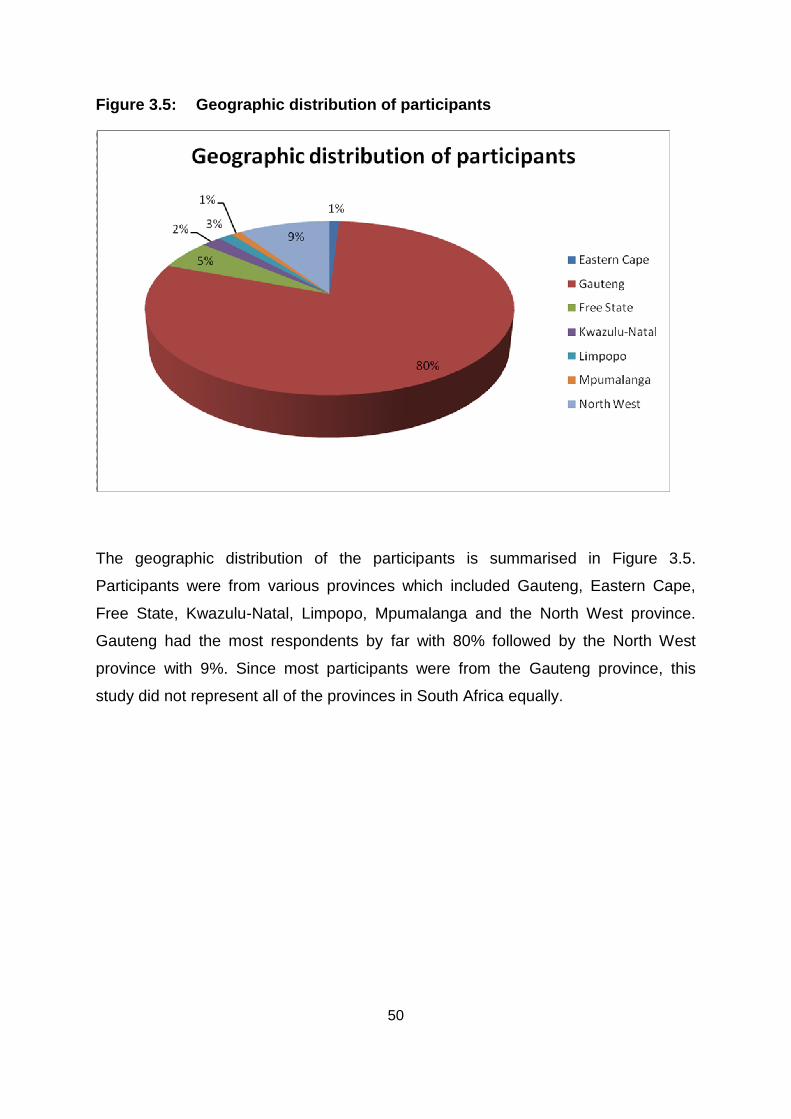
50
Figure 3.5: Geographic distribution of participants
The geographic distribution of the participants is summarised in Figure 3.5.
Participants were from various provinces which included Gauteng, Eastern Cape,
Free State, Kwazulu-Natal, Limpopo, Mpumalanga and the North West province.
Gauteng had the most respondents by far with 80% followed by the North West
province with 9%. Since most participants were from the Gauteng province, this
study did not represent all of the provinces in South Africa equally.
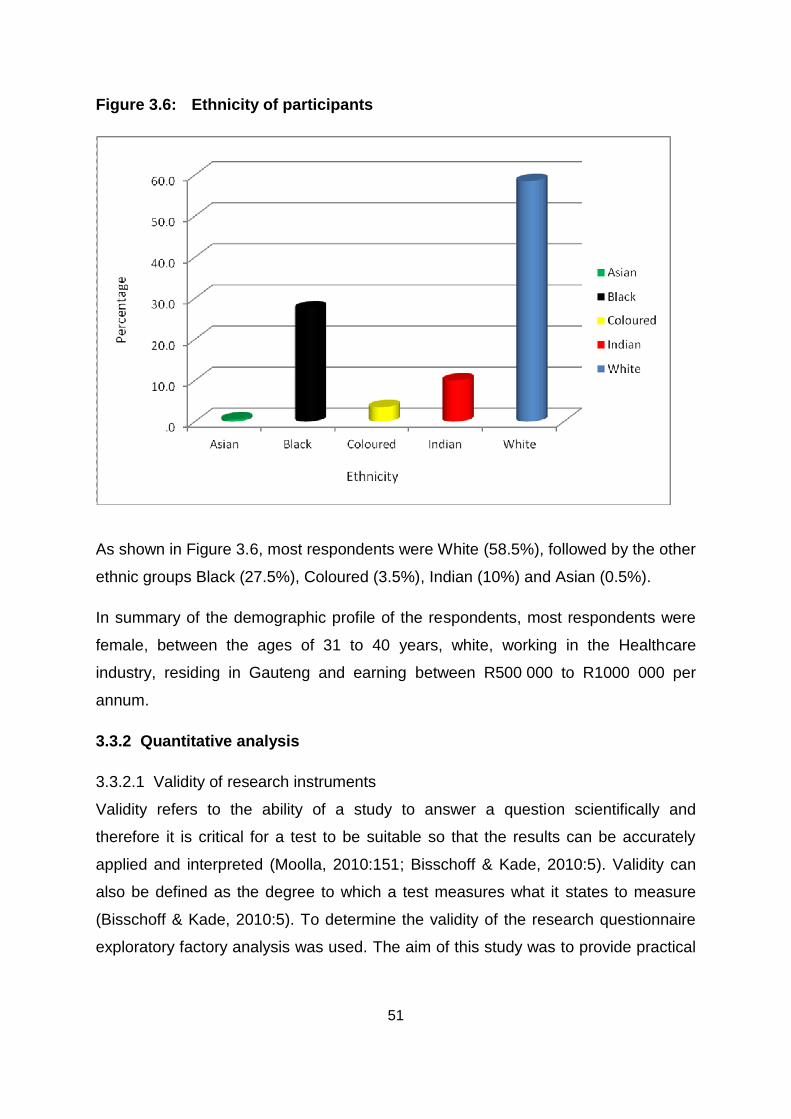
51
Figure 3.6: Ethnicity of participants
As shown in Figure 3.6, most respondents were White (58.5%), followed by the other
ethnic groups Black (27.5%), Coloured (3.5%), Indian (10%) and Asian (0.5%).
In summary of the demographic profile of the respondents, most respondents were
female, between the ages of 31 to 40 years, white, working in the Healthcare
industry, residing in Gauteng and earning between R500 000 to R1000 000 per
annum.
3.3.2 Quantitative analysis
3.3.2.1 Validity of research instruments
Validity refers to the ability of a study to answer a question scientifically and
therefore it is critical for a test to be suitable so that the results can be accurately
applied and interpreted (Moolla, 2010:151; Bisschoff & Kade, 2010:5). Validity can
also be defined as the degree to which a test measures what it states to measure
(Bisschoff & Kade, 2010:5). To determine the validity of the research questionnaire
exploratory factory analysis was used. The aim of this study was to provide practical
52
evidence that supports Moolla’s brand loyalty framework as basis for the developed
research questionnaire.
Factor analysis To determine the interrelationships among variables in this study, factor
analysis was used (Moolla, 2010:159). Factor analysis is an interdependence
measure so that an entire set of interdependent variables are examined,
without distinguishing between dependent and independent variables. Factor
loadings of 0.40 are regarded as satisfactory (Bisschoff & Kade, 2010:7; Field,
2005:666-667).
Kaiser-Meyer-Olkin (KMO) measure of sampling adequacy The Kaiser-Meyer-Olkin measure of sampling adequacy is used to determine
the suitability of factor analysis and whether the partial correlations among the
different variables are small (Bisschoff & Kade, 2010:8). The Kaiser-Meyer-
Olkin measure of sampling adequacy presents an index ranging from 0 to 1 of
the amount of variance among the different variables where a value of 0
indicates that factor analysis is not suitable and a value of 1 indicates that
factor analysis is suitable for the study (Field, 2005:746). KMO values smaller
than 0.5 indicates that factor analysis is not suitable and a KMO value of 0.6
should be present before factor analysis can be considered. Values between
0.5 and 0.7 are considered average, values between 0.7 and 0.8 are good
and values between 0.9 and 1.0 are excellent (Bisschoff & Kade, 2010:8).
Bartlett’s test of sphericity The Bartlett test of sphericity displays the strength of the relationship between
variables and indicates whether the data is suitable for factor analysis
(Bisschoff & Kade, 2010:8). The Bartlett test of sphericity tests the null
hypothesis that the variables are uncorrelated in the population correlation
matrix (Bisschoff & Kade, 2010:8). The significance level for the Bartlett test of
sphericity is 0.000, which indicates that the variables are suitable for factor
analysis.
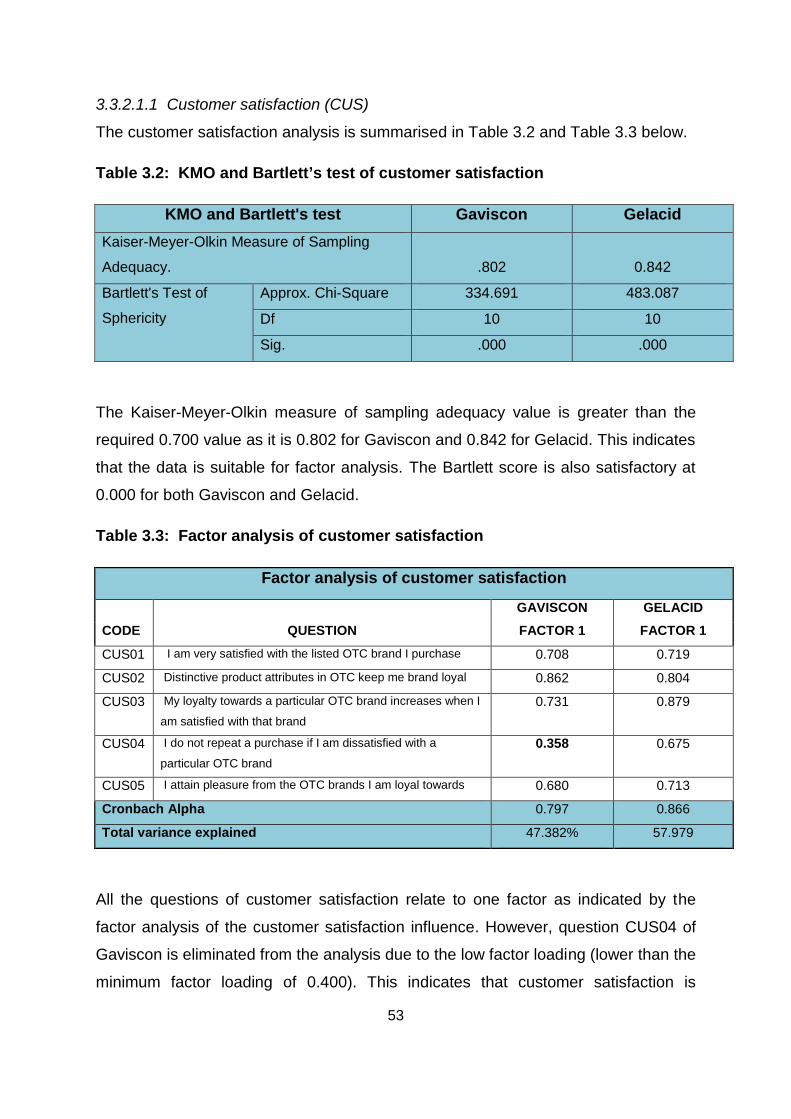
53
3.3.2.1.1 Customer satisfaction (CUS)
The customer satisfaction analysis is summarised in Table 3.2 and Table 3.3 below.
Table 3.2: KMO and Bartlett’s test of customer satisfaction
KMO and Bartlett's test Gaviscon Gelacid Kaiser-Meyer-Olkin Measure of Sampling
Adequacy.
.802 0.842
Bartlett's Test of
Sphericity
Approx. Chi-Square 334.691 483.087
Df 10 10
Sig. .000 .000
The Kaiser-Meyer-Olkin measure of sampling adequacy value is greater than the
required 0.700 value as it is 0.802 for Gaviscon and 0.842 for Gelacid. This indicates
that the data is suitable for factor analysis. The Bartlett score is also satisfactory at
0.000 for both Gaviscon and Gelacid.
Table 3.3: Factor analysis of customer satisfaction
Factor analysis of customer satisfaction
GAVISCON GELACID
CODE QUESTION FACTOR 1 FACTOR 1
CUS01 I am very satisfied with the listed OTC brand I purchase 0.708 0.719
CUS02 Distinctive product attributes in OTC keep me brand loyal 0.862 0.804
CUS03 My loyalty towards a particular OTC brand increases when I
am satisfied with that brand 0.731 0.879
CUS04 I do not repeat a purchase if I am dissatisfied with a
particular OTC brand 0.358 0.675
CUS05 I attain pleasure from the OTC brands I am loyal towards 0.680 0.713
Cronbach Alpha 0.797 0.866
Total variance explained 47.382% 57.979
All the questions of customer satisfaction relate to one factor as indicated by the
factor analysis of the customer satisfaction influence. However, question CUS04 of
Gaviscon is eliminated from the analysis due to the low factor loading (lower than the
minimum factor loading of 0.400). This indicates that customer satisfaction is
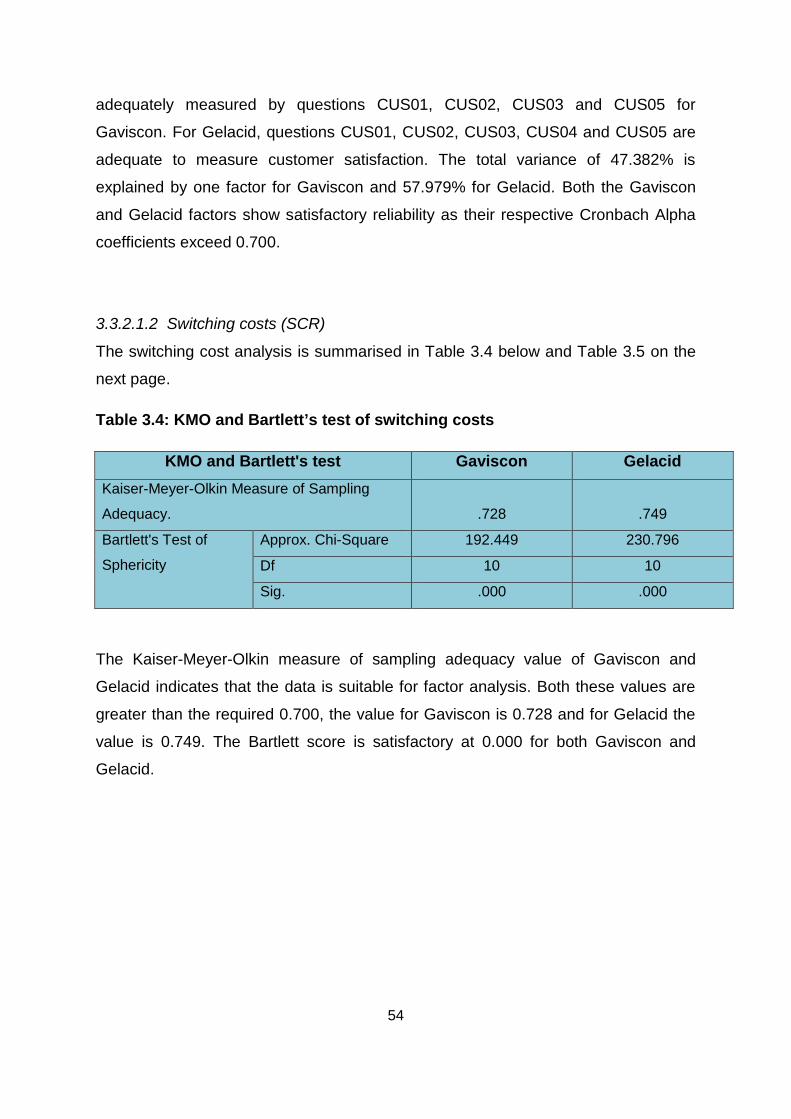
54
adequately measured by questions CUS01, CUS02, CUS03 and CUS05 for
Gaviscon. For Gelacid, questions CUS01, CUS02, CUS03, CUS04 and CUS05 are
adequate to measure customer satisfaction. The total variance of 47.382% is
explained by one factor for Gaviscon and 57.979% for Gelacid. Both the Gaviscon
and Gelacid factors show satisfactory reliability as their respective Cronbach Alpha
coefficients exceed 0.700.
3.3.2.1.2 Switching costs (SCR)
The switching cost analysis is summarised in Table 3.4 below and Table 3.5 on the
next page.
Table 3.4: KMO and Bartlett’s test of switching costs
KMO and Bartlett's test Gaviscon Gelacid Kaiser-Meyer-Olkin Measure of Sampling
Adequacy.
.728 .749
Bartlett's Test of
Sphericity
Approx. Chi-Square 192.449 230.796
Df 10 10
Sig. .000 .000
The Kaiser-Meyer-Olkin measure of sampling adequacy value of Gaviscon and
Gelacid indicates that the data is suitable for factor analysis. Both these values are
greater than the required 0.700, the value for Gaviscon is 0.728 and for Gelacid the
value is 0.749. The Bartlett score is satisfactory at 0.000 for both Gaviscon and
Gelacid.
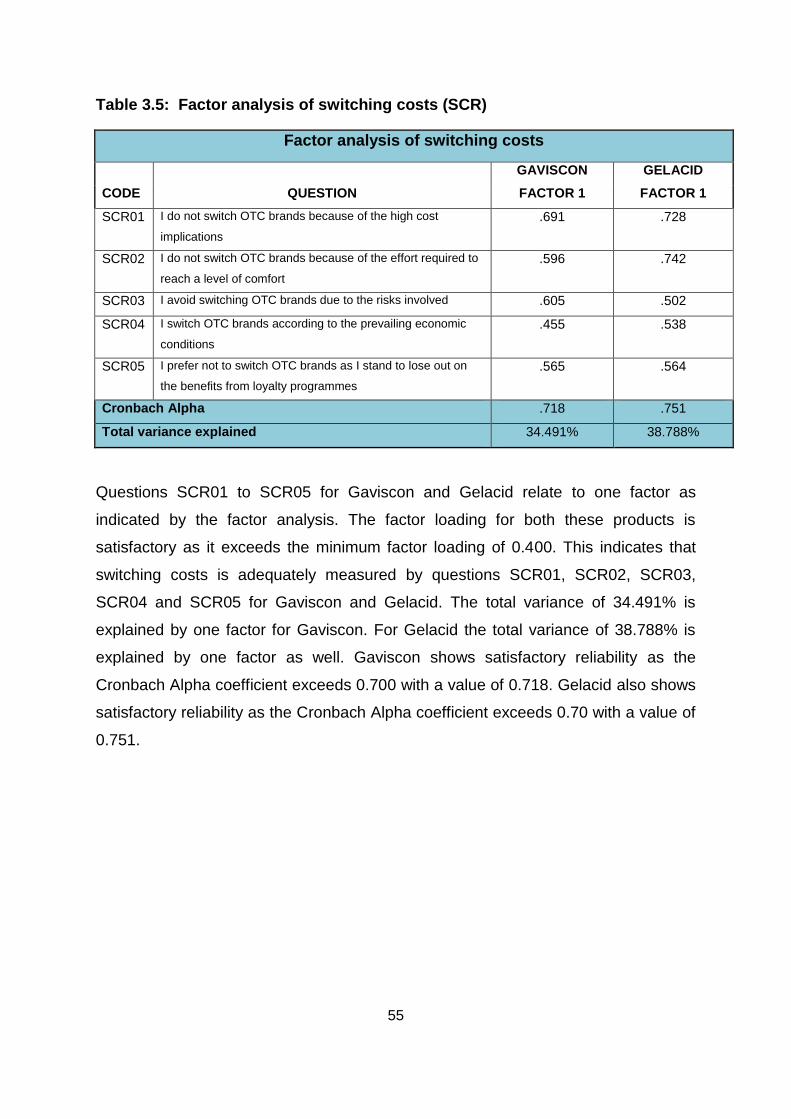
55
Table 3.5: Factor analysis of switching costs (SCR)
Factor analysis of switching costs
GAVISCON GELACID
CODE QUESTION FACTOR 1 FACTOR 1
SCR01 I do not switch OTC brands because of the high cost
implications .691 .728
SCR02 I do not switch OTC brands because of the effort required to
reach a level of comfort .596 .742
SCR03 I avoid switching OTC brands due to the risks involved .605 .502
SCR04 I switch OTC brands according to the prevailing economic
conditions .455 .538
SCR05 I prefer not to switch OTC brands as I stand to lose out on
the benefits from loyalty programmes .565 .564
Cronbach Alpha .718 .751
Total variance explained 34.491% 38.788%
Questions SCR01 to SCR05 for Gaviscon and Gelacid relate to one factor as
indicated by the factor analysis. The factor loading for both these products is
satisfactory as it exceeds the minimum factor loading of 0.400. This indicates that
switching costs is adequately measured by questions SCR01, SCR02, SCR03,
SCR04 and SCR05 for Gaviscon and Gelacid. The total variance of 34.491% is
explained by one factor for Gaviscon. For Gelacid the total variance of 38.788% is
explained by one factor as well. Gaviscon shows satisfactory reliability as the
Cronbach Alpha coefficient exceeds 0.700 with a value of 0.718. Gelacid also shows
satisfactory reliability as the Cronbach Alpha coefficient exceeds 0.70 with a value of
0.751.
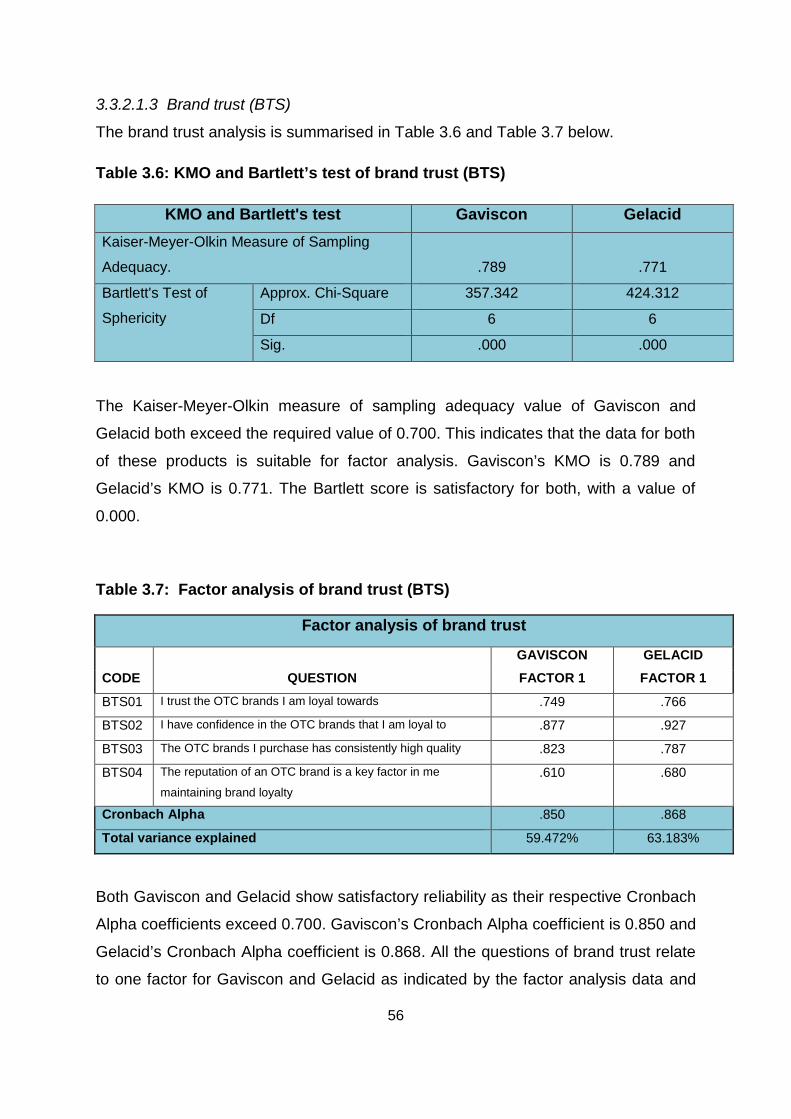
56
3.3.2.1.3 Brand trust (BTS)
The brand trust analysis is summarised in Table 3.6 and Table 3.7 below.
Table 3.6: KMO and Bartlett’s test of brand trust (BTS)
KMO and Bartlett's test Gaviscon Gelacid Kaiser-Meyer-Olkin Measure of Sampling
Adequacy.
.789 .771
Bartlett's Test of
Sphericity
Approx. Chi-Square 357.342 424.312
Df 6 6
Sig. .000 .000
The Kaiser-Meyer-Olkin measure of sampling adequacy value of Gaviscon and
Gelacid both exceed the required value of 0.700. This indicates that the data for both
of these products is suitable for factor analysis. Gaviscon’s KMO is 0.789 and
Gelacid’s KMO is 0.771. The Bartlett score is satisfactory for both, with a value of
0.000.
Table 3.7: Factor analysis of brand trust (BTS)
Factor analysis of brand trust
GAVISCON GELACID
CODE QUESTION FACTOR 1 FACTOR 1
BTS01 I trust the OTC brands I am loyal towards .749 .766
BTS02 I have confidence in the OTC brands that I am loyal to .877 .927
BTS03 The OTC brands I purchase has consistently high quality .823 .787
BTS04 The reputation of an OTC brand is a key factor in me
maintaining brand loyalty .610 .680
Cronbach Alpha .850 .868
Total variance explained 59.472% 63.183%
Both Gaviscon and Gelacid show satisfactory reliability as their respective Cronbach
Alpha coefficients exceed 0.700. Gaviscon’s Cronbach Alpha coefficient is 0.850 and
Gelacid’s Cronbach Alpha coefficient is 0.868. All the questions of brand trust relate
to one factor for Gaviscon and Gelacid as indicated by the factor analysis data and
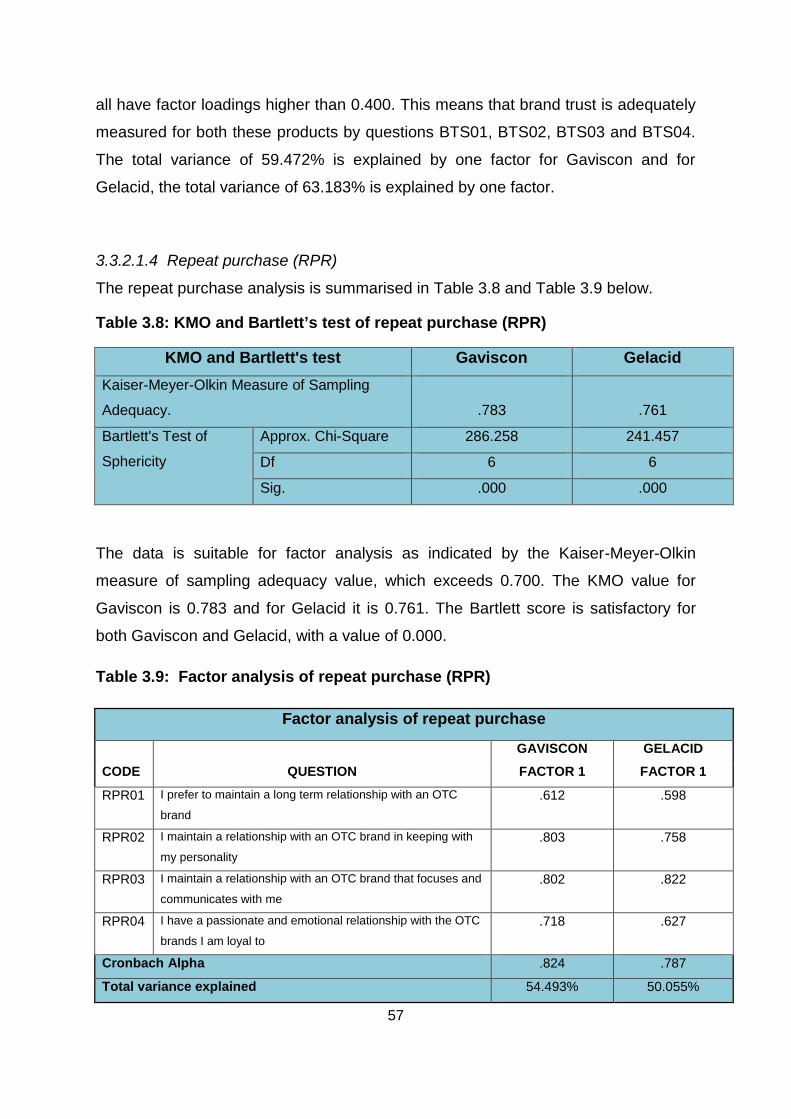
57
all have factor loadings higher than 0.400. This means that brand trust is adequately
measured for both these products by questions BTS01, BTS02, BTS03 and BTS04.
The total variance of 59.472% is explained by one factor for Gaviscon and for
Gelacid, the total variance of 63.183% is explained by one factor.
3.3.2.1.4 Repeat purchase (RPR)
The repeat purchase analysis is summarised in Table 3.8 and Table 3.9 below.
Table 3.8: KMO and Bartlett’s test of repeat purchase (RPR)
KMO and Bartlett's test Gaviscon Gelacid Kaiser-Meyer-Olkin Measure of Sampling
Adequacy.
.783 .761
Bartlett's Test of
Sphericity
Approx. Chi-Square 286.258 241.457
Df 6 6
Sig. .000 .000
The data is suitable for factor analysis as indicated by the Kaiser-Meyer-Olkin
measure of sampling adequacy value, which exceeds 0.700. The KMO value for
Gaviscon is 0.783 and for Gelacid it is 0.761. The Bartlett score is satisfactory for
both Gaviscon and Gelacid, with a value of 0.000.
Table 3.9: Factor analysis of repeat purchase (RPR)
Factor analysis of repeat purchase
GAVISCON GELACID
CODE QUESTION FACTOR 1 FACTOR 1
RPR01 I prefer to maintain a long term relationship with an OTC
brand .612 .598
RPR02 I maintain a relationship with an OTC brand in keeping with
my personality .803 .758
RPR03 I maintain a relationship with an OTC brand that focuses and
communicates with me .802 .822
RPR04 I have a passionate and emotional relationship with the OTC
brands I am loyal to .718 .627
Cronbach Alpha .824 .787
Total variance explained 54.493% 50.055%
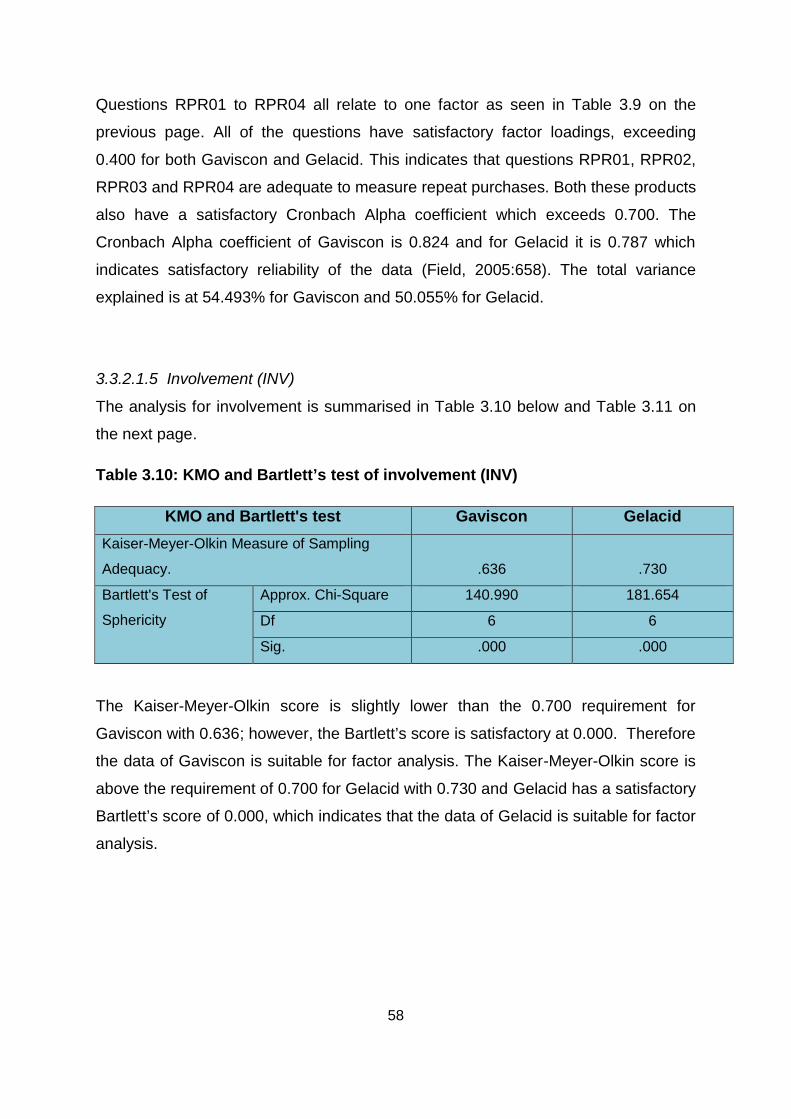
58
Questions RPR01 to RPR04 all relate to one factor as seen in Table 3.9 on the
previous page. All of the questions have satisfactory factor loadings, exceeding
0.400 for both Gaviscon and Gelacid. This indicates that questions RPR01, RPR02,
RPR03 and RPR04 are adequate to measure repeat purchases. Both these products
also have a satisfactory Cronbach Alpha coefficient which exceeds 0.700. The
Cronbach Alpha coefficient of Gaviscon is 0.824 and for Gelacid it is 0.787 which
indicates satisfactory reliability of the data (Field, 2005:658). The total variance
explained is at 54.493% for Gaviscon and 50.055% for Gelacid.
3.3.2.1.5 Involvement (INV)
The analysis for involvement is summarised in Table 3.10 below and Table 3.11 on
the next page.
Table 3.10: KMO and Bartlett’s test of involvement (INV)
KMO and Bartlett's test Gaviscon Gelacid Kaiser-Meyer-Olkin Measure of Sampling
Adequacy.
.636 .730
Bartlett's Test of
Sphericity
Approx. Chi-Square 140.990 181.654
Df 6 6
Sig. .000 .000
The Kaiser-Meyer-Olkin score is slightly lower than the 0.700 requirement for
Gaviscon with 0.636; however, the Bartlett’s score is satisfactory at 0.000. Therefore
the data of Gaviscon is suitable for factor analysis. The Kaiser-Meyer-Olkin score is
above the requirement of 0.700 for Gelacid with 0.730 and Gelacid has a satisfactory
Bartlett’s score of 0.000, which indicates that the data of Gelacid is suitable for factor
analysis.
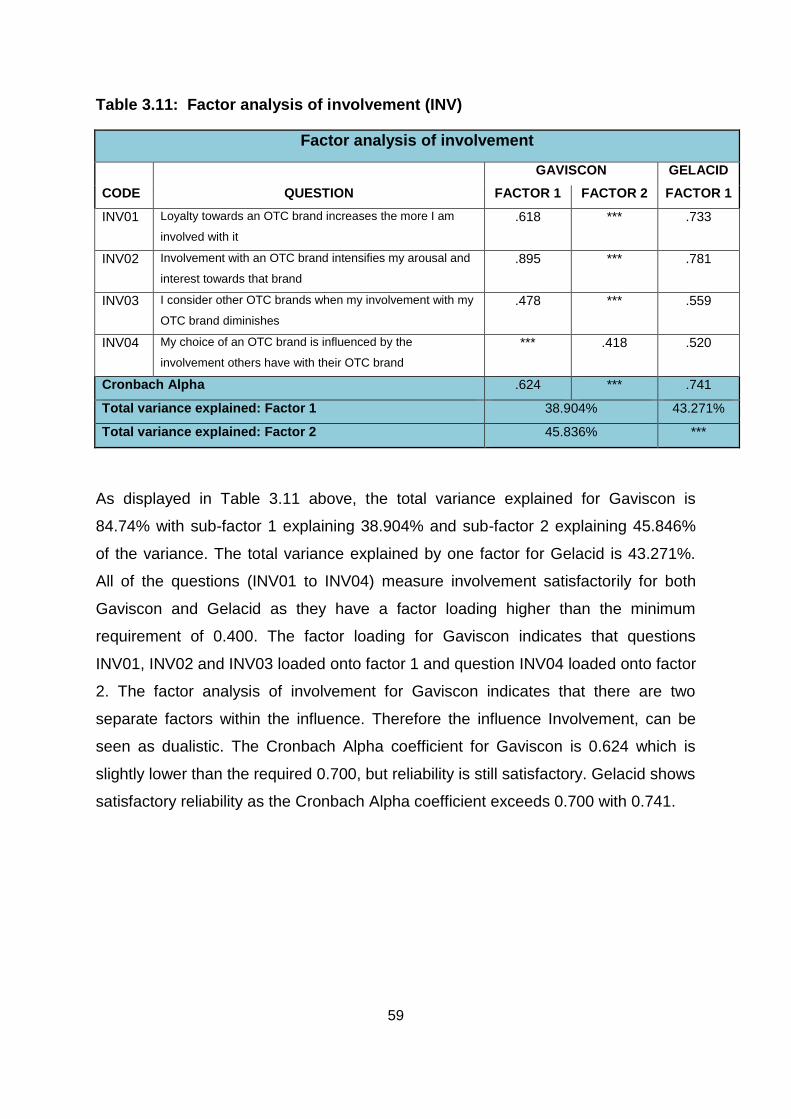
59
Table 3.11: Factor analysis of involvement (INV)
Factor analysis of involvement
GAVISCON GELACID
CODE QUESTION FACTOR 1 FACTOR 2 FACTOR 1
INV01 Loyalty towards an OTC brand increases the more I am
involved with it .618 *** .733
INV02 Involvement with an OTC brand intensifies my arousal and
interest towards that brand .895 *** .781
INV03 I consider other OTC brands when my involvement with my
OTC brand diminishes .478 *** .559
INV04 My choice of an OTC brand is influenced by the
involvement others have with their OTC brand *** .418 .520
Cronbach Alpha .624 *** .741
Total variance explained: Factor 1 38.904% 43.271%
Total variance explained: Factor 2 45.836% ***
As displayed in Table 3.11 above, the total variance explained for Gaviscon is
84.74% with sub-factor 1 explaining 38.904% and sub-factor 2 explaining 45.846%
of the variance. The total variance explained by one factor for Gelacid is 43.271%.
All of the questions (INV01 to INV04) measure involvement satisfactorily for both
Gaviscon and Gelacid as they have a factor loading higher than the minimum
requirement of 0.400. The factor loading for Gaviscon indicates that questions
INV01, INV02 and INV03 loaded onto factor 1 and question INV04 loaded onto factor
2. The factor analysis of involvement for Gaviscon indicates that there are two
separate factors within the influence. Therefore the influence Involvement, can be
seen as dualistic. The Cronbach Alpha coefficient for Gaviscon is 0.624 which is
slightly lower than the required 0.700, but reliability is still satisfactory. Gelacid shows
satisfactory reliability as the Cronbach Alpha coefficient exceeds 0.700 with 0.741.
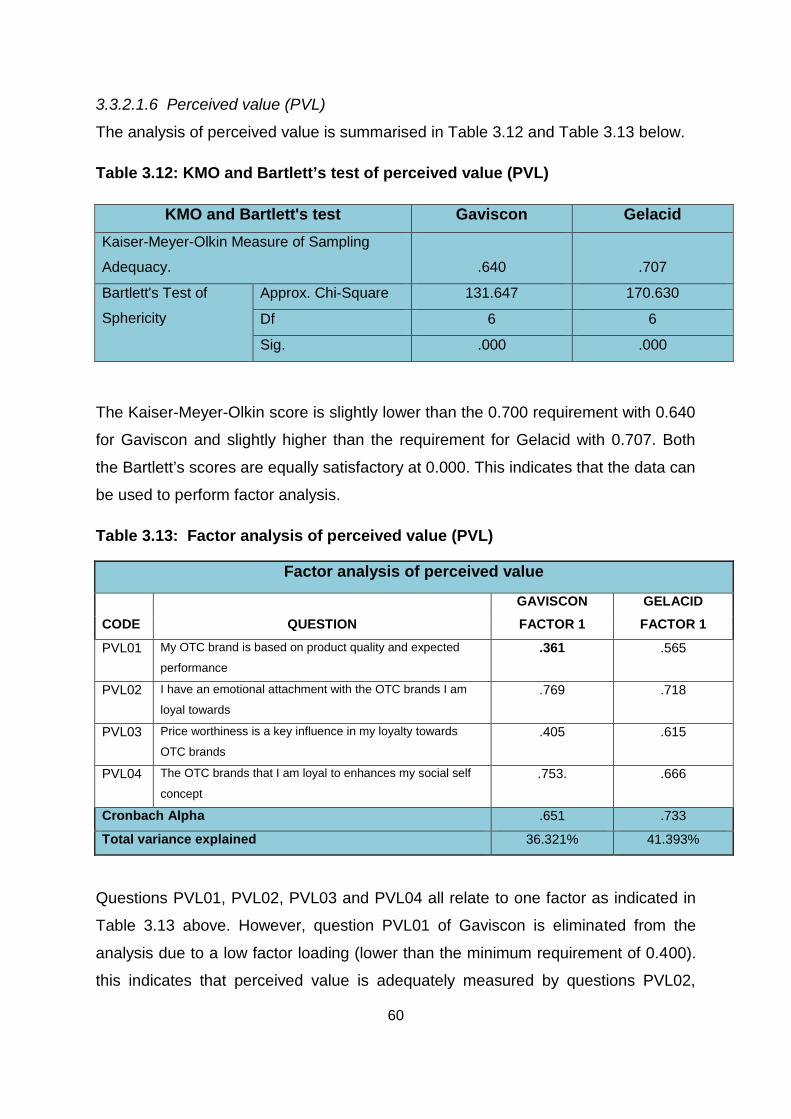
60
3.3.2.1.6 Perceived value (PVL)
The analysis of perceived value is summarised in Table 3.12 and Table 3.13 below.
Table 3.12: KMO and Bartlett’s test of perceived value (PVL)
KMO and Bartlett's test Gaviscon Gelacid Kaiser-Meyer-Olkin Measure of Sampling
Adequacy.
.640 .707
Bartlett's Test of
Sphericity
Approx. Chi-Square 131.647 170.630
Df 6 6
Sig. .000 .000
The Kaiser-Meyer-Olkin score is slightly lower than the 0.700 requirement with 0.640
for Gaviscon and slightly higher than the requirement for Gelacid with 0.707. Both
the Bartlett’s scores are equally satisfactory at 0.000. This indicates that the data can
be used to perform factor analysis.
Table 3.13: Factor analysis of perceived value (PVL)
Factor analysis of perceived value
GAVISCON GELACID
CODE QUESTION FACTOR 1 FACTOR 1
PVL01 My OTC brand is based on product quality and expected
performance .361 .565
PVL02 I have an emotional attachment with the OTC brands I am
loyal towards .769 .718
PVL03 Price worthiness is a key influence in my loyalty towards
OTC brands .405 .615
PVL04 The OTC brands that I am loyal to enhances my social self
concept .753. .666
Cronbach Alpha .651 .733
Total variance explained 36.321% 41.393%
Questions PVL01, PVL02, PVL03 and PVL04 all relate to one factor as indicated in
Table 3.13 above. However, question PVL01 of Gaviscon is eliminated from the
analysis due to a low factor loading (lower than the minimum requirement of 0.400).
this indicates that perceived value is adequately measured by questions PVL02,
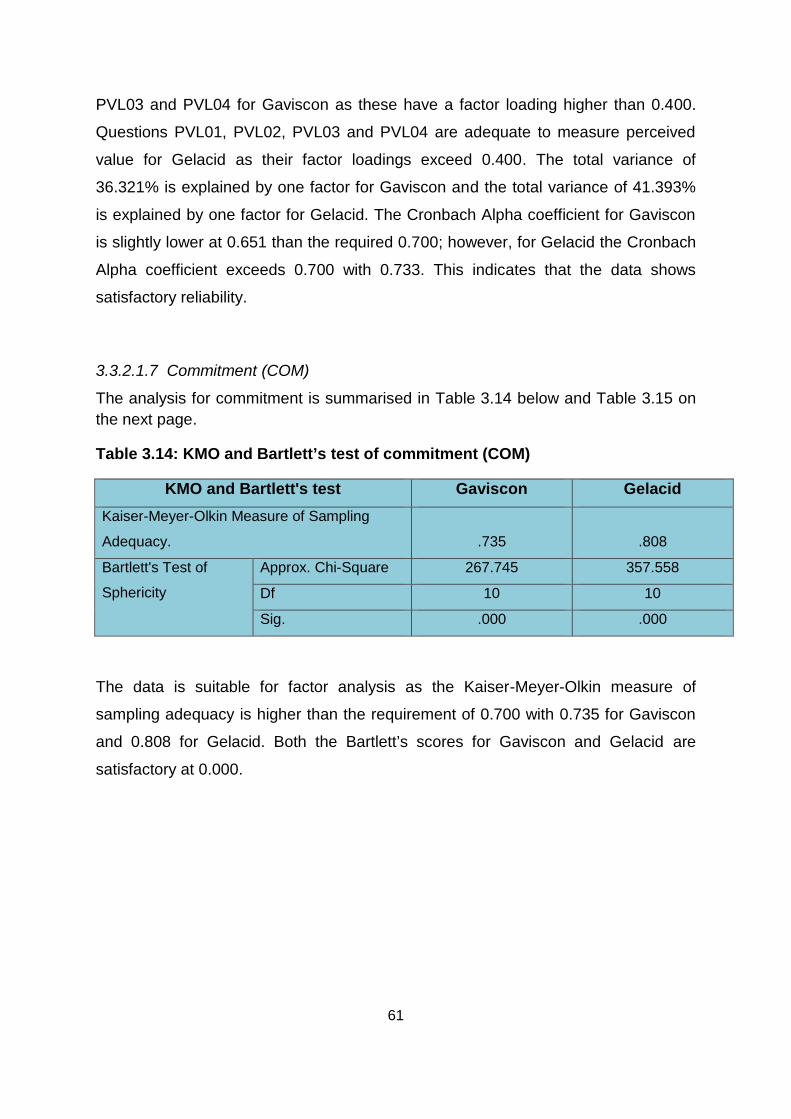
61
PVL03 and PVL04 for Gaviscon as these have a factor loading higher than 0.400.
Questions PVL01, PVL02, PVL03 and PVL04 are adequate to measure perceived
value for Gelacid as their factor loadings exceed 0.400. The total variance of
36.321% is explained by one factor for Gaviscon and the total variance of 41.393%
is explained by one factor for Gelacid. The Cronbach Alpha coefficient for Gaviscon
is slightly lower at 0.651 than the required 0.700; however, for Gelacid the Cronbach
Alpha coefficient exceeds 0.700 with 0.733. This indicates that the data shows
satisfactory reliability.
3.3.2.1.7 Commitment (COM)
The analysis for commitment is summarised in Table 3.14 below and Table 3.15 on the next page.
Table 3.14: KMO and Bartlett’s test of commitment (COM)
KMO and Bartlett's test Gaviscon Gelacid Kaiser-Meyer-Olkin Measure of Sampling
Adequacy.
.735 .808
Bartlett's Test of
Sphericity
Approx. Chi-Square 267.745 357.558
Df 10 10
Sig. .000 .000
The data is suitable for factor analysis as the Kaiser-Meyer-Olkin measure of
sampling adequacy is higher than the requirement of 0.700 with 0.735 for Gaviscon
and 0.808 for Gelacid. Both the Bartlett’s scores for Gaviscon and Gelacid are
satisfactory at 0.000.
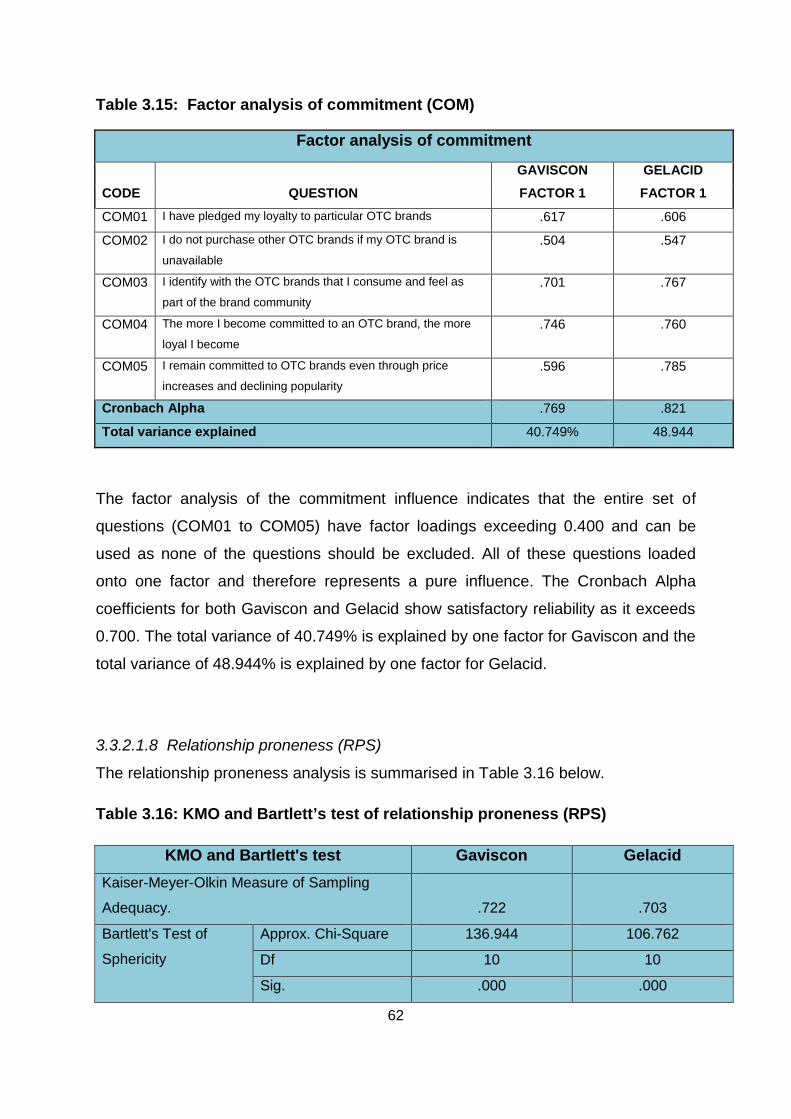
62
Table 3.15: Factor analysis of commitment (COM)
Factor analysis of commitment
GAVISCON GELACID
CODE QUESTION FACTOR 1 FACTOR 1
COM01 I have pledged my loyalty to particular OTC brands .617 .606
COM02 I do not purchase other OTC brands if my OTC brand is
unavailable .504 .547
COM03 I identify with the OTC brands that I consume and feel as
part of the brand community .701 .767
COM04 The more I become committed to an OTC brand, the more
loyal I become .746 .760
COM05 I remain committed to OTC brands even through price
increases and declining popularity .596 .785
Cronbach Alpha .769 .821
Total variance explained 40.749% 48.944
The factor analysis of the commitment influence indicates that the entire set of
questions (COM01 to COM05) have factor loadings exceeding 0.400 and can be
used as none of the questions should be excluded. All of these questions loaded
onto one factor and therefore represents a pure influence. The Cronbach Alpha
coefficients for both Gaviscon and Gelacid show satisfactory reliability as it exceeds
0.700. The total variance of 40.749% is explained by one factor for Gaviscon and the
total variance of 48.944% is explained by one factor for Gelacid.
3.3.2.1.8 Relationship proneness (RPS)
The relationship proneness analysis is summarised in Table 3.16 below.
Table 3.16: KMO and Bartlett’s test of relationship proneness (RPS)
KMO and Bartlett's test Gaviscon Gelacid Kaiser-Meyer-Olkin Measure of Sampling
Adequacy.
.722 .703
Bartlett's Test of
Sphericity
Approx. Chi-Square 136.944 106.762
Df 10 10
Sig. .000 .000
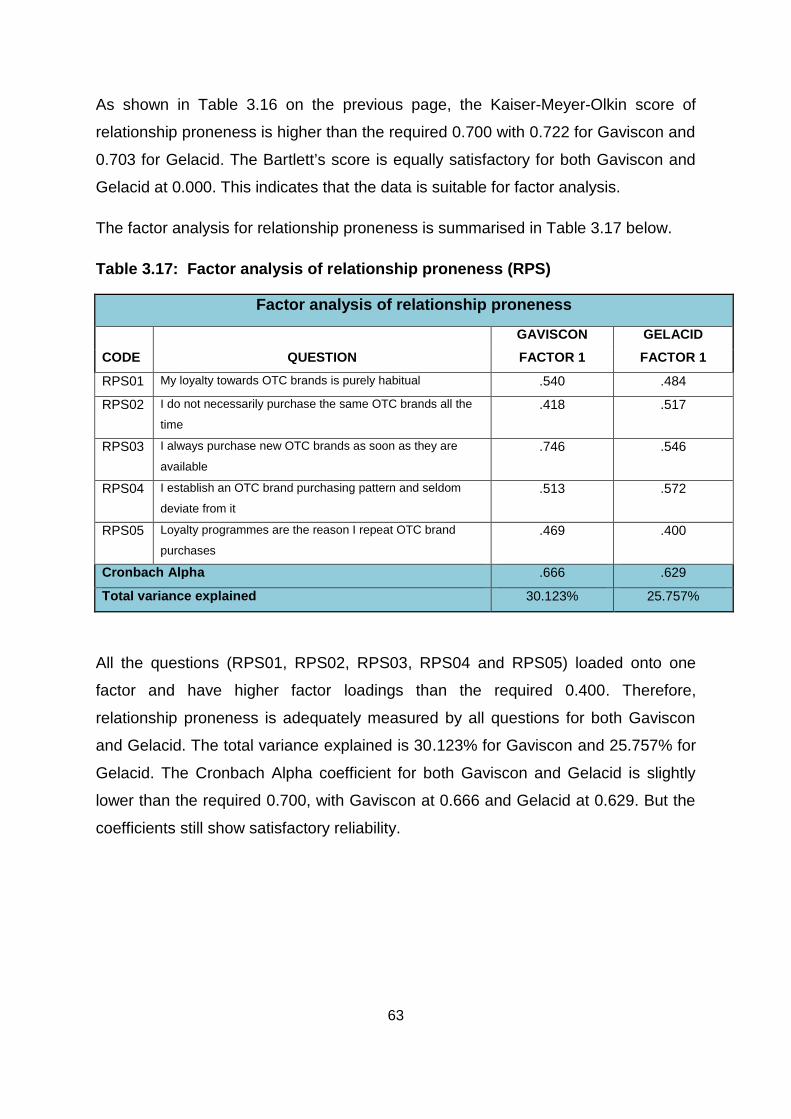
63
As shown in Table 3.16 on the previous page, the Kaiser-Meyer-Olkin score of
relationship proneness is higher than the required 0.700 with 0.722 for Gaviscon and
0.703 for Gelacid. The Bartlett’s score is equally satisfactory for both Gaviscon and
Gelacid at 0.000. This indicates that the data is suitable for factor analysis.
The factor analysis for relationship proneness is summarised in Table 3.17 below.
Table 3.17: Factor analysis of relationship proneness (RPS)
Factor analysis of relationship proneness
GAVISCON GELACID
CODE QUESTION FACTOR 1 FACTOR 1
RPS01 My loyalty towards OTC brands is purely habitual .540 .484
RPS02 I do not necessarily purchase the same OTC brands all the
time .418 .517
RPS03 I always purchase new OTC brands as soon as they are
available .746 .546
RPS04 I establish an OTC brand purchasing pattern and seldom
deviate from it .513 .572
RPS05 Loyalty programmes are the reason I repeat OTC brand
purchases .469 .400
Cronbach Alpha .666 .629
Total variance explained 30.123% 25.757%
All the questions (RPS01, RPS02, RPS03, RPS04 and RPS05) loaded onto one
factor and have higher factor loadings than the required 0.400. Therefore,
relationship proneness is adequately measured by all questions for both Gaviscon
and Gelacid. The total variance explained is 30.123% for Gaviscon and 25.757% for
Gelacid. The Cronbach Alpha coefficient for both Gaviscon and Gelacid is slightly
lower than the required 0.700, with Gaviscon at 0.666 and Gelacid at 0.629. But the
coefficients still show satisfactory reliability.
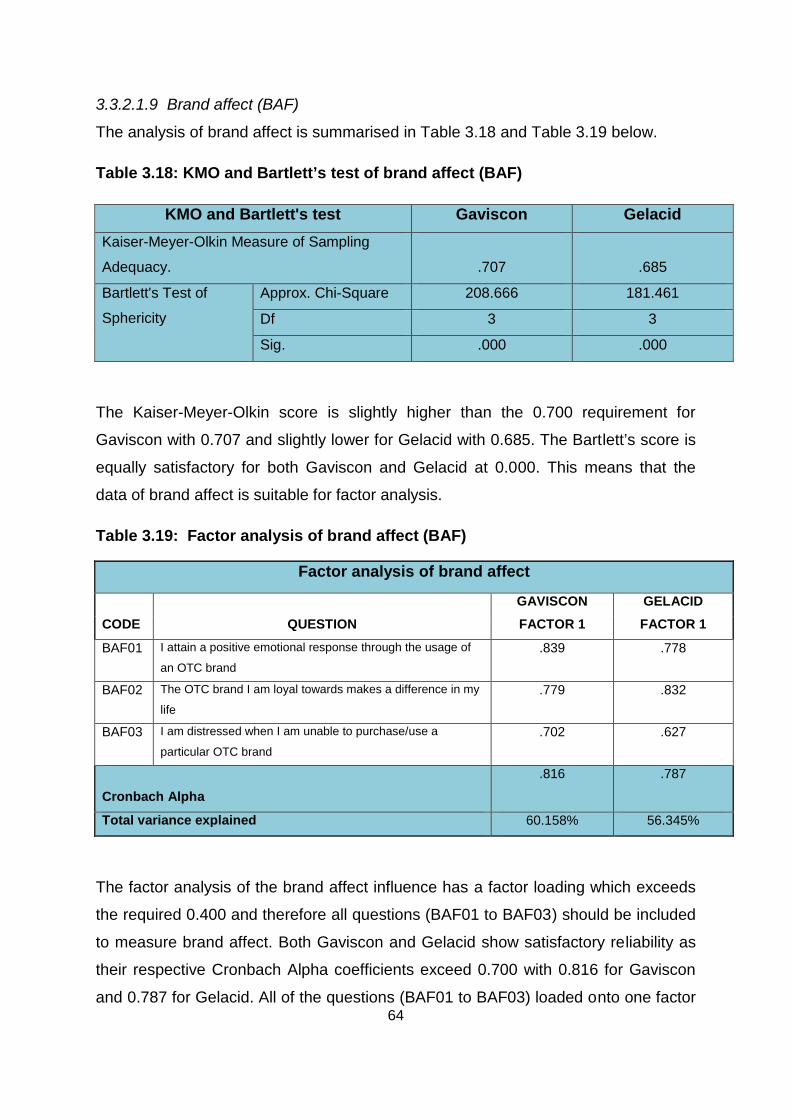
64
3.3.2.1.9 Brand affect (BAF)
The analysis of brand affect is summarised in Table 3.18 and Table 3.19 below.
Table 3.18: KMO and Bartlett’s test of brand affect (BAF)
KMO and Bartlett's test Gaviscon Gelacid Kaiser-Meyer-Olkin Measure of Sampling
Adequacy.
.707 .685
Bartlett's Test of
Sphericity
Approx. Chi-Square 208.666 181.461
Df 3 3
Sig. .000 .000
The Kaiser-Meyer-Olkin score is slightly higher than the 0.700 requirement for
Gaviscon with 0.707 and slightly lower for Gelacid with 0.685. The Bartlett’s score is
equally satisfactory for both Gaviscon and Gelacid at 0.000. This means that the
data of brand affect is suitable for factor analysis.
Table 3.19: Factor analysis of brand affect (BAF)
Factor analysis of brand affect
GAVISCON GELACID
CODE QUESTION FACTOR 1 FACTOR 1
BAF01 I attain a positive emotional response through the usage of
an OTC brand .839 .778
BAF02 The OTC brand I am loyal towards makes a difference in my
life .779 .832
BAF03 I am distressed when I am unable to purchase/use a
particular OTC brand .702 .627
Cronbach Alpha .816 .787
Total variance explained 60.158% 56.345%
The factor analysis of the brand affect influence has a factor loading which exceeds
the required 0.400 and therefore all questions (BAF01 to BAF03) should be included
to measure brand affect. Both Gaviscon and Gelacid show satisfactory reliability as
their respective Cronbach Alpha coefficients exceed 0.700 with 0.816 for Gaviscon
and 0.787 for Gelacid. All of the questions (BAF01 to BAF03) loaded onto one factor
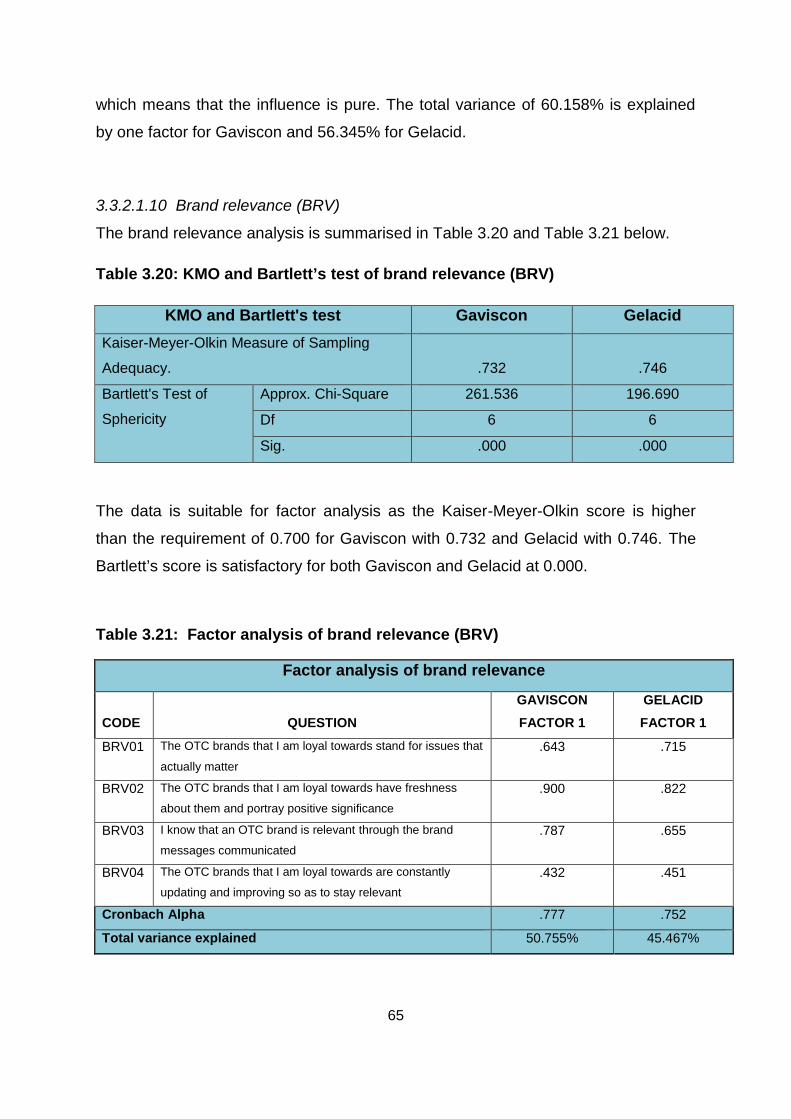
65
which means that the influence is pure. The total variance of 60.158% is explained
by one factor for Gaviscon and 56.345% for Gelacid.
3.3.2.1.10 Brand relevance (BRV)
The brand relevance analysis is summarised in Table 3.20 and Table 3.21 below.
Table 3.20: KMO and Bartlett’s test of brand relevance (BRV)
KMO and Bartlett's test Gaviscon Gelacid Kaiser-Meyer-Olkin Measure of Sampling
Adequacy.
.732 .746
Bartlett's Test of
Sphericity
Approx. Chi-Square 261.536 196.690
Df 6 6
Sig. .000 .000
The data is suitable for factor analysis as the Kaiser-Meyer-Olkin score is higher
than the requirement of 0.700 for Gaviscon with 0.732 and Gelacid with 0.746. The
Bartlett’s score is satisfactory for both Gaviscon and Gelacid at 0.000.
Table 3.21: Factor analysis of brand relevance (BRV)
Factor analysis of brand relevance
GAVISCON GELACID CODE QUESTION FACTOR 1 FACTOR 1
BRV01 The OTC brands that I am loyal towards stand for issues that
actually matter .643 .715
BRV02 The OTC brands that I am loyal towards have freshness
about them and portray positive significance .900 .822
BRV03 I know that an OTC brand is relevant through the brand
messages communicated .787 .655
BRV04 The OTC brands that I am loyal towards are constantly
updating and improving so as to stay relevant .432 .451
Cronbach Alpha .777 .752
Total variance explained 50.755% 45.467%
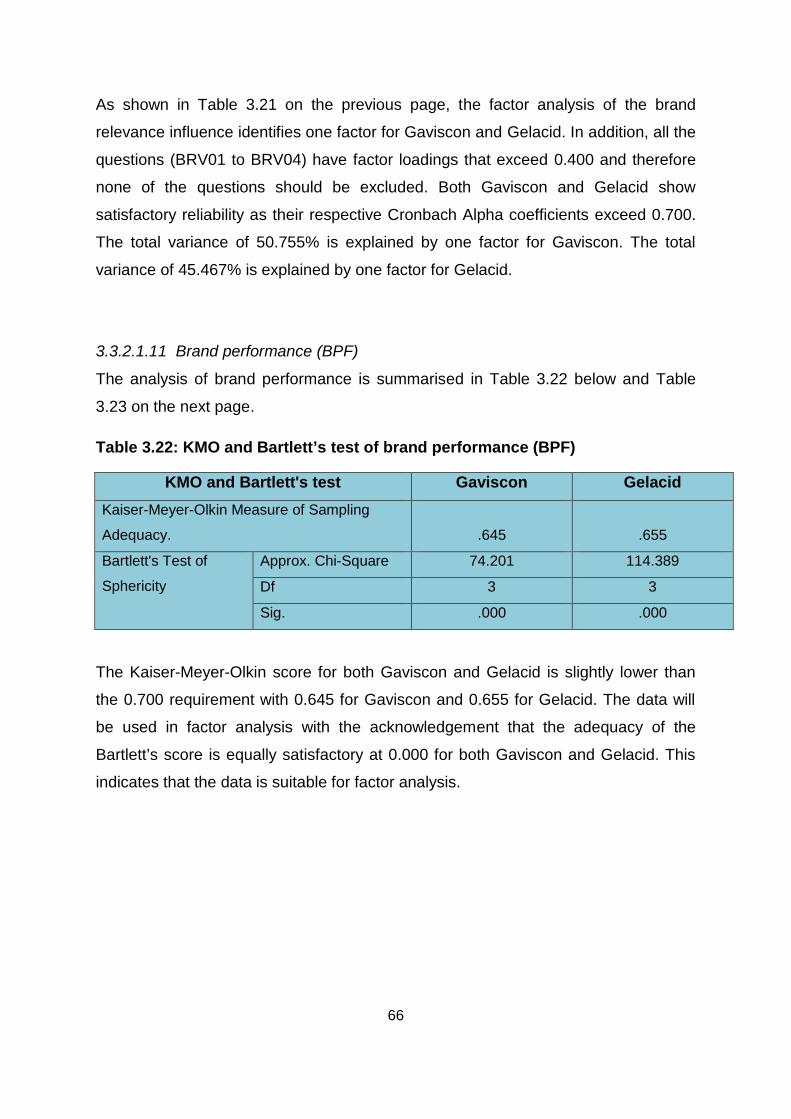
66
As shown in Table 3.21 on the previous page, the factor analysis of the brand
relevance influence identifies one factor for Gaviscon and Gelacid. In addition, all the
questions (BRV01 to BRV04) have factor loadings that exceed 0.400 and therefore
none of the questions should be excluded. Both Gaviscon and Gelacid show
satisfactory reliability as their respective Cronbach Alpha coefficients exceed 0.700.
The total variance of 50.755% is explained by one factor for Gaviscon. The total
variance of 45.467% is explained by one factor for Gelacid.
3.3.2.1.11 Brand performance (BPF)
The analysis of brand performance is summarised in Table 3.22 below and Table
3.23 on the next page.
Table 3.22: KMO and Bartlett’s test of brand performance (BPF)
KMO and Bartlett's test Gaviscon Gelacid Kaiser-Meyer-Olkin Measure of Sampling
Adequacy.
.645
.655
Bartlett's Test of
Sphericity
Approx. Chi-Square 74.201 114.389
Df 3 3
Sig. .000 .000
The Kaiser-Meyer-Olkin score for both Gaviscon and Gelacid is slightly lower than
the 0.700 requirement with 0.645 for Gaviscon and 0.655 for Gelacid. The data will
be used in factor analysis with the acknowledgement that the adequacy of the
Bartlett’s score is equally satisfactory at 0.000 for both Gaviscon and Gelacid. This
indicates that the data is suitable for factor analysis.
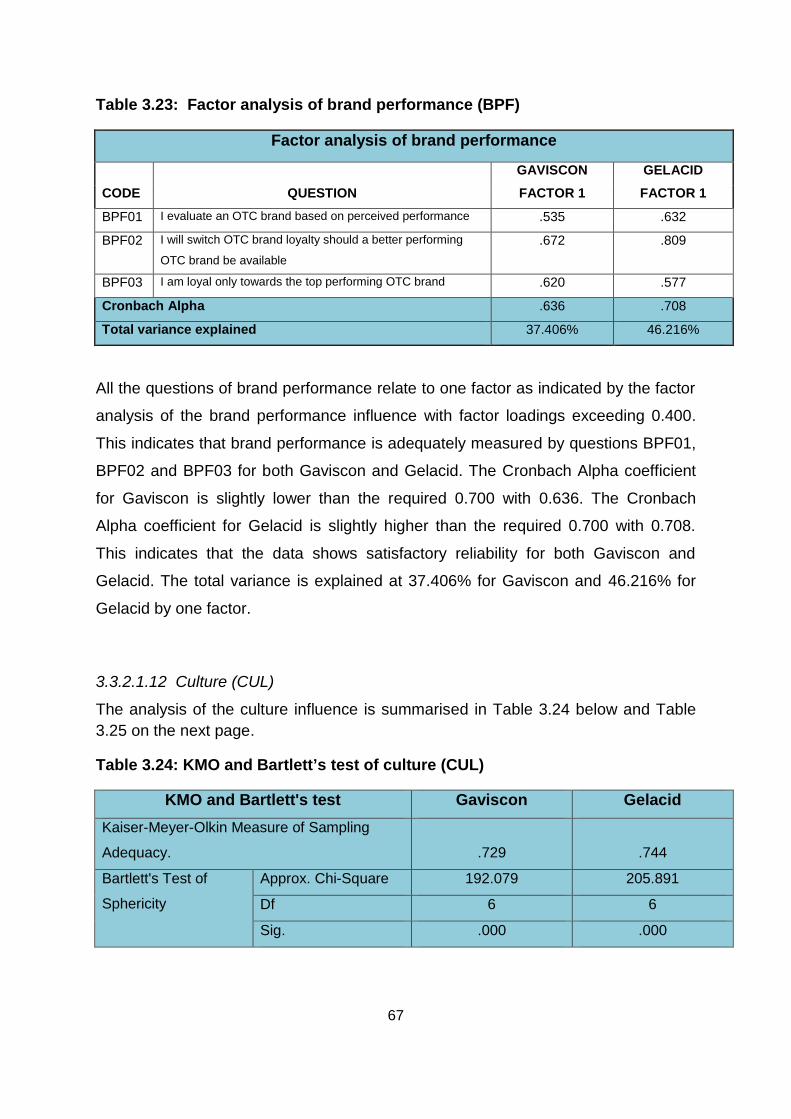
67
Table 3.23: Factor analysis of brand performance (BPF)
Factor analysis of brand performance
GAVISCON GELACID
CODE QUESTION FACTOR 1 FACTOR 1
BPF01 I evaluate an OTC brand based on perceived performance .535 .632
BPF02 I will switch OTC brand loyalty should a better performing
OTC brand be available .672 .809
BPF03 I am loyal only towards the top performing OTC brand .620 .577
Cronbach Alpha .636 .708
Total variance explained 37.406% 46.216%
All the questions of brand performance relate to one factor as indicated by the factor
analysis of the brand performance influence with factor loadings exceeding 0.400.
This indicates that brand performance is adequately measured by questions BPF01,
BPF02 and BPF03 for both Gaviscon and Gelacid. The Cronbach Alpha coefficient
for Gaviscon is slightly lower than the required 0.700 with 0.636. The Cronbach
Alpha coefficient for Gelacid is slightly higher than the required 0.700 with 0.708.
This indicates that the data shows satisfactory reliability for both Gaviscon and
Gelacid. The total variance is explained at 37.406% for Gaviscon and 46.216% for
Gelacid by one factor.
3.3.2.1.12 Culture (CUL)
The analysis of the culture influence is summarised in Table 3.24 below and Table 3.25 on the next page.
Table 3.24: KMO and Bartlett’s test of culture (CUL)
KMO and Bartlett's test Gaviscon Gelacid Kaiser-Meyer-Olkin Measure of Sampling
Adequacy.
.729 .744
Bartlett's Test of
Sphericity
Approx. Chi-Square 192.079 205.891
Df 6 6
Sig. .000 .000
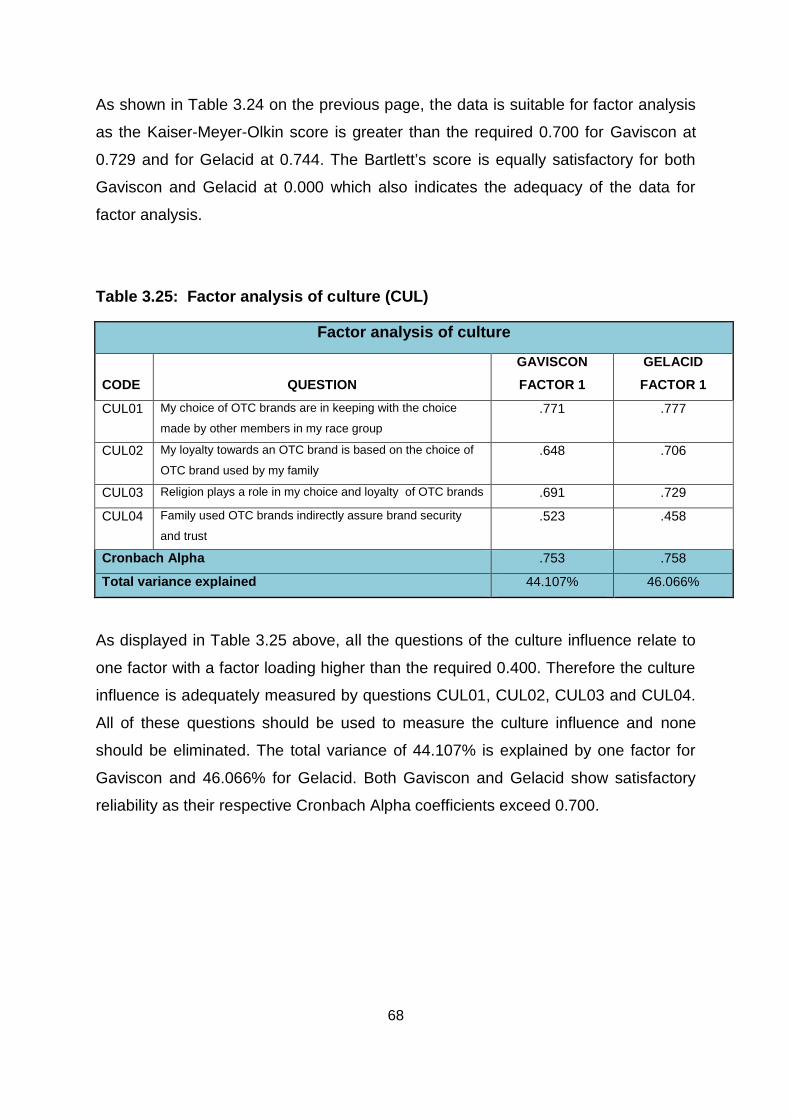
68
As shown in Table 3.24 on the previous page, the data is suitable for factor analysis
as the Kaiser-Meyer-Olkin score is greater than the required 0.700 for Gaviscon at
0.729 and for Gelacid at 0.744. The Bartlett’s score is equally satisfactory for both
Gaviscon and Gelacid at 0.000 which also indicates the adequacy of the data for
factor analysis.
Table 3.25: Factor analysis of culture (CUL)
Factor analysis of culture
GAVISCON GELACID
CODE QUESTION FACTOR 1 FACTOR 1
CUL01 My choice of OTC brands are in keeping with the choice
made by other members in my race group .771 .777
CUL02 My loyalty towards an OTC brand is based on the choice of
OTC brand used by my family .648 .706
CUL03 Religion plays a role in my choice and loyalty of OTC brands .691 .729
CUL04 Family used OTC brands indirectly assure brand security
and trust .523 .458
Cronbach Alpha .753 .758
Total variance explained 44.107% 46.066%
As displayed in Table 3.25 above, all the questions of the culture influence relate to
one factor with a factor loading higher than the required 0.400. Therefore the culture
influence is adequately measured by questions CUL01, CUL02, CUL03 and CUL04.
All of these questions should be used to measure the culture influence and none
should be eliminated. The total variance of 44.107% is explained by one factor for
Gaviscon and 46.066% for Gelacid. Both Gaviscon and Gelacid show satisfactory
reliability as their respective Cronbach Alpha coefficients exceed 0.700.
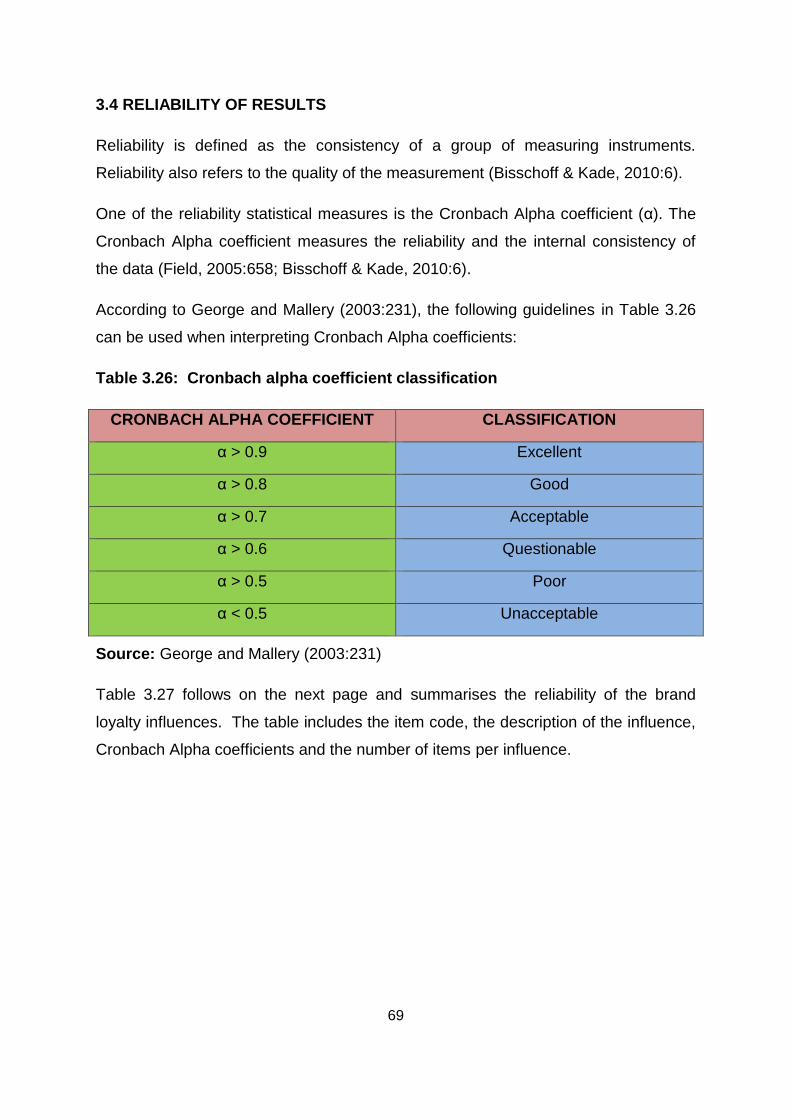
69
3.4 RELIABILITY OF RESULTS
Reliability is defined as the consistency of a group of measuring instruments.
Reliability also refers to the quality of the measurement (Bisschoff & Kade, 2010:6).
One of the reliability statistical measures is the Cronbach Alpha coefficient (α). The
Cronbach Alpha coefficient measures the reliability and the internal consistency of
the data (Field, 2005:658; Bisschoff & Kade, 2010:6).
According to George and Mallery (2003:231), the following guidelines in Table 3.26
can be used when interpreting Cronbach Alpha coefficients:
Table 3.26: Cronbach alpha coefficient classification
CRONBACH ALPHA COEFFICIENT CLASSIFICATION
α > 0.9 Excellent
α > 0.8 Good
α > 0.7 Acceptable
α > 0.6 Questionable
α > 0.5 Poor
α < 0.5 Unacceptable
Source: George and Mallery (2003:231)
Table 3.27 follows on the next page and summarises the reliability of the brand
loyalty influences. The table includes the item code, the description of the influence,
Cronbach Alpha coefficients and the number of items per influence.
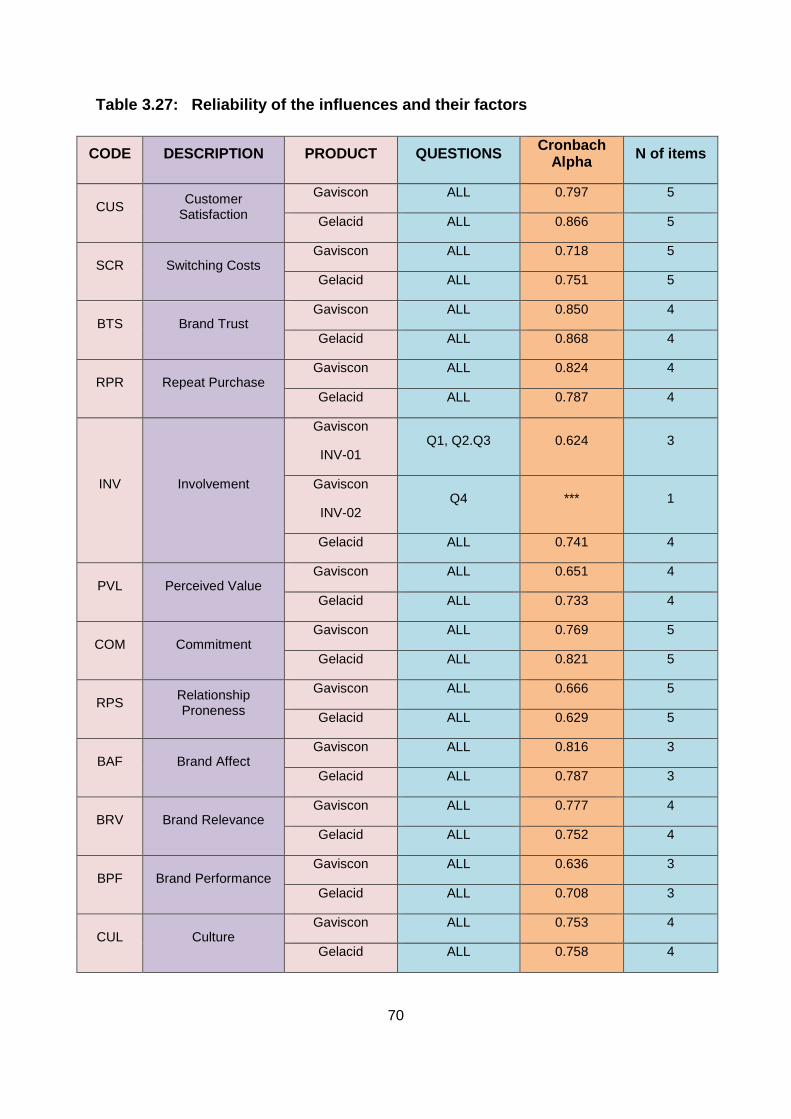
70
Table 3.27: Reliability of the influences and their factors
CODE DESCRIPTION PRODUCT QUESTIONS Cronbach Alpha N of items
CUS Customer Satisfaction
Gaviscon ALL 0.797 5
Gelacid ALL 0.866 5
SCR Switching Costs Gaviscon ALL 0.718 5
Gelacid ALL 0.751 5
BTS Brand Trust Gaviscon ALL 0.850 4
Gelacid ALL 0.868 4
RPR Repeat Purchase Gaviscon ALL 0.824 4
Gelacid ALL 0.787 4
INV Involvement
Gaviscon
INV-01 Q1, Q2.Q3 0.624 3
Gaviscon
INV-02 Q4 *** 1
Gelacid ALL 0.741 4
PVL Perceived Value Gaviscon ALL 0.651 4
Gelacid ALL 0.733 4
COM Commitment Gaviscon ALL 0.769 5
Gelacid ALL 0.821 5
RPS Relationship Proneness
Gaviscon ALL 0.666 5
Gelacid ALL 0.629 5
BAF Brand Affect Gaviscon ALL 0.816 3
Gelacid ALL 0.787 3
BRV Brand Relevance Gaviscon ALL 0.777 4
Gelacid ALL 0.752 4
BPF Brand Performance Gaviscon ALL 0.636 3
Gelacid ALL 0.708 3
CUL Culture Gaviscon ALL 0.753 4
Gelacid ALL 0.758 4
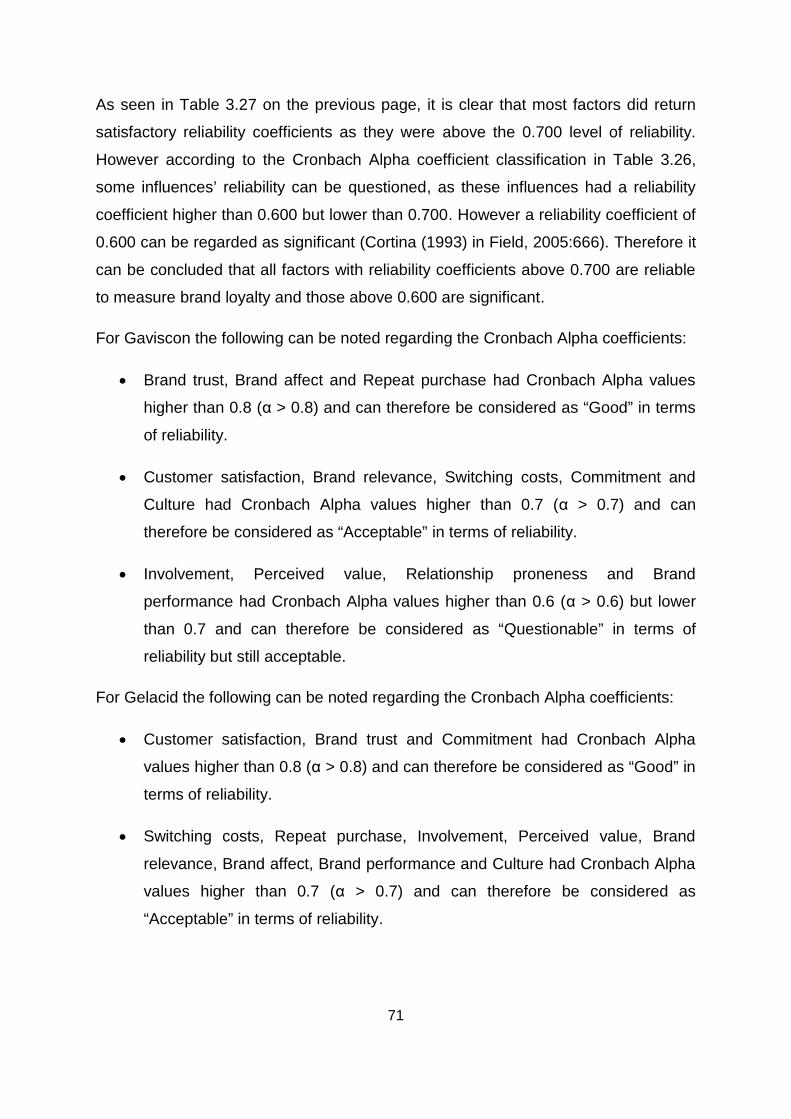
71
As seen in Table 3.27 on the previous page, it is clear that most factors did return
satisfactory reliability coefficients as they were above the 0.700 level of reliability.
However according to the Cronbach Alpha coefficient classification in Table 3.26,
some influences’ reliability can be questioned, as these influences had a reliability
coefficient higher than 0.600 but lower than 0.700. However a reliability coefficient of
0.600 can be regarded as significant (Cortina (1993) in Field, 2005:666). Therefore it
can be concluded that all factors with reliability coefficients above 0.700 are reliable
to measure brand loyalty and those above 0.600 are significant.
For Gaviscon the following can be noted regarding the Cronbach Alpha coefficients:
Brand trust, Brand affect and Repeat purchase had Cronbach Alpha values
higher than 0.8 (α > 0.8) and can therefore be considered as “Good” in terms
of reliability.
Customer satisfaction, Brand relevance, Switching costs, Commitment and
Culture had Cronbach Alpha values higher than 0.7 (α > 0.7) and can
therefore be considered as “Acceptable” in terms of reliability.
Involvement, Perceived value, Relationship proneness and Brand
performance had Cronbach Alpha values higher than 0.6 (α > 0.6) but lower
than 0.7 and can therefore be considered as “Questionable” in terms of
reliability but still acceptable.
For Gelacid the following can be noted regarding the Cronbach Alpha coefficients:
Customer satisfaction, Brand trust and Commitment had Cronbach Alpha
values higher than 0.8 (α > 0.8) and can therefore be considered as “Good” in
terms of reliability.
Switching costs, Repeat purchase, Involvement, Perceived value, Brand
relevance, Brand affect, Brand performance and Culture had Cronbach Alpha
values higher than 0.7 (α > 0.7) and can therefore be considered as
“Acceptable” in terms of reliability.
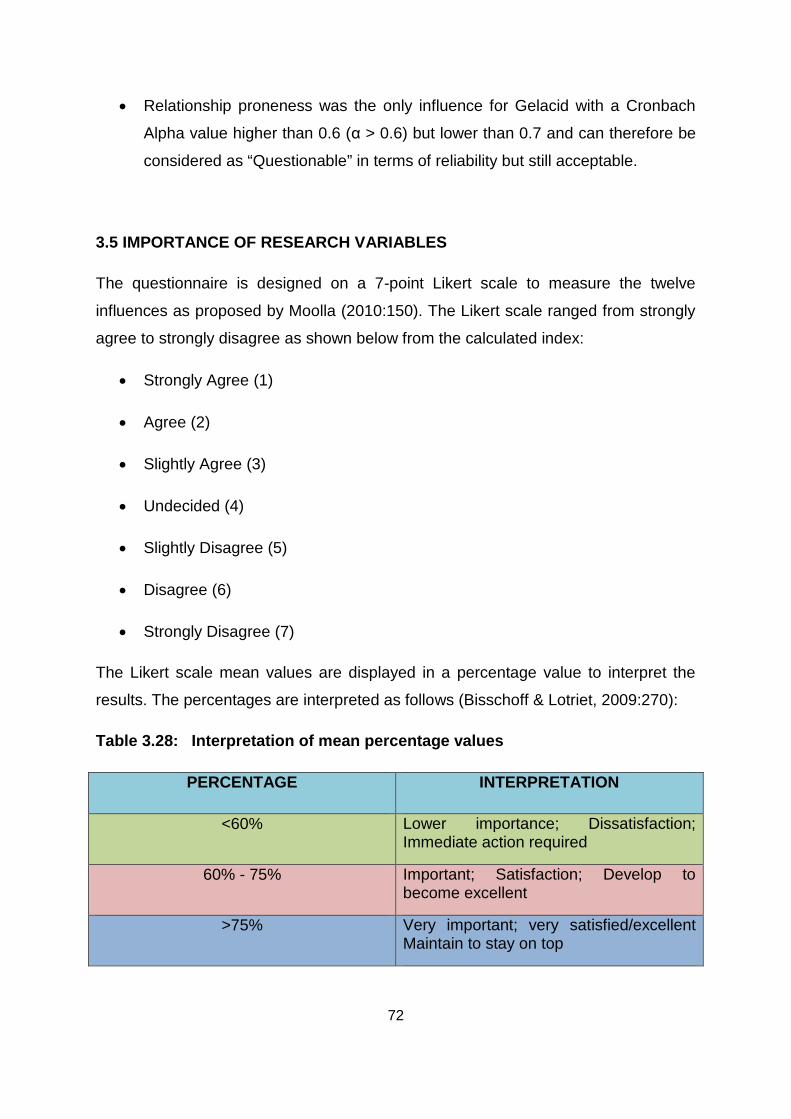
72
Relationship proneness was the only influence for Gelacid with a Cronbach
Alpha value higher than 0.6 (α > 0.6) but lower than 0.7 and can therefore be
considered as “Questionable” in terms of reliability but still acceptable.
3.5 IMPORTANCE OF RESEARCH VARIABLES
The questionnaire is designed on a 7-point Likert scale to measure the twelve
influences as proposed by Moolla (2010:150). The Likert scale ranged from strongly
agree to strongly disagree as shown below from the calculated index:
Strongly Agree (1)
Agree (2)
Slightly Agree (3)
Undecided (4)
Slightly Disagree (5)
Disagree (6)
Strongly Disagree (7)
The Likert scale mean values are displayed in a percentage value to interpret the
results. The percentages are interpreted as follows (Bisschoff & Lotriet, 2009:270):
Table 3.28: Interpretation of mean percentage values
PERCENTAGE INTERPRETATION
<60% Lower importance; Dissatisfaction; Immediate action required
60% - 75% Important; Satisfaction; Develop to become excellent
>75% Very important; very satisfied/excellent Maintain to stay on top
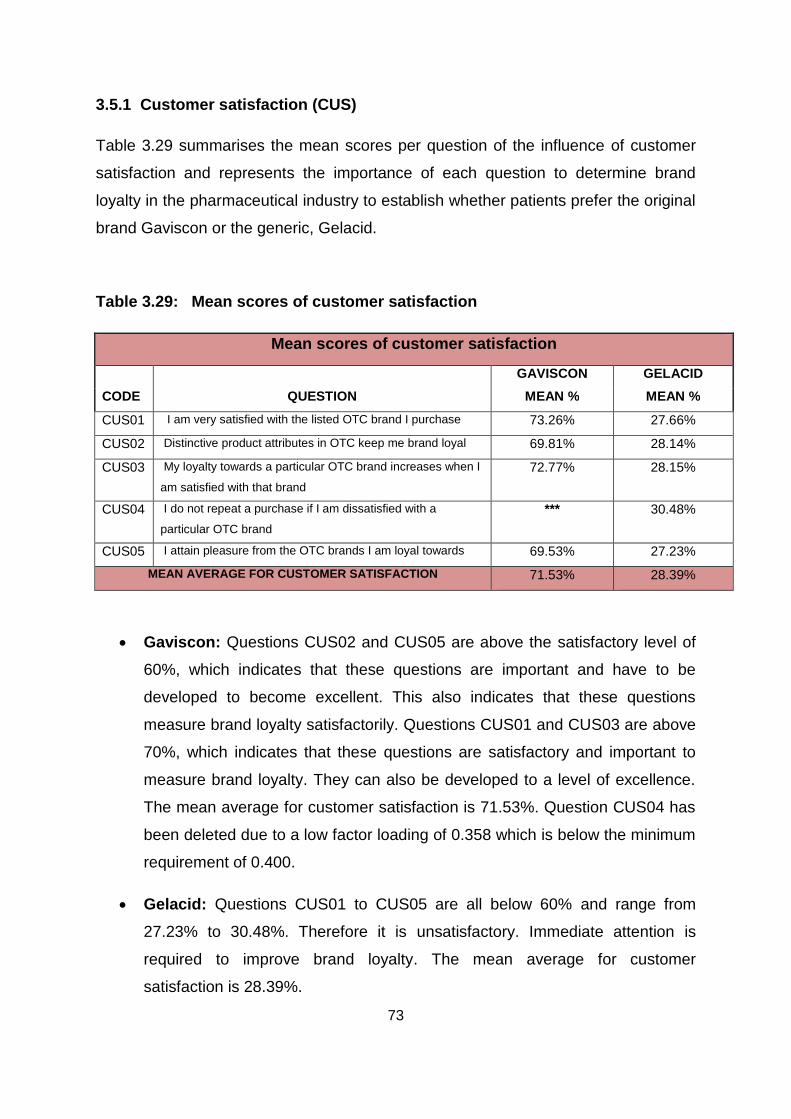
73
3.5.1 Customer satisfaction (CUS)
Table 3.29 summarises the mean scores per question of the influence of customer
satisfaction and represents the importance of each question to determine brand
loyalty in the pharmaceutical industry to establish whether patients prefer the original
brand Gaviscon or the generic, Gelacid.
Table 3.29: Mean scores of customer satisfaction
Mean scores of customer satisfaction
GAVISCON GELACID CODE QUESTION MEAN % MEAN %
CUS01 I am very satisfied with the listed OTC brand I purchase 73.26% 27.66%
CUS02 Distinctive product attributes in OTC keep me brand loyal 69.81% 28.14%
CUS03 My loyalty towards a particular OTC brand increases when I
am satisfied with that brand 72.77% 28.15%
CUS04 I do not repeat a purchase if I am dissatisfied with a
particular OTC brand *** 30.48%
CUS05 I attain pleasure from the OTC brands I am loyal towards 69.53% 27.23%
MEAN AVERAGE FOR CUSTOMER SATISFACTION 71.53% 28.39%
Gaviscon: Questions CUS02 and CUS05 are above the satisfactory level of
60%, which indicates that these questions are important and have to be
developed to become excellent. This also indicates that these questions
measure brand loyalty satisfactorily. Questions CUS01 and CUS03 are above
70%, which indicates that these questions are satisfactory and important to
measure brand loyalty. They can also be developed to a level of excellence.
The mean average for customer satisfaction is 71.53%. Question CUS04 has
been deleted due to a low factor loading of 0.358 which is below the minimum
requirement of 0.400.
Gelacid: Questions CUS01 to CUS05 are all below 60% and range from
27.23% to 30.48%. Therefore it is unsatisfactory. Immediate attention is
required to improve brand loyalty. The mean average for customer
satisfaction is 28.39%.
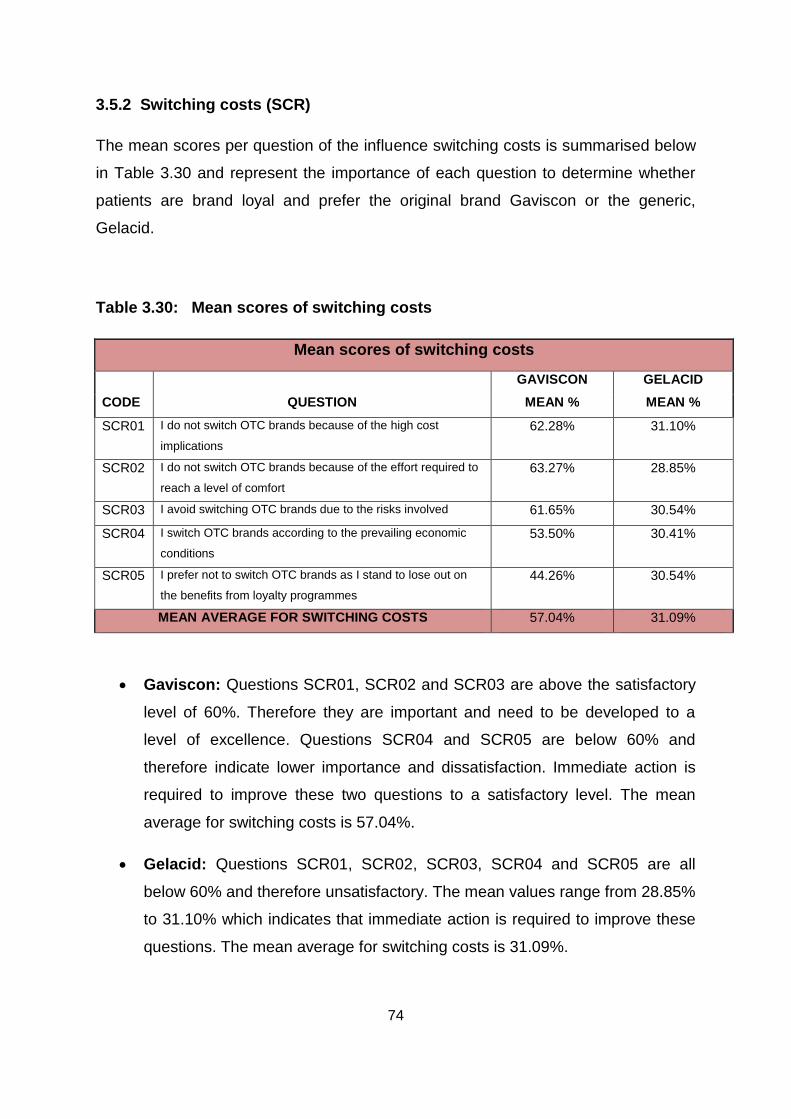
74
3.5.2 Switching costs (SCR)
The mean scores per question of the influence switching costs is summarised below
in Table 3.30 and represent the importance of each question to determine whether
patients are brand loyal and prefer the original brand Gaviscon or the generic,
Gelacid.
Table 3.30: Mean scores of switching costs
Mean scores of switching costs
GAVISCON GELACID CODE QUESTION MEAN % MEAN %
SCR01 I do not switch OTC brands because of the high cost
implications 62.28% 31.10%
SCR02 I do not switch OTC brands because of the effort required to
reach a level of comfort 63.27% 28.85%
SCR03 I avoid switching OTC brands due to the risks involved 61.65% 30.54%
SCR04 I switch OTC brands according to the prevailing economic
conditions 53.50% 30.41%
SCR05 I prefer not to switch OTC brands as I stand to lose out on
the benefits from loyalty programmes 44.26% 30.54%
MEAN AVERAGE FOR SWITCHING COSTS 57.04% 31.09%
Gaviscon: Questions SCR01, SCR02 and SCR03 are above the satisfactory
level of 60%. Therefore they are important and need to be developed to a
level of excellence. Questions SCR04 and SCR05 are below 60% and
therefore indicate lower importance and dissatisfaction. Immediate action is
required to improve these two questions to a satisfactory level. The mean
average for switching costs is 57.04%.
Gelacid: Questions SCR01, SCR02, SCR03, SCR04 and SCR05 are all
below 60% and therefore unsatisfactory. The mean values range from 28.85%
to 31.10% which indicates that immediate action is required to improve these
questions. The mean average for switching costs is 31.09%.
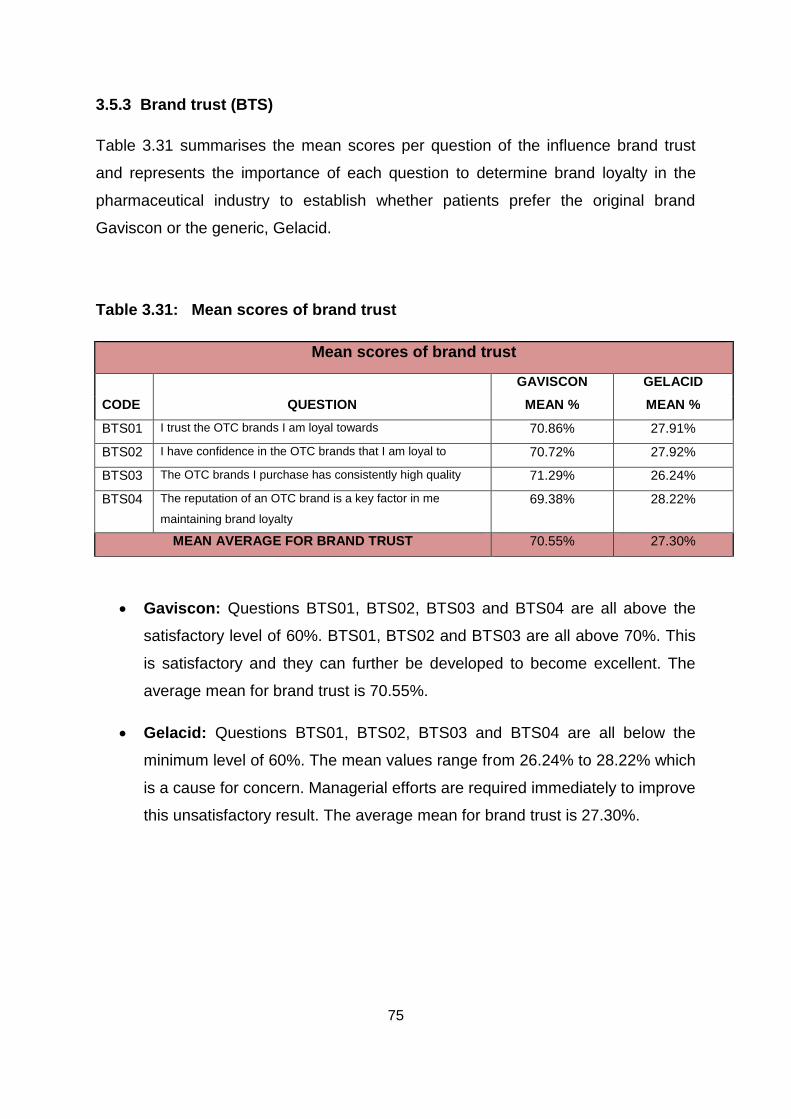
75
3.5.3 Brand trust (BTS)
Table 3.31 summarises the mean scores per question of the influence brand trust
and represents the importance of each question to determine brand loyalty in the
pharmaceutical industry to establish whether patients prefer the original brand
Gaviscon or the generic, Gelacid.
Table 3.31: Mean scores of brand trust
Mean scores of brand trust
GAVISCON GELACID
CODE QUESTION MEAN % MEAN %
BTS01 I trust the OTC brands I am loyal towards 70.86% 27.91%
BTS02 I have confidence in the OTC brands that I am loyal to 70.72% 27.92%
BTS03 The OTC brands I purchase has consistently high quality 71.29% 26.24%
BTS04 The reputation of an OTC brand is a key factor in me
maintaining brand loyalty 69.38% 28.22%
MEAN AVERAGE FOR BRAND TRUST 70.55% 27.30%
Gaviscon: Questions BTS01, BTS02, BTS03 and BTS04 are all above the
satisfactory level of 60%. BTS01, BTS02 and BTS03 are all above 70%. This
is satisfactory and they can further be developed to become excellent. The
average mean for brand trust is 70.55%.
Gelacid: Questions BTS01, BTS02, BTS03 and BTS04 are all below the
minimum level of 60%. The mean values range from 26.24% to 28.22% which
is a cause for concern. Managerial efforts are required immediately to improve
this unsatisfactory result. The average mean for brand trust is 27.30%.
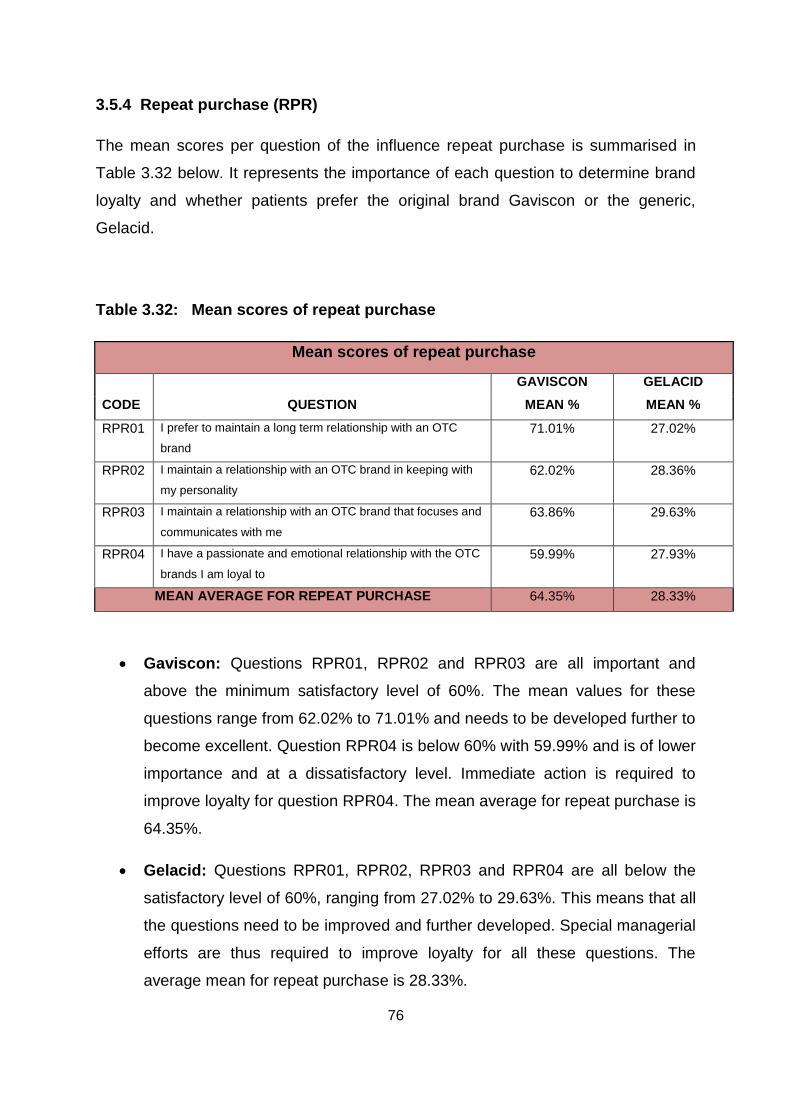
76
3.5.4 Repeat purchase (RPR)
The mean scores per question of the influence repeat purchase is summarised in
Table 3.32 below. It represents the importance of each question to determine brand
loyalty and whether patients prefer the original brand Gaviscon or the generic,
Gelacid.
Table 3.32: Mean scores of repeat purchase
Mean scores of repeat purchase
GAVISCON GELACID
CODE QUESTION MEAN % MEAN %
RPR01 I prefer to maintain a long term relationship with an OTC
brand 71.01% 27.02%
RPR02 I maintain a relationship with an OTC brand in keeping with
my personality 62.02% 28.36%
RPR03 I maintain a relationship with an OTC brand that focuses and
communicates with me 63.86% 29.63%
RPR04 I have a passionate and emotional relationship with the OTC
brands I am loyal to 59.99% 27.93%
MEAN AVERAGE FOR REPEAT PURCHASE 64.35% 28.33%
Gaviscon: Questions RPR01, RPR02 and RPR03 are all important and
above the minimum satisfactory level of 60%. The mean values for these
questions range from 62.02% to 71.01% and needs to be developed further to
become excellent. Question RPR04 is below 60% with 59.99% and is of lower
importance and at a dissatisfactory level. Immediate action is required to
improve loyalty for question RPR04. The mean average for repeat purchase is
64.35%.
Gelacid: Questions RPR01, RPR02, RPR03 and RPR04 are all below the
satisfactory level of 60%, ranging from 27.02% to 29.63%. This means that all
the questions need to be improved and further developed. Special managerial
efforts are thus required to improve loyalty for all these questions. The
average mean for repeat purchase is 28.33%.
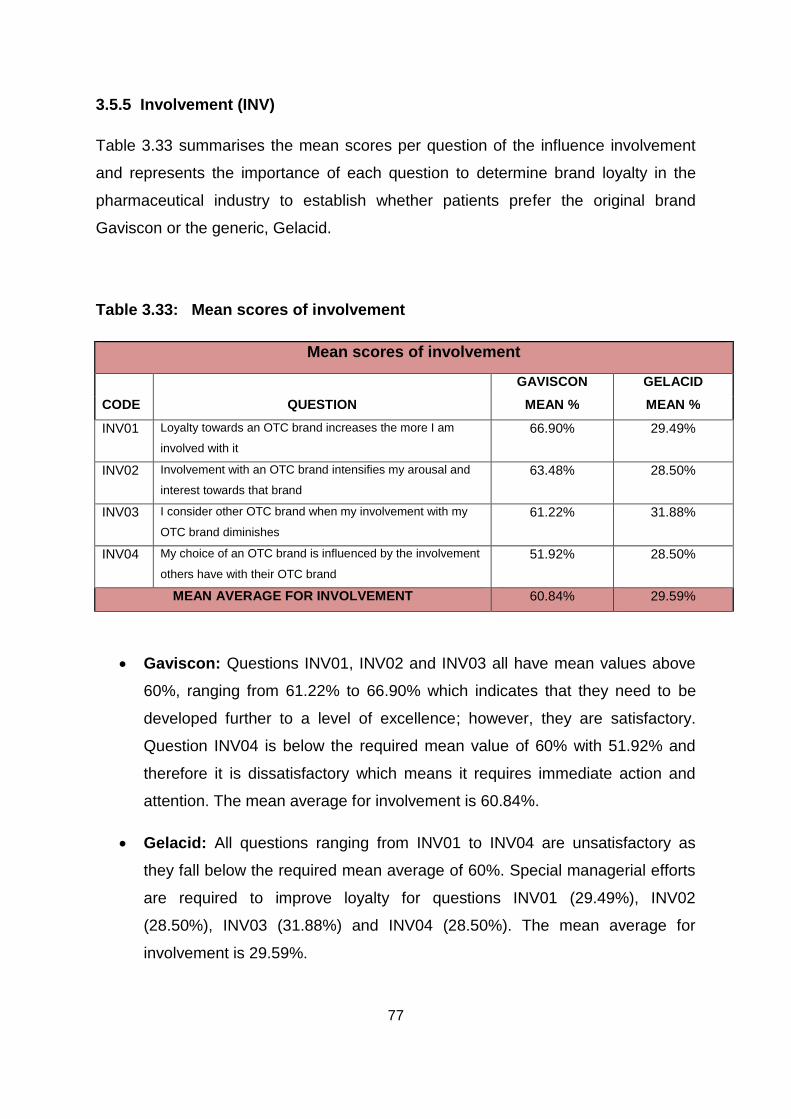
77
3.5.5 Involvement (INV)
Table 3.33 summarises the mean scores per question of the influence involvement
and represents the importance of each question to determine brand loyalty in the
pharmaceutical industry to establish whether patients prefer the original brand
Gaviscon or the generic, Gelacid.
Table 3.33: Mean scores of involvement
Mean scores of involvement
GAVISCON GELACID
CODE QUESTION MEAN % MEAN %
INV01 Loyalty towards an OTC brand increases the more I am
involved with it 66.90% 29.49%
INV02 Involvement with an OTC brand intensifies my arousal and
interest towards that brand 63.48% 28.50%
INV03 I consider other OTC brand when my involvement with my
OTC brand diminishes 61.22% 31.88%
INV04 My choice of an OTC brand is influenced by the involvement
others have with their OTC brand 51.92% 28.50%
MEAN AVERAGE FOR INVOLVEMENT 60.84% 29.59%
Gaviscon: Questions INV01, INV02 and INV03 all have mean values above
60%, ranging from 61.22% to 66.90% which indicates that they need to be
developed further to a level of excellence; however, they are satisfactory.
Question INV04 is below the required mean value of 60% with 51.92% and
therefore it is dissatisfactory which means it requires immediate action and
attention. The mean average for involvement is 60.84%.
Gelacid: All questions ranging from INV01 to INV04 are unsatisfactory as
they fall below the required mean average of 60%. Special managerial efforts
are required to improve loyalty for questions INV01 (29.49%), INV02
(28.50%), INV03 (31.88%) and INV04 (28.50%). The mean average for
involvement is 29.59%.
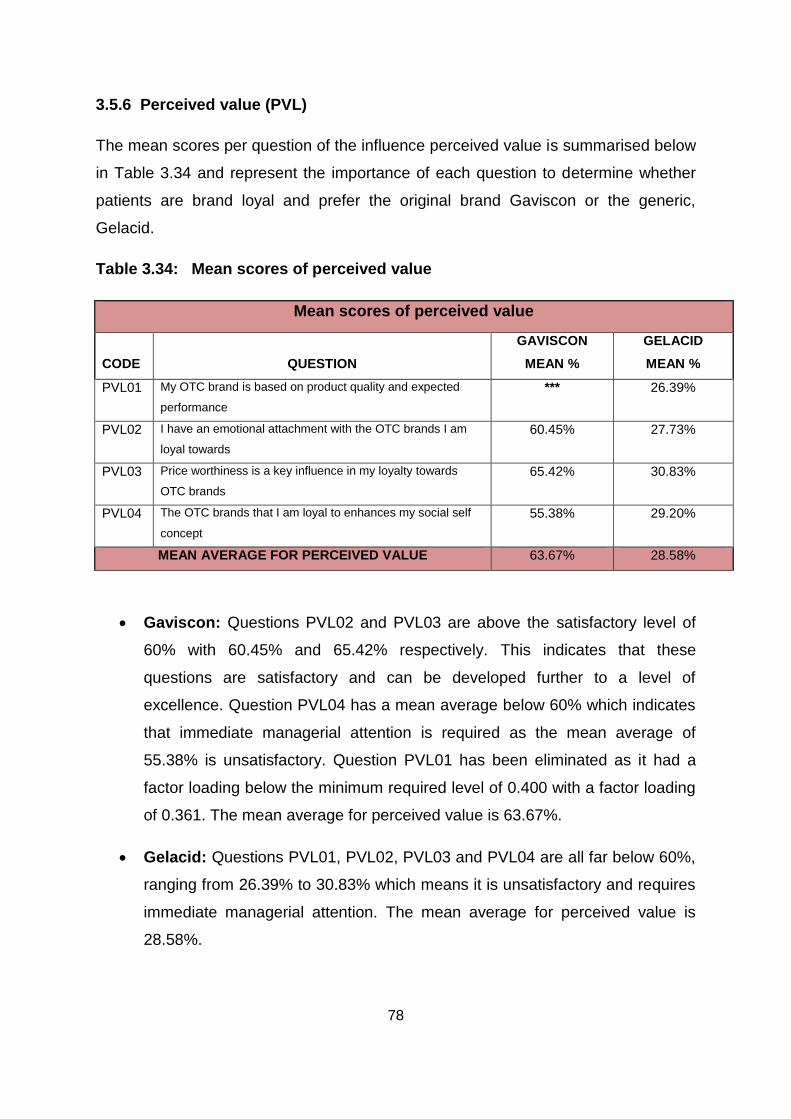
78
3.5.6 Perceived value (PVL)
The mean scores per question of the influence perceived value is summarised below
in Table 3.34 and represent the importance of each question to determine whether
patients are brand loyal and prefer the original brand Gaviscon or the generic,
Gelacid.
Table 3.34: Mean scores of perceived value
Mean scores of perceived value
GAVISCON GELACID
CODE QUESTION MEAN % MEAN %
PVL01 My OTC brand is based on product quality and expected
performance *** 26.39%
PVL02 I have an emotional attachment with the OTC brands I am
loyal towards 60.45% 27.73%
PVL03 Price worthiness is a key influence in my loyalty towards
OTC brands 65.42% 30.83%
PVL04 The OTC brands that I am loyal to enhances my social self
concept 55.38% 29.20%
MEAN AVERAGE FOR PERCEIVED VALUE 63.67% 28.58%
Gaviscon: Questions PVL02 and PVL03 are above the satisfactory level of
60% with 60.45% and 65.42% respectively. This indicates that these
questions are satisfactory and can be developed further to a level of
excellence. Question PVL04 has a mean average below 60% which indicates
that immediate managerial attention is required as the mean average of
55.38% is unsatisfactory. Question PVL01 has been eliminated as it had a
factor loading below the minimum required level of 0.400 with a factor loading
of 0.361. The mean average for perceived value is 63.67%.
Gelacid: Questions PVL01, PVL02, PVL03 and PVL04 are all far below 60%,
ranging from 26.39% to 30.83% which means it is unsatisfactory and requires
immediate managerial attention. The mean average for perceived value is
28.58%.
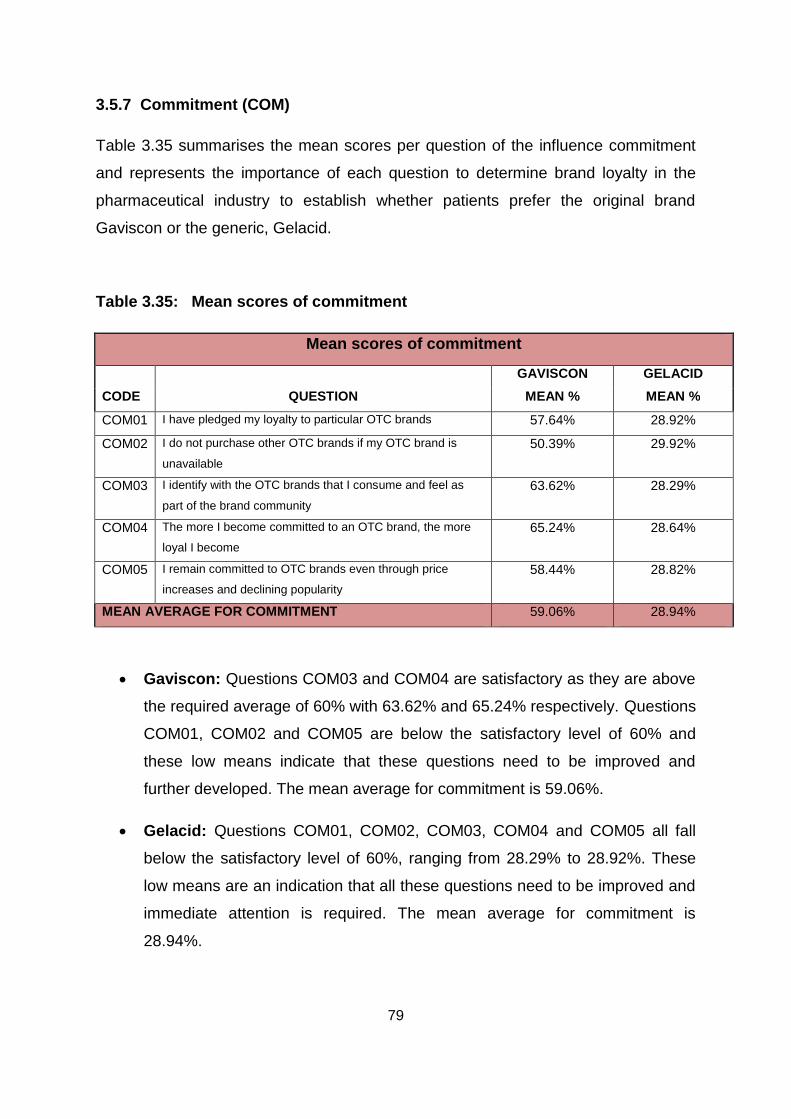
79
3.5.7 Commitment (COM)
Table 3.35 summarises the mean scores per question of the influence commitment
and represents the importance of each question to determine brand loyalty in the
pharmaceutical industry to establish whether patients prefer the original brand
Gaviscon or the generic, Gelacid.
Table 3.35: Mean scores of commitment
Mean scores of commitment
GAVISCON GELACID CODE QUESTION MEAN % MEAN %
COM01 I have pledged my loyalty to particular OTC brands 57.64% 28.92%
COM02 I do not purchase other OTC brands if my OTC brand is
unavailable 50.39% 29.92%
COM03 I identify with the OTC brands that I consume and feel as
part of the brand community 63.62% 28.29%
COM04 The more I become committed to an OTC brand, the more
loyal I become 65.24% 28.64%
COM05 I remain committed to OTC brands even through price
increases and declining popularity 58.44% 28.82%
MEAN AVERAGE FOR COMMITMENT 59.06% 28.94%
Gaviscon: Questions COM03 and COM04 are satisfactory as they are above
the required average of 60% with 63.62% and 65.24% respectively. Questions
COM01, COM02 and COM05 are below the satisfactory level of 60% and
these low means indicate that these questions need to be improved and
further developed. The mean average for commitment is 59.06%.
Gelacid: Questions COM01, COM02, COM03, COM04 and COM05 all fall
below the satisfactory level of 60%, ranging from 28.29% to 28.92%. These
low means are an indication that all these questions need to be improved and
immediate attention is required. The mean average for commitment is
28.94%.
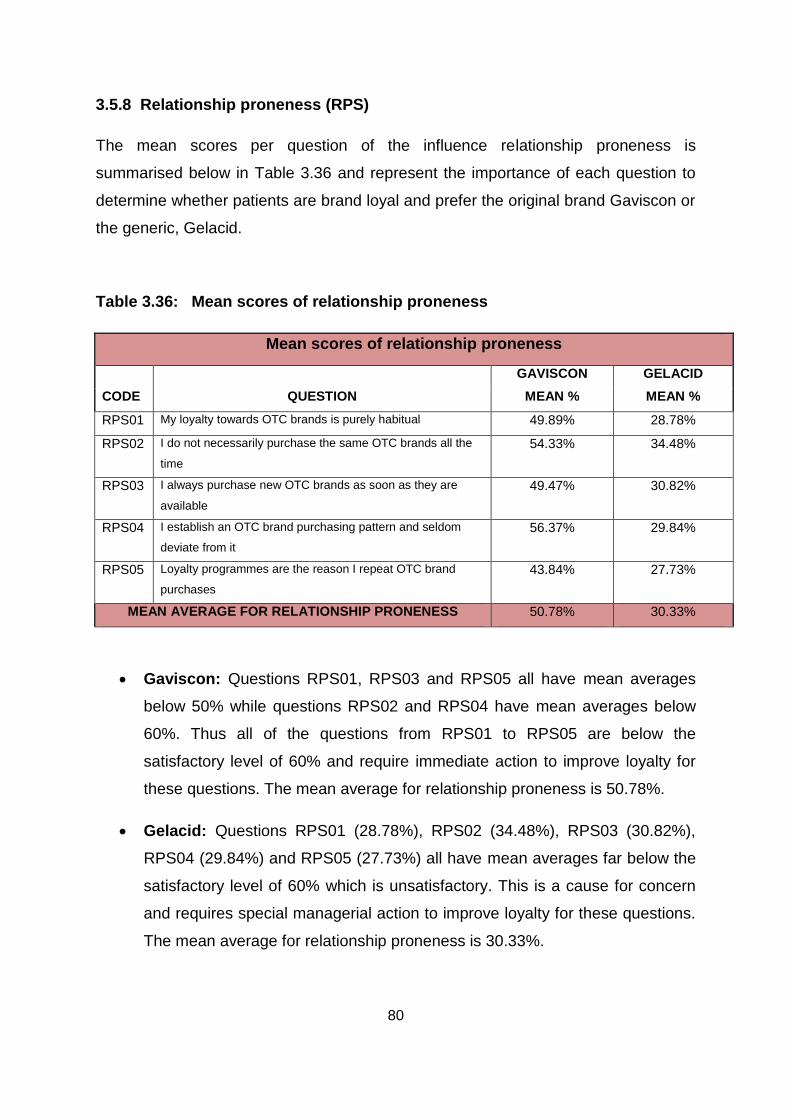
80
3.5.8 Relationship proneness (RPS)
The mean scores per question of the influence relationship proneness is
summarised below in Table 3.36 and represent the importance of each question to
determine whether patients are brand loyal and prefer the original brand Gaviscon or
the generic, Gelacid.
Table 3.36: Mean scores of relationship proneness
Mean scores of relationship proneness
GAVISCON GELACID CODE QUESTION MEAN % MEAN %
RPS01 My loyalty towards OTC brands is purely habitual 49.89% 28.78%
RPS02 I do not necessarily purchase the same OTC brands all the
time 54.33% 34.48%
RPS03 I always purchase new OTC brands as soon as they are
available 49.47% 30.82%
RPS04 I establish an OTC brand purchasing pattern and seldom
deviate from it 56.37% 29.84%
RPS05 Loyalty programmes are the reason I repeat OTC brand
purchases 43.84% 27.73%
MEAN AVERAGE FOR RELATIONSHIP PRONENESS 50.78% 30.33%
Gaviscon: Questions RPS01, RPS03 and RPS05 all have mean averages
below 50% while questions RPS02 and RPS04 have mean averages below
60%. Thus all of the questions from RPS01 to RPS05 are below the
satisfactory level of 60% and require immediate action to improve loyalty for
these questions. The mean average for relationship proneness is 50.78%.
Gelacid: Questions RPS01 (28.78%), RPS02 (34.48%), RPS03 (30.82%),
RPS04 (29.84%) and RPS05 (27.73%) all have mean averages far below the
satisfactory level of 60% which is unsatisfactory. This is a cause for concern
and requires special managerial action to improve loyalty for these questions.
The mean average for relationship proneness is 30.33%.
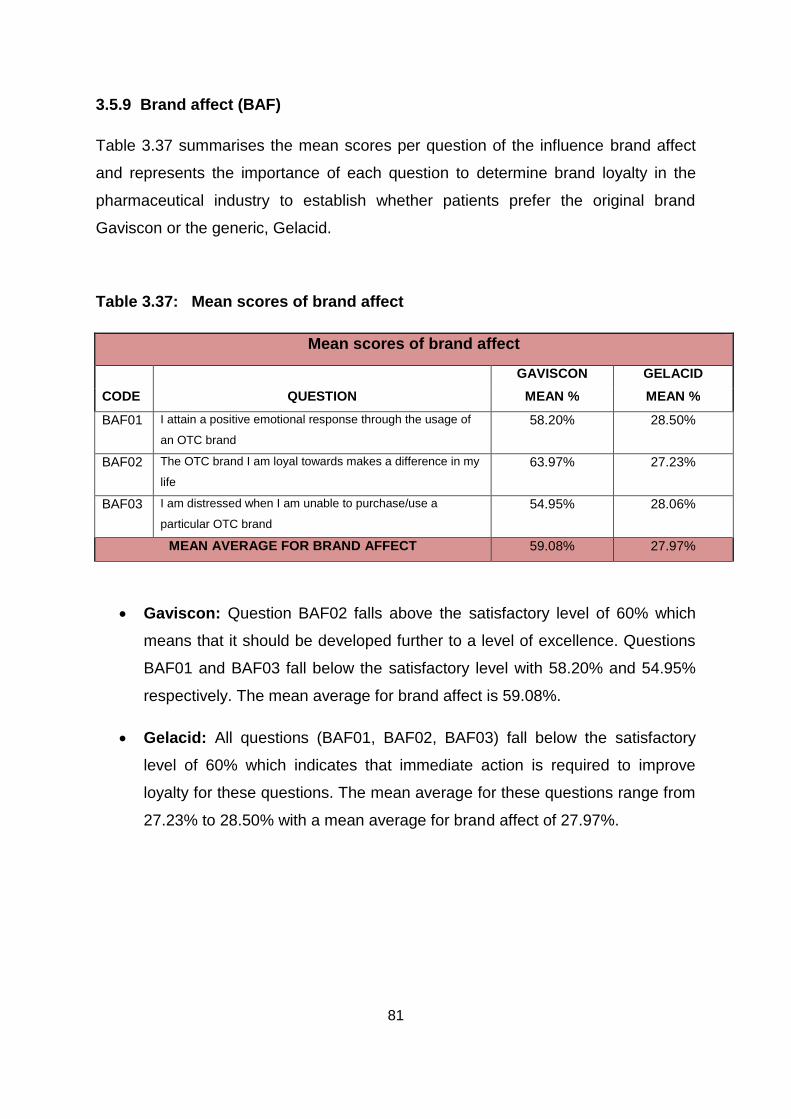
81
3.5.9 Brand affect (BAF)
Table 3.37 summarises the mean scores per question of the influence brand affect
and represents the importance of each question to determine brand loyalty in the
pharmaceutical industry to establish whether patients prefer the original brand
Gaviscon or the generic, Gelacid.
Table 3.37: Mean scores of brand affect
Mean scores of brand affect
GAVISCON GELACID CODE QUESTION MEAN % MEAN %
BAF01 I attain a positive emotional response through the usage of
an OTC brand 58.20% 28.50%
BAF02 The OTC brand I am loyal towards makes a difference in my
life 63.97% 27.23%
BAF03 I am distressed when I am unable to purchase/use a
particular OTC brand 54.95% 28.06%
MEAN AVERAGE FOR BRAND AFFECT 59.08% 27.97%
Gaviscon: Question BAF02 falls above the satisfactory level of 60% which
means that it should be developed further to a level of excellence. Questions
BAF01 and BAF03 fall below the satisfactory level with 58.20% and 54.95%
respectively. The mean average for brand affect is 59.08%.
Gelacid: All questions (BAF01, BAF02, BAF03) fall below the satisfactory
level of 60% which indicates that immediate action is required to improve
loyalty for these questions. The mean average for these questions range from
27.23% to 28.50% with a mean average for brand affect of 27.97%.
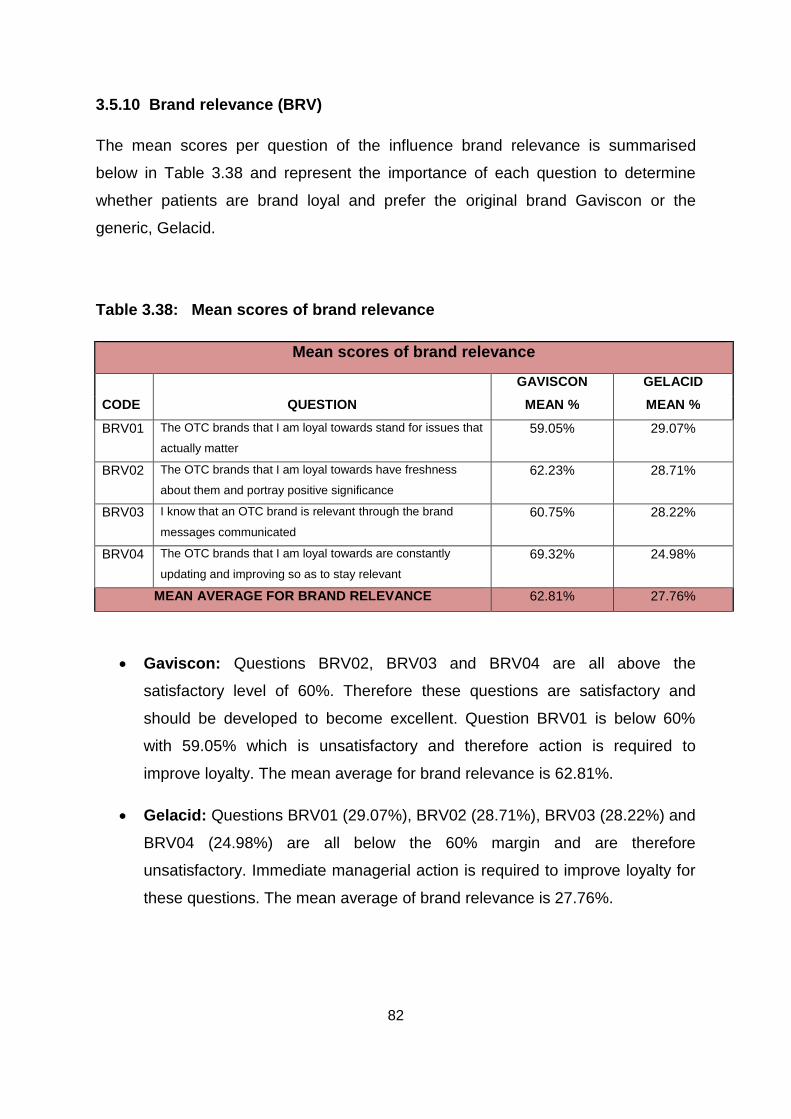
82
3.5.10 Brand relevance (BRV)
The mean scores per question of the influence brand relevance is summarised
below in Table 3.38 and represent the importance of each question to determine
whether patients are brand loyal and prefer the original brand Gaviscon or the
generic, Gelacid.
Table 3.38: Mean scores of brand relevance
Mean scores of brand relevance
GAVISCON GELACID
CODE QUESTION MEAN % MEAN %
BRV01 The OTC brands that I am loyal towards stand for issues that
actually matter 59.05% 29.07%
BRV02 The OTC brands that I am loyal towards have freshness
about them and portray positive significance 62.23% 28.71%
BRV03 I know that an OTC brand is relevant through the brand
messages communicated 60.75% 28.22%
BRV04 The OTC brands that I am loyal towards are constantly
updating and improving so as to stay relevant 69.32% 24.98%
MEAN AVERAGE FOR BRAND RELEVANCE 62.81% 27.76%
Gaviscon: Questions BRV02, BRV03 and BRV04 are all above the
satisfactory level of 60%. Therefore these questions are satisfactory and
should be developed to become excellent. Question BRV01 is below 60%
with 59.05% which is unsatisfactory and therefore action is required to
improve loyalty. The mean average for brand relevance is 62.81%.
Gelacid: Questions BRV01 (29.07%), BRV02 (28.71%), BRV03 (28.22%) and
BRV04 (24.98%) are all below the 60% margin and are therefore
unsatisfactory. Immediate managerial action is required to improve loyalty for
these questions. The mean average of brand relevance is 27.76%.
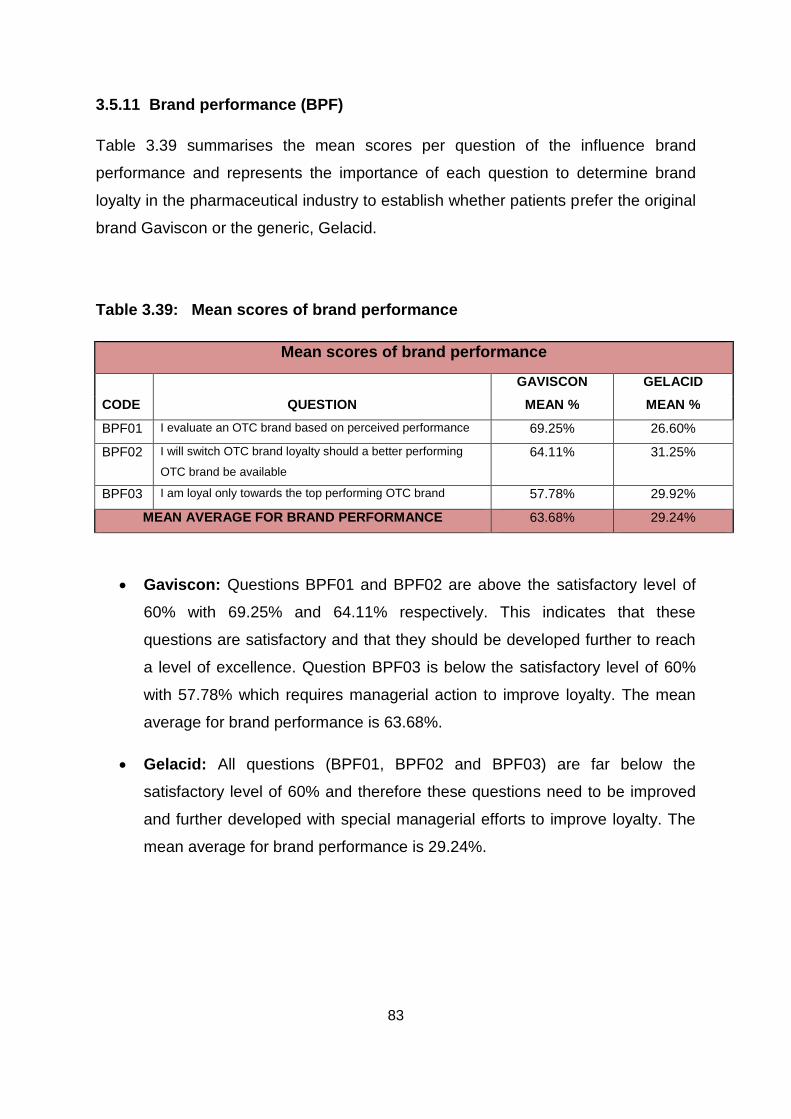
83
3.5.11 Brand performance (BPF)
Table 3.39 summarises the mean scores per question of the influence brand
performance and represents the importance of each question to determine brand
loyalty in the pharmaceutical industry to establish whether patients prefer the original
brand Gaviscon or the generic, Gelacid.
Table 3.39: Mean scores of brand performance
Mean scores of brand performance
GAVISCON GELACID
CODE QUESTION MEAN % MEAN %
BPF01 I evaluate an OTC brand based on perceived performance 69.25% 26.60%
BPF02 I will switch OTC brand loyalty should a better performing
OTC brand be available 64.11% 31.25%
BPF03 I am loyal only towards the top performing OTC brand 57.78% 29.92%
MEAN AVERAGE FOR BRAND PERFORMANCE 63.68% 29.24%
Gaviscon: Questions BPF01 and BPF02 are above the satisfactory level of
60% with 69.25% and 64.11% respectively. This indicates that these
questions are satisfactory and that they should be developed further to reach
a level of excellence. Question BPF03 is below the satisfactory level of 60%
with 57.78% which requires managerial action to improve loyalty. The mean
average for brand performance is 63.68%.
Gelacid: All questions (BPF01, BPF02 and BPF03) are far below the
satisfactory level of 60% and therefore these questions need to be improved
and further developed with special managerial efforts to improve loyalty. The
mean average for brand performance is 29.24%.
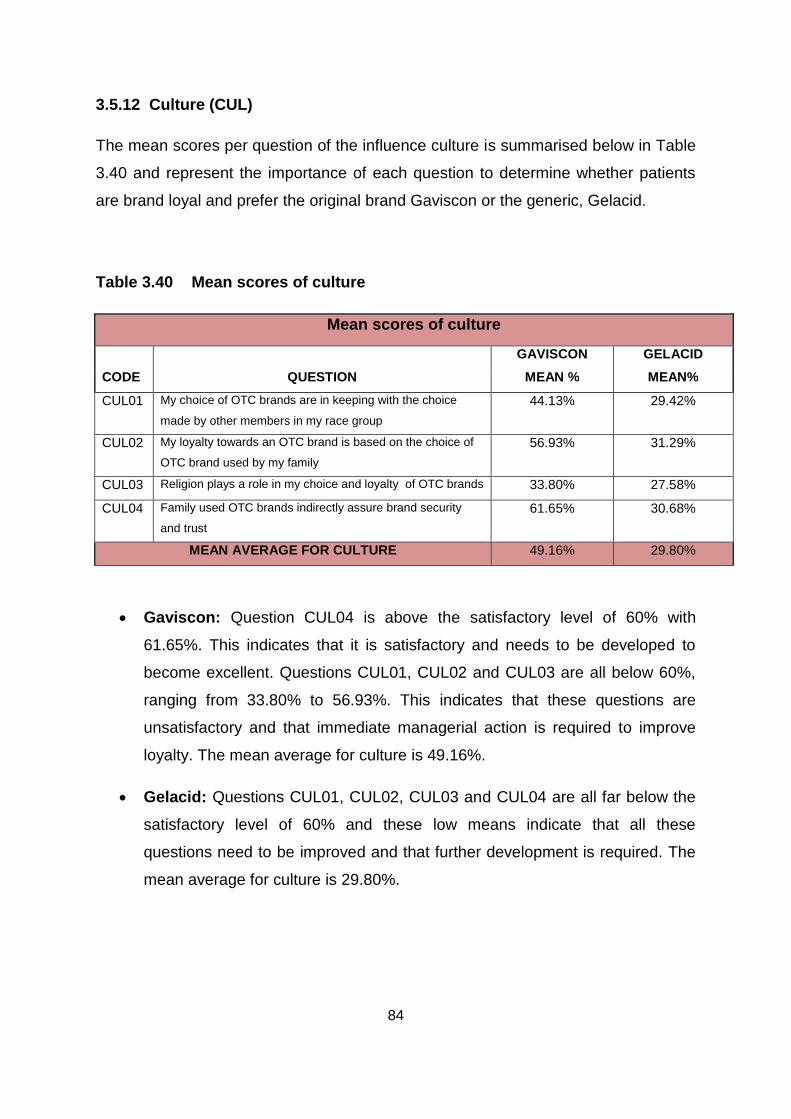
84
3.5.12 Culture (CUL)
The mean scores per question of the influence culture is summarised below in Table
3.40 and represent the importance of each question to determine whether patients
are brand loyal and prefer the original brand Gaviscon or the generic, Gelacid.
Table 3.40 Mean scores of culture
Mean scores of culture
GAVISCON GELACID
CODE QUESTION MEAN % MEAN%
CUL01 My choice of OTC brands are in keeping with the choice
made by other members in my race group 44.13% 29.42%
CUL02 My loyalty towards an OTC brand is based on the choice of
OTC brand used by my family 56.93% 31.29%
CUL03 Religion plays a role in my choice and loyalty of OTC brands 33.80% 27.58%
CUL04 Family used OTC brands indirectly assure brand security
and trust 61.65% 30.68%
MEAN AVERAGE FOR CULTURE 49.16% 29.80%
Gaviscon: Question CUL04 is above the satisfactory level of 60% with
61.65%. This indicates that it is satisfactory and needs to be developed to
become excellent. Questions CUL01, CUL02 and CUL03 are all below 60%,
ranging from 33.80% to 56.93%. This indicates that these questions are
unsatisfactory and that immediate managerial action is required to improve
loyalty. The mean average for culture is 49.16%.
Gelacid: Questions CUL01, CUL02, CUL03 and CUL04 are all far below the
satisfactory level of 60% and these low means indicate that all these
questions need to be improved and that further development is required. The
mean average for culture is 29.80%.
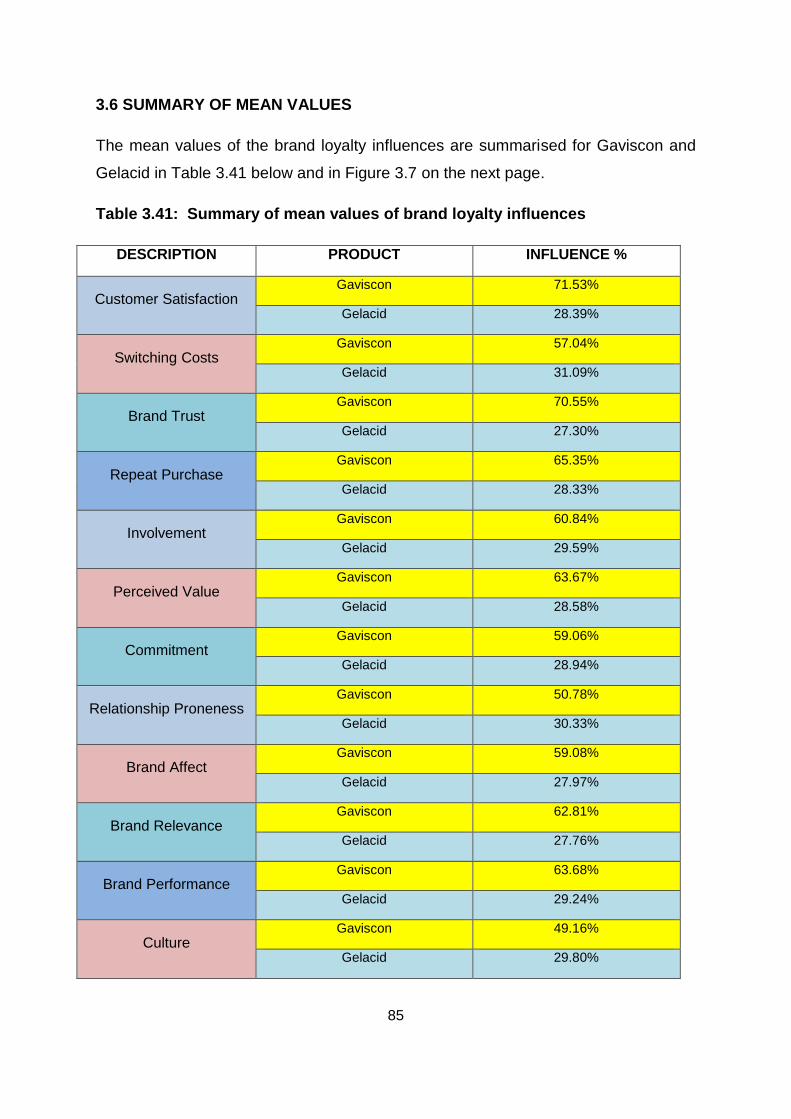
85
3.6 SUMMARY OF MEAN VALUES
The mean values of the brand loyalty influences are summarised for Gaviscon and
Gelacid in Table 3.41 below and in Figure 3.7 on the next page.
Table 3.41: Summary of mean values of brand loyalty influences
DESCRIPTION PRODUCT INFLUENCE %
Customer Satisfaction Gaviscon 71.53%
Gelacid 28.39%
Switching Costs Gaviscon 57.04%
Gelacid 31.09%
Brand Trust Gaviscon 70.55%
Gelacid 27.30%
Repeat Purchase Gaviscon 65.35%
Gelacid 28.33%
Involvement Gaviscon 60.84%
Gelacid 29.59%
Perceived Value Gaviscon 63.67%
Gelacid 28.58%
Commitment Gaviscon 59.06%
Gelacid 28.94%
Relationship Proneness Gaviscon 50.78%
Gelacid 30.33%
Brand Affect Gaviscon 59.08%
Gelacid 27.97%
Brand Relevance Gaviscon 62.81%
Gelacid 27.76%
Brand Performance Gaviscon 63.68%
Gelacid 29.24%
Culture Gaviscon 49.16%
Gelacid 29.80%
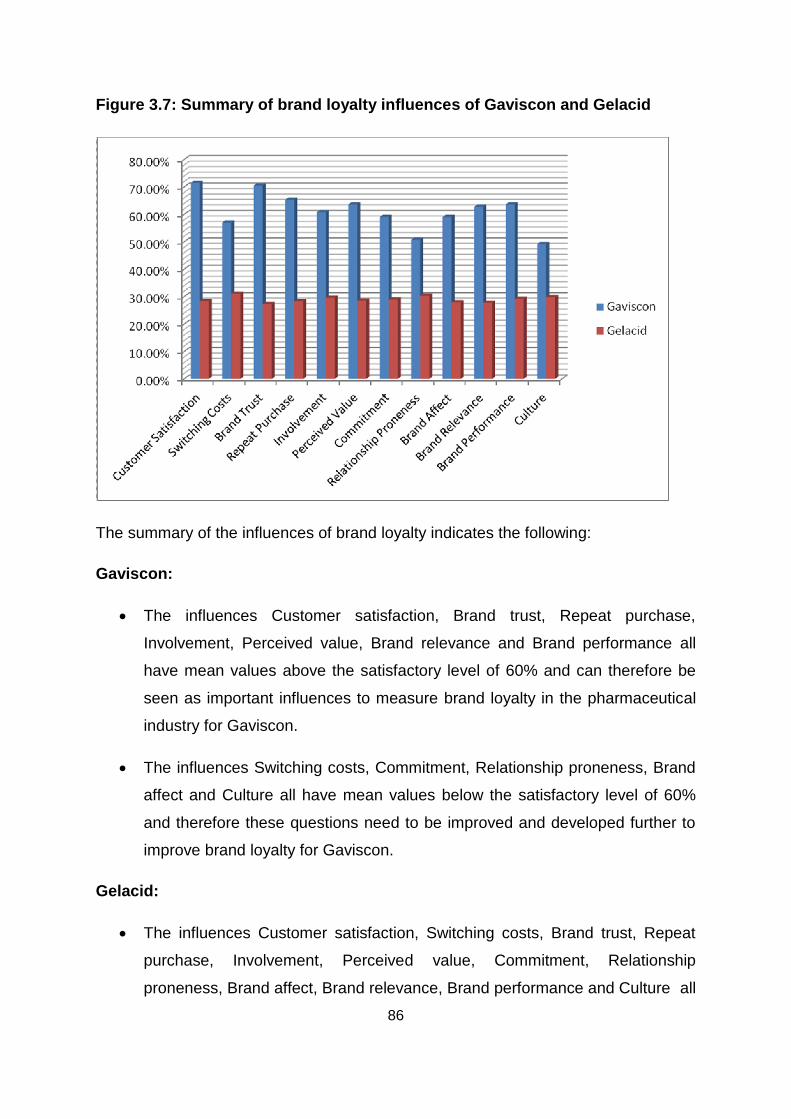
86
Figure 3.7: Summary of brand loyalty influences of Gaviscon and Gelacid
The summary of the influences of brand loyalty indicates the following:
Gaviscon:
The influences Customer satisfaction, Brand trust, Repeat purchase,
Involvement, Perceived value, Brand relevance and Brand performance all
have mean values above the satisfactory level of 60% and can therefore be
seen as important influences to measure brand loyalty in the pharmaceutical
industry for Gaviscon.
The influences Switching costs, Commitment, Relationship proneness, Brand
affect and Culture all have mean values below the satisfactory level of 60%
and therefore these questions need to be improved and developed further to
improve brand loyalty for Gaviscon.
Gelacid:
The influences Customer satisfaction, Switching costs, Brand trust, Repeat
purchase, Involvement, Perceived value, Commitment, Relationship
proneness, Brand affect, Brand relevance, Brand performance and Culture all
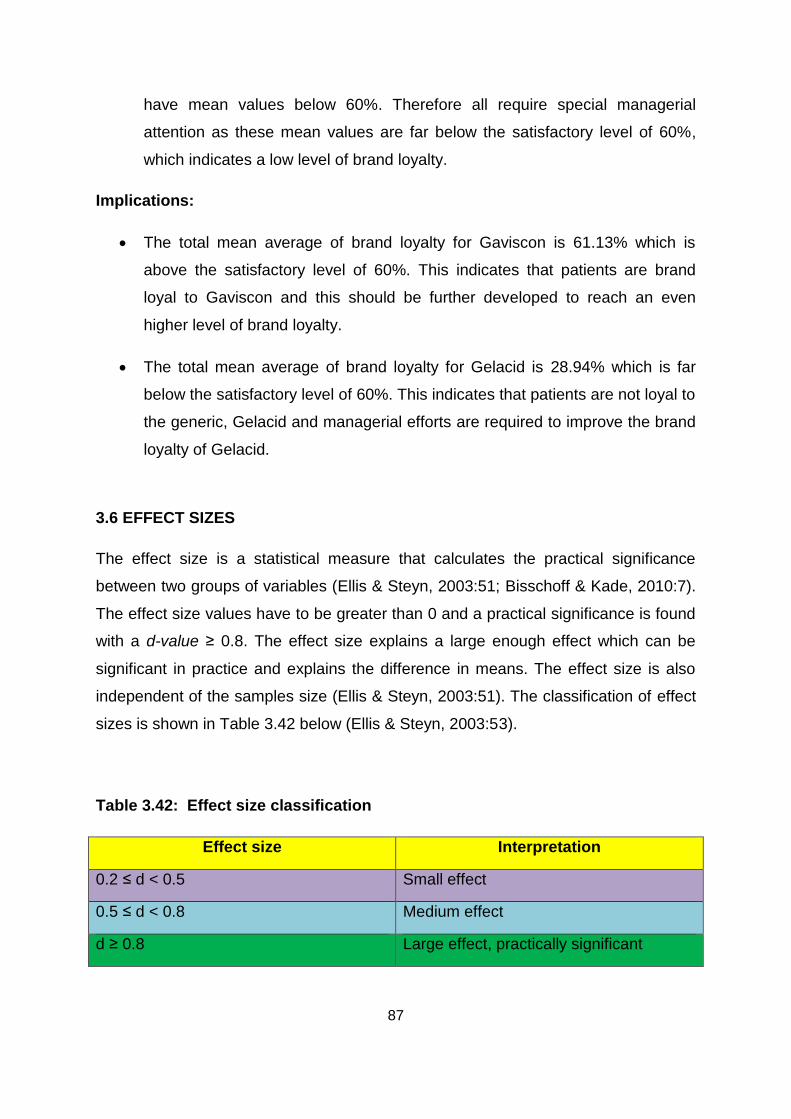
87
have mean values below 60%. Therefore all require special managerial
attention as these mean values are far below the satisfactory level of 60%,
which indicates a low level of brand loyalty.
Implications:
The total mean average of brand loyalty for Gaviscon is 61.13% which is
above the satisfactory level of 60%. This indicates that patients are brand
loyal to Gaviscon and this should be further developed to reach an even
higher level of brand loyalty.
The total mean average of brand loyalty for Gelacid is 28.94% which is far
below the satisfactory level of 60%. This indicates that patients are not loyal to
the generic, Gelacid and managerial efforts are required to improve the brand
loyalty of Gelacid.
3.6 EFFECT SIZES
The effect size is a statistical measure that calculates the practical significance
between two groups of variables (Ellis & Steyn, 2003:51; Bisschoff & Kade, 2010:7).
The effect size values have to be greater than 0 and a practical significance is found
with a d-value ≥ 0.8. The effect size explains a large enough effect which can be
significant in practice and explains the difference in means. The effect size is also
independent of the samples size (Ellis & Steyn, 2003:51). The classification of effect
sizes is shown in Table 3.42 below (Ellis & Steyn, 2003:53).
Table 3.42: Effect size classification
Effect size Interpretation
0.2 ≤ d < 0.5 Small effect
0.5 ≤ d < 0.8 Medium effect
d ≥ 0.8 Large effect, practically significant
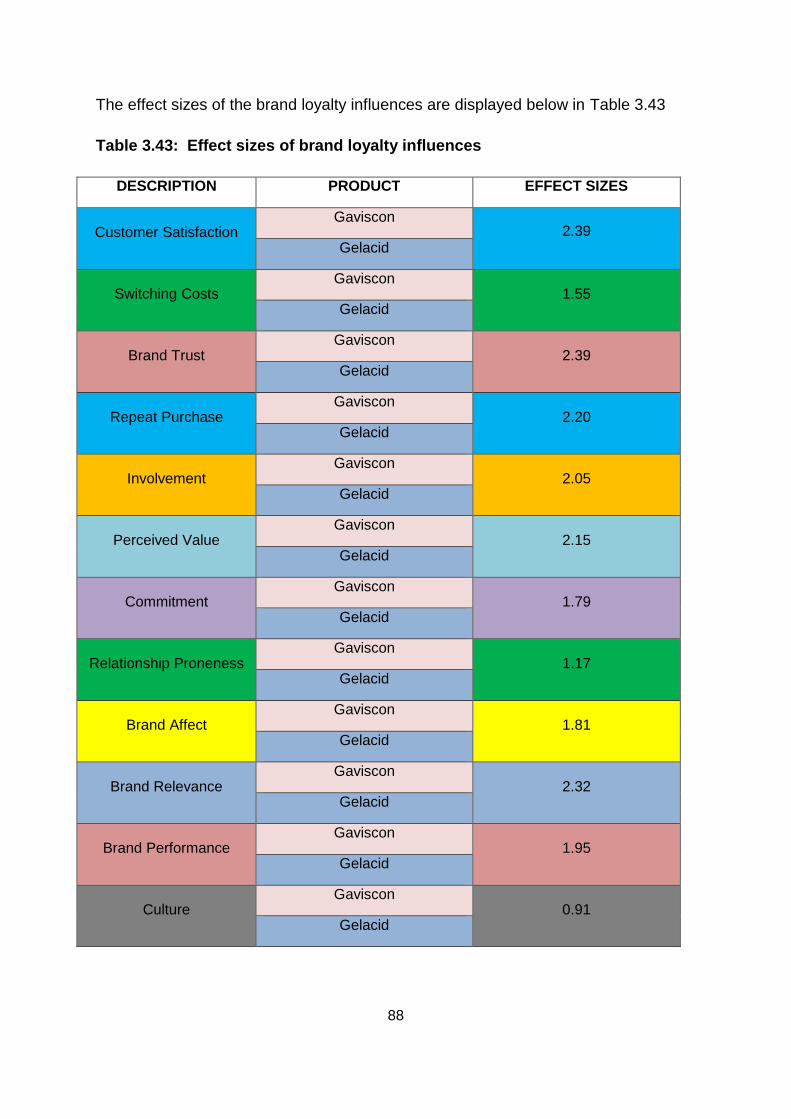
88
The effect sizes of the brand loyalty influences are displayed below in Table 3.43
Table 3.43: Effect sizes of brand loyalty influences
DESCRIPTION PRODUCT EFFECT SIZES
Customer Satisfaction Gaviscon
2.39 Gelacid
Switching Costs Gaviscon
1.55 Gelacid
Brand Trust Gaviscon
2.39 Gelacid
Repeat Purchase Gaviscon
2.20 Gelacid
Involvement Gaviscon
2.05 Gelacid
Perceived Value Gaviscon
2.15 Gelacid
Commitment Gaviscon
1.79 Gelacid
Relationship Proneness Gaviscon
1.17 Gelacid
Brand Affect Gaviscon
1.81 Gelacid
Brand Relevance Gaviscon
2.32 Gelacid
Brand Performance Gaviscon
1.95 Gelacid
Culture Gaviscon
0.91 Gelacid
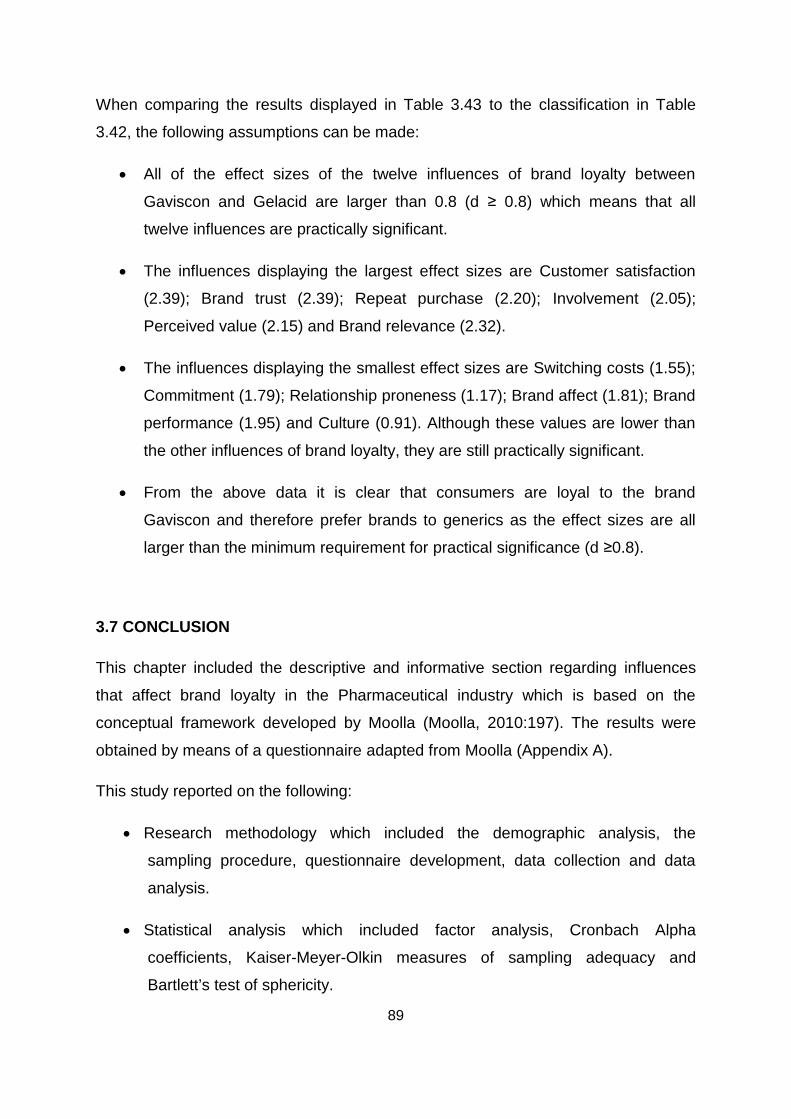
89
When comparing the results displayed in Table 3.43 to the classification in Table
3.42, the following assumptions can be made:
All of the effect sizes of the twelve influences of brand loyalty between
Gaviscon and Gelacid are larger than 0.8 (d ≥ 0.8) which means that all
twelve influences are practically significant.
The influences displaying the largest effect sizes are Customer satisfaction
(2.39); Brand trust (2.39); Repeat purchase (2.20); Involvement (2.05);
Perceived value (2.15) and Brand relevance (2.32).
The influences displaying the smallest effect sizes are Switching costs (1.55);
Commitment (1.79); Relationship proneness (1.17); Brand affect (1.81); Brand
performance (1.95) and Culture (0.91). Although these values are lower than
the other influences of brand loyalty, they are still practically significant.
From the above data it is clear that consumers are loyal to the brand
Gaviscon and therefore prefer brands to generics as the effect sizes are all
larger than the minimum requirement for practical significance (d ≥0.8).
3.7 CONCLUSION
This chapter included the descriptive and informative section regarding influences
that affect brand loyalty in the Pharmaceutical industry which is based on the
conceptual framework developed by Moolla (Moolla, 2010:197). The results were
obtained by means of a questionnaire adapted from Moolla (Appendix A).
This study reported on the following:
Research methodology which included the demographic analysis, the
sampling procedure, questionnaire development, data collection and data
analysis.
Statistical analysis which included factor analysis, Cronbach Alpha
coefficients, Kaiser-Meyer-Olkin measures of sampling adequacy and
Bartlett’s test of sphericity.
90
Empirical results through quantitative analysis which included the validity of
the research instrument used, calculation of the reliability coefficients which
reported on the significance of the selected criteria and the importance of the
research variables.
Discussion of the results.
This chapter included the results of the empirical study regarding the following:
Whether Moolla’s brand loyalty conceptual framework is relevant to measure
brand loyalty in the pharmaceutical industry,
Whether patients prefer the original pharmaceutical brand, Gaviscon or the
generic brand, Gelacid.
Identified the factors influencing brand loyalty in the consumer’s choice of two
specific pharmaceutical brands.
Chapter four concludes this study with a focus on conclusions and
recommendations. The brand loyalty framework for the pharmaceutical industry will
also be presented and areas for future research will be identified.
91
CHAPTER 4
CONCLUSIONS AND RECOMMENDATIONS
4.1 INTRODUCTION
This chapter concludes this study of brand loyalty in the pharmaceutical industry of
South Africa. The following will be discussed:
Conclusions and recommendations will be made based on the results
obtained from Chapter 3 and the literature review conducted in Chapter 2.
The conclusions will include the discussion of the validity and the reliability of
the data used to conduct this study.
The brand loyalty influences, which are based on Moolla’s brand loyalty
framework, will be conceptualised for the pharmaceutical industry along with
the variances of the different influences.
To conclude whether patients are brand loyal and therefore prefer original
brands or are not brand loyal and therefore prefer generic pharmaceutical
brands.
Areas for future research will be identified.
Finally this chapter will conclude with an overview of the research done in this
study to determine brand loyalty in the pharmaceutical industry of South
Africa.
4.2 CONCLUSIONS
The conclusions for this study will be divided into three sections, where the first
section’s conclusions are based on the statistical measures used in this study and
the second section’s conclusions are based on the results for pharmaceutical brand
loyalty. The third section will conclude with regards to areas for future research.
92
4.2.1 Conclusions regarding statistical procedures
Conclusion 1
The Kaiser-Meyer-Olkin (KMO) measure of sampling adequacy yielded values which
ranged from 0.636 to 0.802 for Gaviscon and values ranging from 0.655 to 0.842 for
Gelacid. Only three of the variables measured for Gaviscon had KMO values below
0.7 but above 0.6 and only two of the variables measured for Gelacid had KMO
values below 0.7 but above 0.6. According to Bisschoff and Kade (2010:8), a KMO
value of at least 0.6 should be present before factor analysis can be considered.
Therefore the Kaiser-Meyer-Olkin measure of sampling adequacy was suitable to
determine whether factor analysis could be used to analyse the data in this study.
The average KMO measure for Gaviscon yielded 0.721 for the twelve influences
measured and 0.742 for Gelacid.
Conclusion 2
Bartlett’s test of sphericity was used to determine the sampling adequacy and
determined the strength of the relationship between the variables. The significance
level for the Barlett test of sphericity was 0.000 (Bisschoff & Kade, 2010:8). The
Barlett test of sphericity indicated that the data of Gaviscon and Gelacid was suitable
for factor analysis.
Conclusion 3
Factor analysis was used to analyse the data and it was an appropriate statistical
tool to use in this study. The factors that were extracted due to a factor loading below
the minimum value of 0.400 explained the variance in the 12 influences satisfactorily.
A total of 11 out of the 12 influences for Gaviscon yielded single values where as all
12 influences for Gelacid, yielded single values. The factor analysis identified that
within one influence of Gaviscon, Involvement, two sub-influences existed.
Conclusion 4
The Cronbach Alpha coefficient proved that the data for this study was reliable and
measured the internal consistency of the data (Field, 2005:658; Bisschoff & Kade,
2010:6). Most factors proved satisfactory reliability coefficients as they were above
93
the 0.700 level of reliability (George & Mallery, 2003:231). Some influences’ reliability
can be questioned as these influences had a reliability coefficient higher than 0.600
but lower than 0.700. However a reliability coefficient of 0.600 was significant
(Cortina (1993) in Field, 2005:666). Therefore it can be concluded that all factors
with reliability coefficients above 0.700 are reliable to measure brand loyalty in the
pharmaceutical industry and those above 0.600 are significant.
4.2.2 Conclusions based on the results for pharmaceutical brand loyalty
Conclusion 1
The statistical analysis confirmed that all the brand loyalty influences for both
Gaviscon and Gelacid are valid to measure pharmaceutical brand loyalty. Questions
that have been eliminated are CUS04 and PVL01 for Gaviscon, all other questions
proved to be valid for both Gaviscon and Gelacid. It can be concluded that these two
influences are measured slightly different in the pharmaceutical industry compared to
the fast moving consumer goods (FMCG) industry.
Conclusion 2
This study has also identified that one of the brand loyalty influences of Gaviscon,
Involvement, has sub-influences within itself. The influence, Involvement can
therefore be seen as dualistic, where as all other influences are represented by a
single influence.
Conclusion 3
It can be concluded that the influences Customer satisfaction, Brand trust, Repeat
purchase, Involvement, Perceived value, Brand relevance and Brand performance
are the most important influences of brand loyalty for Gaviscon as all of these had
mean values above 60% (Bisschoff & Lotriet, 2009:270). The influences Switching
costs, Commitment, Relationship proneness, Brand affect and Culture were all below
the satisfactory level of 60% and therefore needs to be improved and developed
further to improve brand loyalty for Gaviscon. All of the influences for Gaviscon had
means greater than 49.16% with Customer satisfaction as the most important
94
influence with a mean value of 71.53%. Culture was identified as the least important
influence of pharmaceutical brand loyalty with a mean value of 49.16%. With regards
to the mean values for Gelacid, all of the means reported relatively low compared to
Gaviscon with values below 60% and therefore it indicated a low level of brand
loyalty towards Gelacid. All of these influences require special managerial attention
to improve and develop brand loyalty amongst consumers. The most important
influence for Gelacid was switching costs with 31.09% and the least important
influence was Brand trust with 27.30%, however both of the mean values for these
influences are unsatisfactory (Bisschoff & Lotriet, 2009:270). The average mean
value of all the brand loyalty influences for Gaviscon was 61.13% which is above the
satisfactory level of 60%, while the average mean value for Gelacid was 28.94%
which is unsatisfactory. This indicates that patients are brand loyal to Gaviscon and
not brand loyal to the generic, Gelacid.
Conclusion 4
It can be concluded that the statistical measure of effect sizes calculated the
practical significance between Gaviscon and Gelacid. The effect sizes of the twelve
influences of brand loyalty are all larger than 0.8 (d ≥ 0.8) which means that all
twelve influences are practically significant. It can also be concluded that patients are
loyal to Gaviscon and therefore brand loyal.
Conclusion 5
It can be concluded that the demographic profile of the respondents did not
represent the total population of South Africa. The gender profile included an almost
equal number of both genders, where the male respondents were 45% and the
female respondents were 55%. The equal distribution of genders amongst
respondents displayed a good representation of the population of South Africa. The
age of the respondents were well distributed with the majority aged between 31 to 40
years. The income segment per annum indicated that the majority of respondents
earned between R500 000 to R1000 000 per annum. With regards to the industry of
employment a wide range of different industries were included, however, most
participants were employed in the Healthcare industry. The geographic distribution of
participants included most of the provinces in South Africa; however, 80% of the
95
respondents represented the Gauteng province. The reason for this uneven
distribution is that most questionnaires were given to Gauteng residents. Therefore
this study does not represent all the provinces in South Africa equally. With regards
to the ethnicity of the participants most cultures present in South Africa were
represented in this study, the majority of participants were white followed by black
respondents and therefore the ethnicity of the participants is not a true reflection of
the South African population. It can be concluded that the demographic profile did
not represent the population of South Africa satisfactorily in some of the components
of the demographic profile.
4.2.3 Conclusions with regards to future research
Conclusion 1
This study is not representative of the whole population of South Africa, even though
a favourable response of 203 respondents has been received. It can be concluded
that this study adds value to the research based on pharmaceutical brand loyalty and
that future research could substantiate the findings in different research populations
and also in other industries.
4.3 RECOMMENDATIONS
The recommendations of this study will also be divided into three sections, where the
first section’s recommendations are based on the statistical measures used in this
study and the second section’s recommendations are based on the results for
pharmaceutical brand loyalty. The third section will provide recommendations with
regards to future research.
4.3.1 Recommendations regarding statistical procedures
Recommendation 1
With regards to Conclusion 1, Conclusion 2, Conclusion 3 and Conclusion 4 it is
recommended that the brand loyalty questionnaire, developed by Moolla (2010:262)
96
to measure brand loyalty of fast moving consumer goods (FMCG) can be used to
measure brand loyalty in the pharmaceutical industry. The statistics used in this
study provided reliable data that could be analysed and interpreted competently.
Factor analysis is recommended to determine the validity of the research
questionnaire accurately and determines the interrelationships among variables. The
Kaiser-Meyer-Olkin measure of sampling adequacy and Bartlett’s test of sphericity
are recommended to determine whether factor analysis is suitable when interpreting
data. It is recommended that the Cronbach Alpha coefficient should be used to
measure the reliability of the data when conducting a study.
4.3.2 Recommendations based on the results for pharmaceutical brand loyalty
Recommendation 1
When measuring pharmaceutical brand loyalty it is recommended that the
questionnaire adapted from the FMCG questionnaire should be used as determined
by this study.
Recommendation 2
With regards to the results of this study it is recommended that the results should
keep in mind the dualistic nature of some of the influences. These influences
represent two sub-influences and therefore each sub-influence’s importance and
influence on pharmaceutical brand loyalty should be determined. Managers should,
therefore, take note and address the more important sub-influence first as this would
yield higher returns on managerial inputs.
Recommendation 3
With regards to the importance of the brand loyalty influences, it is recommended
that management should develop the more important brand loyalty influences as
identified through this study.
97
Recommendation 4
With regards to the effect sizes determined by this study, it is recommended that
companies should keep in mind that consumers are brand loyal with regards to the
over-the-counter pharmaceutical industry. Therefore companies should manage and
position their products in the pharmaceutical industry as a brand and not simply as
another generic.
Recommendation 5
It is recommended that a larger study representing the South African population
more accurately should be conducted. Provinces and ethnicity groups in South Africa
that were excluded by this study should be included to measure pharmaceutical
brand loyalty. Therefore this study is not representative of the entire South African
population.
4.3.3 Recommendations with regards to future research
Recommendation 1
With regards to future research, it is recommended that this study should be
performed using a larger sample of the population to measure pharmaceutical brand
loyalty. Secondly, further studies should also be conducted to get a global
perspective, since the proposed model was only tested in the South African culture.
Thirdly, other factors influencing brand loyalty like the role of the prescribers,
pharmaceutical sales representatives and pharmacists should be included in future
studies.
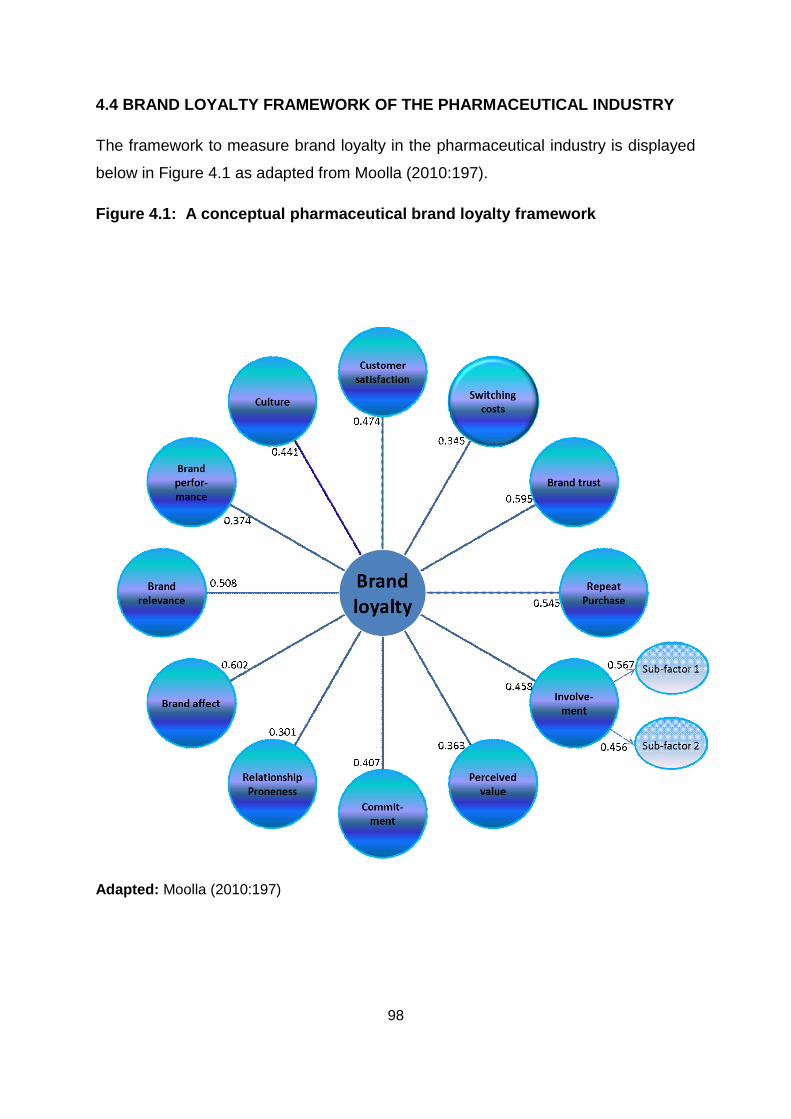
98
4.4 BRAND LOYALTY FRAMEWORK OF THE PHARMACEUTICAL INDUSTRY
The framework to measure brand loyalty in the pharmaceutical industry is displayed
below in Figure 4.1 as adapted from Moolla (2010:197).
Figure 4.1: A conceptual pharmaceutical brand loyalty framework
Adapted: Moolla (2010:197)
99
Figure 4.1 on the previous page displays the total variance per influence of the
pharmaceutical brand loyalty framework. It also shows that one influence,
Involvement is represented by two sub-influences within the Involvement influence.
4.5 AREAS FOR FUTURE RESEARCH
Regarding areas for future research, the following has been identified:
Further research to determine brand loyalty within the pharmaceutical industry
of South Africa and internationally should be conducted on a larger scale to
confirm or refine the results of this study.
Future research is recommended with regards to the pharmaceutical industry
to establish whether patients prefer original or generic brands.
Other factors influencing pharmaceutical brand loyalty like the role of the
prescribers, pharmaceutical sales representatives and pharmacists should be
included in future research.
This study was only applicable to over-the-counter medication and for future
research it is recommended to determine whether pharmaceutical brand
loyalty exists with regards to prescription medication.
The applicability of Moolla’s brand loyalty model to other industries should be
determined.
A comparative study between Moolla’s original brand loyalty model for the
FMCG industry (Moolla, 2010:197) and this study for the pharmaceutical
industry should be conducted. The aim of the comparative study is to
determine which questions measuring the brand loyalty influences are more
significant in measuring brand loyalty and which questions are less significant.
100
4.6 CONCLUSION
The main aim of this study was to measure brand loyalty in the over-the-counter
pharmaceutical industry of South Africa and to establish whether patients are brand
loyal to original pharmaceutical brands and the influence of generics on
pharmaceutical brand loyalty. The measurement of brand loyalty in the
pharmaceutical industry is based on Moolla’s brand loyalty framework for the FMCG
industry. This study also aimed to determine whether Moolla’s FMCG brand loyalty
framework is applicable to the pharmaceutical industry. In order to achieve the
primary objectives, several secondary objectives were set and reached throughout
the four chapters of this study.
Chapter one identified the need to measure brand loyalty in the pharmaceutical
industry and elaborated on the purpose of this study. It also identified the primary
and secondary objectives of this study and explained the research methodology.
Chapter one also provided the structure of this study and the areas of research
conducted in each chapter.
Chapter two reflected on the South African pharmaceutical industry which included a
review of the over-the-counter medicine industry and the generic pharmaceutical
industry. Chapter two also reflected on the literature of brand loyalty which
incorporated the benefits of brand loyalty as well as Moolla’s brand loyalty
framework.
Chapter three presented the research methodology which included the analysis and
the empirical results of this study. It elaborated on the methods used to conduct this
study which included the sampling procedure, data collection, data analysis and
statistical techniques used. The empirical results focused on the demographic profile
of the respondents, the validity of the questionnaire, the reliability of the results
obtained as well as the importance of the research variables.
Chapter four, the final chapter of this study presented the adapted framework to
measure pharmaceutical brand loyalty. It also provided conclusions and
recommendations with regards to the statistical procedures used and the results
obtained within this study. To conclude this chapter, areas for future research were
identified.
101
REFERENCES
AAKER, D.A. 2012. Win the Brand Relevance Battle and then Build Competitor
Barriers. California Management Review, 54(2):43-57.
ADAMS, C.W. 2003. Customer satisfaction and customer loyalty are the best
predictors of customer retention. [Web]:
http:www.adamssixsigma.com/Newsletters/customers_results.htm. Date of Access:
16 September 2012.
AMBLER, T., BHATTACHARYA, C.B., EDELL, J., KELLER, K.L., LEMON, K.N. &
MITTAL, V. 2002. Relating brand and customer perspectives on marketing
management. Journal of Service Research, 5(1):13-25, Aug.
AMINE, A. 1998. Consumers’ true brand loyalty: the central role of commitment.
Journal of Strategic Marketing, 6:305-319.
ARRANZ, A.G., CRUZ, N.M. & ESCUDERO, A.R. 2004. Price relative to
competition: The case of the pharmaceutical industry in Spain. Advances in
Competitiveness Research, 12(1):10-19.
BISSCHOFF, C.A. & KADE, A. 2010. Validation of a customer service measuring
instrument for the ophthalmology industry. Paper delivered at SA Institute of
Management scientists. Mpekweni. 24-26 Sept.
BISSCHOFF, C.A. & LOTRIET, R.A. 2009. Die dienskwaliteit van die PUK Rugby-
Instituut. Tydskrif vir Geesteswetenskappe, 49(2):266-286.
BLACKETT, T. & HARRISON, T. 2001. Brand medicine: Use and future potential of
branding in pharmaceutical markets. International Journal of Medical Marketing,
2(1):33-49.
BLOEMER, J., ODEKERKEN-SCHRÖDER, G. & KESTENS, L. 2003. The impact
of need for social affiliation and consumer relationship proneness on behavioural
intentions: an empirical study in a hairdresser’s context. Journal of Retailing and
Consumer Services, 10:231-240.
102
BOISVERT, J. & ASHILL, N.J. 2011. How brand innovativeness and quality impact
attitude toward new service line extensions: the moderating role of consumer
involvement. Journal of Services Marketing, 25(7):517-527.
BREKKE, K.R., HOLMAS, T.H. & STRAUME, O.R. 2011. Reference pricing,
competition, and pharmaceutical expenditures: Theory and evidence from a natural
environment. Journal of Public Economics, 95:624-638.
CHAUDHURI, A. 1999. The Relationship of Brand Attitudes and Brand
Performance: The role of Brand Loyalty. Journal of Marketing Management, 9(3):1-
9.
CHAUDHURI, A. & HOLBROOK, M.B. 2001. The Chain of Effects from Brand Trust
and Brand Affect to Brand Performance: The Role of Brand Loyalty. Journal of
Marketing, 65:81-93, Apr.
DE CHERNATONY, L., HARRIS, F.J. & CHRISTODOULIDES, G. 2004.
Developing a Brand Performance Measure for Financial Services Brands. The
Services Industries Journal, 24(2):15-33.
DELGADO-BALLESTER, E. & MUNUERA-ALEMAN, J.L. 2005. Does brand trust
matter to brand equity. Journal of Product & Brand Management, 14(3):187-196.
DeLORME, D.E., HUH, J., REID, L.N. & AN, S. 2010. The state of public research
on over-the-counter drug advertising. International Journal of Pharmaceutical and
Healthcare Marketing, 4(3):208-231.
DE WULF, K., ODEKERKEN-SCHRÖDER, G. & LACOBUCCI, D. 2001.
Investments in Consumer Relationships: A Cross-Country and Cross-Industry
Exploration. Journal of Marketing, 65:33-50.
DICK, A.S. & BASU, K. 1994. Customer loyalty: Toward an Integrated Conceptual
Framework. Journal of the Academy of Marketing Science, 22(2):99-113.
ELLIS, S.M. & STEYN, H.S. 2003. Practical significance (effect sizes) versus or in
combination with statistical significance (p-values). Management Dynamics,
12(4):51-53.
103
FIELD, A. 2005. Discovering statistics using SPSS. (2nd ed.) London: Sage.
FULLERTON, G. 2005. The Impact of Brand Commitment on Loyalty to Retail
Service Brands. Canadian Journal of Administrative Sciences, 22(2):97-110.
GEORGE, D. & MALLERY, P. 2003. SPSS for Windows step by step: A simple
guide and reference. 11.0 update. 4th ed. Boston: Allyn & Bacon.
GRIFFITHS, S. 2008. Pharmaceutical branding: ‘To brand or not to brand’. Journal
of Medical Marketing, 8(2):113-118.
HERSTEIN, R. & ZVILLING, M. 2011. Brand management perspectives in the
twenty-first century. Qualitative Market Research: An International Journal,
14(2):188-206.
HUDSON, J. 1992. Pricing dynamics in the pharmaceutical industry. Applied
Economics, 24:103-112.
IMSHEALTH. 2010. Economist intelligence unit: Market prognosis, September
2010. http://www.imshealth.com/ Date of Access: 21 Jul. 2012.
IMSHEALTH. 2012. South Africa in figures 2012. http://www.imshealth.com/.
Date of Access: 12 Aug. 2012.
JANG, H., OLFMAN, L., KO, I., KOH, J. & KIM, K. 2008. The influence of On-Line
Brand Community Characteristics on Community Commitment and Brand Loyalty.
International Journal of Electronic Commerce, 12(3):57-80.
KAVANOOR, S., GREWAL, D. & BLODGETT, J. 1997. Ads Promoting OTC
Medications: The Effect of Ad Format and Credibility on Beliefs, Attitudes, and
Purchase intentions. Journal of Business Research, 40:219-227.
KIM, J., MORRIS, J.D. & SWAIT, J. 2008. Antecedents of true brand loyalty.
Journal of Advertising, 37(2):99-117.
KIM, H., KANG, J.M. & JOHNSON, K.K.P. 2012. Effect of consumer relationship
proneness on perceived loyalty program attributes and resistance to change.
International Journal of Retail & Distribution Management, 40(5):376-387.
104
KNOX, S. & WALKER, D. 2001. Measuring and managing brand loyalty. Journal of
Strategic Marketing, 9:111-128.
KOTLER, P. & ARMSTRONG, G. 2012. Principles of marketing. 13th ed. Upper
Saddle River, NJ: Pearson.
LAM, D. 2007. Cultural influence on Proneness to Brand Loyalty. Journal of
International Consumer Marketing, 19(3):7-21.
LOUIS, D. & LOMBART, C. 2010. Impact of brand personality on three major
relational consequences (trust, attachment, and commitment to the brand). Journal
of Product & Brand Management, 19(2):114-130.
MATZLER, K., BIDMON, S. & GRABNER-KRÄUTER, S. 2006. Individual
determinants of brand affect: the role of the personality traits of extraversion and
openness to experience. Journal of Product & Brand Management, 15(7):427-434.
McWILLIAM, G. 1997. Low involvement brands: is the brand manager to blame?
Marketing Intelligence & Planning, 15(2):60-70.
MOOLLA, A.I. 2010. A conceptual framework to measure brand loyalty. North-
West University: Potchefstroom (Thesis – Phd.) 278 p.
MOOLLA, A.I. & BISSCHOFF, C.A. 2012a. Validating a Model to Measure the
Brand Loyalty of Fast Moving Consumer Goods. Journal of Social Science,
31(2):101-115.
MOOLLA, A.I. & BISSCHOFF, C.A. 2012b. A Model to Measure the Brand Loyalty
for Fast Moving Consumer Goods. Journal of Social Science, 31(1):75-85.
O’CASS, A. & NGO, L.V. 2007. Balancing external adaptation and internal
effectiveness: Achieving better brand performance. Journal of Business Research,
60:11-20.
OLIVEIRA-CASTRO, J.M., FOXALL, G.R., JAMES, V.K., POHL, R.H.B.F., DIAS,
M.B. & CHANG, S.W. 2008. Consumer-based brand equity and brand
performance. The Service Industries Journal, 28(4):445-461, May.
105
PARISH, J.T. & HOLLOWAY, B.B. 2010. Customer relationship proneness: a
reexamination and extension across service exchanges. Journal of Services
Marketing, 24(1):61-73.
PUNNIYAMOORTHY, M., & RAJ, M.P.M. 2007. An empirical model for brand
loyalty measurement. Journal of Targeting, Measurement and Analysis for
Marketing, 15(4):222-233.
QUESTER, P. & LIM, A.L. 2003. Product involvement/brand loyalty: is there a link?
Journal of Product & Brand Management, 12(1):22-38.
RHODES, A. 2012. Re-examining the Effects of Switching Costs. [Web]:
http://editorialexpress.com/cgi-
bin/conference/download.cgi?db_name=IIOC2012&paper_id=483. Date of Access:
15 October 2012.
ROY, S. 2011. Brand Loyalty Measurement: A Framework. Journal of Indian
Management, April-June:112-122.
SANYAL, S.N. & DATTA, S.K. 2011. The effect of perceived quality on brand
equity: an empirical study on generic drugs. Asia Pacific Journal of Marketing and
Logistics, 23(5):604-625.
SAS. 2012. Facing the Challenges of Building Brand Loyalty and Retention: The
New Strategic Imperative. [Web]:
http:www.sas.com/resources/asset/Strategic_Imperative.pdf. Date of Access: 28
September 2012.
SAXTON, K. 2011. Rx for Brand Consistency: Should pharmaceutical marketers
send different messages to physician and consumer audiences? Journal of
Advertising Research, 51(2):380-393.
SCOTT MORTON, F.M. 2000. Barriers to entry, brand advertising, and generic
entry in the US pharmaceutical industry. International Journal of Industrial
Organization, 18:1085-1104.
106
SHARRAD, A.K. & HASSALI, M.A. 2011. Consumer perception on generic
medicines in Basrah, Iraq: Preliminary findings from a qualitative study. Research in
Social and Administrative Pharmacy, 7:108-112.
SHUKLA, P. 2004. Effect of Product Usage, Satisfaction and Involvement on Brand
Switching Behavior. Asia Pacific Journal of Marketing and Logistics, 16(4):82-104.
SMASA. 2006. The South African pharmaceutical / OTC environment 2006.
http:www.smasa.cc Date of Access: 08 Jul. 2012.
SOUTH AFRICA PHARMACEUTICALS & HEALTHCARE REPORT. 2012. London:
Business Monitor International.
SWOBODA, B., HAELSIG, F., SCHRAMM-KLEIN, H. & MORSCHETT, D. 2009.
Moderating role of involvement in building a retail brand. International Journal of
Retail & Distribution Management, 37(11):952-974.
WANG, H., WEI, Y. & YU, C. 2008. Global brand equity model: combining
customer-based with product-market outcome approaches. Journal of Product &
Brand Management, 17(5):305-316.
WEERAWARDENA, J., O’CASS, A. & JULIAN, C. 2006. Does industry matter?
Examining the role of industry structure and organizational learning in innovation and
brand performance. Journal of Business Research, 59:37-45.
XUE, F. 2008. The moderating effects of product involvement on situational brand
choice. Journal of Consumer Marketing, 25(2):85-94.

107
APPENDIX A
Research questionnaire to determine brand loyalty influences in OTC (over the counter) medicine brands (Adapted from Moolla, 2010:262).
Please place a cross in the appropriate column
Age Group Province of Residence 20-30 Eastern Cape 31-40 Gauteng 41-50 Free State 51-60 Kwazulu- Natal 61+ Limpopo
Sex Mpumalanga Male Northern Cape Female North West Western Cape
Income Segment per annum Ethnicity Less than R100 000
Asian
R100 000 – R250 000
Black
R250 000 – R500 000
Coloured
R500 000 – R1000 000
Indian
More than R1000 000
White
Industry Arts & Crafts IT &
Telecommunications
Banking Legal Construction Marketing Education Professional Fashion Property Financial Retail Healthcare Safety & Security Human Resources Tourism Insurance Other (Specify )
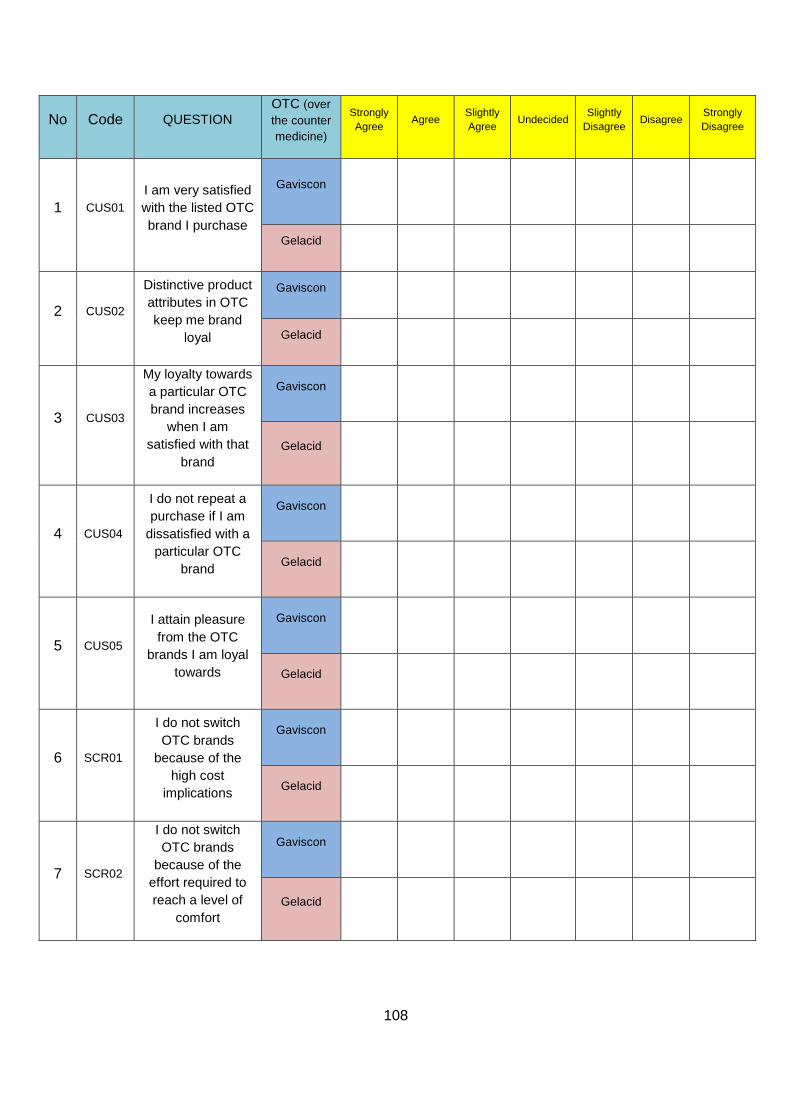
108
No Code QUESTION OTC (over the counter medicine)
Strongly Agree Agree Slightly
Agree Undecided Slightly Disagree Disagree Strongly
Disagree
1 CUS01 I am very satisfied with the listed OTC brand I purchase
Gaviscon
Gelacid
2 CUS02
Distinctive product attributes in OTC keep me brand
loyal
Gaviscon
Gelacid
3
CUS03
My loyalty towards a particular OTC brand increases
when I am satisfied with that
brand
Gaviscon
Gelacid
4
CUS04
I do not repeat a purchase if I am
dissatisfied with a particular OTC
brand
Gaviscon
Gelacid
5
CUS05
I attain pleasure from the OTC
brands I am loyal towards
Gaviscon
Gelacid
6
SCR01
I do not switch OTC brands
because of the high cost
implications
Gaviscon
Gelacid
7
SCR02
I do not switch OTC brands
because of the effort required to reach a level of
comfort
Gaviscon
Gelacid
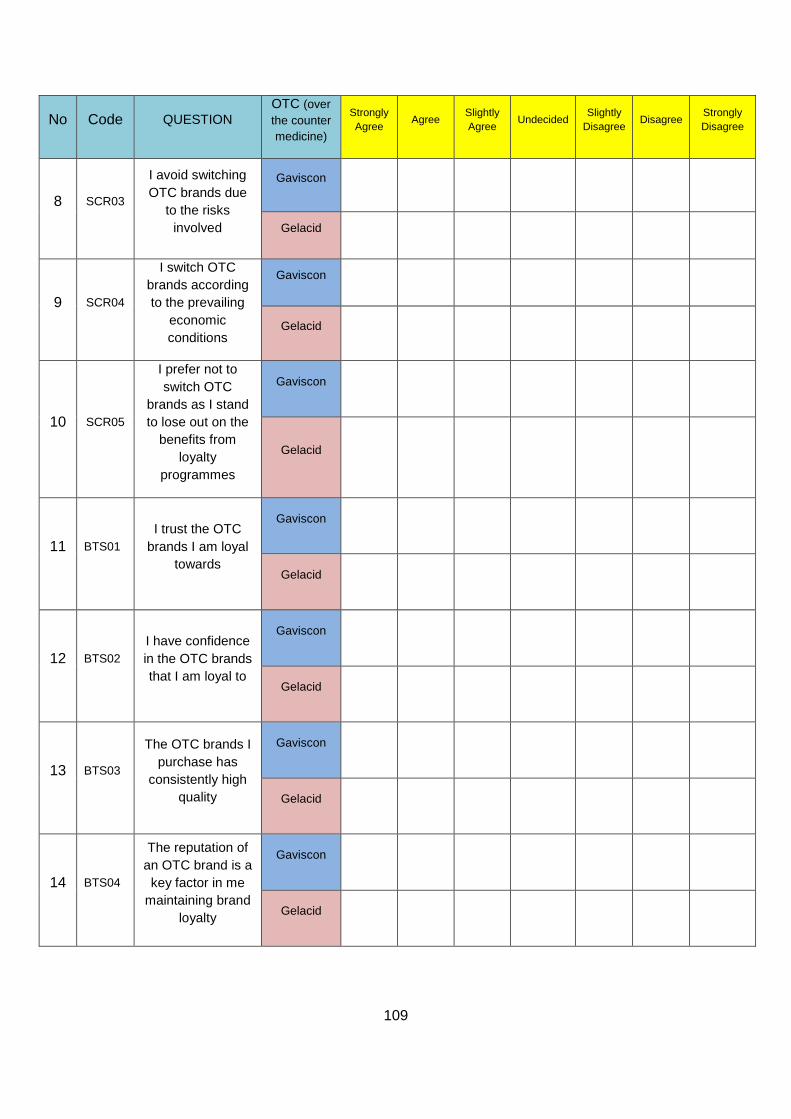
109
No Code QUESTION OTC (over the counter medicine)
Strongly Agree Agree Slightly
Agree Undecided Slightly Disagree Disagree Strongly
Disagree
8 SCR03
I avoid switching OTC brands due
to the risks involved
Gaviscon
Gelacid
9 SCR04
I switch OTC brands according to the prevailing
economic conditions
Gaviscon
Gelacid
10
SCR05
I prefer not to switch OTC
brands as I stand to lose out on the
benefits from loyalty
programmes
Gaviscon
Gelacid
11
BTS01
I trust the OTC brands I am loyal
towards
Gaviscon
Gelacid
12
BTS02
I have confidence in the OTC brands that I am loyal to
Gaviscon
Gelacid
13
BTS03
The OTC brands I purchase has
consistently high quality
Gaviscon
Gelacid
14
BTS04
The reputation of an OTC brand is a key factor in me
maintaining brand loyalty
Gaviscon
Gelacid
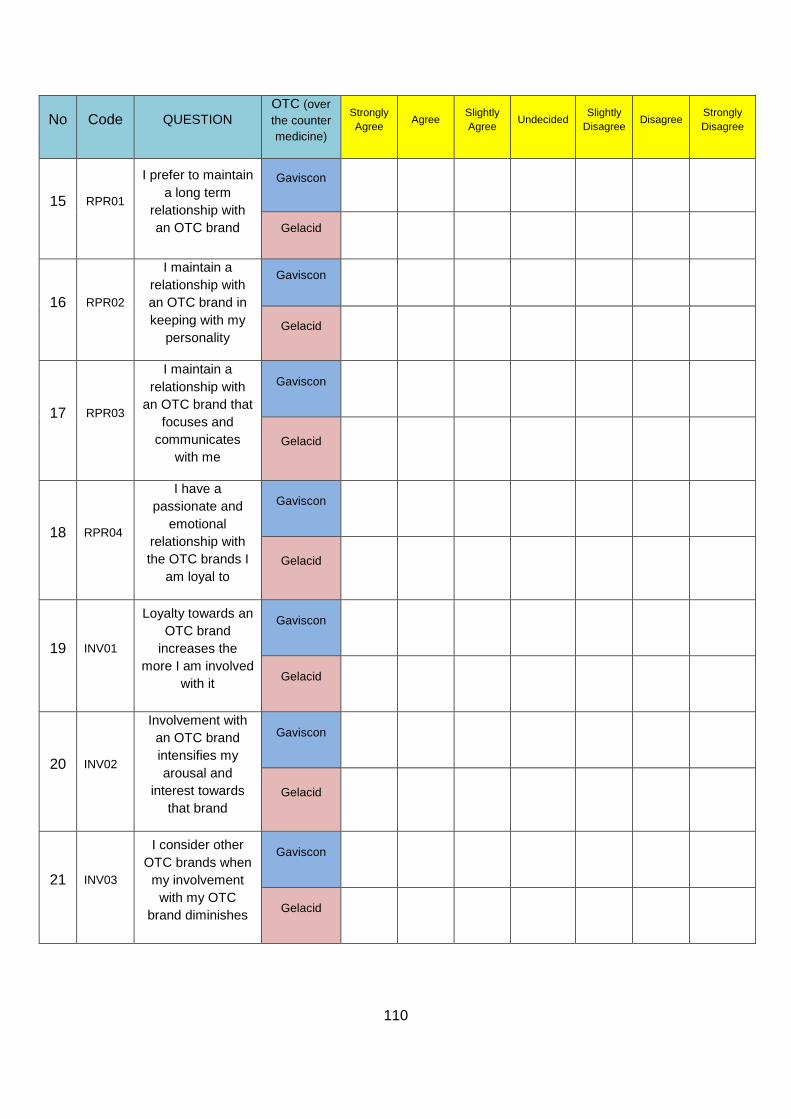
110
No Code QUESTION OTC (over the counter medicine)
Strongly Agree Agree Slightly
Agree Undecided Slightly Disagree Disagree Strongly
Disagree
15 RPR01
I prefer to maintain a long term
relationship with an OTC brand
Gaviscon
Gelacid
16 RPR02
I maintain a relationship with an OTC brand in keeping with my
personality
Gaviscon
Gelacid
17
RPR03
I maintain a relationship with
an OTC brand that focuses and
communicates with me
Gaviscon
Gelacid
18
RPR04
I have a passionate and
emotional relationship with the OTC brands I
am loyal to
Gaviscon
Gelacid
19
INV01
Loyalty towards an OTC brand
increases the more I am involved
with it
Gaviscon
Gelacid
20
INV02
Involvement with an OTC brand intensifies my arousal and
interest towards that brand
Gaviscon
Gelacid
21
INV03
I consider other OTC brands when
my involvement with my OTC
brand diminishes
Gaviscon
Gelacid
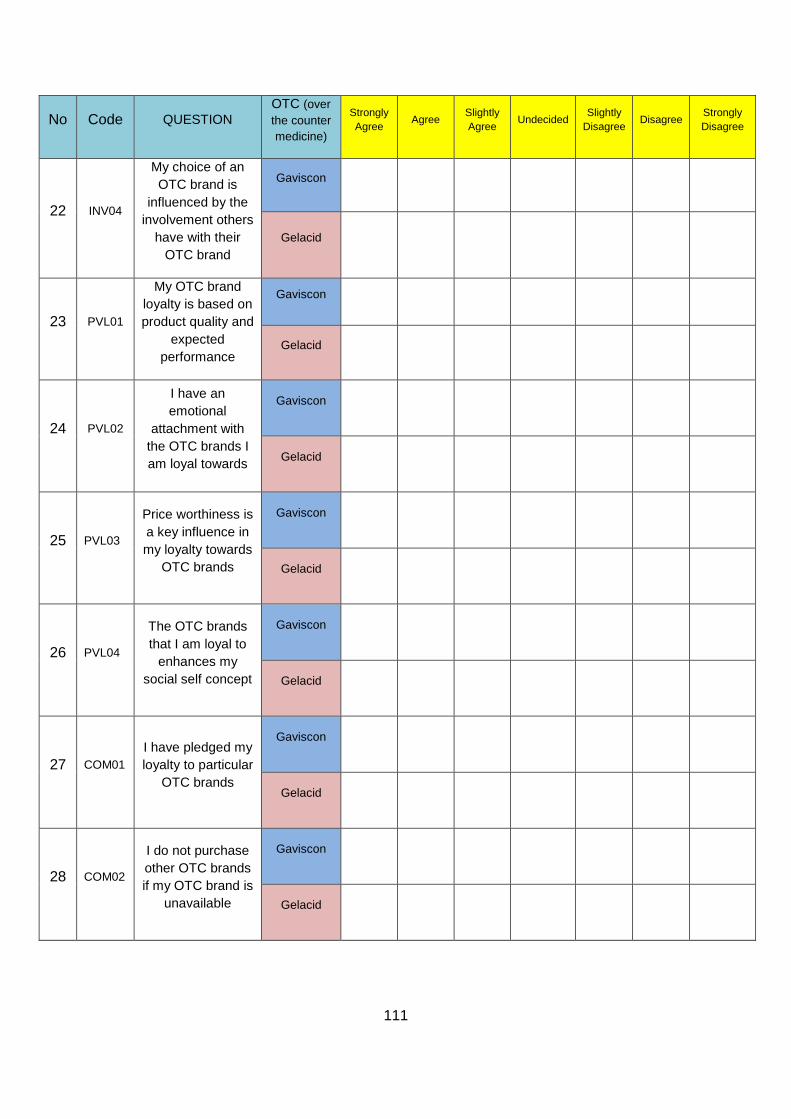
111
No Code QUESTION OTC (over the counter medicine)
Strongly Agree Agree Slightly
Agree Undecided Slightly Disagree Disagree Strongly
Disagree
22 INV04
My choice of an OTC brand is
influenced by the involvement others
have with their OTC brand
Gaviscon
Gelacid
23 PVL01
My OTC brand loyalty is based on product quality and
expected performance
Gaviscon
Gelacid
24
PVL02
I have an emotional
attachment with the OTC brands I am loyal towards
Gaviscon
Gelacid
25
PVL03
Price worthiness is a key influence in my loyalty towards
OTC brands
Gaviscon
Gelacid
26
PVL04
The OTC brands that I am loyal to
enhances my social self concept
Gaviscon
Gelacid
27
COM01
I have pledged my loyalty to particular
OTC brands
Gaviscon
Gelacid
28
COM02
I do not purchase other OTC brands if my OTC brand is
unavailable
Gaviscon
Gelacid
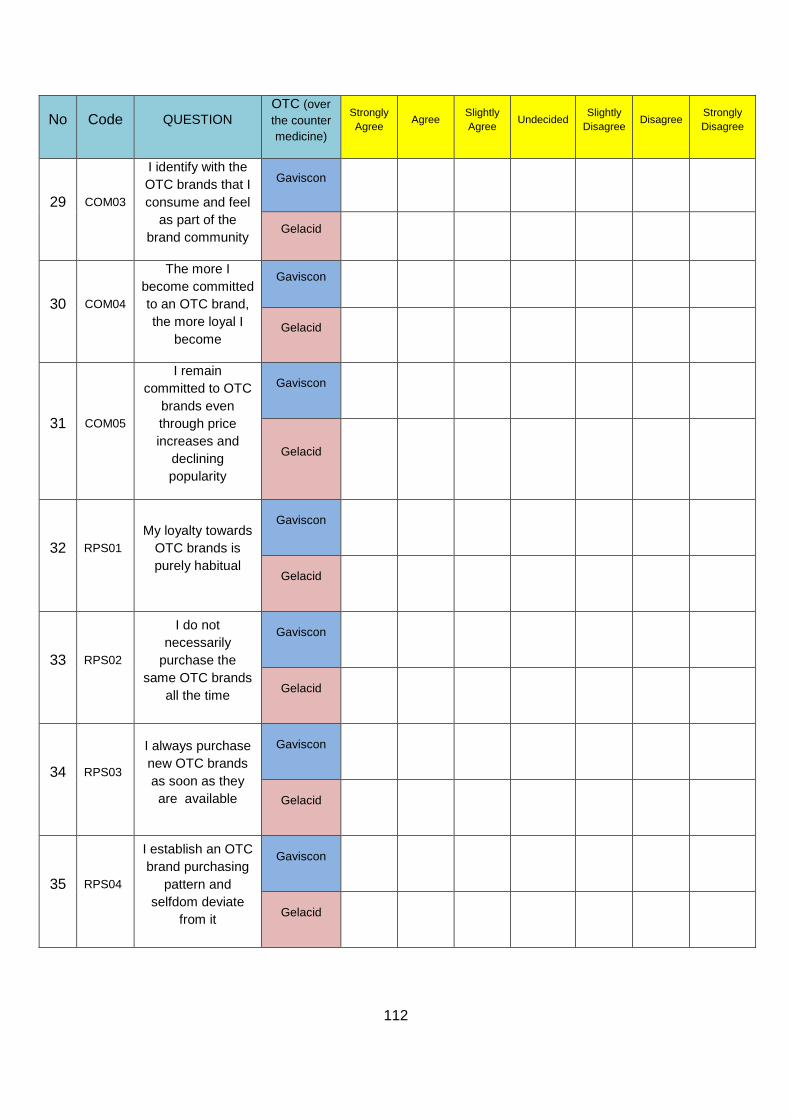
112
No Code QUESTION OTC (over the counter medicine)
Strongly Agree Agree Slightly
Agree Undecided Slightly Disagree Disagree Strongly
Disagree
29 COM03
I identify with the OTC brands that I consume and feel
as part of the brand community
Gaviscon
Gelacid
30 COM04
The more I become committed to an OTC brand, the more loyal I
become
Gaviscon
Gelacid
31
COM05
I remain committed to OTC
brands even through price increases and
declining popularity
Gaviscon
Gelacid
32
RPS01
My loyalty towards OTC brands is purely habitual
Gaviscon
Gelacid
33
RPS02
I do not necessarily
purchase the same OTC brands
all the time
Gaviscon
Gelacid
34
RPS03
I always purchase new OTC brands as soon as they are available
Gaviscon
Gelacid
35
RPS04
I establish an OTC brand purchasing
pattern and selfdom deviate
from it
Gaviscon
Gelacid
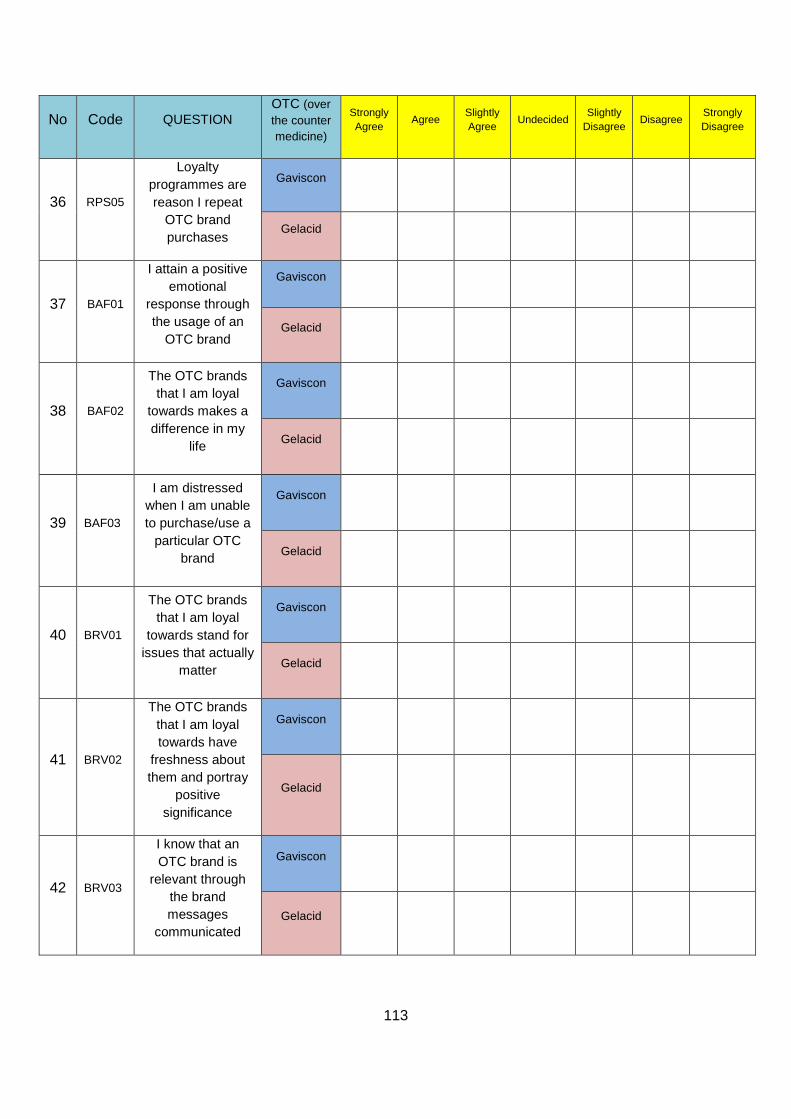
113
No Code QUESTION OTC (over the counter medicine)
Strongly Agree Agree Slightly
Agree Undecided Slightly Disagree Disagree Strongly
Disagree
36 RPS05
Loyalty programmes are reason I repeat
OTC brand purchases
Gaviscon
Gelacid
37 BAF01
I attain a positive emotional
response through the usage of an
OTC brand
Gaviscon
Gelacid
38
BAF02
The OTC brands that I am loyal
towards makes a difference in my
life
Gaviscon
Gelacid
39
BAF03
I am distressed when I am unable to purchase/use a
particular OTC brand
Gaviscon
Gelacid
40
BRV01
The OTC brands that I am loyal
towards stand for issues that actually
matter
Gaviscon
Gelacid
41
BRV02
The OTC brands that I am loyal towards have
freshness about them and portray
positive significance
Gaviscon
Gelacid
42
BRV03
I know that an OTC brand is
relevant through the brand messages
communicated
Gaviscon
Gelacid
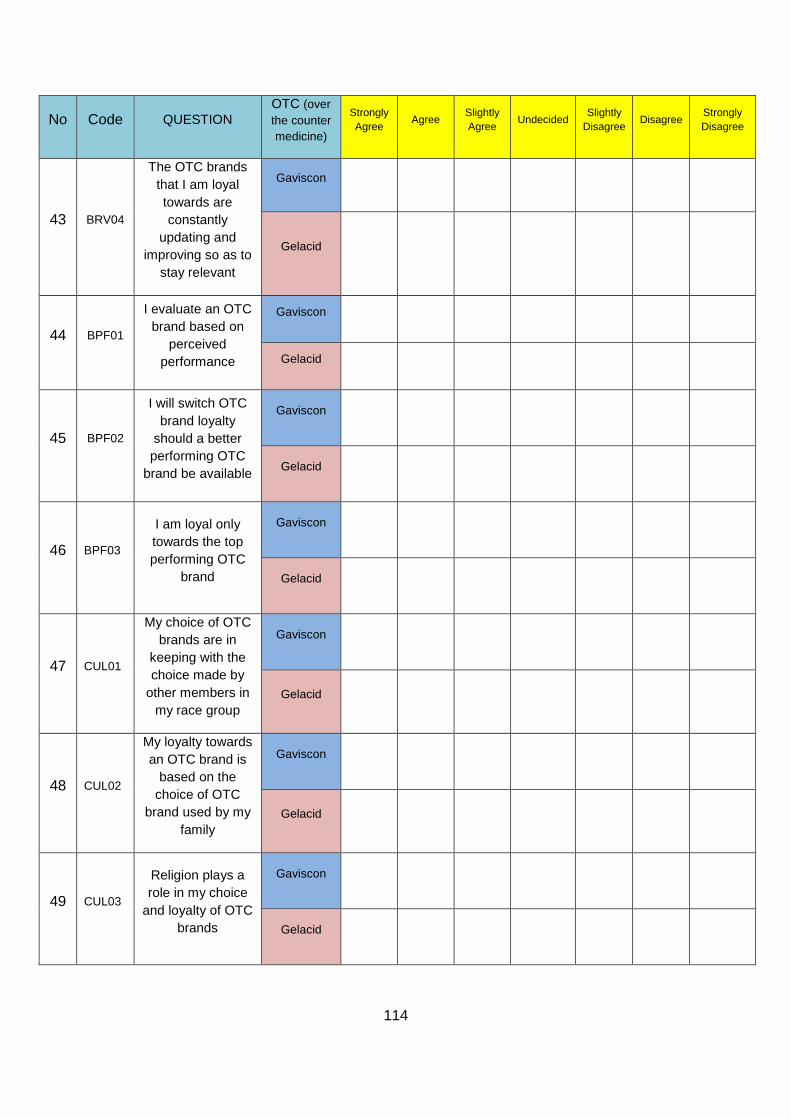
114
No Code QUESTION OTC (over the counter medicine)
Strongly Agree Agree Slightly
Agree Undecided Slightly Disagree Disagree Strongly
Disagree
43 BRV04
The OTC brands that I am loyal towards are constantly
updating and improving so as to
stay relevant
Gaviscon
Gelacid
44 BPF01
I evaluate an OTC brand based on
perceived performance
Gaviscon
Gelacid
45
BPF02
I will switch OTC brand loyalty
should a better performing OTC
brand be available
Gaviscon
Gelacid
46
BPF03
I am loyal only towards the top performing OTC
brand
Gaviscon
Gelacid
47
CUL01
My choice of OTC brands are in
keeping with the choice made by
other members in my race group
Gaviscon
Gelacid
48
CUL02
My loyalty towards an OTC brand is
based on the choice of OTC
brand used by my family
Gaviscon
Gelacid
49
CUL03
Religion plays a role in my choice
and loyalty of OTC brands
Gaviscon
Gelacid

115
No Code QUESTION OTC (over the counter medicine)
Strongly Agree Agree Slightly
Agree Undecided Slightly Disagree Disagree Strongly
Disagree
50 CUL04
Family used OTC brands indirectly
assure brand security and trust
Gaviscon
Gelacid
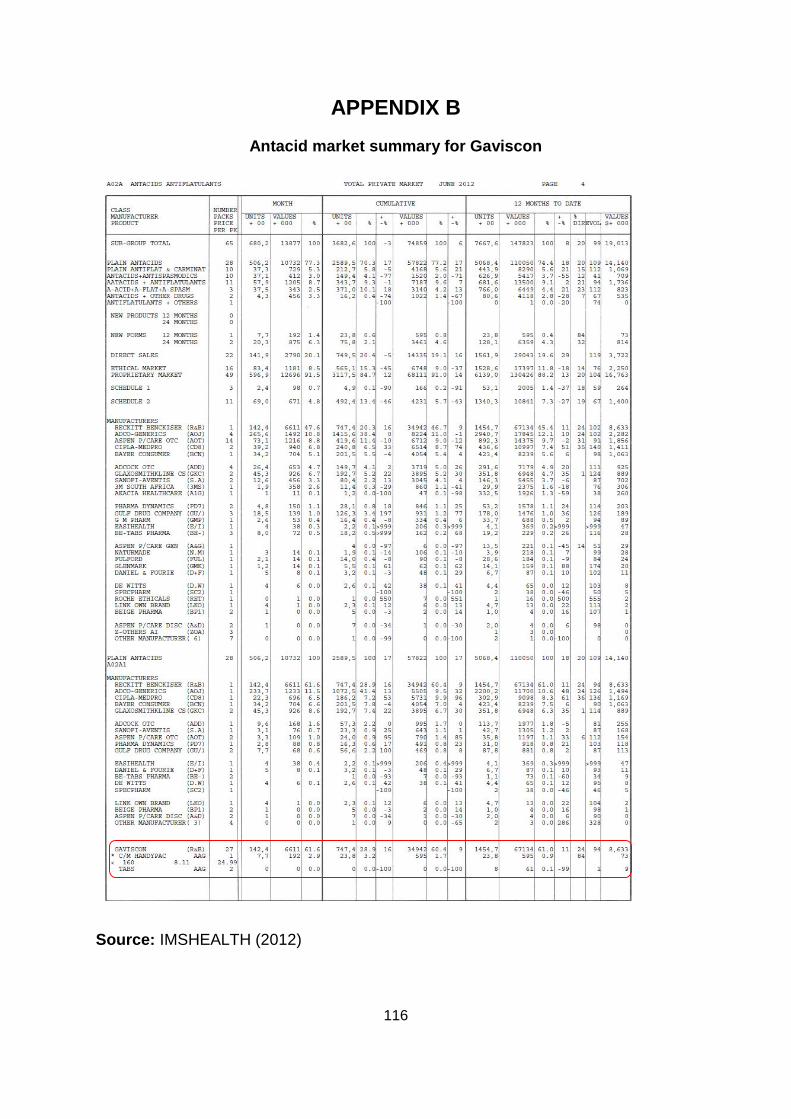
116
APPENDIX B Antacid market summary for Gaviscon
Source: IMSHEALTH (2012)
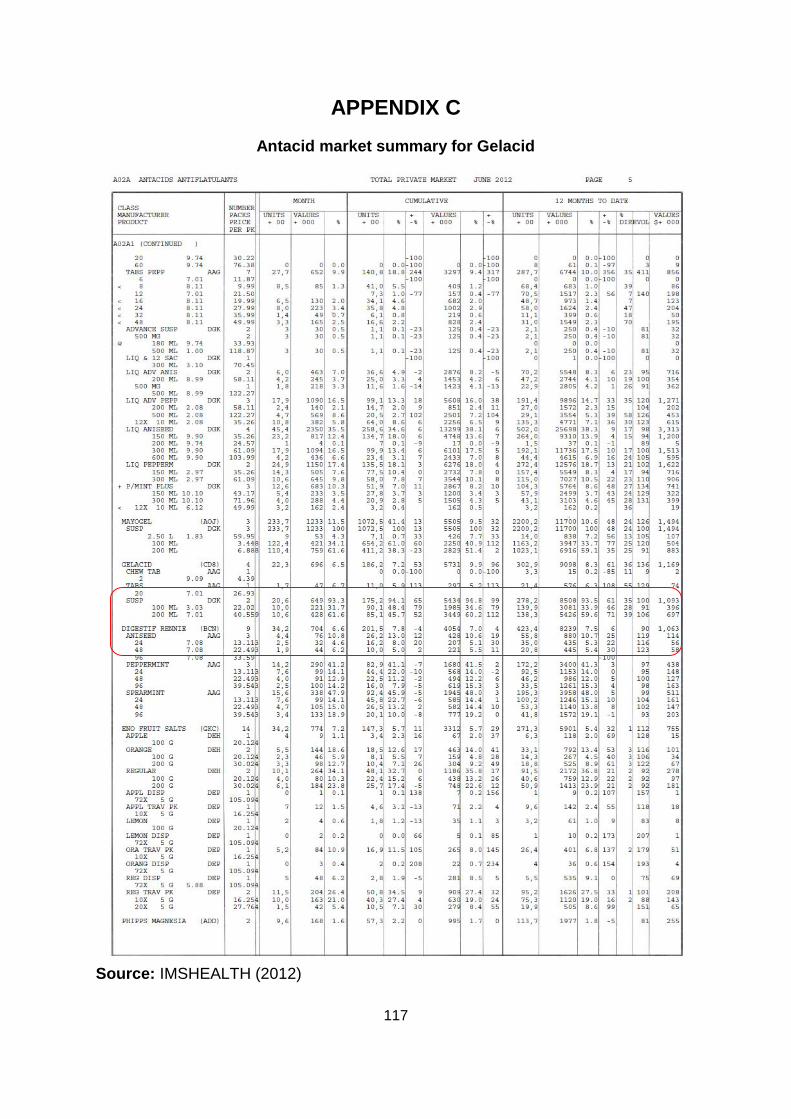
117
APPENDIX C Antacid market summary for Gelacid
Source: IMSHEALTH (2012)