measuring culture
TRANSCRIPT

Measuring Culture Executive Summary Company culture is widely recognized to be a key intangible asset, yet few investors have attempted to formally measure it. We use natural language processing to build multidimensional culture profiles for each company. Firms with strong cultures have outperformed the stock market, while those with toxic cultures have lagged.
The Ultimate Intangible Culture Worship
“Our number one priority is company culture. Our whole belief is that if you get the culture right, most of the other stuff ... will just happen naturally on its own.”
🥾 Tony Hsieh, former CEO of Zappos (RIP)
“I came to see, in my time at IBM, that culture isn't just one aspect of the game, it is the game.”
🖥 Lou Gerstner, former CEO of IBM
“Culture eats strategy for breakfast.”
💼 Peter Drucker
The primacy of company culture is a sacred truth. Business leaders from diverse backgrounds glorify culture, ascribing to it their companies’ triumphs and filling our bookshelves with bestsellers on the subject. Culture forms a central part of the narrative of successful companies.
There is just one problem. While everyone knows culture is important, nobody knows how to measure it. Culture is a fuzzy concept, whose many facets cannot be reduced to a single number. Moreover, there is no consensus around what exactly is a “good” culture. Amazon’s culture is held up as a paragon of both innovation and brutality.
In the face of these challenges, few researchers have dared attempt to quantify culture and its impact on performance. Most of the evidence we do have is anecdotal or biased, derived from cherry-picked case studies or opt-in surveys with tiny sample sizes. Culture is an orthodoxy, revered by business leaders without empirical question.
Measure What Matters 📐
Investors love numbers. In fact, we would argue that they are overly obsessed with metrics that are easy to quantify. Conversely, this leads them to undervalue crucial intangible assets simply because they are harder to measure. Culture is
one of these overlooked intangibles. In fact, culture may be the ultimate intangible -- beloved by all but valued by none!
Culture fits perfectly into our research on intangible investing. This paper will show that, like other intangibles, culture can be quantified using machine learning and the resulting metrics are undervalued by the stock market.
Myers-Briggs for Companies Fooling None of the People
The first challenge with measuring culture is that business leaders love nothing more than pumping their culture. Over 75% of CEOs interviewed for HBR in the past 30 years made sure to flaunt their company’s culture.
Cultural cheap talk has reached such an extreme that it has lost its information content. Sull et al (2020) found that over 80% of company websites touted nice-sounding corporate values such as integrity, respect, and innovation. However, they found no correlation between stated and actual values.
Netflix points out that Enron went bankrupt from fraud, despite proudly displaying “integrity” in its office lobby.
Exhibit 1 Culture Fail
Source: Netflix .
1
August 2021
Kai WuFounder & Chief Investment Officer [email protected]

Measuring Culture | Aug 2021
Corporate values are not imposed top-down by the CEO but are emergent. They are the values lived daily by actual rank-and-file employees. According to Netflix , “ actual company values, as opposed to nice-sounding values, are shown by who gets rewarded, promoted, or let go. Actual company values are the behaviors and skills that are valued in fellow employees.”
To examine the values held by rank-and-file employees, we will use Glassdoor. Glassdoor provides a forum for current and former employees to post reviews of their employers. Over the past decade, millions of reviews have been posted on the website.
Reviewers submit both numerical star ratings (1 to 5) and free-form text. While most research using Glassdoor data focuses on the structured star ratings, we’ll show how the unstructured text can be used to quantify culture.
Exhibit 2 Glassdoor Example
Source: Glassdoor, Sparkline.
While there is no perfect dataset, Chamberlain (2017) shows that Glassdoor suffers less from the polarization afflicting other review sites such as Yelp and Amazon. We are also helped by our focus on textual data, which are harder to manipulate than simple star ratings.
The Many Facets of Culture
The second challenge with measuring culture is that it is multidimensional. Unlike earnings or sales, which operate along a single dimension ($), company culture is expressed in many ways. In other words, quantifying company culture requires mapping each firm into a multidimensional space.
Since we can’t measure every facet of culture, the first order of business is to determine which are the most important. We’ll start by reviewing the values most cited by companies themselves. While stated values do not necessarily reflect values in practice, at least they capture aspirations.
Two studies, Guiso et al (2013) and Sull et al (2020) , analyzed how o�en various cultural values were posted on company websites. Although performed almost a decade apart, they reached similar results, of which the more recent is below.
Exhibit 3 The Long Tail of Corporate Values
Source: Sull et al (2020) , Sparkline.
The long-tailed distribution suggests there are a handful of values that are more universal, such as integrity and
2

Measuring Culture | Aug 2021
collaboration, which each appear in over half the websites. In contrast, there is a long tail of idiosyncratic values, such as civility and loyalty, each held by only a few companies.
The management professors O’Reilly, Chatman and Caldwell ( 1991 and 2012 ) reached a similar conclusion by surveying employees directly. They created a list of 54 cultural values (e.g., autonomy, fairness) and had employees sort this list based on both their own preference and their opinion of how characteristic each was of their employer.
They then performed principal component analysis (PCA) to cluster correlated values into broader categories and assign an importance to each. They found that the top seven broad categories captured 44% of the variance in their data. The resulting Organizational Culture Profile (OCP) has seven factors: innovation, teamwork, results-orientation, integrity, customer-orientation, detail-orientation, and transparency.
Exhibit 4 Organizational Culture Profile
Source: O’Reilly et al (2012) , Sparkline. The “innovation” and “teamwork” factors were originally named “adaptability” and “collaborative”.
They found the OCP framework to be useful for predicting job satisfaction. Employees with OCP preferences matching the OCP profiles of their employers were happier. They also found an association between CEO personality type and company OCP profile. Open-minded CEOs tend to lead innovative firms, conscientious CEOs captain detail-oriented firms, and disagreeable CEOs helm results-oriented cultures.
Building Culture Profiles
This provides a great transition to our next topic. Personality testing has become a vibrant cottage industry in the world of business. Hundreds of online personality tests promise to help job seekers find their perfect career. Popular tests include Myers-Briggs (e.g., ENTJ) and Big Five (OCEAN). Not to be outdone, hedge fund personality Ray Dalio, with help from professor Adam Grant, has created an even bigger 12-factor test called PrinciplesYou .
Our goal is to create personality profiles but for companies rather than individuals. We will use the OCP framework to define the seven dimensions of company “personality.” As with personality tests, there are other possible frameworks. We chose the OCP due to it being in the public domain for three decades and its relatively rigorous underpinnings.
In order to measure a company’s strength on each of the seven OCP dimensions, we utilize the company embeddings from Investment Management in the Machine Learning Age (June 2019) . However, rather than train our embeddings on 10-K business descriptions, we use the text component of the Glassdoor reviews.
These embeddings collapse the tens of thousands of words in the English language into a smaller number of fi�y dimensions. In doing so, the embeddings capture the semantic similarity between words based on their distance to each other in embedding space.
Once the embeddings are trained, we can use them to compute the similarity of all words to a given seed word. We define seed words for each OCP dimension to create seven clusters. The TSNE visualization below shows that the OCP factors form mostly distinct clusters. However, we do see that certain values are more similar to some than others. For example, transparency is adjacent to integrity and teamwork but less related to detail and customer.
3

Measuring Culture | Aug 2021
Exhibit 5 Culture Embeddings
Source: Glassdoor, Sparkline. As of 7/31/2021.
We ran a search for all words within a certain predefined distance from the seed words. This produced lists of around 40 to 140 words per cluster, from which some examples are drawn below. We included bigrams, trigrams and four-grams to capture common idiomatic patterns such as “corporate social responsibility” or “open door policy.”
Exhibit 6 OCP Keywords
Source: Glassdoor, Sparkline. As of 7/31/2021.
The topic clusters are extremely intuitive. Innovation is strongly associated with the values of creativity and adaptability; integrity is tied to empathy and compassion; detail-orientation is coupled with quality and reliability; and transparency relates to openness and communication.
The next step is to determine each company’s strength on each OCP dimension. One approach is simply to count how frequently a given company’s reviews mention the keywords for each value (e.g., Li et al (2020) ). The key is that we look for not only the seed words (e.g., innovative) but also the dozens of other cultural values associated with the factor (e.g., open-mindedness and agility).
A second approach is to simultaneously train our model for words and companies so that they coexist in the same embedding space. This enables us to directly compute the vector distance of each company to the keywords for each OCP factor. We use both approaches and blend the final result into a composite. This allows us to generate a culture score for each of the seven dimensions for each company.
The next exhibit shows the culture profiles for a few large companies. Nvidia focuses on innovation, Honeywell excels at details, and Starbucks cares about the customer. Given the nature of their respective businesses, this makes sense.
Exhibit 7 Culture Profile Examples
Source: Glassdoor, Sparkline. As of 7/31/2021.
This suggests that companies mold their culture based on the business they are in. The next exhibit shows the average culture profile for each sector in the Russell 1000.
4

Measuring Culture | Aug 2021
Exhibit 8 Industry and Culture
Source: S&P, Glassdoor, Sparkline. As of 7/31/2021.
Each industry has its own culture. Technology and health care companies tend to have innovative cultures. Consumer companies prioritize the customer. Material and industrial firms have detail-oriented cultures suited to the rigors of industrial production. Of course, these averages may mask significant intra-industry variance. As with personality, culture varies greatly across companies, even among those in the same industry.
You Can’t Force Culture
“Many of the traits that make Amazon unusual are now deeply ingrained in the culture. In fact, if I wanted to change them, I couldn't. The cultures are self-reinforcing, and that's a good thing.”
📦 Jeff Bezos, Founder of Amazon
Culture is deeply rooted in organizations. As a result, culture tends to be slow-moving and persistent. While founders typically establish a firm’s initial culture, once the casting has set, culture can last for generations. CEOs brought in to turn around a company’s culture face an uphill battle, which, even if successful, can take many years.
We can measure how company culture evolves over time. Instead of training our embeddings once on the full sample, we re-train each month using a rolling two-year window based on each review’s timestamp. The next exhibit shows the serial correlation of OCP culture scores with varying lags.
Exhibit 9 Long Live Culture
Source: Glassdoor, Sparkline. As of 7/31/2021.
Culture decays extremely slowly, maintaining a strong 45% correlation to its original setting even a decade later. However, while culture is very stable on average, it is not predestined. For example, we find that smaller companies tend to have more malleable cultures, as expected.
Culture is a very long-duration intangible asset. Companies with good cultures enjoy a long-lived advantage, while those with bad cultures can be dogged by this liability for many years. Business leaders would be well served to get culture right the first time!
Lip Service
We now return to our earlier point that investors cannot rely on CEOs to tell us their companies’ cultural values. We repeat the previous analysis, but instead of Glassdoor reviews we use earnings call transcripts. These calls, which consist of a presentation by management followed by Q&A, are an important channel companies use to communicate with the investing public.
Building culture profiles from both employee reviews and earnings calls for the same company allows us to contrast what management says is their culture with the beliefs of rank-and-file employees. The next exhibit shows the correlation between the scores generated from employee reviews and earnings calls for each OCP dimension.
5

Measuring Culture | Aug 2021
Exhibit 10 Tale of Two Cultures
Source: S&P, Glassdoor, Sparkline. As of 7/31/2021.
With the exception of innovation, we find the correlation is quite weak. This corroborates the earlier finding that the values on company websites are mainly for public relations purposes. Investors need to look beyond the official company line to the values held by actual employees.
Culture and Performance Why Culture Matters
“Why is culture so important to a business? Here is a simple way to frame it. The stronger the culture, the less corporate process a company needs. When the culture is strong, you can trust everyone to do the right thing.”
🏡 Brian Chesky, CEO of Airbnb
We just showed that culture can indeed be measured. But just because something can be measured does not necessarily mean that it matters. In fact, most company characteristics (e.g., logo color) have no material impact on performance. However, there is good theoretical reason to believe that culture matters.
As Chesky says, the advantage of strong culture is that it reduces the need for explicitly defined rules and corporate bloat. Culture constitutes the “first principles” that underpin decision making. Employees can rely on principles such as “bias towards action” or “default to open” to guide the hundreds of micro-decisions required of them each day.
Relatedly, culture helps promote consistency across all parts of an organization. Firms want to avoid employees or teams rowing in opposite directions, which can happen when they are not aligned around a common set of principles.
Strong culture is especially valuable in complex, dynamic, and ambiguous environments, where fully monitoring and directing employee behavior is impossible. It is also particularly valuable in crises, such as the current pandemic, when there is no time to create a new playbook.
Another view of culture is that it is a force multiplier on an underlying pool of talent. An innovative culture can help get the most out of employees, even those who would not otherwise be natural innovators. Conversely, a rigid culture can stifle innovation, driving a company’s most creative employees to quit in frustration.
Finally, as we will later discuss, great company culture can improve employee satisfaction. Happy employees are more loyal and motivated and are more likely to recommend their company to potential hires and customers.
Innovative Cultures
Innovative cultures are extremely coveted. In a recent survey of over 700 CEOs , “creating an innovative culture” ranked as the third most important priority. CEOs are increasingly recognizing that stale corporate cultures are holding back their employees' innovative potential.
However, as with culture more generally, we cannot simply rely on firms to tell us if they are innovative. In A Human View of Disruption (Feb 2021) , we tracked investment in technical human capital (e.g. PhDs, STEM degrees, AI jobs) to provide a “ground truth” indicator of firms truly embracing the digital age. Similarly, we can use employee reviews to identify firms with truly innovative cultures.
The next exhibit shows how large-cap companies stack up on innovative culture score. High-scoring firms have employees who frequently cite their orientation toward values such as agility and creativity. The most innovative cultures tend to be found in the technology and health care sectors, while the least innovative cultures are in banking. We also observe a strong correlation between innovative culture score and technical human capital.
6

Measuring Culture | Aug 2021
Exhibit 11 Innovative Cultures
Source: S&P, Glassdoor, Sparkline. Units are percentages. As of 7/31/2021.
We can run a point-in-time backtest of the long-short performance of the most compared to least innovative firms. Each month, we compute the innovative culture score using data from the past two years and calculate the returns for the next month. We also control for industry membership so that we don’t end up simply long tech and short financials.
Exhibit 12 Innovation Outperformance
Source: S&P, Glassdoor, Sparkline. Blue line shows the performance of the innovative culture factor in a universe consisting of the top 1000 largest U.S. stocks by market cap. Red line shows the same but neutralizes net exposure to the 11 GICS sectors. We exclude transaction and financing costs. From 12/31/2009 to 7/31/2021. See important backtest disclosure below.
Companies with innovative cultures have outperformed. Interestingly, innovative cultures have not only won in the technology sector, but in many other industries. This is consistent with our argument that “all companies are tech companies.” While some sectors lead others on innovation, disruption is ultimately impacting all parts of the economy.
The Rest of the Seven
Innovation is the most important dimension of the OCP and is also the most coveted by managers and investors today. However, the other six factors together explain four times the variance of innovation alone and should not be ignored.
We ran the previous analysis for each of the seven dimensions of culture. We again consider both market- and industry-neutral versions of the strategy.
Exhibit 13 The Primacy of Culture
Source: S&P, Glassdoor, Sparkline. Blue bars show the performance of each culture factor in a universe consisting of the top 1000 largest U.S. stocks by market cap. Red bars are the same but neutralize net exposure to the 11 GICS sectors. We exclude transaction and financing costs. From 12/31/2009 to 7/31/2021. See important backtest disclosure below.
All seven factors have produced outperformance, both market- and sector-neutral. The results are strongest for innovation, results-orientation and customer-orientation and weakest for integrity and detail-orientation.
We next examine the correlations between the OCP factors. In practice, they are not fully independent. Integrity and transparency are correlated, which perhaps results from unethical behavior being hard to disguise in transparent
7

Measuring Culture | Aug 2021
organizations. Teamwork and innovation are also linked, which may reflect the benefit of recombinant innovation in diverse teams.
Exhibit 14 Culture Correlation Matrix
Source: S&P, Glassdoor, Sparkline. As of 7/31/2021.
Finally, we create a combined culture score by blending all seven factors. Given their strong individual performance and low correlation, it should be no surprise that the overall results are pretty decent.
An interesting feature of this performance is the huge gain at the start of the Covid-19 pandemic. This is not simply driven by the windfall that innovative firms received from the pull-forward of digital adoption. All seven OCP factors had abnormally positive performance at the onset of the crisis. As mentioned, culture can be an even greater asset in times of uncertainty and stress.
Exhibit 15 Cultural Strength
Source: S&P, Glassdoor, Sparkline. Blue line shows the performance of the composite culture factor in a universe consisting of the top 1000 largest U.S. stocks by market cap. Red line shows the same but neutralizes net exposure to the 11 GICS sectors. We exclude transaction and financing costs. From 12/31/2009 to 7/31/2021. See important backtest disclosure below.
Contextual Cultures
We were a bit surprised to find that all seven OCP factors produced positive results. We had initially expected only a few values to be universally beneficial, with others helpful only in certain contexts. For example, while integrity may be a universal good, stability is likely only helpful under certain conditions, as it generally involves a tradeoff with agility.
We believe that our consistently positive results are mainly due to our specific choice of values. The seven OCP values are by construction the most universal cultural values. Recall that they were deliberately chosen from a set of 54 possible options due to being the top seven principal components.
Furthermore, as noted earlier, the OCP values have a very high overlap with the aspirational values stated on company websites. These are the values that companies themselves value, or at least want people to associate with them. There is a very good reason that 65% of companies cite their deep commitment to integrity but only 2% cite the primacy of risk management (and an equivalent 2% even declare allegiance to the quasi-opposing value of risk-taking)!
We can test this theory by creating investible factors for some of the less universally held cultural values, such as hierarchy, stability, and empowerment. Indeed, we find that
8

Measuring Culture | Aug 2021
all three dimensions fail to produce excess returns, at least on average across all companies. However, it is possible the average masks some interesting heterogeneity.
We (crudely) split our investment universe into “procedural” and “creative” industries. We find that a culture of stability does confer some benefits to firms in procedural industries, but is a liability for creative firms. As a robustness check, we similarly found that stability helps firms in industries with low growth expectations (but hurts high-growth firms).
Exhibit 16 Double-Edged Sword ⚔
Source: S&P, Glassdoor, Sparkline. Blue line shows the performance of the stability culture factor in a universe consisting of companies in the top 1000 U.S. stocks by market cap and the GICS IT, health care, and communications sectors. Red line shows the same but in a universe consisting of the remaining 8 GICS sectors. We exclude transaction and financing costs. From 12/31/2009 to 7/31/2021. See important backtest disclosure below.
It stands to reason that all values, even the “universal” ones, are at least somewhat contextual. Even integrity likely matters more for some businesses than others (e.g., banking, medicine). Although a topic for further research, we expect we can further improve the performance of our culture factors by taking context into account.
Strong Culture Theory Master of None
“Innovation means saying no to a thousand things.”
📱 Steve Jobs, former CEO of Apple
So far, we have found that strength on all seven dimensions is good, all else equal . However, what if all else is not equal? Suppose that firms only have a finite number of chips to spend on culture. In this case, one has to prioritize which values to spend their cultural capital on.
We define “focused” company cultures as those that invest in one or two cultural factors at the expense of all others. Amazon is obsessed with customer service and innovation, but less concerned with fostering a nurturing work environment. As Jeff Bezos said, “our culture is friendly and intense, but if push comes to shove we'll settle for intense.”
Similarly, Facebook’s motto “move fast and break things” implies an obsession with innovation at the expense of details (and perhaps integrity). Apple is also focused on innovation but notoriously non-transparent. Netflix’s culture of “freedom and responsibility” is also very opinionated; they are quite explicit that their culture is not for everyone.
Exhibit 17 Not Right for Everyone
Source: Netflix.
Ray Dalio is similarly unapologetic about his firm’s unique culture. Founded on “radical transparency,” Bridgewater is famous for recording workplace conversations and having
9

Measuring Culture | Aug 2021
employees rate each other on an app. Dalio explains why 25% of his employees leave in their first 18 months:
“Some people love knowing about their weaknesses and mistakes and those of others because it helps them be so much better, while others can't stand it. So we end up with a lot of people who leave quickly and a lot of people who wouldn't want to work anywhere else.”
Turnover can actually be good if it improves firm-employee alignment. Zappos is another customer-obsessed culture. Its founder Tony Hsieh went so far as to offer his employees buyouts a�er their first month of employment. The idea was to not trap those who felt they were not a good fit for Zappos’ unique culture.
While each of these firms has its own cultural focus, they all display a maniacal devotion to their focal value above all others. They are not trying to be everything to everyone; they would rather lose employees than compromise on culture. This is a form of investment. In the short run, they pay in employee turnover. However, the employees who do remain are bought in.
These companies also happen to all be wildly successful. But before we assume a link between cultural focus and success, we need to consider the risk of survivorship bias. The reason these firms’ unique cultures reached our notice in the first place is because of their success. It is even possible that focused cultures are high-risk / high-reward, with a much greater share imploding without our notice.
Thus, we need to create a metric of cultural focus that we can apply consistently and point-in-time across our entire investment universe. The next exhibit rearranges our radar charts into columns, allowing us to more clearly visualize the distribution of culture in four hypothetical organizations.
Companies A and D have focused cultures; each prioritizes a single salient dimension. Company C is consistently high on all dimensions; while its culture is strong, it is not focused. Company B has a bland culture; it is both weak and not focused.
Exhibit 18 Focused Culture Examples
Source: Sparkline.
While we will spare you the math, we define a battery of statistical metrics to identify distributions similar to those of Companies A and D. We blend these metrics to create a composite cultural focus factor, which we backtest below.
Exhibit 19 Focused Cultures
Source: S&P, Glassdoor, Sparkline. Blue line shows the performance of the focused culture factor in a universe consisting of the top 1000 largest U.S. stocks by market cap. Red line shows the same but neutralizes net exposure to the 11 GICS sectors. We exclude transaction and financing costs. From 12/31/2009 to 7/31/2021. See important backtest disclosure below.
We find that firms with focused cultures have outperformed. Netflix and Bridgewater are not merely outliers. The market has indeed rewarded leaders with a strong vision for their company culture and the ability to stick to this vision even if it means not being able to please everyone.
10

Measuring Culture | Aug 2021
Break the Monoculture
Corporate culture can be extremely bland. Corporate leaders spout values such as integrity so frequently that they have become platitudes. Integrity should really be table stakes. Perhaps more information is revealed by companies that pride themselves on less obvious, more idiosyncratic values.
If nothing else, isn’t it so much more refreshing when Netflix makes opinionated statements like “we are a team, not a family”? Standing out can be good. Apple’s iconic 1984 Super Bowl ad successfully positioned the Mac as our savior from dystopian conformity.
Exhibit 20 Think Different
Source: Apple.
Our next study measures the distance of company cultures to each other in order to identify interesting outliers. We compare companies both to their peers in the Russell 1000 as well as their direct industry competitors.
Rather than calculate distance based on the seven OCP dimensions, we compute it directly from the 50-dimensional company embeddings. By construction, the OCP framework only considers the seven most universal values, ignoring culture’s long tail. However, the whole point of this analysis is to identify firms with idiosyncratic cultures. For example, while the OCP might capture “radical transparency” in its transparency factor, “freedom and responsibility” does not fit neatly into the framework.
Below are examples of companies that score highly on our measure of cultural uniqueness. In addition to Apple, Amazon and Netflix, companies such as Southwest Airlines,
HubSpot, Chipotle, Slack and Costco are well known for their unique and occasionally quirky cultures.
Exhibit 21 Unique Culture Examples
Source: Glassdoor, Sparkline. As of 7/31/2021.
Finally, we can test the hypothesis that companies with unique cultures have outperformed.
Exhibit 22 I Want to Be the Minority
Source: S&P, Glassdoor, Sparkline. Blue line shows the performance of the unique culture factor in a universe consisting of the top 1000 largest U.S. stocks by market cap. We exclude transaction and financing costs. From 12/31/2009 to 7/31/2021. See important backtest disclosure below.
Firms with unique cultures have outperformed. Perhaps cultural uniqueness is itself an intangible moat. Costco’s reputation for treating its workers well has become part of its brand, differentiating it from other retailers. Or perhaps the causality is reversed and it is merely a trapping of
11

Measuring Culture | Aug 2021
success; only leaders who are already successful “earn the right” to be culturally idiosyncratic. In any case, investors should pay special attention to firms with strong cultures.
Employee Goodwill Employee Satisfaction
“Train people well enough so they can leave. Treat them well enough so they don’t want to.”
🚀 Richard Branson, Founder of the Virgin Group
Relationships matter in the business world. And one of the most important relationships that a company must manage is its relationship with its labor force. Human capital is not owned by the firm, but walks out the door each day. Firms must work hard to attract and retain top talent. Arguably, talent management is the only job of the modern firm.
Employee goodwill is an intangible asset that enables firms to achieve this goal. Treating your employees well builds up a reserve of goodwill, which is paid back in the form of greater motivation and loyalty. Furthermore, happy employees are more likely to spread the word, enhancing brand and recruiting efforts.
One way to build up employee goodwill is to pay well. Another way is to provide perks and other benefits. As an aside, accounting treats such human capital outlays as an expense rather than an investment. Unlike tangible capex, investment in intangible assets such as employee goodwill, intellectual property and brand do not lead to the creation of a balance sheet asset. This inconsistency contributes to the undervaluation of intangibles.
But even if we did capitalize the cost of efficiency wages and dental insurance, we would still be missing a significant component of employee goodwill. Contrary to classical economic models, humans are motivated by more than just money. Intangibles like company culture, coworker relationships, and corporate mission play an important role in employment choice.
Measuring Satisfaction
Our next goal is to measure employee satisfaction and assess its relationship to performance. As with culture in general, there are only a handful of rigorous papers on this topic. First, Edmans (2011) links employee satisfaction to
stock market returns by studying the winners of the “100 Best Companies to Work For in America” survey. More recently, Green et al (2019) uses Glassdoor reviews to measure employee satisfaction over a much larger swath of companies. However, they focus on structured star ratings.
We will instead use NLP on the text of Glassdoor reviews to identify firms with happy employees. We can leverage the same embeddings we used to create company culture profiles. However, rather than use the seed words from the OCP, we create a new set of seed words to measure key dimensions of employee satisfaction. The next exhibit shows the keywords derived from our embeddings.
Exhibit 23 Employee Satisfaction Keywords
Source: Glassdoor, Sparkline. As of 7/31/2021.
These keywords are intuitively related to the seed words. For example, trust is related to terms such as “willing to listen” and “walk the talk.” Next, we score each company on each of the factors above and combine these scores to produce a composite index of employee satisfaction.
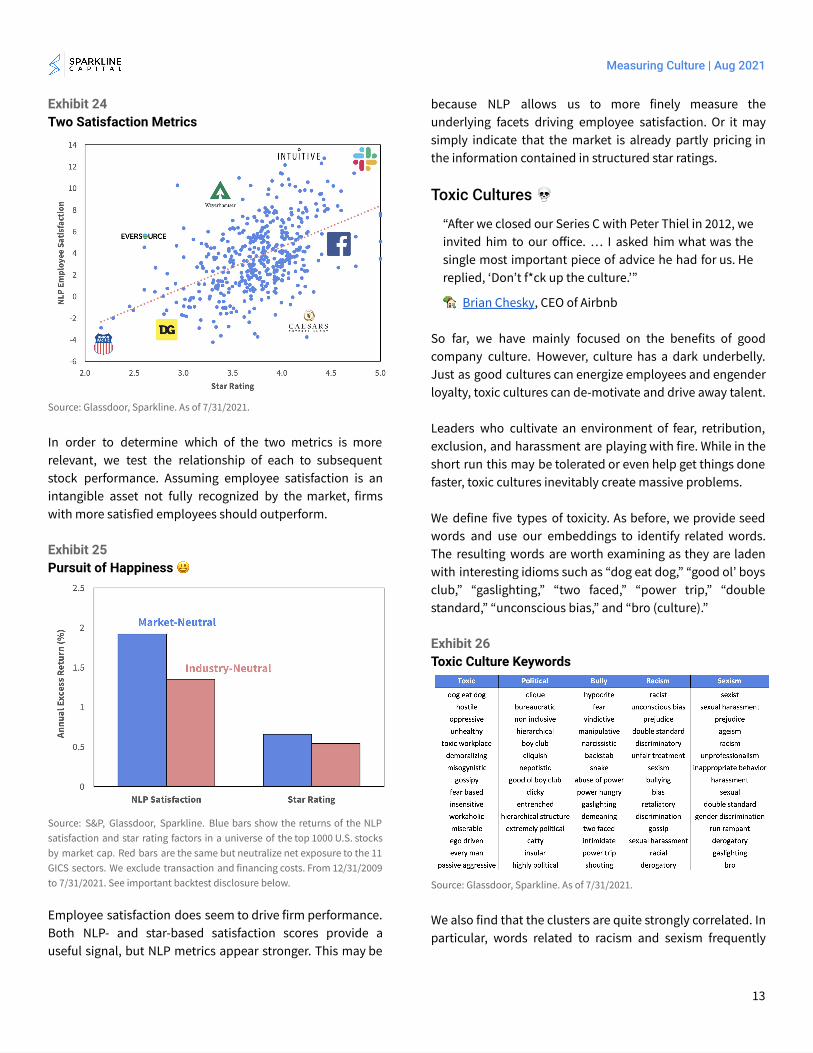
As a validation exercise, we cross-reference these scores against Glassdoor star ratings. The two metrics have a strong but imperfect 60% correlation. Companies such as Slack and Intuitive Surgical score highly on both NLP- and star-based metrics. However, firms such as Eversource and Caesars Entertainment score highly on only one metric.
12
Measuring Culture | Aug 2021
Exhibit 24 Two Satisfaction Metrics
Source: Glassdoor, Sparkline. As of 7/31/2021.
In order to determine which of the two metrics is more relevant, we test the relationship of each to subsequent stock performance. Assuming employee satisfaction is an intangible asset not fully recognized by the market, firms with more satisfied employees should outperform.
Exhibit 25 Pursuit of Happiness 😃
Source: S&P, Glassdoor, Sparkline. Blue bars show the returns of the NLP satisfaction and star rating factors in a universe of the top 1000 U.S. stocks by market cap. Red bars are the same but neutralize net exposure to the 11 GICS sectors. We exclude transaction and financing costs. From 12/31/2009 to 7/31/2021. See important backtest disclosure below.
Employee satisfaction does seem to drive firm performance. Both NLP- and star-based satisfaction scores provide a useful signal, but NLP metrics appear stronger. This may be
because NLP allows us to more finely measure the underlying facets driving employee satisfaction. Or it may simply indicate that the market is already partly pricing in the information contained in structured star ratings.
Toxic Cultures 💀
“A�er we closed our Series C with Peter Thiel in 2012, we invited him to our office. … I asked him what was the single most important piece of advice he had for us. He replied, ‘Don’t f*ck up the culture.’”
🏡 Brian Chesky , CEO of Airbnb
So far, we have mainly focused on the benefits of good company culture. However, culture has a dark underbelly. Just as good cultures can energize employees and engender loyalty, toxic cultures can de-motivate and drive away talent.
Leaders who cultivate an environment of fear, retribution, exclusion, and harassment are playing with fire. While in the short run this may be tolerated or even help get things done faster, toxic cultures inevitably create massive problems.
We define five types of toxicity. As before, we provide seed words and use our embeddings to identify related words. The resulting words are worth examining as they are laden with interesting idioms such as “dog eat dog,” “good ol’ boys club,” “gaslighting,” “two faced,” “power trip,” “double standard,” “unconscious bias,” and “bro (culture).”
Exhibit 26 Toxic Culture Keywords
Source: Glassdoor, Sparkline. As of 7/31/2021.
We also find that the clusters are quite strongly correlated. In particular, words related to racism and sexism frequently
13

Measuring Culture | Aug 2021
coexist. Sadly, companies that tolerate sexual harassment are also more likely to enable racist behavior.
We can once again use our trained embeddings to identify companies with our desired cultural characteristics, in this case toxicity. The next exhibit shows how these toxic companies perform compared to the broader stock market.
Exhibit 27 What Goes Around, Comes Around ⚖
Source: S&P, Glassdoor, Sparkline. Blue line shows the performance of the toxic culture factor in a universe consisting of the top 1000 largest U.S. stocks by market cap. We exclude transaction and financing costs. From 12/31/2009 to 7/31/2021. See important backtest disclosure below.
Firms with toxic cultures have dramatically underperformed. We also tested a sector-neutral version to remove the impact of some industries being more male-dominated and less diverse than others but found similar underperformance. This effect appears to have accelerated in recent years, which may be in part due to a business climate that is becoming increasingly intolerant of bad behavior.
The Long Game
Culture is an important type of intangible capital. Culture provides a moat around a firm’s human capital. The rising importance of human capital in the knowledge economy implies that this moat is becoming increasingly key.
However, building cultural capital requires significant investment. This goes beyond the mere cost of fancy gyms, holiday parties, and happy hours. Every time a company
fires or decides not to hire a “brilliant jerk,” it is trading a short-term tangible for a long-term intangible.
While such choices may in the short run disrupt productivity, they amount to small investments in culture that compound over time. Conversely, ethical compromises may not be immediately noticeable but over time lead to irreversible cultural deterioration.
Culture is the ultimate long game. As a long-duration intangible, cultural investment is o�en not only ignored by the market but can even be penalized by investors focused on tangible quarterly results. Building cultural capital requires the utmost conviction and patience.
Our interest in measuring culture stems from our work on intangible investing. Interestingly, we share this goal with an unrelated group of investors. ESG investors select firms on the basis of perceived societal impact. Their work focuses on quantifying social impact with metrics such as CO 2 intensity and board diversity. Their hope is that these metrics provide a yardstick for institutional investors to reward prosocial and punish antisocial corporate behavior.
Company culture is an important part of both the social and governance pillars. As a result, our framework for measuring company culture may be useful for ESG investors as well. Buying companies with great cultures may offer investors the potential to do both well and good.
Conclusion Company culture is the ultimate intangible asset. Everyone knows it is important but nobody knows how to measure it. While there is still a lot more work to be done, we hope this paper provides some early evidence that culture both counts and can be counted. Furthermore, we hope it encourages business leaders to build tools to measure and thus improve their cultures, to the benefit of both themselves and society.
14

Measuring Culture | Aug 2021
Kai Wu Founder & CIO, Sparkline Capital LP
Kai Wu is the founder and Chief Investment Officer of Sparkline Capital, an investment management firm applying state-of-the-art machine learning and computing to uncover alpha in large, unstructured data sets.
Prior to Sparkline, Kai co-founded and co-managed Kaleidoscope Capital, a quantitative hedge fund in Boston. With one other partner, he grew Kaleidoscope to $350 million in assets from institutional investors. Kai jointly managed all aspects of the company, including technology, investments, operations, trading, investor relations, and recruiting.
Previously, Kai worked at GMO, where he was a member of Jeremy Grantham’s $40 billion asset allocation team. He also worked closely with the firm's equity and macro investment teams in Boston, San Francisco, London, and Sydney.
Kai graduated from Harvard College Magna Cum Laude and Phi Beta Kappa.
Disclaimer This paper is solely for informational purposes and is not an offer or solicitation for the purchase or sale of any security, nor is it to be construed as legal or tax advice. References to securities and strategies are for illustrative purposes only and do not constitute buy or sell recommendations. The information in this report should not be used as the basis for any investment decisions.
We make no representation or warranty as to the accuracy or completeness of the information contained in this report, including third-party data sources. This paper may contain forward-looking statements or projections based on our current beliefs and information believed to be reasonable at the time. However, such statements necessarily involve risk and uncertainty and should not be used as the basis for investment decisions. The views expressed are as of the publication date and subject to change at any time.
Backtest Disclosure The performance shown reflects the simulated model performance an investor may have obtained had it invested in the manner shown but does not represent performance that any investor actually attained. This performance is not representative of any actual investment strategy or product and is provided solely for informational purposes.
Hypothetical performance has many significant limitations and may not reflect the impact of material economic and market factors if funds were actually managed in the manner shown. Actual performance may differ substantially from simulated model performance. Simulated performance may be prepared with the benefit of hindsight and changes in methodology may have a material impact on the simulated returns presented.
The simulated model performance is adjusted to reflect the reinvestment of dividends and other income. Simulations that include estimated transaction costs assume the payment of the historical bid-ask spread and $0.01 in commissions. Simulated fees, expenses, and transaction costs do not represent actual costs paid.
Index returns are shown for informational purposes only and/or as a basis of comparison. Indexes are unmanaged and do not reflect management or trading fees. One cannot invest directly in an index. The S&P 500 is a popular gauge of large-cap U.S. equities that includes 500 leading companies. The Russell 1000 Index consists of the approximately top 1000 U.S. stocks by market cap. The Russell 1000 Value (Growth) Index includes those Russell 1000 companies with lower (higher) price-to-book ratios and expected and historical growth rates.
No representation or warranty is made as to the reasonableness of the methodology used or that all methodologies used in achieving the returns have been stated or fully considered. There can be no assurance that such hypothetical performance is achievable in the future. Past performance is no guarantee of future results.
15