measuring customers’ affective-cognitive experience and … · 2010-08-22 · employed in...
TRANSCRIPT

DRAFT: PLEASE DO NOT CIRCULATE WITHOUT PERMISSION 1
Measuring Customers’ Affective-Cognitive Experience and Predicting the Market Success of New Products or Services HYUNG-IL AHN ROSALIND W. PICARD * * Hyung-il Ahn is a doctoral candidate in Media Arts and Sciences at the Media Laboratory, Massachusetts Institute of Technology, 20 Ames Street, Cambridge, MA 02139 ([email protected]). Rosalind W. Picard is Professor of Media Arts and Sciences at the Media Laboratory, Massachusetts Institute of Technology, 20 Ames Street, Cambridge, MA 02139 ([email protected]).

DRAFT: PLEASE DO NOT CIRCULATE WITHOUT PERMISSION 2
Abstract Measuring customers’ experience to predict their collective preference toward new products or services is very difficult: focus groups and cognitive self-reports, while often employed in marketing and consumer research, are not accurate predictors of future marketplace success. The authors present a new affective-behavioral-cognitive (ABC) framework to evaluate customers’ liking and wanting and predict their marketplace decisions. In this framework, we measure the usual cognitive questionnaire information and behavioral information together with new affective information (skin conductance and facial valence) while a customer makes repeated selections in a random-outcome two-option decision task to figure out which option is more likely to provide the preferred product. The application of our framework in beverage taste tests shows that the affective measure reveals something important not captured by the cognitive and behavioral measures and increases the discriminability of telling which product people like more. Moreover, this increased discriminability leads to better marketplace prediction.

DRAFT: PLEASE DO NOT CIRCULATE WITHOUT PERMISSION 3
Introduction Most attempts to date that try to measure customers’ experience or feelings and
predict marketplace outcomes of new products or services tend to center around focus-group studies or questionnaires where respondents are asked about what they like or want. Considerable doubt, however, has been cast over the validity and reliability of self-report or “cognitive” measures of emotional experience (Kahneman 2000; Larsen and Fredrickson 1999; Stayman and Aaker 1993). Self-report measures often capture cognitive and subjective elements of overall liking or wanting (what you think you should say you like or want) but may or may not capture the actual momentary feelings of liking or wanting. Self-reports are likely to condense previous experience in a retrospective manner often relying on a peak (intense-emotion) or end moment during the experience (Kahneman et al. 1997). Also, self-reports tend to predict future experience according to a risk- and loss-sensitive utility function with some subjective reference point (Kahneman and Tversky 1979); thus, each respondent’s self-reports are likely to draw on a distorted and biased memory of the actual emotional experience and be given in his or her own relative scale. Moreover, it would be very difficult and impractical for an experimenter to later understand how each respondent created the resulting self-report data and infer a computational mechanism that each respondent adopted to make the self-reports. To overcome one of the weaknesses of the overall self-reports, which could arise from the respondent’s “subjectively” aggregating the past emotional experience, it has been suggested to use continuous or “moment-by-moment” self-report measures and then “objectively” aggregate the subjective experience (Kahneman 2000; Kahneman et al. 1997). Some examples for the continuous measures are “rotating a dial” or “sliding a bar” in real time during an episode of emotional experience (Stayman and Aaker 1993). Although such momentary self-reports allow aggregating the respondent’s subjective experience over time in a statistical manner, they still are likely to be biased significantly by the respondent’s cognitions related to reporting his or her subjective experience. Also, the rotate-or-slide physical responses can be delayed or missed completely because of the load of the primary task occupying the person’s attention.
This paper presents a new affective-behavioral-cognitive (ABC) framework for systematically and efficiently gathering affective measures (facial expression valence and skin conductance arousal), behavioral measures (physical number of choices, consumed amounts, evaluation times), and cognitive self-reports (“how much do you like this product” and “how likely are you to buy this product”) and combining them computationally to infer respondents’ preference and predict future marketplace success or failure of new products or services more accurately than cognitive measures do alone. The new framework draws upon advances in machine learning, affective computing, neuroscience, psychology, and behavioral economics, proposing a methodology for naturally and reliably eliciting respondents’ expressions of their intuitive feelings about products or services. The results allow a fuller representation of human experience to be used in making important decisions about new products and services.

DRAFT: PLEASE DO NOT CIRCULATE WITHOUT PERMISSION 4
Affective-Behavioral-Cognitive (ABC) Framework Our framework begins with three principles that need to be addressed in order to
elicit accurate affective information: (1) a respondent’s affective expression can be more influenced by a person than by a product, so unnecessary human interaction should be minimized during measurement of customer-product experience; (2) a respondent should experience each product multiple trials because their liking and wanting can change after initial impressions; and (3) a respondent should be made comfortable to freely express both wanting and liking, positive and negative.
The framework below addresses the first principle by maximizing the use of technology and minimizing human interaction during the product trials. After the respondent has been greeted, the consent form signed, and all questions answered, the rest of the experiment happens just with the respondent, the computer and the products or services alone in a room. Thus, we seek to minimize the social and interpersonal factors that can dramatically impact a person’s comfort in disclosing true negative feelings.
In order to address the second principle and elicit respondent’s affective-behavioral-cognitive responses in a multiple trial-by-trial (“moment-based”) manner, we introduce a tool from machine learning that was adapted from casinos – a two-armed bandit – a slot machine with two arms, either of which you can choose to pull, and each of which gives a different random distribution of outcomes, initially unknown to the respondent. In this paper, we create a new version of the two-armed bandit: we map each arm to a soda machine. For example, one machine gives StoreSoda with a higher probability, say 70% and NovelSoda with 30%, while the other machine gives NovelSoda with 70% probability and StoreSoda with 30%. The respondent is asked to figure out which machine more often provides their favored beverage and to select that option more often. Respondents are expected to maximize their total pleasure of outcomes (or total experienced utility or “total utility” (Kahneman 2000)) over trials. They may also estimate the outcome distribution of each option by learning from previous trials and predicting the future pleasure (or “predicted utility” (Kahneman 2000)) of outcomes from each option.
To maximize the total experienced utility, each respondent needs to figure out the predicted utility of each machine as soon as possible during the trials (e.g. figure out which machine is more likely to give the beverage they want) and exploit that option. To do this, the respondent should initially explore all choices, which may decrease the total experienced utility. This is a very well known characteristic of decision-making tasks with uncertain outcomes: the trade-off between “exploration” (i.e., seeking new information, trying to better estimate the predicted utility of each option by randomly selecting different options) and “exploitation” (i.e., seeking to make the next moment experience better under current information; that is, trying to maximize the next moment experienced utility by selecting the current-predicted best option). Thus, to achieve the goal of the tasks, respondents tend to trade-off between exploration and exploitation: they initially select machines randomly, but later are likely to stick to the machine giving the product they prefer.
The use of the two-armed bandit addresses the principle that participants try each product many times. Even if they stick with the machine more likely to give their favored product, the randomness in each “arm” (each machine) prevents their anchoring to that product, e.g., if they like StoreSoda, and favor the machine more likely to give it,

DRAFT: PLEASE DO NOT CIRCULATE WITHOUT PERMISSION 5
they still occasionally have to try another sip of NovelSoda. Thus, we avoid the problem made famous when Coca-Cola invented “New Coke” in 1985, and they conducted one-sip blind tests for focus groups. The respondents were asked to self-report their preference between “Classic Coke” and “New Coke” after one sip of each beverage. Interestingly, more people actually preferred “New Coke” to “Classic Coke”, even though it turned out that the new one flopped in the marketplace. One of the important reasons why one-sip blind tests failed to predict the real marketplace outcome may be that people can prefer a sweeter beverage on their first sip, although they do not like the beverage over repeated sips (Gladwell 2005). People may sometimes require multiple experiences of a product before they actually notice its qualities, for better or worse. Our experiments reveal support for this with more positive responses in early trials for both products and stronger discrimination between products emerging after multiple trials.
We propose that the bandit tasks and other computer-presented tasks involving unknown outcome distributions may help comfortably reveal intuitive feelings about choice preferences, addressing the third principle above. In particular, since respondents initially do not know about the underlying outcome distribution of each option, they tend to first try out the options without any stigma attached to rejecting a product. After several trials, respondents may implicitly or explicitly know and predict which option is more likely to provide the product they prefer. Since the respondents’ goal is to figure out which machine most often provides the outcome enjoyed most and select that machine, they tend to select the machine more likely to dispense their favored beverage. Moreoever, we expect there to be less social resistance showing negative emotions to a machine (say, if it gives the unwanted beverage) than showing negativity to a person.
The method we propose, importantly, enables us to get not only at “liking” but also at “wanting” – a kind of motivation that is believed to be very significant in determining marketplace success. For example, from the respondent’s anticipatory arousal or skin conductance measured before making a selection, we can look for signs of increased anticipation. While this arousal does not usually indicate positive or negative valence, we can infer the valence (positive or negative) of their wanting from their affective response to the obtained outcome. For example, consider a person who, after several trials, favors StoreSoda, wants StoreSoda, and selects the machine more likely to give that choice. When the machine provides StoreSoda and we see a facial expression of satisfaction, then we can infer that there was positive affective wanting for that beverage. Similarly, when the machine provides the unwanted outcome and elicits an expression of disappointment, we can infer that there was negative affective wanting. We found participants to be quite expressive at showing satisfaction or disappointment during this “outcome” measurement portion of the bandit task, suggesting that this novel measure of affective wanting may become useful in practice.
Respondents’ affective liking or disliking for different outcomes can be measured during their actual evaluations of the outcomes. When a person sips the outcome sample beverage and likes the taste, he or she is likely to show positive facial expressions or positive affective liking (e.g., smiling). Otherwise, the person is likely to show negative facial expressions or negative affective liking (e.g., frowning).
We define multiple states a participant experiences for each trial or selection of a machine. Respondents experience an anticipatory state before and while choosing a machine, an outcome state right after obtaining an outcome, and an evaluation (or

DRAFT: PLEASE DO NOT CIRCULATE WITHOUT PERMISSION 6
consummatory) state while trying and evaluating the obtained outcome. Figure 1 shows the sequence for each trial. In each trial we typically observe people’s anticipation (e.g., autonomic arousal) before selecting an option, immediate satisfaction/disappointment from facial expressions with the obtained outcome, and liking/disliking from facial expressions while evaluating the outcome. Importantly we distinguish the “affective wanting” responses (or outcome facial valence) from the “affective liking” responses (or evaluation facial valence). The former is a response to the machine delivering what the person did or did not want, before sipping the beverage; the latter is a response to the sip.
Figure 1. The sequence for each trial Market researchers have commonly experienced that people said they loved the
product, but then it flopped in the marketplace. While respondents may often be trying to please and report more positive/hopeful feelings than are genuinely elicited by the product (especially given the nice pay, modern facilities, and kind treatment toward them for participating in most studies), we do not think participants intend to mislead marketers. Rather, we assume respondents want to communicate their true feelings about products and want to see better products hit the market. Experiments that don’t pay careful attention to principles for good affective communication may interfere with the customer’s communication needs: not giving customers an adequate number of trials with the product to get to know how they feel about the product, assuming they know how to map their momentary feeling to an integer value, making it socially awkward to express those feelings, etc. Figure (2?) shows an example from our study where we show facial valence (positive, neutral or negative) for a customer for 30 sips, each of which was given by the machine selected on the 30 trials. In this example we see the customer took about five sips before we saw one of the products start to generate negative facial expressions. In this case, interestingly, it took the person over 20 trials before their self-report indicated disliking.

DRAFT: PLEASE DO NOT CIRCULATE WITHOUT PERMISSION 7
With these challenging realities in mind we constructed our framework to make it easier, comfortable and more reliable to elicit and measure respondents’ intuitive feelings about products: the multiple-trial random-outcome protocol may easily and naturally elicit respondents’ intuitive feelings, and the multi-modal measures can unveil more about customer preference and increase the reliability of our marketplace prediction. A big part of our framework is not just reading affective information: we also work to enable a situation where participants are genuinely comfortable expressing their true feelings, negative or positive, since culturally people have often been taught that negative expressions to people are impolite. Our approach is also human-centered: we do not want to read people’s feeling without their knowing; instead we help people reliably communicate how they feel when they are willing (paid) to do so but do not know how to accurately put their moment-by-moment changing feelings into numbers. As far as we know, our framework is the first to systematically integrate people’s anticipatory feeling, affective wanting and liking, behavioral wanting and liking and self-reported cognitive wanting and liking during decision-making and evaluation processes (See Figure 2), describing their preferences in terms of multi-modal measures and using all of this information to predict marketplace outcomes of new products or services.
Figure 2. Affective, Behavioral, Cognitive Measures

DRAFT: PLEASE DO NOT CIRCULATE WITHOUT PERMISSION 8
Conceptual Background and Hypotheses Our conceptual framework draws from important findings in the human decision-
making literature from fields such as psychology, behavioral economics and affective neuroscience. We briefly highlight common or nearly similar concepts from these fields.
Wanting and Liking Motivational aspects or “wanting” should be distinguished from hedonic and
sensory aspects or “liking” in human decision-making and learning processes (Berridge 1999; Berridge and Aldridge 2009). This means that we need to distinguish different meanings of the term “utility”, which has been used to represent multiple concepts related to wanting and to liking in the history of psychology and economics. Kahneman distinguished “experienced utility” from “decision utility” (Kahneman 2000; Kahneman et al. 1997) where the former concept relates to liking and the latter to wanting. Experienced utility is associated with sensory and hedonic properties (i.e. pleasure or pain, as Bentham’s concept of utility) of the outcome of a choice, and arises from evaluation of our experience of the outcome (Kahneman 2000). Thus, this is about how much people like (or dislike) the outcome of their choice, e.g. the sip of the beverage. Decision utility is associated with motivational properties of the future expected outcome of a choice, and relates to the degree to which a choice is selected, e.g. how much the person selects one soda machine vs. the other. In modern economics, decision utility is inferred from observed choices and in turn used to explain choices. According to Kahneman, experienced utility is measurable and empirically distinct from decision utility: this may explain why we often fail to choose the option that maximizes our hedonic experience or liking (Hsee and Hastie 2006; Kahneman et al. 1997; Loewenstein and Lerner 2003; Slovic et al. 2004).
Cognitive Wanting and Affective Wanting Multiple motivational systems systematically influence human decision behavior,
including both cognitive (expected, deliberative, goal-directed, reflective, conscious, controlled) and affective (anticipatory, intuitive, habitual, reflexive, unconscious, automatic) processes (Balleine and Dickinson 1998; Bechara et al. 1997; Berridge 2004; Daw et al. 2005; Dayan et al. 2006; Kahneman 2003; Loewenstein and Lerner 2003; Loewenstein and O'Donoghue 2004; Satpute and Lieberman 2006). Note that the terms “cognitive” and “affective” in our framework are generally used to indicate the properties inside the parentheses, even though these components may not always be perfectly isolated in practice. According to Berridge and Robinson (2003), wanting can be dissociated into the unconscious core process of incentive salience ‘wanting’ (which is simply called affective wanting in this paper) and the conscious subjective awareness of cognitive wanting (which is simply called cognitive wanting in this paper). The two differ both psychologically and in their brain substrates. Incentive salience ‘wanting’ is a cue-triggered unconscious motivation mediated by mesolimbic dopamine systems, while cognitive wanting is an explicit cognitive expectation about future experience mediated by cortical systems.
Bechara and Damasio (2005)’s concept of anticipatory somatic marker state in decision-making situations under uncertainty (e.g., multi-armed bandit tasks) may be

DRAFT: PLEASE DO NOT CIRCULATE WITHOUT PERMISSION 9
associated with affective wanting. While there are minor differences between the concepts associated with affective motivation (e.g., Berridge and Robinson (2003)’s concept of incentive salience ‘wanting’, Bechara and Damasio (2005)’s concept of anticipatory somatic marker state, and Loewenstein and Lerner (2003)’s concept of anticipatory affect), we group them as “affective wanting” for the purpose of the computational framework in this paper.
Cognitive Liking and Affective Liking Liking can be dissociated into the unconscious core process of ‘liking’ (called
affective liking in this paper) and the conscious subjective awareness of cognitive liking (called cognitive liking in this paper): implicit core ‘liking’ is an unconscious objective pleasure, while cognitive liking is conscious subjective pleasure (Berridge and Robinson 2003). According to Berridge and Robinson (2003), the neural substrates of implicit core ‘liking’ are separate from those of incentive salience ‘wanting’ in the human brain. Note that the dissociation of incentive salience ‘wanting’ and implicit ‘liking’ helps with understanding addiction, which may be viewed as the activation of cue-triggered ‘wanting’ without later implicit ‘liking’ (Berridge 2003).
Measuring Cognitive Liking Value and Cognitive Wanting Value Liking and wanting are traditionally measured by self-report (questionnaire). Kahneman (2000) suggested measuring “instant utility” (a measure of liking) by asking a person to self-report immediate liking every time window or trial. We call such a self-report measure the cognitive liking value. We define the average cognitive liking value for each product as the average of the cognitive liking values over all trials where that product was experienced. To measure the cognitive wanting value for each product, we ask the participant to self-report the answers to two questions, “Overall how much do you like or dislike Machine 1 (Machine 2)?”. On each trial we ask the respondent to answer these for both machines before he or she selects one of the two. Then, we approximate the cognitive wanting of each product by the linear combination of the two responses using as weights the estimated observed probability of each option to have provided the product as an outcome. This is an indirect measure and as such we think it may be less influenced by cognitions or social pressure of “what I’m supposed to want” than an alternative measure of asking the person directly which beverage they most want, although it would be interesting to compare this direct question in future work.
Measuring Affective Liking Value and Affective Wanting Value Most attempts to measure people’s affective liking and wanting have used self-report questionnaires; however, in our framework, self-reported feelings are cognitive measures, as in the cognitive liking and cognitive wanting above. We measure affective liking value by recording facial valences during and immediately after evaluating a product (this is the evaluation facial valence described above). We average this value over trials to obtain the average affective liking value of each product (or the average of the evaluation facial valences over all trials of that product). When respondents get the option they want, they tend to show positive facial valence (or satisfaction). When they obtain the undesired outcome, they tend to show negative facial valence (or disappointment). This positive or negative facial response

DRAFT: PLEASE DO NOT CIRCULATE WITHOUT PERMISSION 10
(satisfaction or disappointment) immediately after obtaining an outcome is called the outcome facial valence. The facial expression in this outcome state (i.e., immediately after the machine tells them which soda they will get to sip) provides information on the respondents’ wanting in that trial; thus, we employ outcome facial valence to infer “affective wanting”. Our measurements of outcome facial valence will not be perfectly correlated with Berridge’s incentive salience ‘wanting’, because human facial expressions can be influenced by many things - including cultural, social and cognitive influences. Thus, outcome facial valence might or might not reflect a person’s true ‘wanting’. However, we believe that the outcome facial valence in a natural and comfortable situation of decision making under uncertainty would be more likely to be reflexive and a very good indicator of incentive salience ‘wanting’ than is direct self-report of wanting. Also, note that, the purpose of this paper is not to suggest a valid and robust method for measuring Berridge’s incentive salience ‘wanting’, even though it is true that our framework has been inspired in part by his terminologies and findings. For practical explanatory purposes in this framework we use the adjective “affective” for all facial-valence measured data, and the adjective “cognitive” for all self-reported data; however, this is not a claim that these processes are perfectly separate in human brain or body . For a given trial, we expect that a person’s positive or negative experience will be reflected more genuinely, and we can be more confident of its veracity, when the facial outcome and facial evaluation are in agreement, e.g., both positive or both negative. We also expect the affective wanting and affective liking facial expressions to both provide useful information, and we expect sometimes that only one will be shown without the other. We thus state our first hypothesis:
H1: A single trial contains either no facial valences, just an outcome facial valence, just an evaluation facial valence, or both outcome and evaluation facial valences, so that measuring both gives more information over all the trials. When the two facial valences occur in the same trial, they will be congruent (both positive or both negative).
Cognitive Value (Self-Report Value) and Affective Value (Facial Valence) We define cognitive value or the self-report (SR) value on each trial as the linear
combination of cognitive wanting and cognitive liking during the trial. In like manner, we define affective value (or facial valence (FV)) on each trial as the linear combination of affective wanting (outcome FV) and affective liking (evaluation FV) during the trial. In the study here we use equal weights for both linear combinations, although there are times when these might need to be unequally weighted. Regarding the cognitive and affective values, we make the following hypotheses: H2: Cognitive value (or SR) and affective value (or FV) do not have high correlation. That is, affective value carries different information from cognitive value. Specifically we expect people to be more positive in the SR measure than in the FV measure. H3: In terms of discriminability (d' or sensitivity index: a statistic to evaluate the ease of a measure (SR or FV) in distinguishing the most favored beverage from the least favored beverage, also known as effect size), d'SR (d' from SR) and d'FV (d' from FV) will be
DRAFT: PLEASE DO NOT CIRCULATE WITHOUT PERMISSION 11
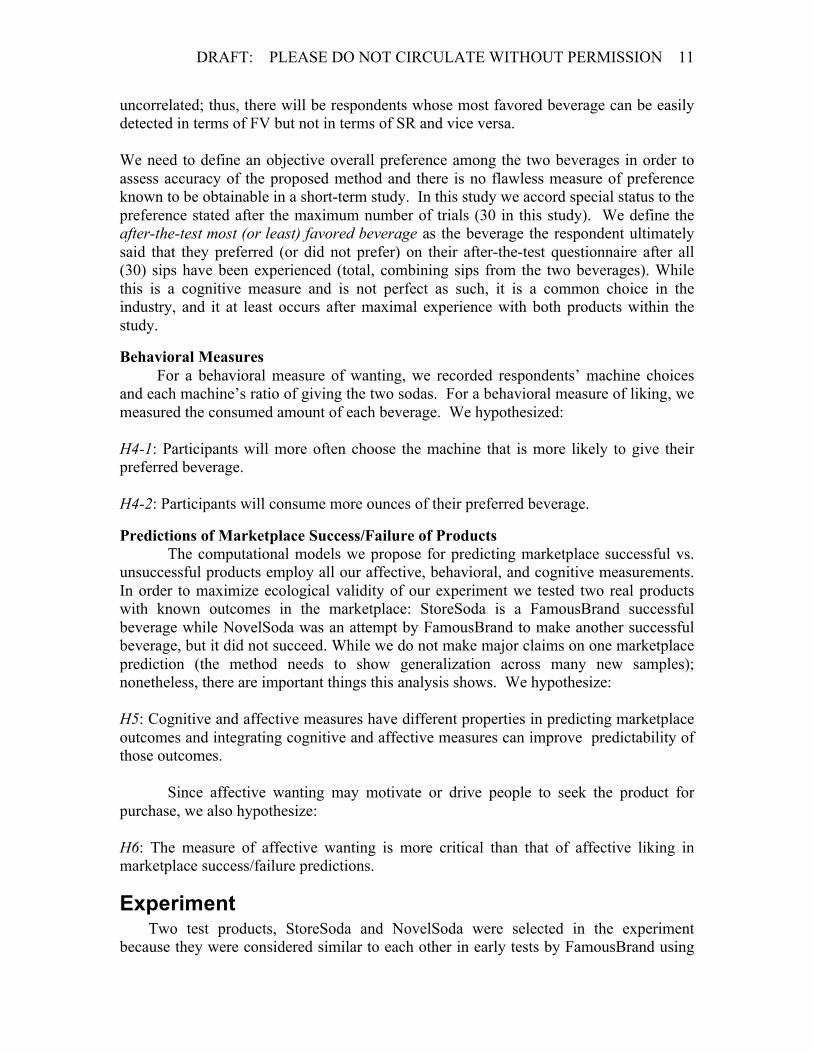
uncorrelated; thus, there will be respondents whose most favored beverage can be easily detected in terms of FV but not in terms of SR and vice versa. We need to define an objective overall preference among the two beverages in order to assess accuracy of the proposed method and there is no flawless measure of preference known to be obtainable in a short-term study. In this study we accord special status to the preference stated after the maximum number of trials (30 in this study). We define the after-the-test most (or least) favored beverage as the beverage the respondent ultimately said that they preferred (or did not prefer) on their after-the-test questionnaire after all (30) sips have been experienced (total, combining sips from the two beverages). While this is a cognitive measure and is not perfect as such, it is a common choice in the industry, and it at least occurs after maximal experience with both products within the study.
Behavioral Measures For a behavioral measure of wanting, we recorded respondents’ machine choices and each machine’s ratio of giving the two sodas. For a behavioral measure of liking, we measured the consumed amount of each beverage. We hypothesized: H4-1: Participants will more often choose the machine that is more likely to give their preferred beverage. H4-2: Participants will consume more ounces of their preferred beverage.
Predictions of Marketplace Success/Failure of Products The computational models we propose for predicting marketplace successful vs.
unsuccessful products employ all our affective, behavioral, and cognitive measurements. In order to maximize ecological validity of our experiment we tested two real products with known outcomes in the marketplace: StoreSoda is a FamousBrand successful beverage while NovelSoda was an attempt by FamousBrand to make another successful beverage, but it did not succeed. While we do not make major claims on one marketplace prediction (the method needs to show generalization across many new samples); nonetheless, there are important things this analysis shows. We hypothesize: H5: Cognitive and affective measures have different properties in predicting marketplace outcomes and integrating cognitive and affective measures can improve predictability of those outcomes.
Since affective wanting may motivate or drive people to seek the product for purchase, we also hypothesize: H6: The measure of affective wanting is more critical than that of affective liking in marketplace success/failure predictions.
Experiment Two test products, StoreSoda and NovelSoda were selected in the experiment
because they were considered similar to each other in early tests by FamousBrand using

DRAFT: PLEASE DO NOT CIRCULATE WITHOUT PERMISSION 12
cognitive measures, and yet they had very different marketplace outcomes: StoreSoda performed in the top 25% of the market, while NovelSoda performed in the lower 40%. Our experiment presented the beverages in the same way (same controlled temperature, glasses, quantity, etc) and in the same test facility that FamousBrand usually conducts their tests. The tests took place on summer days with warm, sunny weather in a comfortable modern air-conditioned facility.
Methods Respondents. Thirty-nine respondents aged 18-49 years (17 men, 22 women) participated in this experiment. Respondents were recruited by a standard customer focus group / product evaluation service provider to come into the provider's test facility. Each respondent was seated at a table, hooked up with sensors, asked to fill out a consent form, given a chance to ask questions, and then was asked to turn attention to a computer on the table. At that point they were left alone with the computer running the experiment. Sensors. The computer in front of the respondent includes a tiny built-in webcam taking video of his or her face. The respondent was asked to wear a skin conductance sensor (40 Hz sampling rate) which transmitted the measured skin conductance data to the computer through Bluetooth wireless technology for recording (Strauss et al. 2005). Two Ag/AgCl electrodes of the sensor were placed on opposite sides of the palm of the non-dominant hand. Facial expressions and skin conductance were measured during the entire task. Tasks. The respondent was asked to follow the instructions displayed on the computer:
On your computer, there are two vending machines, Machine 1 (left side) and Machine 2 (right side). Each vending machine will direct you to take a sip of flavored beverage, either Beverage 1 (labeled 135) or Beverage 2 (labeled 246). One vending machine may be or may not be more likely to provide you with more opportunity to taste Beverage 1 and the other with Beverage 2.
In addition to tasting beverages and answering questions, your goal will be to figure out which machine more often directs you to drink the beverage you enjoy more and select that machine more often.
You will be asked to make multiple machine selections and please choose freely between the two vending machines.
This select a machine – take a sip - and answer questions process lasts 30 trials and takes approximately 30 minutes, at which point the experiment is concluded.
Figure 3 shows the general setup in the experiment. Straws were used in order to avoid blocking a respondent’s facial expressions in front of the camera. After analyzing the data from this experiment, we found most expressions occurred right after the sip and not during it, so the straw is probably not needed in future versions.

DRAFT: PLEASE DO NOT CIRCULATE WITHOUT PERMISSION 13
Figure 3. Experiment Setup Procedure using randomized machines. Each respondent had 30 trials: Each trial (composed of the steps in Figure 1) began with the respondent selecting one of the two machines (i.e., selecting one of two options) on the computer screen. The machine indicated an outcome beverage (presenting 135 or 246). Then, the respondent sipped the outcome beverage from the side of the selected machine, and self-reported his or her cognitive liking value (answering the question “How much do you like or dislike your current sip?”).
One machine provided StoreSoda 70% of the time and NovelSoda 30% of the time, and the other provided 30% StoreSoda and 70% NovelSoda. Below we refer to Machine S as the machine more likely to provide StoreSoda, and Machine N as the one more likely to provide NovelSoda. For half of the respondents Machine S was put on the left side and Machine N on the right side; the order was swapped for the other half of respondents. In this study, respondents were not given any product names but were exposed to the famous brand logo and given code labels (135 or 246) that were randomly assigned to each beverage before the experiment.
Affective Measures (Facial Valence Analysis)
Due to unexpected MacBook video recording errors for five participants, we had a total of 34 valid recordings for the facial video data analysis. We hired two human facial-affect recognition coders who scored above average on the Reading-the-Minds-in-the-Eyes revised test, and let them label the outcome FV and evaluation FV for each trial. We asked each coder to label the outcome and evaluation FVs into positive (1) / neutral (0) / negative (-1) responses. Smiling, nodding, looking pleased, satisfied, or licking the lips were rated positive, while frowning, shaking the head, showing disgust, or otherwise looking displeased or disappointed were rated negative. The evaluation of the two human coders’ agreement is described below.
We divided respondents into two groups: the “FV expressive group” and the “FV non-expressive group”. The FV expressive group is defined to be the respondents who showed outcome or evaluation FVs at least four times over all 30 trials. The respondents in the FV non-expressive group showed no facial expressions (or very few indistinguishable micro-expressions) during the task. Half of the 34 respondents for whom we have video belong to the FV expressive group. For this group (n=17), the two human coders had “moderate agreement” in terms of Cohen’s Kappa: Observed agreement = 70.9% (718 out of 1020 = 17 respondents × 30 trials × 2 FVs), Cohen's
DRAFT: PLEASE DO NOT CIRCULATE WITHOUT PERMISSION 14
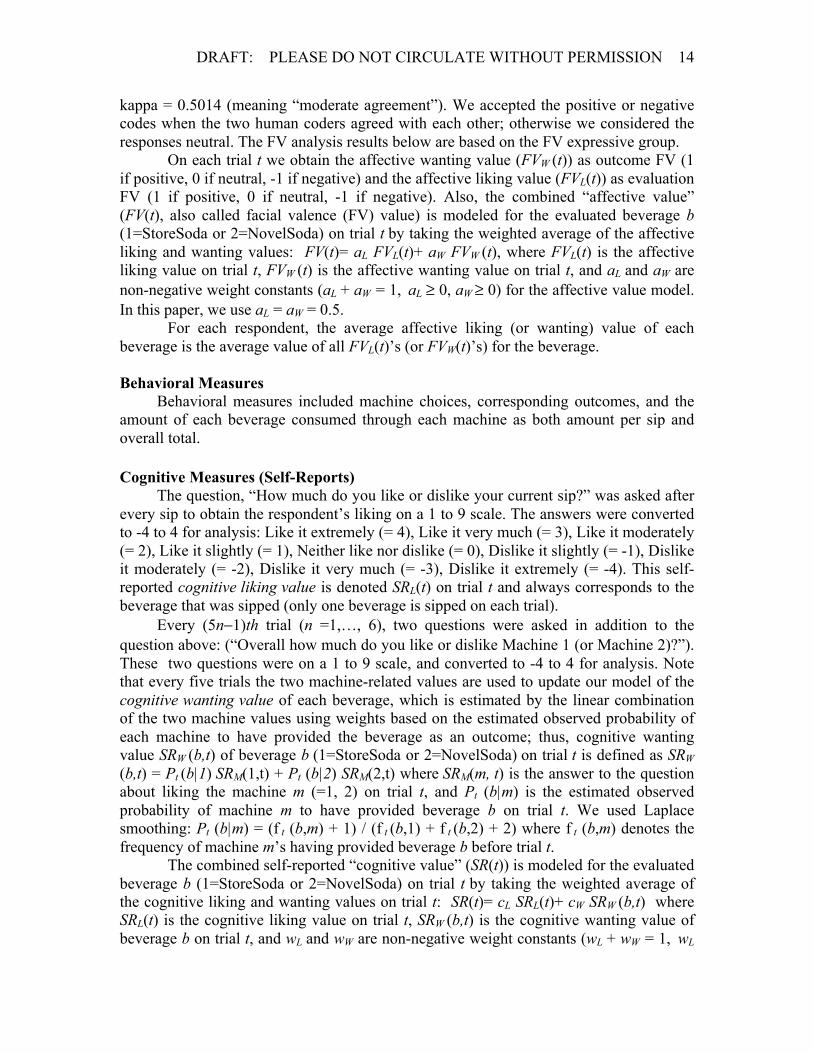
kappa = 0.5014 (meaning “moderate agreement”). We accepted the positive or negative codes when the two human coders agreed with each other; otherwise we considered the responses neutral. The FV analysis results below are based on the FV expressive group.
On each trial t we obtain the affective wanting value (FVW (t)) as outcome FV (1 if positive, 0 if neutral, -1 if negative) and the affective liking value (FVL(t)) as evaluation FV (1 if positive, 0 if neutral, -1 if negative). Also, the combined “affective value” (FV(t), also called facial valence (FV) value) is modeled for the evaluated beverage b (1=StoreSoda or 2=NovelSoda) on trial t by taking the weighted average of the affective liking and wanting values: FV(t)= aL FVL(t)+ aW FVW (t), where FVL(t) is the affective liking value on trial t, FVW (t) is the affective wanting value on trial t, and aL and aW are non-negative weight constants (aL + aW = 1, aL ≥ 0, aW ≥ 0) for the affective value model. In this paper, we use aL = aW = 0.5.
For each respondent, the average affective liking (or wanting) value of each beverage is the average value of all FVL(t)’s (or FVW(t)’s) for the beverage. Behavioral Measures Behavioral measures included machine choices, corresponding outcomes, and the amount of each beverage consumed through each machine as both amount per sip and overall total. Cognitive Measures (Self-Reports) The question, “How much do you like or dislike your current sip?” was asked after every sip to obtain the respondent’s liking on a 1 to 9 scale. The answers were converted to -4 to 4 for analysis: Like it extremely (= 4), Like it very much (= 3), Like it moderately (= 2), Like it slightly (= 1), Neither like nor dislike (= 0), Dislike it slightly (= -1), Dislike it moderately (= -2), Dislike it very much (= -3), Dislike it extremely (= -4). This self-reported cognitive liking value is denoted SRL(t) on trial t and always corresponds to the beverage that was sipped (only one beverage is sipped on each trial). Every (5n−1)th trial (n =1,…, 6), two questions were asked in addition to the question above: (“Overall how much do you like or dislike Machine 1 (or Machine 2)?”). These two questions were on a 1 to 9 scale, and converted to -4 to 4 for analysis. Note that every five trials the two machine-related values are used to update our model of the cognitive wanting value of each beverage, which is estimated by the linear combination of the two machine values using weights based on the estimated observed probability of each machine to have provided the beverage as an outcome; thus, cognitive wanting value SRW (b,t) of beverage b (1=StoreSoda or 2=NovelSoda) on trial t is defined as SRW (b,t) = Pt (b|1) SRM(1,t) + Pt (b|2) SRM(2,t) where SRM(m, t) is the answer to the question about liking the machine m (=1, 2) on trial t, and Pt (b|m) is the estimated observed probability of machine m to have provided beverage b on trial t. We used Laplace smoothing: Pt (b|m) = (f t (b,m) + 1) / (f t (b,1) + f t (b,2) + 2) where f t (b,m) denotes the frequency of machine m’s having provided beverage b before trial t.
The combined self-reported “cognitive value” (SR(t)) is modeled for the evaluated beverage b (1=StoreSoda or 2=NovelSoda) on trial t by taking the weighted average of the cognitive liking and wanting values on trial t: SR(t)= cL SRL(t)+ cW SRW (b,t) where SRL(t) is the cognitive liking value on trial t, SRW (b,t) is the cognitive wanting value of beverage b on trial t, and wL and wW are non-negative weight constants (wL + wW = 1, wL

DRAFT: PLEASE DO NOT CIRCULATE WITHOUT PERMISSION 15
≥ 0, wW ≥ 0) for the cognitive value model. We used wL = wW = 0.5, and updated SRW every five trials. In addition, every (5n)th trial (n =1,…, 6), two additional questions were asked, in addition to the sip-liking question, as part of FamousBrand’s standard methodology to gauge the respondent’s expected comparison (“Would you say the beverage you just tasted was …”, answered on a 1 to 5 scale (1=Not at all as good as you expected, 5=Much better than you expected)) and purchase intent (“If the beverage you just tasted was available where you usually shop, which of the following best describes how likely you would be to buy it?”, answered on a 1 to 5 scale (1=Definitely would not buy it, 5=Definitely would buy it)). Finally, respondents indicated their “after-the-test” beverage preference on the questionnaire given after all trials were completed. Results Affective measures Affective liking and affective wanting show differences
Table 1 shows how many times outcome FV and evaluation FV happened together or alone in all 30 trials for the expressive group (n=17). While people were more likely to show a FV after sipping, about 24% of the total trials included outcome FVs, those positive or negative facial expressions that occur after the machine indicates which beverage they will have to sip, a new measure we propose as an indication of wanting.
Count Outcome FV and Evaluation FV together 44 (8.6%) Outcome FV without Evaluation FV 78 (15.3%) Evaluation FV without Outcome FV 110 (21.6%) No FVs 278 (54.5%) Total Trials (17 people x 30 trials) 510 (100%)
Table 1: Counts of Outcome FVs and Evaluation FVs in the facially expressive group of participants (n=17). We checked individual trials where expressions were made for both wanting and liking within the same trial (44 trials total met this criteria, while in 188 trials people showed only one of evaluation FV or outcome FV). In forty-three of the forty-four trials the outcome and evaluation FV’s were the same, supporting Hypothesis H1.
Following Berridge’s dissociation between implicit ‘wanting’ and implicit ‘liking’, we expect that the two affective measures will show some level of independence across trials. Also, note that the sensor measurements of affective wanting and liking have no measurement dependence between each other. We thus examined, and indeed found that there was a significant difference across beverages between the average affective liking (across all trials) and the average affective wanting (across all trials) of each beverage over the facially expressive group, (M= -0.12 vs. -0.02; T(33) = 2.08, p < .05). While people were usually consistent within the moment of a single trial, we also found the hypothesized relative independence of these measures across the whole test (30

DRAFT: PLEASE DO NOT CIRCULATE WITHOUT PERMISSION 16
trials). The affective liking (evaluation FV) measure had significantly more negative responses than positive (M= 6.12 vs 2.94; T(16) = 2.46, p < .05), and showed significantly more negative responses than the affective wanting (outcome FV) measure (M= 6.12 vs. 3.76 vs. 6.12; T(16) = 1.85, p < .05). Asymmetry in facial valence (FV) shown between beverages
Overall, respondents showed significantly more negative FVs than positive FVs for NovelSoda (neg=77 vs. pos=40) than for StoreSoda (neg=60 vs. pos=54) (G(1)=4.17, p < .05). Moreover, there was an interesting asymmetry: none of StoreSoda favorers (0 respondents out of 7) showed any positive expression while tasting NovelSoda, while nearly half of the NovelSoda favorers (4 respondents out of 10) showed positive expressions at least once while tasting StoreSoda (G(1)=5.09, p < .05). The complete lack of any positive expressions in the StoreSoda group may be a red flag not visible from looking at the SR data.
Difference between cognitive value (SR) and affective value (FV) We examined whether affective value (facial valence (FV)) and cognitive value
(self-report (SR)) reveal the same or different information. In each trial a respondent showed one of nine different SR and FV combinations (Table 2 - positive/neutral/negative SR crossed with positive/neutral/negative FV). Responses were classified into negative (-4 ~ -1), neutral (0) and positive (1 ~ 4) in this analysis.
Table 2 shows the number of times each combination happened during the experiments for the 17 respondents in the facially expressive group. FV SR
Positive FV Neutral FV Negative FV Sum
Positive SR 92 216 58 366 Neutral SR 0 2 0 2 Negative SR 2 61 79 142 Sum 94 279 137 510 Table 2: Counts of cognitive (SR) and affective (FV) value combinations over the facially expressive group (17 respondents).
People showed more positive SRs (366 times out of 510) than negative SRs (142 times out of 510). The majority (13 out of 17 respondents) showed negative FVs even when they rated positive SRs (M=4.46, SD=2.93, total 58 times). When people showed neutral FVs, they were more likely to give positive SRs (216 times) than negative SRs (61 times). Overall, people showed more negative FVs (137 times out of 510) than positive FVs (94 times out of 510).
Cognitive values (SR) and affective values (FV) were correlated (r = 0.44, p<.001), but not highly, suggesting that while they agreed in the same general direction, they also carried different information. This supports Hypothesis H2. In particular, the face tended to show more negative responses while self-report showed more positive (in the group that was facially expressive), so the two measures yield different information.

DRAFT: PLEASE DO NOT CIRCULATE WITHOUT PERMISSION 17
SR and FV responses for the most/least favored beverages
Of the 17 respondents in the facially expressive group, 7 favored StoreSoda and 10 favored NovelSoda in terms of their “after-the-test” (after 30 trials) preference. We wish to objectively evaluate how the proposed measures predict this after-the-test preference for each participant.
We computed the true positive rate (i.e., sensitivity) and the true negative rate (i.e., specificity) of the 2×2 contingency table of response (positive, negative) × beverage (after-the-test favored, after-the-test disfavored) in terms of each measure (SR or FV) for each person in the facially expressive group.
After-the-test Most favored beverage
After-the-test Least favored beverage
Positive response TP (true positive) FP (false positive) Negative response FN (false negative) TN (true negative)
Here, TP (or FP) means the number of trials where the person showed positive responses for his or her after-the-test most (or least) favored beverage. Also, FN (or TN) means the number of trials where the person showed negative responses for his or her after-the-test most (or least) favored beverage. The TP rate (or sensitivity) is defined as TP / (TP + FN), and the TN rate (or specificity) as TN / (FP + TN).
Comparing the TP rates for each person in the facially expressive group, we found that the TP rate of the SR measure was significantly larger than that of the FV measure (M=0.93 vs. 0.67; T(16)=2.56, p <.05). Comparing the TN rates, we found that the TN rate of the FV measure was significantly larger than that of the SR measure (M=0.51 vs. 0.88; T(16)= -3.76, p <.01). These two tendencies are explained by the fact that the SR measure tended to be positive most of the time, leading to greater positive-to-negative ratios (TP / FN and FP / TN) for both beverages for each person, compared to the FV measure.
Pooling responses over the facially expressive group: TP = 244, FN = 14, FP = 122, TN = 128 (in the SR measure), while TP = 75, FN = 22, FP = 19, TN = 115 (in the FV measure). Thus, the TP rate of the SR measure was greater than that of the FV measure (0.95 vs. 0.77), again reflecting the huge number of positive self-reports, but the TN rate was much greater for the FV measure (0.51 vs. 0.86). The positive-to-negative ratios were: TP / FN = 17.43 (SR) vs. 3.41 (FV) for the favored beverage, and FP / TN = 0.95 (SR) vs. 0.17 (FV) for the disfavored beverage. Thus, using facial valences was better than self-report at predicting a person’s after-the-test least-favored beverage. Discriminability of SR and FV measures for the most/least favored beverages Often, two products are very similar and peoples’ ratings do not differ significantly, or a company has to recruit huge groups of participants before a statistically significant difference is obtained. A better measure will, for a fixed number of participants, maximize the discriminability “d-prime” (d' ): d' = |Z(hit rate) – Z(false alarm rate)| where Z(p), p ∈[0,1] is the inverse of the standard cumulative normal distribution, hit rate = sensitivity, and false alarm rate = 1 – specificity. As the discriminability (i.e., between the favored beverage vs. disfavored beverage) becomes larger, it is easier to discriminate

DRAFT: PLEASE DO NOT CIRCULATE WITHOUT PERMISSION 18
the two groups. Thus, a measure (SR or FV) with greater d' is more conducive to discriminating differences between two beverages, even if they are similar sweet sodas, as in the real-world case we studied.
In the discriminability analysis below, we computed the hit rate and the false alarm rate using slightly modified definitions: hit rate ≡ (TP + ε) / (TP + FN +2ε), false alarm rate ≡ (FP + ε) / (FP + TN + 2ε) where ε is a positive constant less than or equal to 1 (we use ε = 0.1). We use ε-added versions of elements (TP, FN, FP, TN) to consider the frequency of positive or negative responses in some completely biased cases: for example, in the case where there are 0 positive, 1 negative response from the favored beverage (TP=0, FN=1) and 0 positive, 5 negative responses from the disfavored beverage (FP=0, TN=5), the hit rate and the false alarm rate in the original definitions are all zeros; thus we have d' = 0. In the new definitions with ε = 0.1, however, the hit rate = (0+0.1)/(0+1+0.2) = 0.083 and the false alarm rate = (0+0.1)/(0+5+0.2) = 0.019; thus, we have a non-zero d', which makes more sense given the higher negative frequency from the disfavored beverage (TN=5) than from the favored beverage (FN=1) when both TP = FP = 0 (or no positive responses from both beverages). Similarly, when there are no negative responses from both beverages, we will have a non-zero d'.
It is worthwhile to note that d'SR (the discriminability using self-reports) of the facially non-expressive group (N=17) is significantly smaller than that of the facially expressive group (N=17) (M = 1.14 vs. 2.18; T(32)=-1.86, p <.05). In terms of the absolute difference between the average cognitive values of two beverages (|DiffSR|), the facially non-expressive group showed a significantly smaller |DiffSR| than the facially expressive group (M = 0.78 vs. 1.62; T(32)=-2.72, p <.01). Moreover, within the facially non-expressive group (17 persons), there were two clusters: 10 respondents had very small d'SR (M=0.12, SD=0.06) and |DiffSR| (M=0.44, SD=0.21), and the other 7 respondents had higher d'SR (M=2.60, SD=0.75) and |DiffSR| (M=1.26, SD=0.98). That is, the facially non-expressive group can be decomposed into two classes as follows:
• low d'SR & low d'FV (N =10) : hardly discriminable by FV or by SR • high d'SR & low d'FV (N = 7) : hardly discriminable by FV, but easily by SR Keeping in mind that d'FV (the discriminability of FV) is essentially zero for this
facially non-expressive group, the findings imply that there exists a group of people (10 out of 34 respondents with valid video recordings) whose beverage preference is very difficult to discern in both SR and FV measures.
Comparing the SR and FV discriminability (for the facially expressive n=17), we
evaluated the d' SR-to-FV ratio (= d'SR / d'FV) for each person and observed that people in the facially expressive group could be grouped into three classes according to the d' SR-to-FV ratio: a high d' ratio group (d'SR / d'FV ≥ 1.4), a medium d' ratio group (d'SR / d'FV < 1.4 and d'SR / d'FV > 1/1.4), and a low d' ratio group (d'SR / d'FV ≤ 1/1.4) (N = 3 vs. 7 vs. 7; M = 5.83 vs. 1.01 vs. 0.17; F(16)=26.6, p <.001). For the high d' ratio group, d'SR > d'FV (M = 3.01 vs. 0.53; T(2)=2.61, p <.05); for the medium d' ratio group, d'SR ≈ d'FV (M = 3.62 vs. 3.57; T(6)=0.18, NS); for the low d' ratio group, d'SR < d'FV (M = 0.39 vs. 2.23; T(6)=-3.76, p <.01). That is, three classes for the facially expressive group are:

DRAFT: PLEASE DO NOT CIRCULATE WITHOUT PERMISSION 19
• high d'SR & low d'FV (N = 3): high d' ratio group • high d'SR & high d'FV (N = 7): medium d' ratio group • low d'SR & high d'FV (N = 7): low d' ratio group
Figure 4 shows the relationship between d'SR and d'FV over the facially expressive
(N=17) and facially non-expressive (N=17) groups. Each dot in this figure represents a respondent’s d'SR and d'FV. We also grouped the respondents into five classes explained above: three classes for the facially expressive group and two classes for the facially non-expressive group.
Figure 4: Discriminability of facial valence vs. discriminability of self-report over the facially expressive (N=17) and facially non-expressive (N=17) groups (each dot corresponds to a respondent based on discriminating their after-the-test beverage preference.)
If SR and FV told us the same thing, we would expect that d'SR and d'FV would be highly correlated but in fact d'SR and d'FV are not correlated (r = 0.39, p > .05). This supports Hypothesis H3.
Behavioral measures Machine choices favor NovelSoda
Behaviorally, there was a subtle bias among everyone toward choosing Machine N whether it was on the right or left. Thus, people chose the machine more likely to give the more novel beverage, NovelSoda: (M = 46.4% vs. 53.6% (machine S vs. machine N); T(38) = -1.63, p = .055). Whereas “after-the-test” NovelSoda favorers chose
DRAFT: PLEASE DO NOT CIRCULATE WITHOUT PERMISSION 20
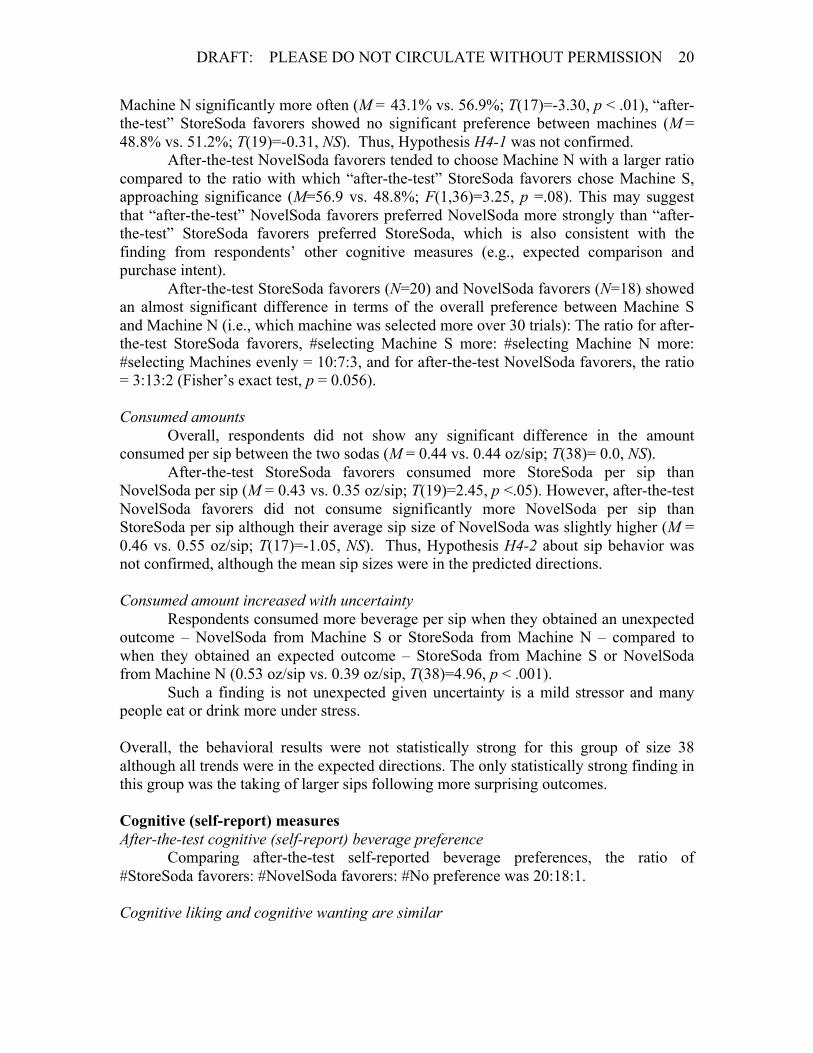
Machine N significantly more often (M = 43.1% vs. 56.9%; T(17)=-3.30, p < .01), “after-the-test” StoreSoda favorers showed no significant preference between machines (M = 48.8% vs. 51.2%; T(19)=-0.31, NS). Thus, Hypothesis H4-1 was not confirmed.
After-the-test NovelSoda favorers tended to choose Machine N with a larger ratio compared to the ratio with which “after-the-test” StoreSoda favorers chose Machine S, approaching significance (M=56.9 vs. 48.8%; F(1,36)=3.25, p =.08). This may suggest that “after-the-test” NovelSoda favorers preferred NovelSoda more strongly than “after-the-test” StoreSoda favorers preferred StoreSoda, which is also consistent with the finding from respondents’ other cognitive measures (e.g., expected comparison and purchase intent).
After-the-test StoreSoda favorers (N=20) and NovelSoda favorers (N=18) showed an almost significant difference in terms of the overall preference between Machine S and Machine N (i.e., which machine was selected more over 30 trials): The ratio for after-the-test StoreSoda favorers, #selecting Machine S more: #selecting Machine N more: #selecting Machines evenly = 10:7:3, and for after-the-test NovelSoda favorers, the ratio = 3:13:2 (Fisher’s exact test, p = 0.056). Consumed amounts
Overall, respondents did not show any significant difference in the amount consumed per sip between the two sodas (M = 0.44 vs. 0.44 oz/sip; T(38)= 0.0, NS).
After-the-test StoreSoda favorers consumed more StoreSoda per sip than NovelSoda per sip (M = 0.43 vs. 0.35 oz/sip; T(19)=2.45, p <.05). However, after-the-test NovelSoda favorers did not consume significantly more NovelSoda per sip than StoreSoda per sip although their average sip size of NovelSoda was slightly higher (M = 0.46 vs. 0.55 oz/sip; T(17)=-1.05, NS). Thus, Hypothesis H4-2 about sip behavior was not confirmed, although the mean sip sizes were in the predicted directions.
Consumed amount increased with uncertainty
Respondents consumed more beverage per sip when they obtained an unexpected outcome – NovelSoda from Machine S or StoreSoda from Machine N – compared to when they obtained an expected outcome – StoreSoda from Machine S or NovelSoda from Machine N (0.53 oz/sip vs. 0.39 oz/sip, T(38)=4.96, p < .001).
Such a finding is not unexpected given uncertainty is a mild stressor and many people eat or drink more under stress. Overall, the behavioral results were not statistically strong for this group of size 38 although all trends were in the expected directions. The only statistically strong finding in this group was the taking of larger sips following more surprising outcomes. Cognitive (self-report) measures After-the-test cognitive (self-report) beverage preference Comparing after-the-test self-reported beverage preferences, the ratio of #StoreSoda favorers: #NovelSoda favorers: #No preference was 20:18:1. Cognitive liking and cognitive wanting are similar

DRAFT: PLEASE DO NOT CIRCULATE WITHOUT PERMISSION 21
There was no significant difference between the average cognitive liking value and the average cognitive wanting value of each beverage over all respondents (M=1.49 vs. 1.26; T(77) = 1.65, NS).
It is not surprising that there were significantly more positive responses than negative ones in terms of cognitive liking (M= 21.7 vs. 3.44; T(38) = 9.33, p < .001), and also in terms of cognitive wanting (M= 22.6 vs. 5.41; T(38) = 8.07, p < .001). Cognitive liking, wanting, and combined values
In terms of the average cognitive liking values, respondents showed no significant difference between StoreSoda and NovelSoda (M=1.54 vs. 1.43; T(38) = 0.25, NS). Also, the average cognitive wanting values did not indicate any significant preference over respondents (M=1.23 vs. 1.31; T(38) = -0.59, NS). In like manner, the average cognitive values (from the combined measure of cognitive liking and wanting) showed no significant difference over respondents (M=1.39 vs. 1.38; T(38) = 0.04, NS), and comparing these values of beverages (i.e., according to which beverage each respondent gave a higher average cognitive value over all the trials), the ratio of #StoreSoda favorers: #NovelSoda favorers: #No preference was 20:19:0.
All of these non-significant differences in the average liking, wanting, and combined values of beverages indicate that the cognitive measures self-reported during trials are not providing fine discrimination for telling which beverage is preferred. First-sip cognitive liking
We obtained no significant difference on the self-report liking values after first sipping StoreSoda and NovelSoda (M=1.79 vs. 1.64; T(38) = 0.47, NS). Confirming the reasoning behind our second principle above, people needed time to be able to articulate their preferences: the first-sip preference ratio showed more persons who did not decide their beverage preference (the ratio of #favorers = 15:15:9), compared to the after-the-test preference ratio (20:18:1).
Expectation comparison and purchase intent
In terms of averaged expectation comparison ratings or purchase intent ratings over the trials, both ratios were 14:17:8 (#StoreSoda favorers: #NovelSoda favorers: #No preference). There was a significant difference in ratios between the after-the-test preference and the expected comparison/purchase intent (Fisher’s exact test, df=2, p < .05). This may suggest that after-the-test NovelSoda favorers, while a slightly smaller group, were even more likely to buy their favored beverage than after-the-test StoreSoda favorers. Experienced marketers have told us that purchase intent and how the product met the customer’s expectation are strong indications of marketplace success; however, in this case these measures came out stronger for NovelSoda, yet NovelSoda did not succeed in the marketplace, surprising FamousBrand, who had worked so hard on developing and testing this product.
SR and FV measures to predict marketplace success/failure of beverages
Now we examine all these measures not for individual preference but for marketplace success. We computed the true positive rate (i.e., sensitivity) and the true negative rate (i.e., specificity) of the 2×2 contingency table of response (positive,

DRAFT: PLEASE DO NOT CIRCULATE WITHOUT PERMISSION 22
negative) × beverage (marketplace successful, marketplace unsuccessful) in terms of each measure (SR or FV) for each person in the facially expressive group. Taking into account that StoreSoda performed in the top 25% and NovelSoda performed in the lower 40% in the market, in this analysis, the marketplace successful/unsuccessful beverage indicates StoreSoda/Summer Mix, respectively. Marketplace Successful
beverage Marketplace Unsuccessful beverage
Positive response TP (true positive) FP (false positive) Negative response FN (false negative) TN (true negative)
Again, we find that the TP rate of the SR measure is significantly larger than that of the FV measure (M=0.77 vs. 0.40; T(16)=3.51, p <.01) and the TN rate of the FV measure is significantly larger than that of the SR measure (M=0.35 vs. 0.61; T(16)= -2.76, p <.05). Pooling the number of positive and negative values for the marketplace successful/unsuccessful beverages over the facially expressive group, TP = 201, FN = 56, FP = 165, TN = 86 in the SR measure, and TP = 54, FN = 60, FP = 40, TN = 77 in the FV measure. Thus, the TP rate (or hit rate) of the SR measure was greater than that of the FV measure (0.78 vs. 0.47), but the TN rate (or 1 – false alarm rate) of the SR measure was smaller than that of the FV measure (0.34 vs. 0.66). The positive-to-negative ratios were: TP / FN = 3.59 (SR) vs. 0.90 (FV) for the successful beverage, and FP / TN = 1.92 (SR) vs. 0.52 (FV) for the disfavored beverage. That is, the SR measure tended to have greater positive-to-negative response ratios (TP / FN and FP / TN) for both successful and unsuccessful beverages, compared to the FV measure.
Note that the SR measure has a higher false alarm rate as well as a higher hit rate, compared to the FV measure: these findings are explained by the SR measure being biased toward positive responses and the FV measure biased toward negative responses. SR and FV measures to predict marketplace success/failure of beverages
To evaluate the effectiveness of the marketplace predictions of a SR or FV measure (recognizing StoreSoda as successful and NovelSoda as unsuccessful), we evaluated several performance statistics from the contingency table of responses (positive, negative) × beverages (marketplace successful, marketplace unsuccessful).
Specifically, we examine how the performance statistics vary over the facially expressive and/or the whole groups when the SR values alone, the FV values alone, or the SR and FV combined values are used for the marketplace prediction. To be thorough, we also compare all of the following well-known criteria to assess if the affective-cognitive findings are stable across many techniques:
• Positive predictive value = TP / (TP + FP) • Negative predictive value = TN / (FN + TN) • Likelihood ratio positive (LR+) = sensitivity / (1 – specificity)
= hit rate / false alarm rate = (TP/(TP+FN))/(FP/(FP+TN)) • Likelihood ratio negative (LR–) = (1 – sensitivity) / specificity
= (1 – hit rate) / (1 – false alarm rate) = (FN/(TP+FN))/(TN/(FP+TN))

DRAFT: PLEASE DO NOT CIRCULATE WITHOUT PERMISSION 23
• Accuracy = (TP + TN) / (TP + FN + FP + TN) • MCC (Matthews correlation coefficient)
= (TP × TN – FP × FN) / √((TP + FP)(TP + FN)(TN + FP)(TN + FN)) • d' = |Z(sensitivity) – Z(1–specificity)| where Z(p), p ∈[0,1] is the inverse of the
standard cumulative normal distribution
The LR criteria are of interest in the following way: First, it is desirable that LR+ should be high and LR- should be low; these are comparable to desiring both high sensitivity and high specificity. The LR+ is the likelihood that a given positive response of a measure (such as a smile) would be expected in a marketplace successful beverage compared to the likelihood that the same response would occur in a marketplace unsuccessful beverage. The LR- would be the likelihood that a given negative response (such as a frown) would occur in a marketplace successful beverage compared to the likelihood that it occurs in a marketplace unsuccessful beverage.
MCC, another criterion used for prediction performance, takes a value between −1 and +1, according to a correlation between the observed and predicted binary classifications: MCC = +1 means “a perfect prediction”, MCC = 0 “an average random prediction”, and MCC = −1 “an inverse prediction” (Baldi et al. 2000). For a 2×2 contingency table, MCC can be linked to the chi-square statistic: MCC = √ (chi-square statistic / number of total observations).
Below are the results for six cases: (1) SR over all participants, (2)-(3): SR alone and FV alone over all the facially expressive participants, and (4)-(6) three additional cases designed to find the best combined affective-cognitive measure. Discussion follows below. * SR measurements alone, pooling responses over all respondents (N=39) Marketplace Successful
beverage Marketplace Unsuccessful beverage
Positive response TP = 484 FP = 464 Negative response FN = 100 TN = 107 Sensitivity = 0.83 ± 0.01 Specificity = 0.19 ± 0.01 Positive predictive value = 0.51 ± 0.01 Negative predictive value = 0.52 ± 0.02 Likelihood ratio positive (LR+) = 1.02 ± 0.02 Likelihood ratio negative (LR–) = 0.92 ± 0.07 Accuracy = 0.51 ± 0.01 MCC = 0.02 ± 0.02 d' = 0.06 ± 0.05 The overall sensitivity of self-report for predicting markeplace outcome is high while the specificity and the discriminability d’ of self-report are very low.

DRAFT: PLEASE DO NOT CIRCULATE WITHOUT PERMISSION 24
Below we consider only the facially expressive group (7 StoreSoda favorers and 10 NovelSoda favorers in terms of after-the-test beverage preference). * SR measurements pooling responses over the facially expressive group (N=17) Marketplace Successful
beverage Marketplace Unsuccessful beverage
Positive response TP = 201 FP = 165 Negative response FN = 56 TN = 86 Sensitivity = 0.78 ± 0.02 Specificity = 0.34 ± 0.03 Positive predictive value = 0.55 ± 0.02 Negative predictive value = 0.61 ± 0.04 Likelihood ratio positive (LR+) = 1.19 ± 0.07 Likelihood ratio negative (LR–) = 0.64 ± 0.09 Accuracy = 0.57 ± 0.02 MCC = 0.14 ± 0.04 d' = 0.37 ± 0.12 * FV measurements pooling responses over the facially expressive group (N=17) Marketplace Successful
beverage Marketplace Unsuccessful beverage
Positive response TP = 54 FP = 40 Negative response FN = 60 TN = 77 Sensitivity = 0.47 ± 0.03 Specificity = 0.66 ± 0.03 Positive predictive value = 0.57 ± 0.03 Negative predictive value = 0.56 ± 0.03 Likelihood ratio positive (LR+) = 1.40 ± 0.19 Likelihood ratio negative (LR–) = 0.80 ± 0.07 Accuracy = 0.57 ± 0.03 MCC = 0.13 ± 0.05 d' = 0.34 ± 0.14
The FV measure alone does not do as well on sensitivity as the SR measure alone; however, it does better on specificity and on discriminability d'. Also, the FV measure has a higher LR+ than the SR measure, and the SR measure has a lower LR– than the FV measure, reflecting the tendency of SR to be positive and FV to be negative for these beverage tests.
Our goal all along has been to assess what the different affective, behavioral, and
cognitive measures tell us not only separately, but also when combined smartly. We are particularly interested in building a measure that is more reliable and trustworthy than what has been available in the past. Reliability and trustworthiness are related to consistency, and so we predict that if a person’s affective and cognitive measures are consistent, then they will be more reliable predictors of outcome. In the next case, we

DRAFT: PLEASE DO NOT CIRCULATE WITHOUT PERMISSION 25
take only the samples where FV and SR are congruent. In other words, the new model only considers samples of {positive FV & positive SR} or {negative FV & negative SR}. * SR & FV measurements pooling over the facially expressive group (N=17) Marketplace Successful
beverage Marketplace Unsuccessful beverage
Positive response TP = 52 FP = 40 Negative response FN = 28 TN = 51 Sensitivity = 0.65 ± 0.04 Specificity = 0.56 ± 0.04 Positive predictive value = 0.57 ± 0.03 Negative predictive value = 0.65 ± 0.04 Likelihood ratio positive (LR+) = 1.50 ± 0.18 Likelihood ratio negative (LR–) = 0.63 ± 0.10 Accuracy = 0.60 ± 0.03 MCC = 0.21 ± 0.06 d' = 0.54 ± 0.17 The combined SR & FV model, based on the consistent data, provides higher d’, higher LR+, lower LR-, higher accuracy and higher MCC than the SR model or the FV model. In other words, the combined SR & FV model can represent respondents’ beverage preference better given these four popular criteria (LR+, LR-, Accuracy, MCC). Also, it finds that respondents like StoreSoda more than NovelSoda, predicting that StoreSoda would be more successful than NovelSoda in the real marketplace. This finding is consistent with the actual marketplace selling outcomes of the two products. Thus, combining consistent affective and cognitive measures is more predictive of the marketplace outcome, supporting Hypothesis H5. We are interested in seeing whether affective wanting (outcome FV, i.e., satisfaction/disappointment) and affective liking (evaluation FV, i.e., liking/disliking) differ in their ability to predict marketplace outcomes. The results below show the prediction performances of the outcome FV model alone and the combined SR & outcome FV model. In the outcome FV model, we only use outcome FV without using evaluation FV. In the SR & outcome FV model, we employ the congruent responses between SR and outcome FV for each beverage. We compare the outcome FV model with the FV model above, and also, compare the SR & outcome FV model with the SR & FV model analyzed above. * Outcome FV measurements (affective wanting) pooling responses over the facially expressive group (N=17) Marketplace Successful
beverage Marketplace Unsuccessful beverage
Positive response TP = 34 FP = 24 Negative response FN = 25 TN = 39 Sensitivity = 0.58 ± 0.05 Specificity = 0.62 ± 0.04 Positive predictive value = 0.59 ± 0.05

DRAFT: PLEASE DO NOT CIRCULATE WITHOUT PERMISSION 26
Negative predictive value = 0.61 ± 0.04 Likelihood ratio positive (LR+) = 1.54 ± 0.28 Likelihood ratio negative (LR–) = 0.70 ± 0.11 Accuracy = 0.60 ± 0.04 MCC = 0.19 ± 0.08 d' = 0.49 ± 0.21 * SR & outcome FV measurements (cognitive value and affective wanting) pooling responses over the facially expressive group (N=17) Marketplace Successful
beverage Marketplace Unsuccessful beverage
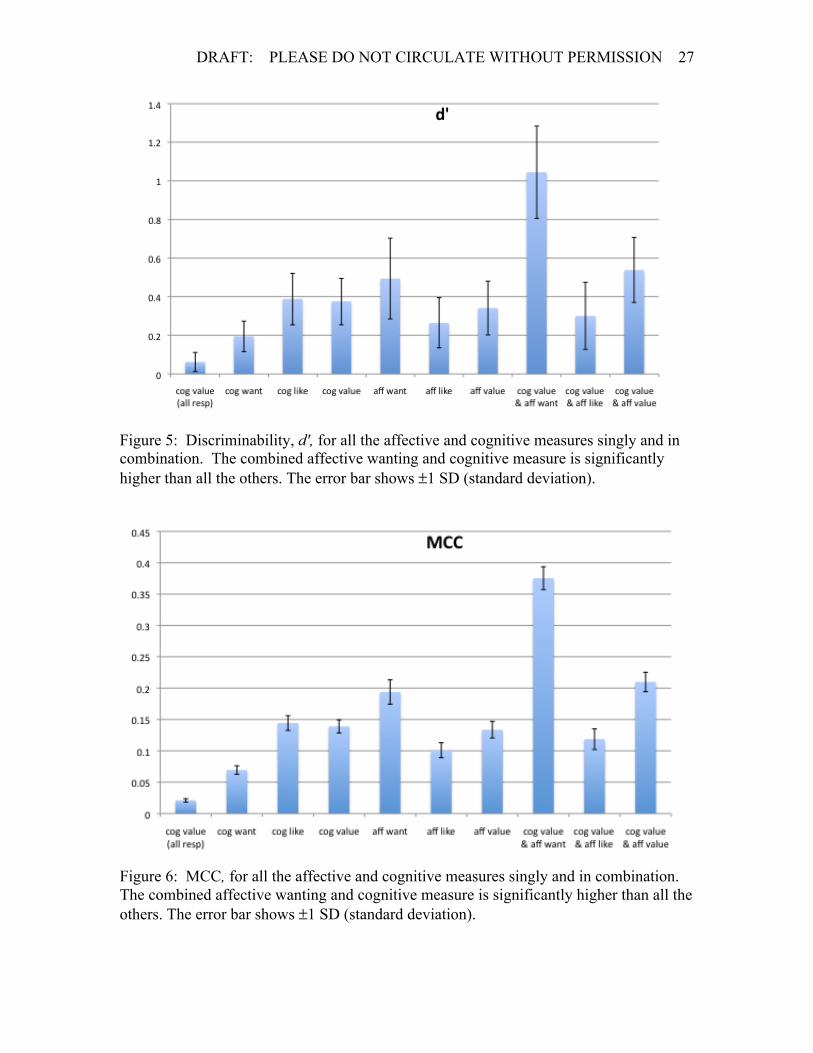
Positive response TP = 32 FP = 24 Negative response FN = 8 TN = 33 Sensitivity = 0.80 ± 0.04 Specificity = 0.58 ± 0.05 Positive predictive value = 0.57 ± 0.051 Negative predictive value = 0.80 ± 0.037 Likelihood ratio positive (LR+) = 1.92 ± 0.28 Likelihood ratio negative (LR–) = 0.35 ± 0.10 Accuracy = 0.67 ± 0.04 MCC = 0.38 ± 0.08 d' = 1.05 ± 0.24 Clearly the outcome FV model (affective wanting) is significantly better than the FV model (affective wanting + affective liking) and the SR & outcome FV model is significantly better than SR & FV model on the different criteria of prediction performance. Thus, in this study, affective wanting measures were more effective than affective liking measures in predicting the customers’ overall preference, supporting Hypothesis H6. Figure 5 summarizes the discriminability for all six cases above, as well as for four additional ones: cognitive wanting alone, cognitive liking alone, affective liking alone, and cognitive value coupled with affective liking. The best discriminability clearly arises when using the combination of affective wanting with cognitive value.
DRAFT: PLEASE DO NOT CIRCULATE WITHOUT PERMISSION 27
Figure 5: Discriminability, d', for all the affective and cognitive measures singly and in combination. The combined affective wanting and cognitive measure is significantly higher than all the others. The error bar shows ±1 SD (standard deviation).
Figure 6: MCC, for all the affective and cognitive measures singly and in combination. The combined affective wanting and cognitive measure is significantly higher than all the others. The error bar shows ±1 SD (standard deviation).

DRAFT: PLEASE DO NOT CIRCULATE WITHOUT PERMISSION 28
Figure 7: LR+, for all the affective and cognitive measures singly and in combination. The combined affective wanting and cognitive measure is significantly higher than all the others. The error bar shows ±1 SD (standard deviation).
Figure 8: LR-, for all the affective and cognitive measures singly and in combination. The combined affective wanting and cognitive measure is significantly lower than all the others. The error bar shows ±1 SD (standard deviation).

DRAFT: PLEASE DO NOT CIRCULATE WITHOUT PERMISSION 29
Figure 9: Accuracy, for all the affective and cognitive measures singly and in combination. The combined affective wanting and cognitive measure is significantly higher than all the others. The error bar shows ±1 SD (standard deviation).
Conclusion and Discussion This paper has demonstrated a novel technology-based methodology for conducting
product preference research combining new affective measures together with behavioral and cognitive measures. The methodology was applied to a real-world product test using two FamousBrand soda beverages that had gone to the marketplace, one with a successful marketplace outcome (StoreSoda) and one with an unsuccessful outcome (NovelSoda). Affective, behavioral, and cognitive measures were successfully collected on 34 out of 39 participants, demonstrating successful use of the technology-based methodology that minimizes human interaction and gives participants multiple trials with each product while collecting multi-modal measures. We presented a new methodology to elicit and capture affective wanting as well as affective liking, and evaluated these measures along with traditional cognitive and behavioral measures. As a cost-advantage, this study involved a much smaller group than the hundreds to thousands of people usually required in order to obtain significant power when only self-report measures are used; nonetheless, with n=39 it provided statistically significant discrimination and many new insights.
First, our study confirmed the difficulty of obtaining significant discrimination based only on cognitive self-report measures when two products are similar (e.g. sweet beverages): self-report measures were overall very positive for both beverages, and

DRAFT: PLEASE DO NOT CIRCULATE WITHOUT PERMISSION 30
choices of favorite beverage were fairly evenly split in preferring the successful StoreSoda or the NovelSoda, with only very slight preference for StoreSoda (analyzing three different ways the questionnaire data, the ratios were: 20:18, 20:17, 18:16). Tilting the balance slightly in the other direction, those who preferred StoreSoda reported lower expectation comparisons and lower purchase intent than those who preferred NovelSoda (14:17 and 14:17), suggesting that the NovelSoda favorers were more likely to buy NovelSoda. Behaviorally, people consumed the same amount of StoreSoda and NovelSoda per sip and there was a subtle bias among everyone toward choosing the machine more likely to give NovelSoda: 54.6% of the time it was chosen over the machine more likely to give StoreSoda. On balance, cognitive and behavioral measures showed the two products to be preferred nearly equivalently. Combining all the cognitive (questionnaire) items and behavioral items would suggest that, based on this sample of 39 respondents tested during August, NovelSoda should have had a great chance to succeed in the marketplace. Of course this is a small sample, it is only one regional area, and it does not take into account other factors such as the packaging, marketing or possible effect of the weather or season. Nonetheless, this finding is important because it shows that surveying this sample of respondents could have led to the same decision that was chosen historically: FamousBrand took NovelSoda to market based on SR data, spending lots of money, time, and natural resources to package, distribute, and promote the product. Based on cognitive and behavioral data, going to market looks like a reasonable decision. But this turns out to be only part of the story. Overall, respondents showed significantly more negative FVs than positive FVs for NovelSoda than for StoreSoda. Moreover, there was an interesting asymmetry: StoreSoda favorers showed absolutely no positive expressions while tasting NovelSoda, while nearly half of the NovelSoda favorers showed something positive while tasting StoreSoda. If positive FV’s were mapped into purchasing behavior, then one might expect slightly less than half the NovelSoda favorers to buy both products, while no StoreSoda favorers would buy NovelSoda. This finding is consistent with actual marketplace failure of NovelSoda relative to StoreSoda. People’s negative affective feelings that could influence their purchases showed up in FV measures and not in the self-reported cognitive or the behavioral measures. In particular, the “outcome” facial valences that were shown when a machine told them which product to sip – reflecting a new measure of customer wanting – showed the highest discriminability (d’, also known as effect size) when combined with cognitive self-report, while the latter alone did not provide high discriminability, and tended to be biased to say positive things.
Millions of market research studies continue to rely on self-report, a cognitive measure that while easy to administer is known to be inaccurate in predicting marketplace success. Our new framework directly addresses several of the problems in the cognitive techniques and thus should improve prediction of outcomes in the marketplace. Specifically, We have shown that the measures presented here are capable of significantly enhancing discriminability even among two “similar” products that people say they like nearly equally. The framework can be applied to many different industries

DRAFT: PLEASE DO NOT CIRCULATE WITHOUT PERMISSION 31
that need a mechanism to predict future marketplace outcomes of new products – it is not limited to beverage choices, but could be easily applied to any product that can be used in front of a camera and display, or for any product concept or service delivered with a computer in front of a person. The key in our framework is to recognize that affective, behavioral, and cognitive components work together in decision making: each can carry different information, and careful measurement of them will lead to better understanding and insights. With better insights provided by new methodologies such as the one presented here, businesses can reduce wasteful spending of human and natural resources on advertising, packaging, and distributing products that people really don’t want or like. It is our aim that the methodology presented here would help provide these insights, enabling business to direct valuable resources for much better outcomes than have been achievable to date.
DRAFT: PLEASE DO NOT CIRCULATE WITHOUT PERMISSION 32
References
Baldi, P., S. Brunak, Y. Chauvin, C. A. F. Andersen, and H. Nielsen (2000), "Assessing the accuracy of prediction algorithms for classification: an overview," Bioinformatics, 16 (5), 412-12. Balleine, B. W. and A. Dickinson (1998), "Goal-directed instrumental action: contingency and incentive learning and their cortical substrates," Neuropharmacology, 37 (4-5), 407-19. Bechara, Antoine. and Antonio. R. Damasio (2005), "The somatic marker hypothesis: a neural theory of economic decision," Games and Economic Behavior, 52 (2), 336-72. Bechara, Antoine., Hanna. Damasio, Daniel. Tranel, and Antonio. R. Damasio (1997), "Deciding Advantageously Before Knowing the Advantageous Strategy," Science, 275 (5304), 1293. Berridge, Kent C. and J. Wayne Aldridge (2009), "Decision utility, incentive salience, and cue-triggered ‘wanting’," in Oxford Handbook of Human Action, E. Morsella, Bargh, J.A., & Gollwitzer, P.M. (Eds.), ed.: Oxford University Press. Berridge, Kent. C. (2003), "Irrational Pursuit: Hyper-Incentives from a Visceral Brain," The Psychology of Economic Decisions, 1, 17-40. ---- (2004), "Motivation concepts in behavioral neuroscience," Physiology and Behavior, 81 (2), 179-209. ---- (1999), "Pleasure, pain, desire, and dread: Hidden core processes of emotion," in Well-being: The foundations of hedonic psychology, Daniel Kahneman and Diener Ed and Norbert Schwarz, eds. New York: Russell Sage Foundation. Berridge, Kent. C. and Terry. E. Robinson (2003), "Parsing reward," Trends Neurosci, 26 (9), 507-13. Daw, N. D., Y. Niv, and P. Dayan (2005), "Uncertainty-based competition between prefrontal and dorsolateral striatal systems for behavioral control," Nature Neuroscience, 8 (12), 1704-11. Daw, Nathaniel. D., John. P. O'Doherty, Peter. Dayan, Ben. Seymour, and Raymond. J. Dolan (2006), "Cortical substrates for exploratory decisions in humans," Nature, 441 (7095), 876-9. Dayan, P., Y. Niv, B. Seymour, and N. D. Daw (2006), "The misbehavior of value and the discipline of the will," Neural Networks, 19, 1153-60.

DRAFT: PLEASE DO NOT CIRCULATE WITHOUT PERMISSION 33
Frijda, Nico. H. (1999), "Emotions and hedonic experience," in Well-being: The foundations of hedonic psychology, Daniel Kahneman and Diener Ed and Norbert Schwarz, eds. New York: Russell Sage Foundation. Gladwell, Malcolm (2005), Blink: The power of thinking without thinking. New York: Little, Brown and Conmpany. Hsee, Christopher K. and Reid Hastie (2006), "Decision and experience: why don't we choose what makes us happy?," TRENDS in Cognitive Sciences, 10 (1), 32. Kahneman, Daniel (2000), "Experienced Utility and Objective Happiness: A Moment-Based Approach," Choices, values, and frames, 673-92. ---- (2003), "Maps of Bounded Rationality: Psychology for Behavioral Economics," The American Economic Review, 93 (5), 1449-75. Kahneman, Daniel and Amos Tversky (1979), "Prospect Theory: An Analysis of Decision under Risk," Econometrica, 47 (2), 263-92. Kahneman, Daniel, Peter P. Wakker, and Rakesh Sarin (1997), "Back to Bentham? Explorations of Experienced Utility," The Quarterly Journal of Economics, 112 (2), 375-405. Larsen, Randy J. and Barbara L. Fredrickson (1999), "Measurement issues in emotion research," in Well-being: The foundations of hedonic psychology, Daniel Kahneman and Diener Ed and Norbert Schwarz, eds. New York: Russell Sage Foundation. Loewenstein, G. and T. O'Donoghue (2004), "Animal Spirits: Affective and Deliberative Processes in Economic Behavior," Social Science Research Network. Loewenstein, George. and Jennifer. S. Lerner (2003), "The role of affect in decision making," in Handbook of affective science, H. Goldsmith R. Davidson, & K. Scherer (Eds.), ed. Oxford: Oxford University Press. O'Doherty, John., Peter. Dayan, Johannes. Schultz, Ralf. Deichmann, Karl. Friston, and Raymond. J. Dolan (2004), "Dissociable Roles of Ventral and Dorsal Striatum in Instrumental Conditioning," American Association for the Advancement of Science. Pham, Michel. T. (2007), "Emotion and Rationality: A Critical Review and Interpretation of Empirical Evidence," Review of General Psychology, 11 (2), 155-78. Satpute, Ajay B. and Matthew D. Lieberman (2006), "Integrating automatic and controlled processes into neurocognitive models of social cognition," Brain Research, 1079 (1), 86-97.

DRAFT: PLEASE DO NOT CIRCULATE WITHOUT PERMISSION 34
Slovic, P., M. L. Finucane, E. Peters, and D. G. MacGregor (2004), "Risk as Analysis and Risk as Feelings: Some Thoughts about Affect, Reason, Risk, and Rationality," Risk Analysis, 24 (2), 311-22. Stayman, Douglas M. and David A. Aaker (1993), "Continuous Measurement of Self-Report of Emotional Response," Psychology & Marketing, 10 (3), 199-214. Strauss, M., C. Reynolds, S. Hughes, K. Park, G. McDarby, and R. Picard (2005), "The handwave bluetooth skin conductance sensor," Affective Computing and Intelligent Interaction, 699-706. Sutton, Richard. S. and Andrew. G. Barto (1998), Reinforcement Learning: An Introduction: MIT Press. Wilson, Timothy. D. and Daniel.T. Gilbert (2005), "Affective Forcasting: Knowing What to Want," Current Directions in Psychological Science, 14 (3), 131-34.