measuring dnssec use - ripe 67 · understanding resolvers is “tricky” what we would like to...
TRANSCRIPT
Measuring DNSSEC Use
Geoff Huston APNIC

Some Questions…
• Who is using DNSSEC valida3on? • What is the DNSSEC performance overhead for users and servers?
• What happens when the DNSSEC signature is not valid?
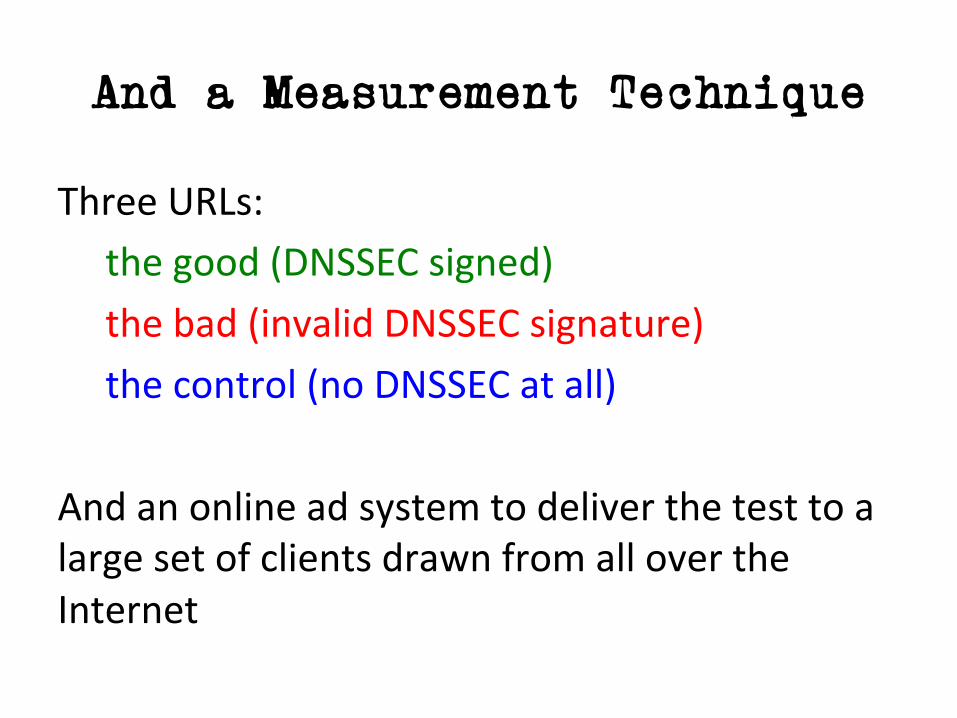
And a Measurement Technique
Three URLs: the good (DNSSEC signed) the bad (invalid DNSSEC signature) the control (no DNSSEC at all)
And an online ad system to deliver the test to a large set of clients drawn from all over the Internet

Understanding Resolvers is “tricky”
What we would like to think happens in DNS resolution!
Client DNS Resolver
x.y.z? Authoritative Nameserver
x.y.z?
x.y.z? 10.0.0.1 x.y.z? 10.0.0.1

Understanding Resolvers is “tricky”
A small sample of what appears to happen in DNS resolution

Understanding Resolvers is “tricky”
The best model we can use for DNS resolution

Understanding Resolvers is “tricky”
If we combine www and dns data we can map clients to the visible resolvers that query our server
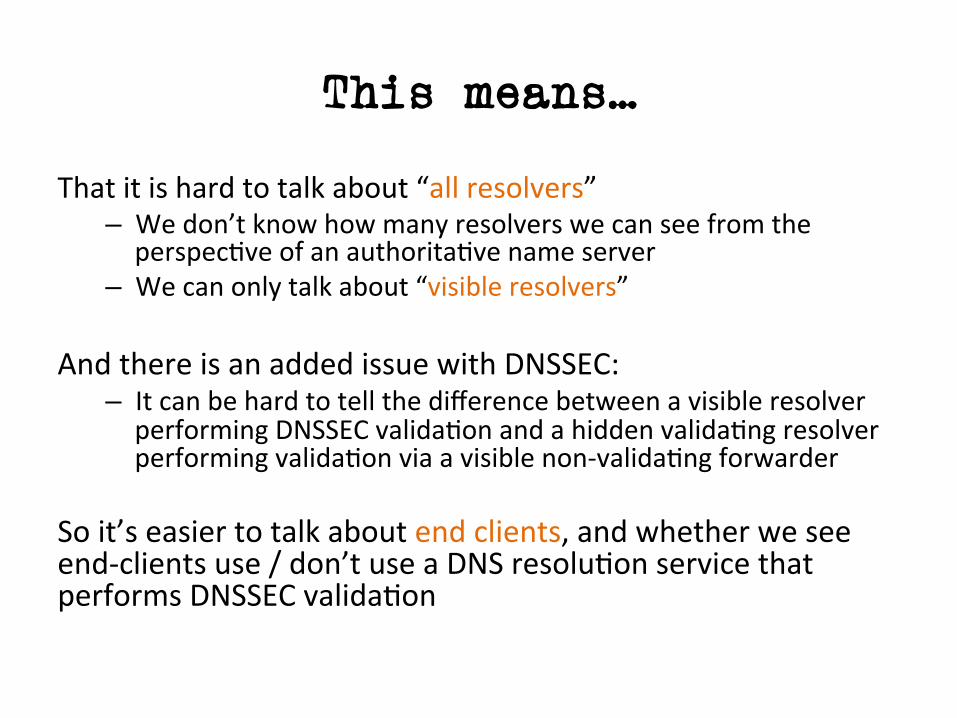
This means…
That it is hard to talk about “all resolvers” – We don’t know how many resolvers we can see from the perspec3ve of an authorita3ve name server
– We can only talk about “visible resolvers”
And there is an added issue with DNSSEC: – It can be hard to tell the difference between a visible resolver performing DNSSEC valida3on and a hidden valida3ng resolver performing valida3on via a visible non-‐valida3ng forwarder
So it’s easier to talk about end clients, and whether we see end-‐clients use / don’t use a DNS resolu3on service that performs DNSSEC valida3on
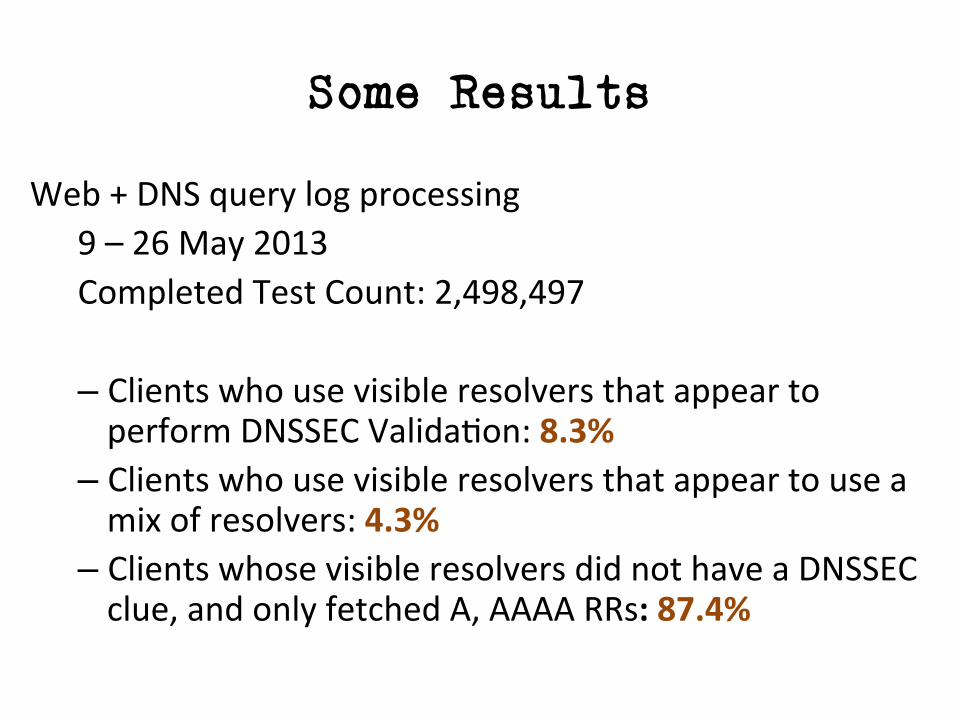
Some Results
Web + DNS query log processing 9 – 26 May 2013 Completed Test Count: 2,498,497
– Clients who use visible resolvers that appear to perform DNSSEC Valida3on: 8.3%
– Clients who use visible resolvers that appear to use a mix of resolvers: 4.3%
– Clients whose visible resolvers did not have a DNSSEC clue, and only fetched A, AAAA RRs: 87.4%

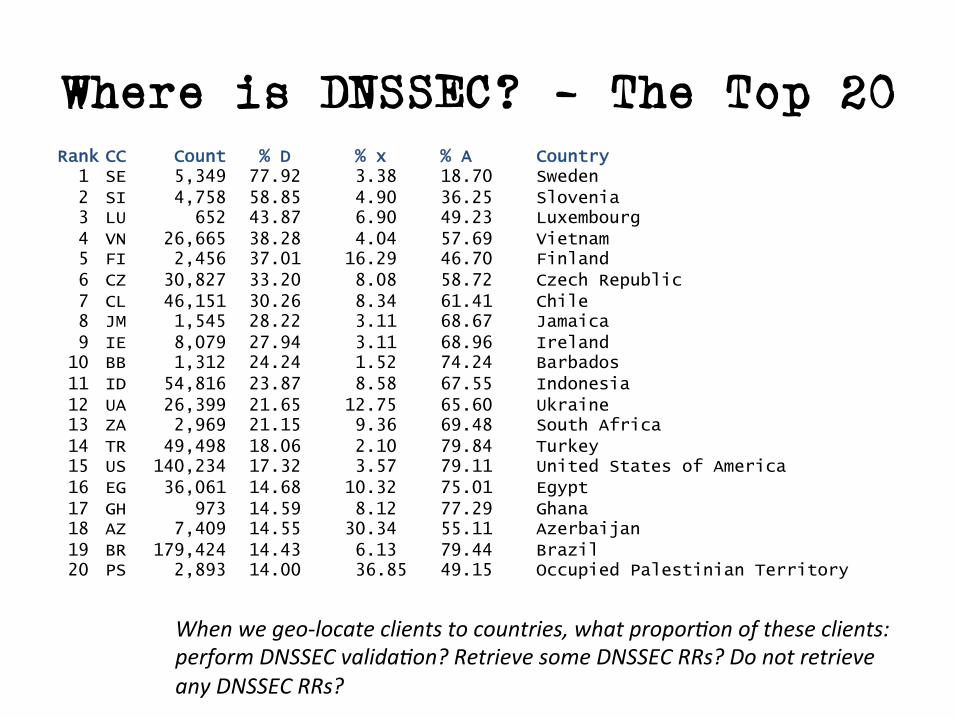
Where is DNSSEC? – The Top 20 Rank CC Count % D % x % A Country 1 SE 5,349 77.92 3.38 18.70 Sweden 2 SI 4,758 58.85 4.90 36.25 Slovenia 3 LU 652 43.87 6.90 49.23 Luxembourg 4 VN 26,665 38.28 4.04 57.69 Vietnam 5 FI 2,456 37.01 16.29 46.70 Finland 6 CZ 30,827 33.20 8.08 58.72 Czech Republic 7 CL 46,151 30.26 8.34 61.41 Chile 8 JM 1,545 28.22 3.11 68.67 Jamaica 9 IE 8,079 27.94 3.11 68.96 Ireland 10 BB 1,312 24.24 1.52 74.24 Barbados 11 ID 54,816 23.87 8.58 67.55 Indonesia 12 UA 26,399 21.65 12.75 65.60 Ukraine 13 ZA 2,969 21.15 9.36 69.48 South Africa 14 TR 49,498 18.06 2.10 79.84 Turkey 15 US 140,234 17.32 3.57 79.11 United States of America 16 EG 36,061 14.68 10.32 75.01 Egypt 17 GH 973 14.59 8.12 77.29 Ghana 18 AZ 7,409 14.55 30.34 55.11 Azerbaijan 19 BR 179,424 14.43 6.13 79.44 Brazil 20 PS 2,893 14.00 36.85 49.15 Occupied Palestinian Territory
When we geo-‐locate clients to countries, what propor4on of these clients: perform DNSSEC valida4on? Retrieve some DNSSEC RRs? Do not retrieve any DNSSEC RRs?
% of clients who appear to use
DNSSEC-‐valida4ng resolvers
% of clients who use a mix of DNSSEC-‐valida4ng resolvers and non-‐valida4ng
resolvers
% of clients who use non-‐valida4ng
resolvers
Where is DNSSEC? – The Top 20 Rank CC Count % D % x % A Country 1 SE 5,349 77.92 3.38 18.70 Sweden 2 SI 4,758 58.85 4.90 36.25 Slovenia 3 LU 652 43.87 6.90 49.23 Luxembourg 4 VN 26,665 38.28 4.04 57.69 Vietnam 5 FI 2,456 37.01 16.29 46.70 Finland 6 CZ 30,827 33.20 8.08 58.72 Czech Republic 7 CL 46,151 30.26 8.34 61.41 Chile 8 JM 1,545 28.22 3.11 68.67 Jamaica 9 IE 8,079 27.94 3.11 68.96 Ireland 10 BB 1,312 24.24 1.52 74.24 Barbados 11 ID 54,816 23.87 8.58 67.55 Indonesia 12 UA 26,399 21.65 12.75 65.60 Ukraine 13 ZA 2,969 21.15 9.36 69.48 South Africa 14 TR 49,498 18.06 2.10 79.84 Turkey 15 US 140,234 17.32 3.57 79.11 United States of America 16 EG 36,061 14.68 10.32 75.01 Egypt 17 GH 973 14.59 8.12 77.29 Ghana 18 AZ 7,409 14.55 30.34 55.11 Azerbaijan 19 BR 179,424 14.43 6.13 79.44 Brazil 20 PS 2,893 14.00 36.85 49.15 Occupied Palestinian Territory
When we geo-‐locate clients to countries, what propor4on of these clients: perform DNSSEC valida4on? Retrieve some DNSSEC RRs? Do not retrieve any DNSSEC RRs?
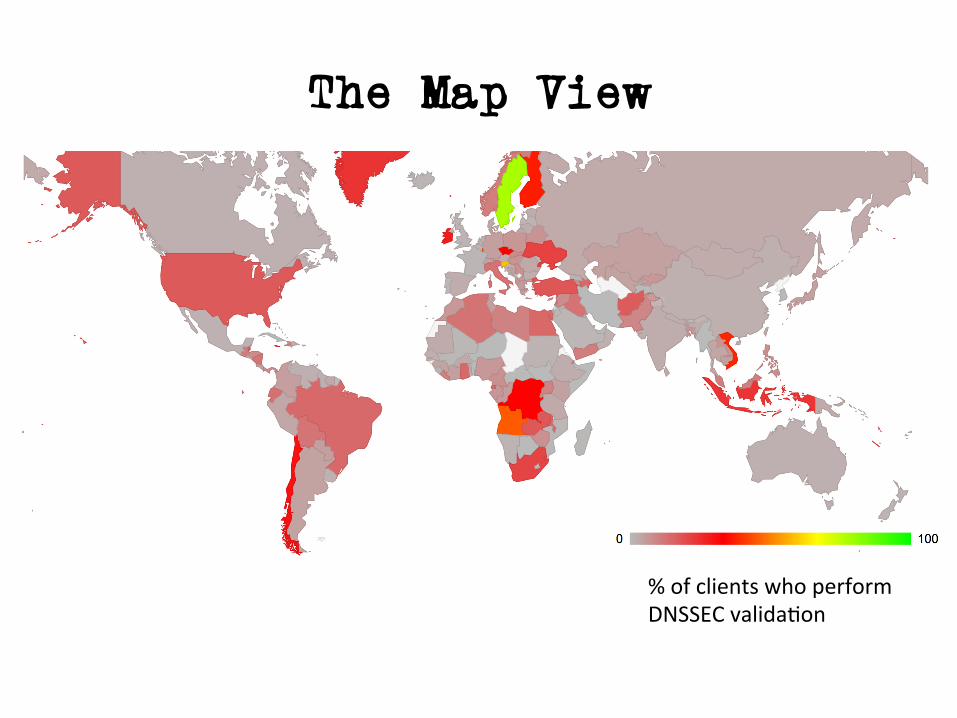
The Map View
% of clients who perform DNSSEC valida3on
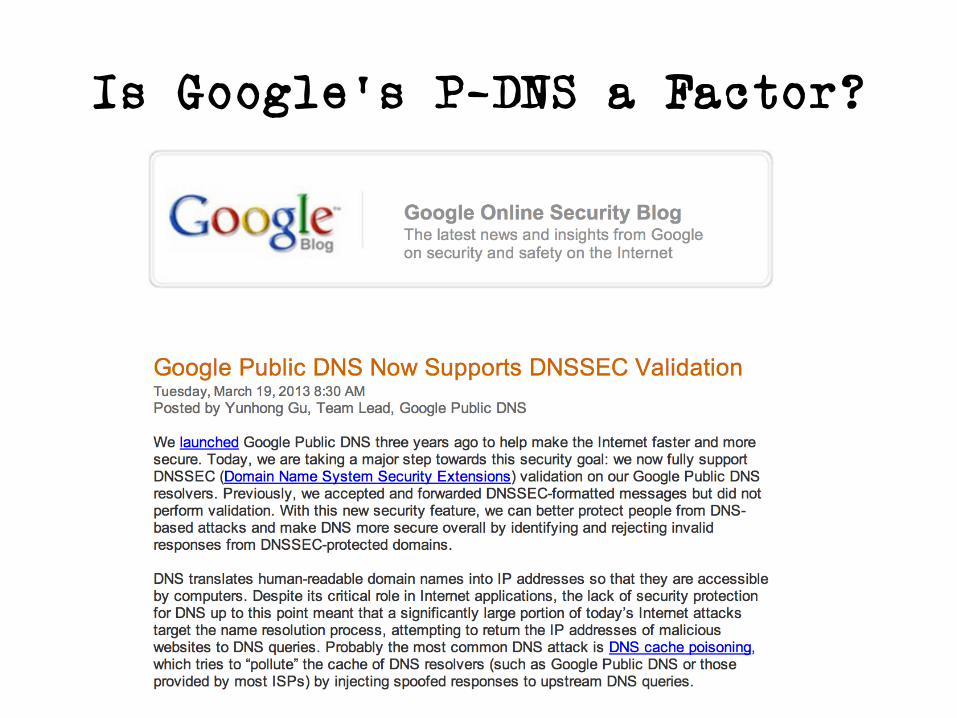
Is Google’s P-DNS a Factor?

Is Google’s P-DNS a Factor?
• Clients who used Google’s Public DNS servers to resolve names: 7.2% – Exclusively Used Google’s P-‐DNS: 5.3% – Used a mix of Google P-‐DNS + others: 1.9%
• Clients who used other resolvers: 92.8%
Is Google’s P-DNS a Factor?
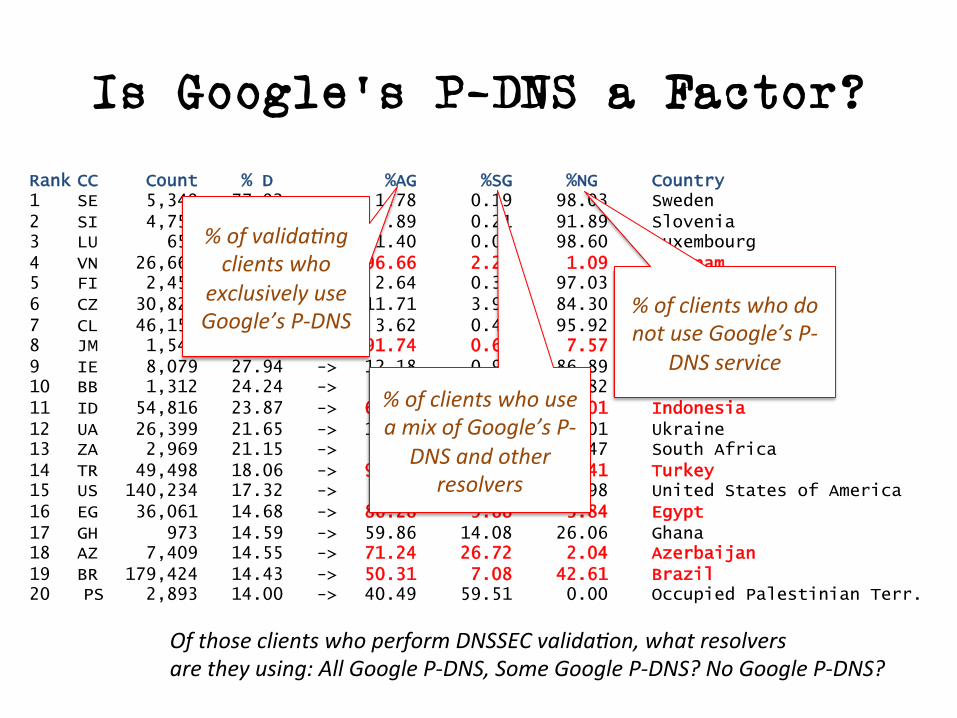
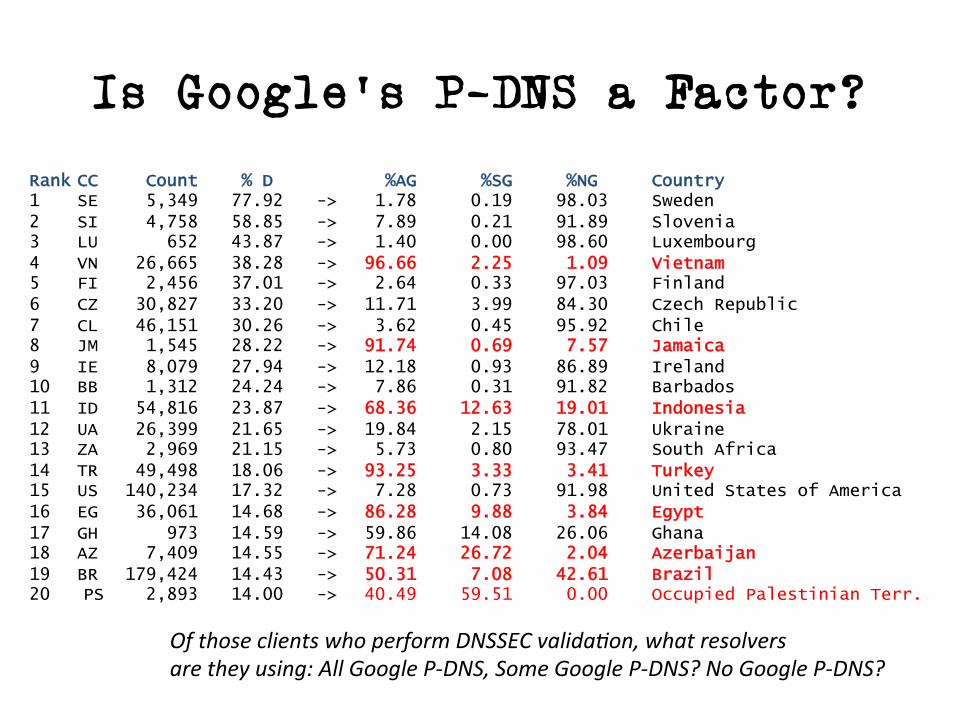
Rank CC Count % D %AG %SG %NG Country 1 SE 5,349 77.92 -> 1.78 0.19 98.03 Sweden 2 SI 4,758 58.85 -> 7.89 0.21 91.89 Slovenia 3 LU 652 43.87 -> 1.40 0.00 98.60 Luxembourg 4 VN 26,665 38.28 -> 96.66 2.25 1.09 Vietnam 5 FI 2,456 37.01 -> 2.64 0.33 97.03 Finland 6 CZ 30,827 33.20 -> 11.71 3.99 84.30 Czech Republic 7 CL 46,151 30.26 -> 3.62 0.45 95.92 Chile 8 JM 1,545 28.22 -> 91.74 0.69 7.57 Jamaica 9 IE 8,079 27.94 -> 12.18 0.93 86.89 Ireland 10 BB 1,312 24.24 -> 7.86 0.31 91.82 Barbados 11 ID 54,816 23.87 -> 68.36 12.63 19.01 Indonesia 12 UA 26,399 21.65 -> 19.84 2.15 78.01 Ukraine 13 ZA 2,969 21.15 -> 5.73 0.80 93.47 South Africa 14 TR 49,498 18.06 -> 93.25 3.33 3.41 Turkey 15 US 140,234 17.32 -> 7.28 0.73 91.98 United States of America 16 EG 36,061 14.68 -> 86.28 9.88 3.84 Egypt 17 GH 973 14.59 -> 59.86 14.08 26.06 Ghana 18 AZ 7,409 14.55 -> 71.24 26.72 2.04 Azerbaijan 19 BR 179,424 14.43 -> 50.31 7.08 42.61 Brazil 20 PS 2,893 14.00 -> 40.49 59.51 0.00 Occupied Palestinian Terr.
Of those clients who perform DNSSEC valida4on, what resolvers are they using: All Google P-‐DNS, Some Google P-‐DNS? No Google P-‐DNS?
% of valida4ng clients who
exclusively use Google’s P-‐DNS
% of clients who use a mix of Google’s P-‐
DNS and other resolvers
% of clients who do not use Google’s P-‐
DNS service
Is Google’s P-DNS a Factor?
Rank CC Count % D %AG %SG %NG Country 1 SE 5,349 77.92 -> 1.78 0.19 98.03 Sweden 2 SI 4,758 58.85 -> 7.89 0.21 91.89 Slovenia 3 LU 652 43.87 -> 1.40 0.00 98.60 Luxembourg 4 VN 26,665 38.28 -> 96.66 2.25 1.09 Vietnam 5 FI 2,456 37.01 -> 2.64 0.33 97.03 Finland 6 CZ 30,827 33.20 -> 11.71 3.99 84.30 Czech Republic 7 CL 46,151 30.26 -> 3.62 0.45 95.92 Chile 8 JM 1,545 28.22 -> 91.74 0.69 7.57 Jamaica 9 IE 8,079 27.94 -> 12.18 0.93 86.89 Ireland 10 BB 1,312 24.24 -> 7.86 0.31 91.82 Barbados 11 ID 54,816 23.87 -> 68.36 12.63 19.01 Indonesia 12 UA 26,399 21.65 -> 19.84 2.15 78.01 Ukraine 13 ZA 2,969 21.15 -> 5.73 0.80 93.47 South Africa 14 TR 49,498 18.06 -> 93.25 3.33 3.41 Turkey 15 US 140,234 17.32 -> 7.28 0.73 91.98 United States of America 16 EG 36,061 14.68 -> 86.28 9.88 3.84 Egypt 17 GH 973 14.59 -> 59.86 14.08 26.06 Ghana 18 AZ 7,409 14.55 -> 71.24 26.72 2.04 Azerbaijan 19 BR 179,424 14.43 -> 50.31 7.08 42.61 Brazil 20 PS 2,893 14.00 -> 40.49 59.51 0.00 Occupied Palestinian Terr.
Of those clients who perform DNSSEC valida4on, what resolvers are they using: All Google P-‐DNS, Some Google P-‐DNS? No Google P-‐DNS?
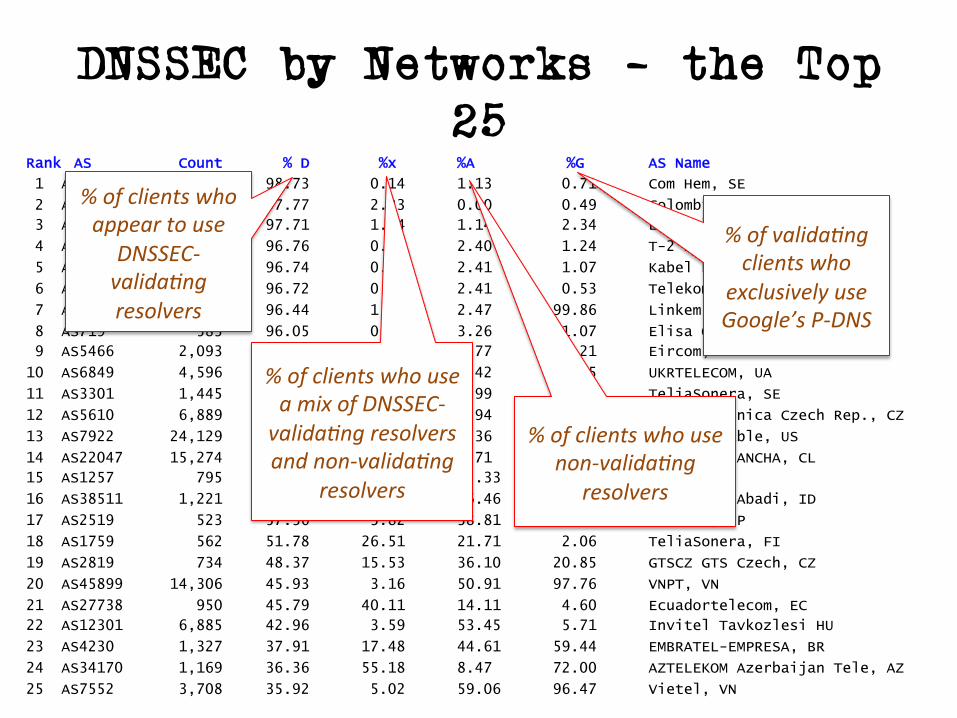
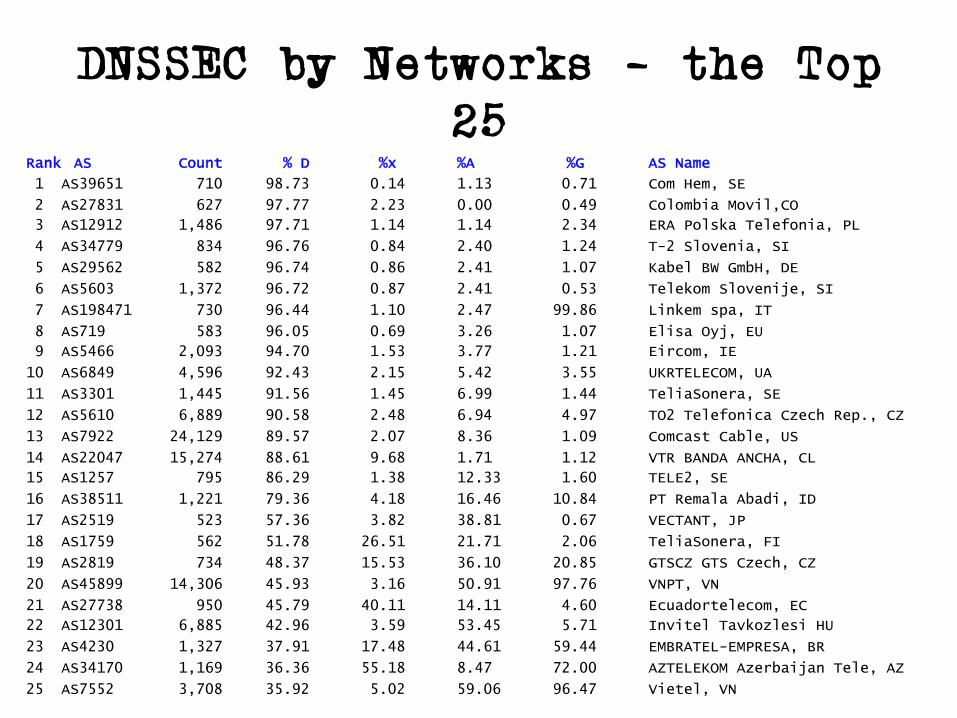
DNSSEC by Networks – the Top 25
Rank AS Count % D %x %A %G AS Name
1 AS39651 710 98.73 0.14 1.13 0.71 Com Hem, SE
2 AS27831 627 97.77 2.23 0.00 0.49 Colombia Movil,CO
3 AS12912 1,486 97.71 1.14 1.14 2.34 ERA Polska Telefonia, PL
4 AS34779 834 96.76 0.84 2.40 1.24 T-2 Slovenia, SI
5 AS29562 582 96.74 0.86 2.41 1.07 Kabel BW GmbH, DE
6 AS5603 1,372 96.72 0.87 2.41 0.53 Telekom Slovenije, SI
7 AS198471 730 96.44 1.10 2.47 99.86 Linkem spa, IT
8 AS719 583 96.05 0.69 3.26 1.07 Elisa Oyj, EU
9 AS5466 2,093 94.70 1.53 3.77 1.21 Eircom, IE
10 AS6849 4,596 92.43 2.15 5.42 3.55 UKRTELECOM, UA
11 AS3301 1,445 91.56 1.45 6.99 1.44 TeliaSonera, SE
12 AS5610 6,889 90.58 2.48 6.94 4.97 TO2 Telefonica Czech Rep., CZ
13 AS7922 24,129 89.57 2.07 8.36 1.09 Comcast Cable, US
14 AS22047 15,274 88.61 9.68 1.71 1.12 VTR BANDA ANCHA, CL
15 AS1257 795 86.29 1.38 12.33 1.60 TELE2, SE
16 AS38511 1,221 79.36 4.18 16.46 10.84 PT Remala Abadi, ID
17 AS2519 523 57.36 3.82 38.81 0.67 VECTANT, JP
18 AS1759 562 51.78 26.51 21.71 2.06 TeliaSonera, FI
19 AS2819 734 48.37 15.53 36.10 20.85 GTSCZ GTS Czech, CZ
20 AS45899 14,306 45.93 3.16 50.91 97.76 VNPT, VN
21 AS27738 950 45.79 40.11 14.11 4.60 Ecuadortelecom, EC
22 AS12301 6,885 42.96 3.59 53.45 5.71 Invitel Tavkozlesi HU
23 AS4230 1,327 37.91 17.48 44.61 59.44 EMBRATEL-EMPRESA, BR
24 AS34170 1,169 36.36 55.18 8.47 72.00 AZTELEKOM Azerbaijan Tele, AZ
25 AS7552 3,708 35.92 5.02 59.06 96.47 Vietel, VN
% of clients who appear to use
DNSSEC-‐valida4ng resolvers
% of clients who use a mix of DNSSEC-‐valida4ng resolvers and non-‐valida4ng
resolvers
% of clients who use non-‐valida4ng
resolvers
% of valida4ng clients who
exclusively use Google’s P-‐DNS
DNSSEC by Networks – the Top 25
Rank AS Count % D %x %A %G AS Name
1 AS39651 710 98.73 0.14 1.13 0.71 Com Hem, SE
2 AS27831 627 97.77 2.23 0.00 0.49 Colombia Movil,CO
3 AS12912 1,486 97.71 1.14 1.14 2.34 ERA Polska Telefonia, PL
4 AS34779 834 96.76 0.84 2.40 1.24 T-2 Slovenia, SI
5 AS29562 582 96.74 0.86 2.41 1.07 Kabel BW GmbH, DE
6 AS5603 1,372 96.72 0.87 2.41 0.53 Telekom Slovenije, SI
7 AS198471 730 96.44 1.10 2.47 99.86 Linkem spa, IT
8 AS719 583 96.05 0.69 3.26 1.07 Elisa Oyj, EU
9 AS5466 2,093 94.70 1.53 3.77 1.21 Eircom, IE
10 AS6849 4,596 92.43 2.15 5.42 3.55 UKRTELECOM, UA
11 AS3301 1,445 91.56 1.45 6.99 1.44 TeliaSonera, SE
12 AS5610 6,889 90.58 2.48 6.94 4.97 TO2 Telefonica Czech Rep., CZ
13 AS7922 24,129 89.57 2.07 8.36 1.09 Comcast Cable, US
14 AS22047 15,274 88.61 9.68 1.71 1.12 VTR BANDA ANCHA, CL
15 AS1257 795 86.29 1.38 12.33 1.60 TELE2, SE
16 AS38511 1,221 79.36 4.18 16.46 10.84 PT Remala Abadi, ID
17 AS2519 523 57.36 3.82 38.81 0.67 VECTANT, JP
18 AS1759 562 51.78 26.51 21.71 2.06 TeliaSonera, FI
19 AS2819 734 48.37 15.53 36.10 20.85 GTSCZ GTS Czech, CZ
20 AS45899 14,306 45.93 3.16 50.91 97.76 VNPT, VN
21 AS27738 950 45.79 40.11 14.11 4.60 Ecuadortelecom, EC
22 AS12301 6,885 42.96 3.59 53.45 5.71 Invitel Tavkozlesi HU
23 AS4230 1,327 37.91 17.48 44.61 59.44 EMBRATEL-EMPRESA, BR
24 AS34170 1,169 36.36 55.18 8.47 72.00 AZTELEKOM Azerbaijan Tele, AZ
25 AS7552 3,708 35.92 5.02 59.06 96.47 Vietel, VN

Aside: Google’s Public DNS
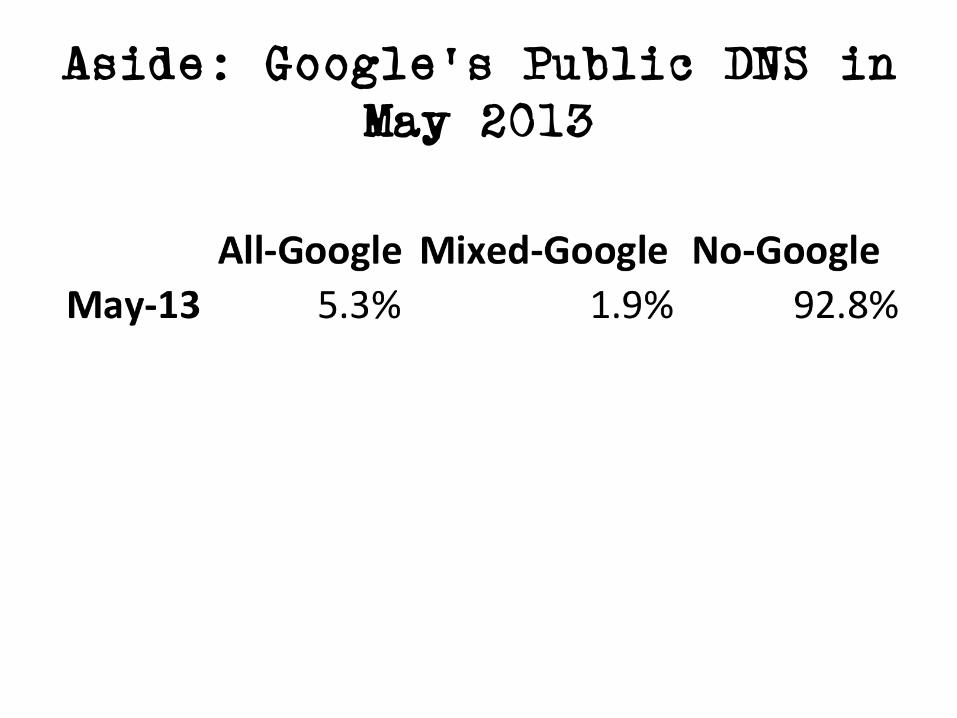
Aside: Google’s Public DNS in May 2013

But then something changed
All#Google Mixed#Google No#GoogleMay#13 5.3% 1.9% 92.8%Jul#13 4.6% 2.1% 93.4%Aug#13 4.4% 2.1% 93.5%Sep#13 4.7% 2.1% 93.2%
hdp://en.wikipedia.org/wiki/Edward_Snowden
June 2013

And Afterwards?
All#Google Mixed#Google No#GoogleMay#13 5.3% 1.9% 92.8%Jul#13 4.6% 2.1% 93.4%Aug#13 4.4% 2.1% 93.5%Sep#13 4.7% 2.1% 93.2%
June 2013
hdp://en.wikipedia.org/wiki/Edward_Snowden

Who Used Google’s Public DNS in September?
Rank CC Count %_All %_Some%_Not DNSSEC %_All %_Some%_None Country 1 VN 9140 44.37 2.81 52.82 3573 97.90 1.60 0.50 Vietnam 2 NG 396 31.57 14.14 54.29 26 88.46 11.54 0.00 Nigeria 3 GT 945 24.44 8.47 67.09 121 64.46 14.05 21.49 Guatemala 4 AM 333 23.42 1.80 74.77 69 94.20 2.90 2.90 Armenia 5 AZ 507 21.10 22.88 56.02 95 72.63 8.42 18.95 Azerbaijan 6 BD 1623 20.09 10.35 69.56 135 68.89 24.44 6.67 Bangladesh 7 JM 566 19.96 2.65 77.39 96 95.83 4.17 0.00 Jamaica 8 HN 590 19.83 19.83 60.34 39 92.31 7.69 0.00 Honduras 9 ID 15295 18.69 5.58 75.74 2757 83.90 5.91 10.19 Indonesia 10 DZ 6966 17.73 35.59 46.68 1202 78.62 20.80 0.58 Algeria 11 IQ 982 16.90 12.12 70.98 98 45.92 33.67 20.41 Iraq 12 GH 459 16.56 12.20 71.24 33 96.97 3.03 0.00 Ghana 13 PS 789 14.83 15.59 69.58 176 46.59 31.82 21.59 Occupied Pales3nian Territory 14 TZ 305 14.43 20.33 65.25 11 90.91 9.09 0.00 United Republic of Tanzania 15 TR 42456 12.91 1.83 85.26 4671 93.79 3.64 2.57 Turkey 16 MY 18190 12.13 3.02 84.85 1789 90.16 4.36 5.48 Malaysia 17 EG 11876 12.10 4.57 83.33 1161 93.20 6.46 0.34 Egypt 18 CR 522 11.30 2.30 86.40 33 90.91 9.09 0.00 Costa Rica 19 BR 34997 11.14 3.40 85.46 4323 60.33 9.14 30.53 Brazil 20 IT 28909 11.12 0.90 87.98 3609 72.10 1.52 26.38 Italy 21 UA 5808 10.88 2.74 86.38 1364 20.09 2.42 77.49 Ukraine 22 LB 651 9.37 10.29 80.34 72 38.89 27.78 33.33 Lebanon 23 CM 261 8.43 19.54 72.03 37 43.24 40.54 16.22 Cameroon 24 PA 968 8.16 1.55 90.29 68 100.00 0.00 0.00 Panama 25 AL 858 8.16 2.21 89.63 47 95.74 2.13 2.13 Albania 26 KE 817 8.08 11.14 80.78 64 60.94 25.00 14.06 Kenya 27 AR 14981 7.94 3.04 89.02 1066 75.14 10.13 14.73 Argen3na 28 CZ 5099 7.92 3.43 88.64 1580 12.03 4.18 83.80 Czech Republic 29 MK 802 7.86 0.50 91.65 41 90.24 0.00 9.76 The former Yugoslav Republic of Macedonia 30 UG 324 7.72 8.64 83.64 22 77.27 22.73 0.00 Uganda 31 KZ 653 7.35 5.21 87.44 41 68.29 31.71 0.00 Kazakhstan

Who Turned Google OFF? Rank CC Delta OFF MAY% SEP % Country 1 NI 37.77% 56.15% 18.38% Nicaragua 2 PS 22.73% 53.15% 30.42% Occupied Pales3nian Territory 3 BO 21.54% 33.28% 11.74% Bolivia 4 BN 10.27% 56.10% 45.83% Brunei Darussalam 5 KE 8.28% 27.50% 19.22% Kenya 6 AL 6.41% 16.78% 10.37% Albania 7 LA 6.36% 26.00% 19.64% Lao People's Democra3c Republic 8 MZ 6.33% 17.54% 11.21% Mozambique 9 PK 6.18% 18.27% 12.09% Pakistan 10 JM 5.34% 27.95% 22.61% Jamaica 11 TR 5.25% 19.99% 14.74% Turkey 12 AZ 5.17% 49.15% 43.98% Azerbaijan 13 TZ 4.98% 39.73% 34.75% United Republic of Tanzania 14 GT 3.54% 36.45% 32.91% Guatemala 15 BA 3.17% 9.05% 5.88% Bosnia and Herzegovina 16 SR 2.59% 5.09% 2.50% Suriname 17 IT 2.38% 14.40% 12.02% Italy 18 EG 2.21% 18.88% 16.67% Egypt 19 UG 2.11% 18.47% 16.36% Uganda 20 AF 2.10% 50.25% 48.15% Afghanistan 21 AO 1.93% 27.86% 25.93% Angola 22 JO 1.92% 5.37% 3.45% Jordan 23 SI 1.82% 6.25% 4.43% Slovenia 24 LY 1.65% 10.74% 9.09% Libya 25 JP 1.56% 3.74% 2.18% Japan 26 KG 1.33% 8.91% 7.58% Kyrgyzstan 27 PR 1.25% 11.61% 10.36% Puerto Rico 28 PA 1.10% 10.81% 9.71% Panama 29 TW 1.07% 6.35% 5.28% Taiwan 30 FJ 0.99% 14.29% 13.30% Fiji
% of users per country who reduced their use of Google’s Public DNS: May to September

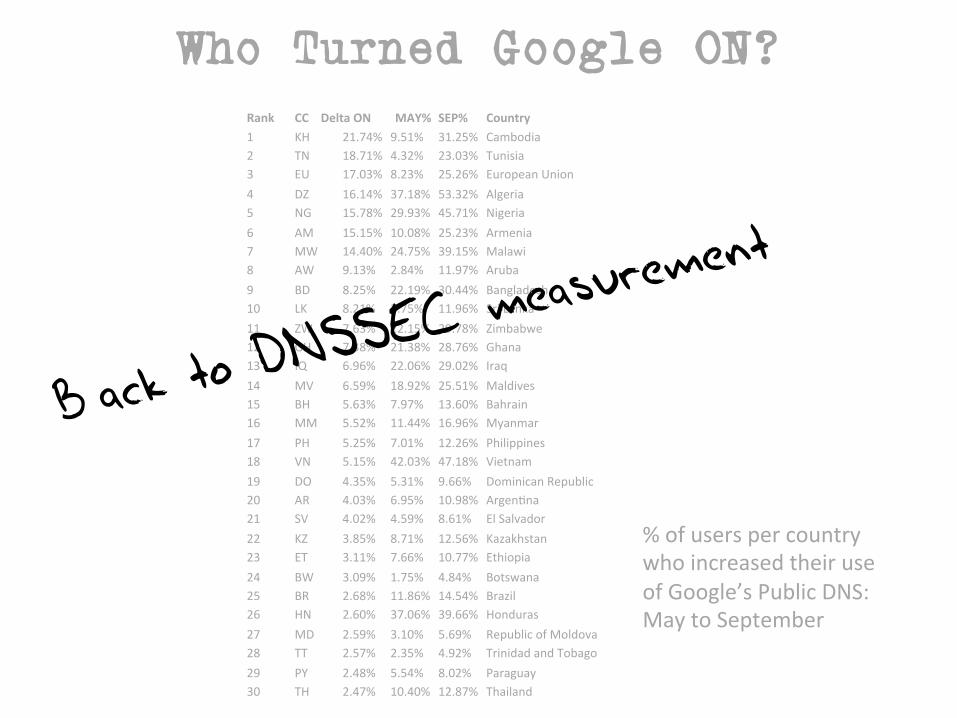
Who Turned Google ON? Rank CC Delta ON MAY% SEP% Country 1 KH 21.74% 9.51% 31.25% Cambodia 2 TN 18.71% 4.32% 23.03% Tunisia 3 EU 17.03% 8.23% 25.26% European Union 4 DZ 16.14% 37.18% 53.32% Algeria 5 NG 15.78% 29.93% 45.71% Nigeria 6 AM 15.15% 10.08% 25.23% Armenia 7 MW 14.40% 24.75% 39.15% Malawi 8 AW 9.13% 2.84% 11.97% Aruba 9 BD 8.25% 22.19% 30.44% Bangladesh 10 LK 8.21% 3.75% 11.96% Sri Lanka 11 ZW 7.63% 22.15% 29.78% Zimbabwe 12 GH 7.38% 21.38% 28.76% Ghana 13 IQ 6.96% 22.06% 29.02% Iraq 14 MV 6.59% 18.92% 25.51% Maldives 15 BH 5.63% 7.97% 13.60% Bahrain 16 MM 5.52% 11.44% 16.96% Myanmar 17 PH 5.25% 7.01% 12.26% Philippines 18 VN 5.15% 42.03% 47.18% Vietnam 19 DO 4.35% 5.31% 9.66% Dominican Republic 20 AR 4.03% 6.95% 10.98% Argen3na 21 SV 4.02% 4.59% 8.61% El Salvador 22 KZ 3.85% 8.71% 12.56% Kazakhstan 23 ET 3.11% 7.66% 10.77% Ethiopia 24 BW 3.09% 1.75% 4.84% Botswana 25 BR 2.68% 11.86% 14.54% Brazil 26 HN 2.60% 37.06% 39.66% Honduras 27 MD 2.59% 3.10% 5.69% Republic of Moldova 28 TT 2.57% 2.35% 4.92% Trinidad and Tobago 29 PY 2.48% 5.54% 8.02% Paraguay 30 TH 2.47% 10.40% 12.87% Thailand
% of users per country who increased their use of Google’s Public DNS: May to September
Back to DNSSEC measurem
ent

DNS Performance
How can we measure the 3me taken to resolve each of the three domain name types (signed, unsigned, badly signed)?
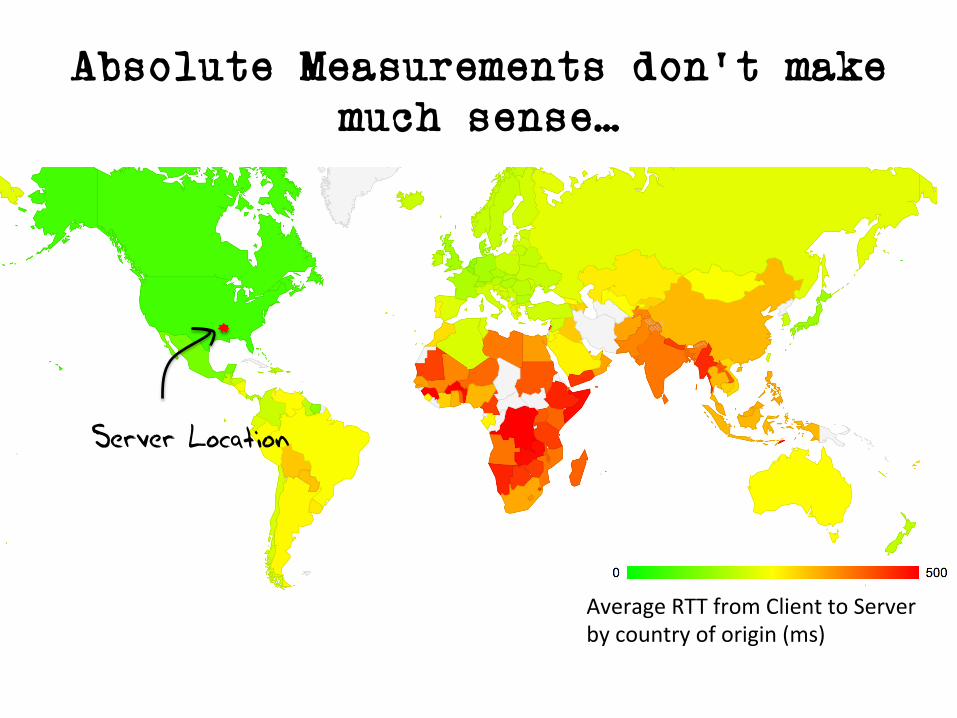
Absolute Measurements don’t make much sense…
Average RTT from Client to Server by country of origin (ms)
Server Location

Relative Measurements …
Let’s define the FETCH TIME as the 3me at the authorita3ve server from the first DNS query for an object to the HTTP GET command for the same object This 3me should reflect the DNS resolu3on 3me and a single RTT interval for the TCP handshake
If the “base” fetch 3me is the 3me to load an unsigned DNSSEC object, then how much longer does it take to load an object that is DNSSEC-‐signed?

Theory…
The addi3onal delay here is due to the minimum of 2 addi3onal DNSSEC RR fetches when the resolver is performing valida3on
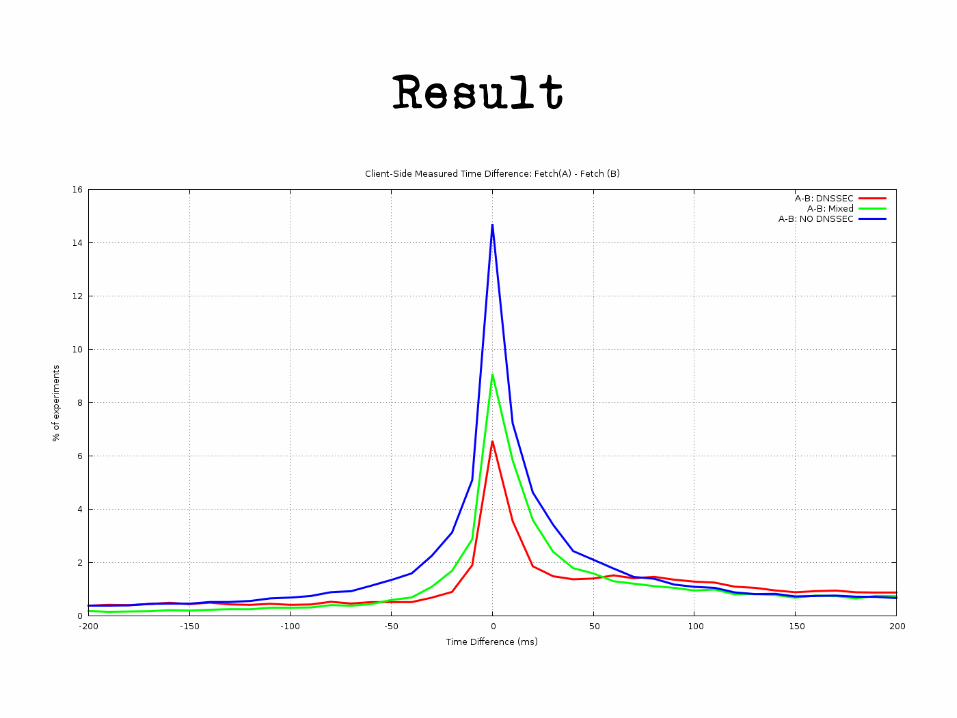
Result

Well…
• That didn’t work as intended! • The client is running a Flash Engine, and it appears when when you use ac3on code to load up addi3onal URLS then: – The order that the flash engine performs the load is not the same as the order in the ac3on code!
– There appears to be an explicit scheduling interval between name resolu3on phase and the scheduling of the object fetch
– Flash Engines appear to use a scheduler that is difficult to understand from this data!
Well…
• There is a slight lev/right difference in this data, but its difficult to conclude that fetches of DNSSEC-‐signed objects is consistently slower for clients using DNSSEC-‐resolving resolvers
• So lets focus on the DNS queries – And measure the elapsed 3me from the first seen to the last seen DNS query for each instance of the experiment

DNS Query Time

DNS Query Time
This is more like what we expected to see! • For most clients the 3me taken to perform the DNS
queries for the DNSSEC-‐signed names is longer than the unsigned name
• The 3me taken to perform the DNS queries for the invalidly-‐signed DNSSEC name is longer than the well-‐signed name
This is unexpected!
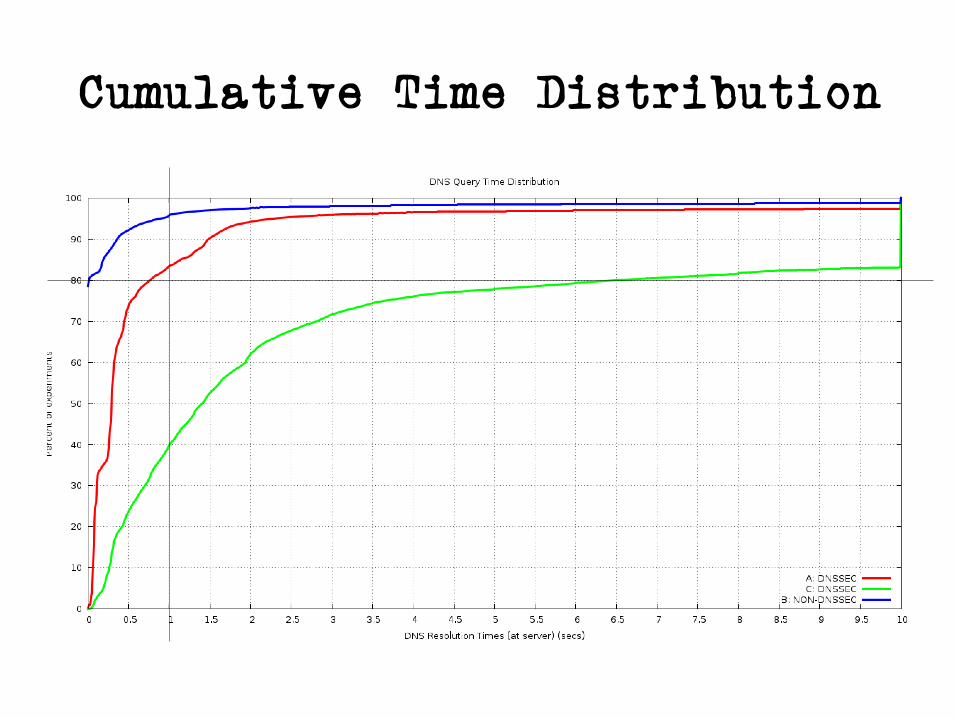
Cumulative Time Distribution

Cumulative Time Distribution
Badly-‐Signed
DNSSEC-‐Signed
UnSigned
If you perform DNSSEC valida4on, how long does it take to complete the DNS query process?
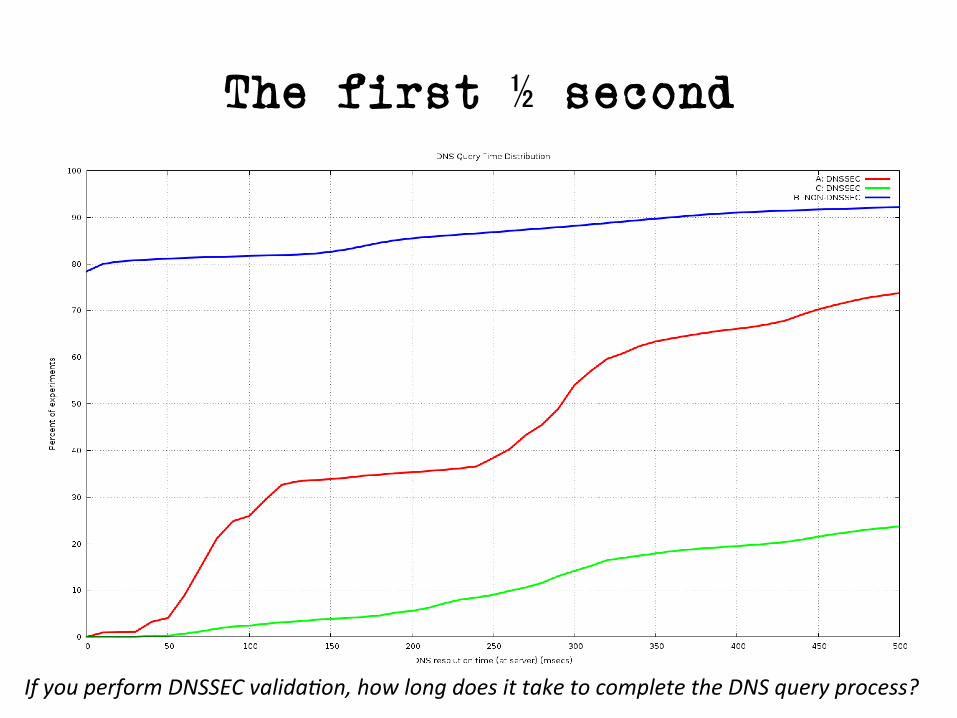
The first ½ second
If you perform DNSSEC valida4on, how long does it take to complete the DNS query process?
What can we say?
• DNSSEC takes longer – Addi3onal queries for DS and DNSKEY RRs – At a minimum that’s 2 DNS query/answer intervals • Because it appears that most resolvers serialize and perform resolu3on then valida3on
• Badly-‐Signed DNSSEC takes even longer – Resolvers try hard to find a good valida3on path – And the SERVFAIL response causes clients to try subsequent resolvers in their list
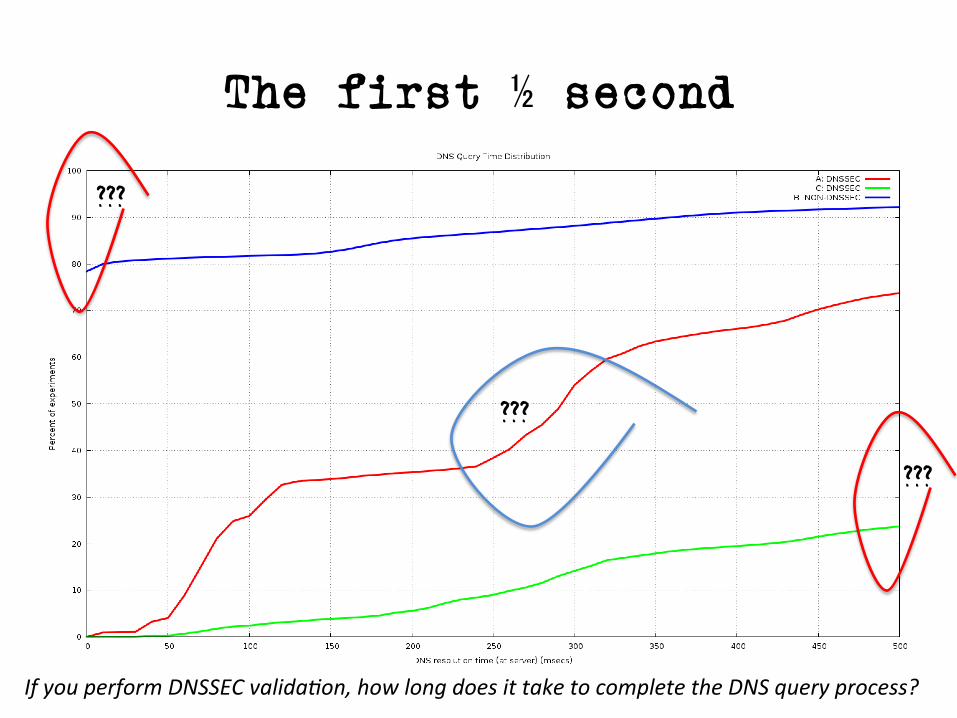
The first ½ second
If you perform DNSSEC valida4on, how long does it take to complete the DNS query process?
???
???
???

At the other end…
Lets look at performance from the perspec3ve of an Authorita3ve Name server who serves DNSSEC-‐signed domain names

DNS Query count per Domain Name
No DNSSEC (control)
DNSSEC signed
DNSSEC signed – badly!
If you perform DNSSEC valida4on, how many queries are made for you at the Auth. Server?

DNSSEC Performance
At the Authorita3ve Name Server: Serving DNSSEC-‐signed zones = More Queries! – The Authorita3ve server will now see addi3onal queries for the DNSKEY and DS RRs for a zone, in addi3on to the A (and AAAA) queries
2,637,091 launched experiments
4,222,352 unsigned name queries 7,394,794 signed name queries 12,213,677 badly-‐signed name queries
What if everybody was doing it?
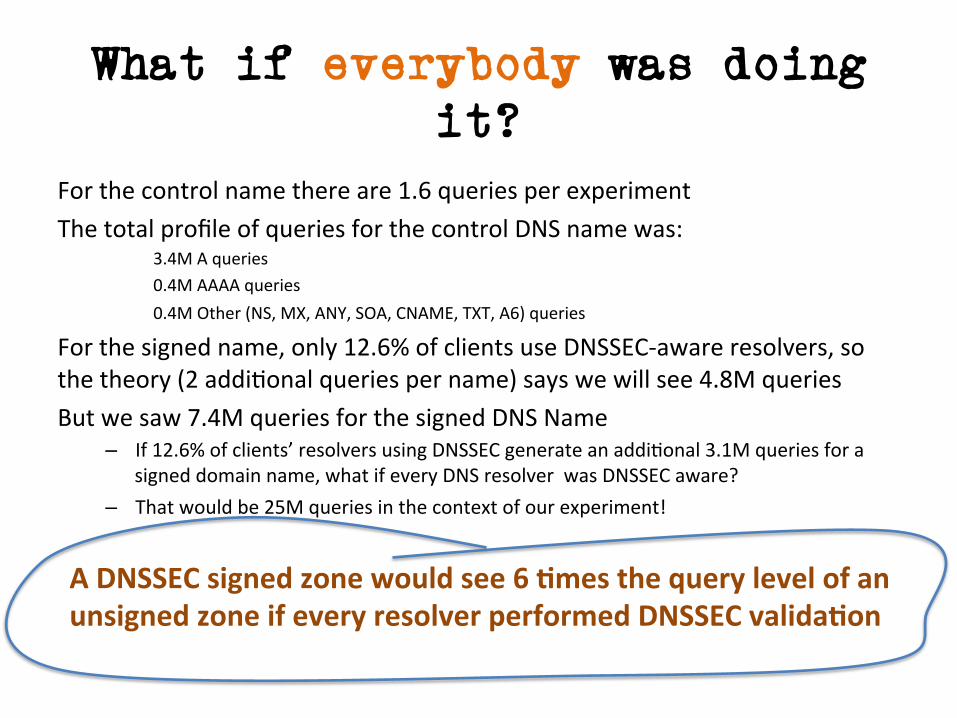
For the control name there are 1.6 queries per experiment The total profile of queries for the control DNS name was:
3.4M A queries 0.4M AAAA queries 0.4M Other (NS, MX, ANY, SOA, CNAME, TXT, A6) queries
For the signed name, only 12.6% of clients use DNSSEC-‐aware resolvers, so the theory (2 addi3onal queries per name) says we will see 4.8M queries But we saw 7.4M queries for the signed DNS Name
– If 12.6% of clients’ resolvers using DNSSEC generate an addi3onal 3.1M queries for a signed domain name, what if every DNS resolver was DNSSEC aware?
– That would be 25M queries in the context of our experiment!
A DNSSEC signed zone would see 6 Lmes the query level of an unsigned zone if every resolver performed DNSSEC validaLon
Good vs Bad for Everyone
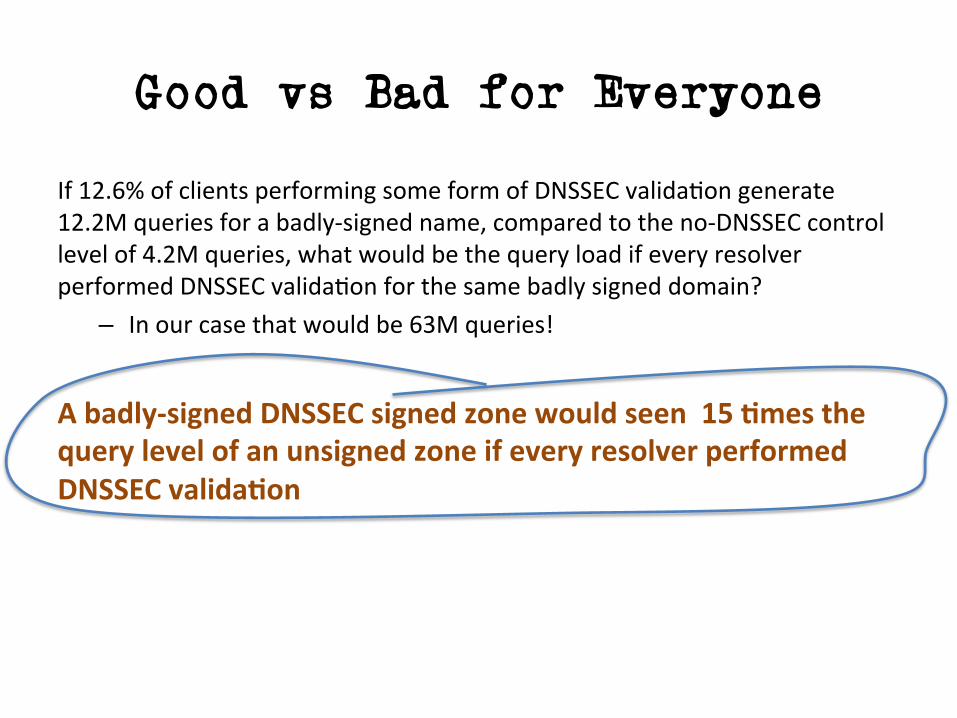
If 12.6% of clients performing some form of DNSSEC valida3on generate 12.2M queries for a badly-‐signed name, compared to the no-‐DNSSEC control level of 4.2M queries, what would be the query load if every resolver performed DNSSEC valida3on for the same badly signed domain?
– In our case that would be 63M queries!
A badly-‐signed DNSSEC signed zone would seen 15 Lmes the query level of an unsigned zone if every resolver performed DNSSEC validaLon
Response Sizes
What about the rela3ve traffic loads at the server? In par3cular, what are the rela3ve changes in the traffic profile for responses from the Authorita3ve Server?
DNS Response Sizes
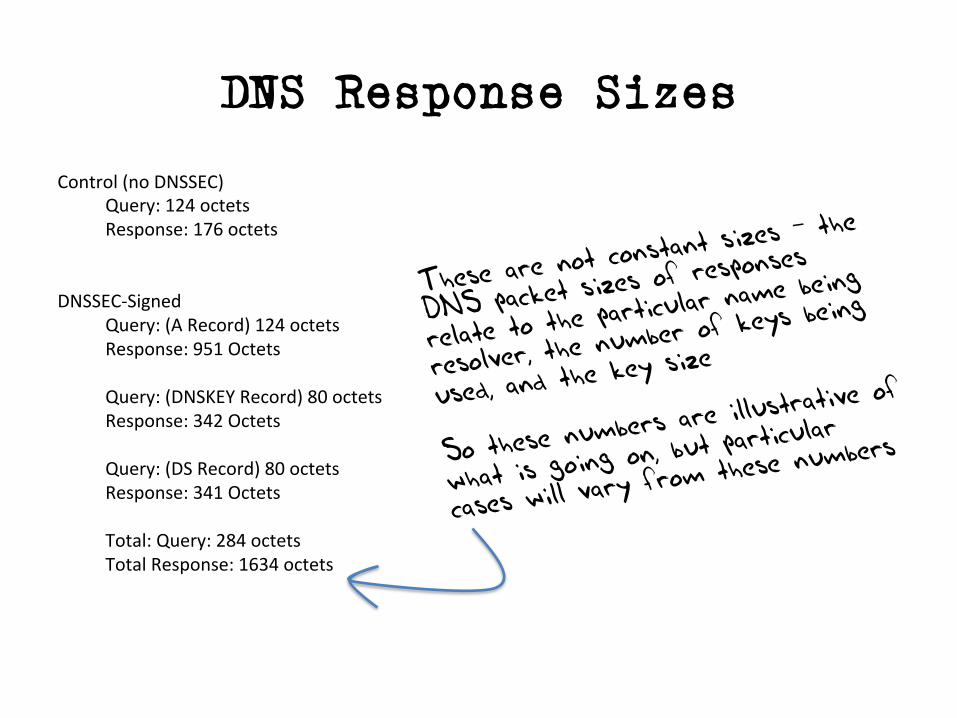
Control (no DNSSEC) Query: 124 octets Response: 176 octets
DNSSEC-‐Signed
Query: (A Record) 124 octets Response: 951 Octets
Query: (DNSKEY Record) 80 octets Response: 342 Octets
Query: (DS Record) 80 octets Response: 341 Octets
Total: Query: 284 octets Total Response: 1634 octets
These are not constant s
izes – the
DNS packet sizes of respon
ses
relate to the particular
name being
resolver, the number of keys
being
used, and the key size
So these nu
mbers are illustrative of
what is going on, but pa
rticular
cases will vary from these numbers

Measurement – Response Traffic Volume

Interpreting Traffic Data
• The validly-‐signed domain name appears to generate ~5x the traffic volume in responses as compared to the unsigned domain name
• The badly-‐signed domain name appears to generate ~7.5x the traffic volume in responses
• What’s contribu3ng to this? 1. Sezng the DNSSEC OK bit in a query to the signed zone raises
the response size from 176 to 951 octets 2. Performing DNSSEC signature valida3on adds a minimum of a
further 683 octets in the DS and DNSKEY responses
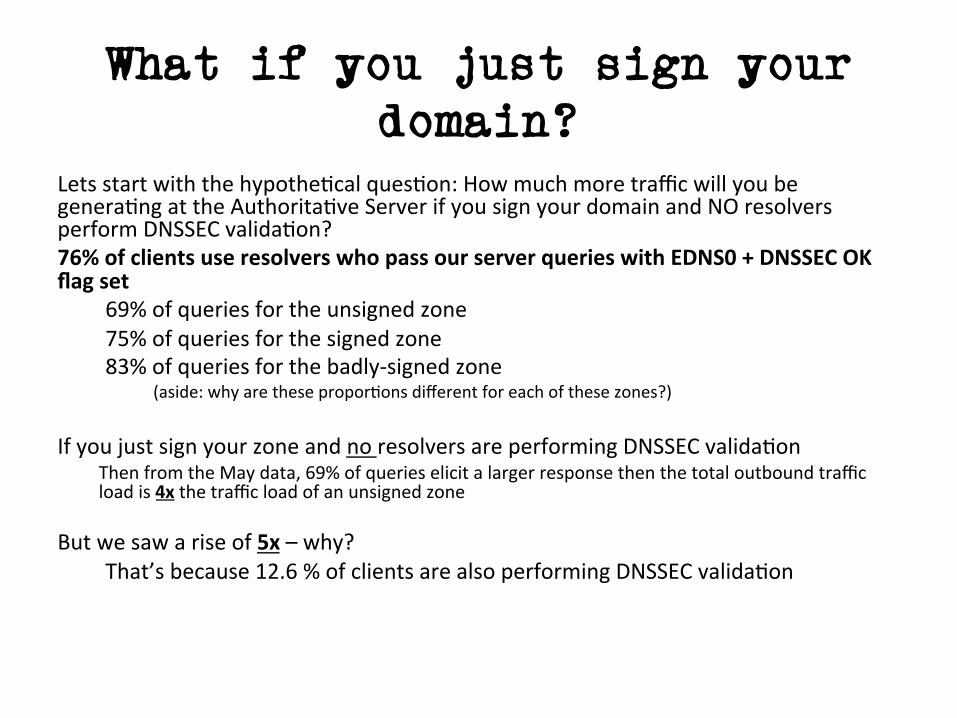
What if you just sign your domain?
Lets start with the hypothe3cal ques3on: How much more traffic will you be genera3ng at the Authorita3ve Server if you sign your domain and NO resolvers perform DNSSEC valida3on? 76% of clients use resolvers who pass our server queries with EDNS0 + DNSSEC OK flag set
69% of queries for the unsigned zone 75% of queries for the signed zone 83% of queries for the badly-‐signed zone (aside: why are these propor3ons different for each of these zones?)
If you just sign your zone and no resolvers are performing DNSSEC valida3on
Then from the May data, 69% of queries elicit a larger response then the total outbound traffic load is 4x the traffic load of an unsigned zone
But we saw a rise of 5x – why? That’s because 12.6 % of clients are also performing DNSSEC valida3on
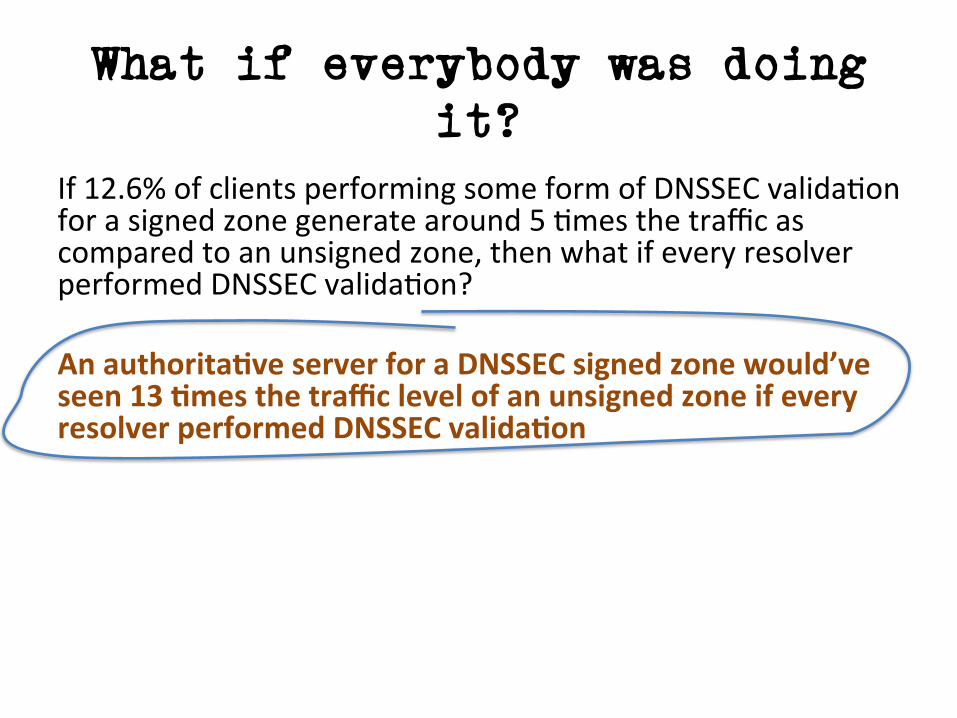
What if everybody was doing it?
If 12.6% of clients performing some form of DNSSEC valida3on for a signed zone generate around 5 3mes the traffic as compared to an unsigned zone, then what if every resolver performed DNSSEC valida3on? An authoritaLve server for a DNSSEC signed zone would’ve seen 13 Lmes the traffic level of an unsigned zone if every resolver performed DNSSEC validaLon

What if everybody was doing it?
If 12.6% of clients performing some form of DNSSEC valida3on for a signed zone generate around 5 3mes the traffic as compared to an unsigned zone, then what if every resolver performed DNSSEC valida3on? An authoritaLve server for a DNSSEC signed zone would’ve seen 13 Lmes the traffic level of an unsigned zone if every resolver performed DNSSEC validaLon A badly-‐signed DNSSEC zone would seen 31 Lmes the traffic level of an unsigned zone

DNSSEC means you probably need more Server Foo
• Its probably a good idea to plan the serve the worst case: a badly signed zone
• In which case you may want to consider provisioning the authorita3ve name servers with processing capacity to handle 15x the query load, and 30x the generated traffic load that you would need to serve an unsigned zone

It could be (a lot) better
“Real” performance of DNSSEC could be a lot beder than what we have observed here
We have deliberately negated any form of resolver caching – Every client receives a “unique” signed URL, and therefore every DNS resolver has to to perform A, DS and DNSKEY fetches for the unique label
– The Ad placement technique constantly searches for “fresh eyeballs”, so caching is not as efficient as it could be
– Conven3onal DNS caching would drama3cally change this picture • Our 16 day experiment generated 12,748,834 queries • A 7 day TTL would cut this to a roughly es3mated 2M queries

And it could be (a lot) worse
For the invalid DNSSEC case we deliberately limited the impact of invalidity on the server by using a single NS
– DNSSEC invalidity is not handled consistently by resolvers – Some resolvers will perform an exhaus3ve check of all possible NS valida3on paths in the event of DNSSEC valida3on failure See “Roll Over and Die” (hdp://www.potaroo.net/ispcol/2010-‐02/rollover.html)
– In this experiment we used a single NS record for the domains – If we had chosen to use mul3ple nameservers, or used a deeper-‐signed label path, or both, on the invalid label, then the query load would’ve been (a lot) higher
• Resolver caching of invalidly signed data is also unclear – so a break in the DNSSEC valida3on material may also change the caching behaviour of resolvers, and increase load at the server

Some things to think about
• DNSSEC generates very large responses from very small queries – Which makes it a highly effec3ve DDOS amplifier – Is relying on BCP38 going to work? – Do we need to think about DNS over TCP again? – But how many resolvers/firewalls/other middleware stuff support using TCP for DNS?
– What’s the impact on the authorita3ve server load and caching recursive resolver load when moving from UDP to TCP?

Some things to think about
• 1% of visible resolvers provide the server with 58% of the seen queries
• A few resolvers handle a very significant propor3on of the total query volume
• But there are an awful lot of small, old, and poorly maintained resolvers running old code out there too!

Some things to think about
SERVFAIL is not just a “DNSSEC valida3on is busted” signal – clients start walking through their resolver set asking the same query
– Which delays the client and loads the server • The moral argument: Failure should include a visible cost! • The expedient argument: nothing to see here, move along!
Maybe we need some richer signaling in the DNS for DNSSEC valida3on failure
Some things to think about
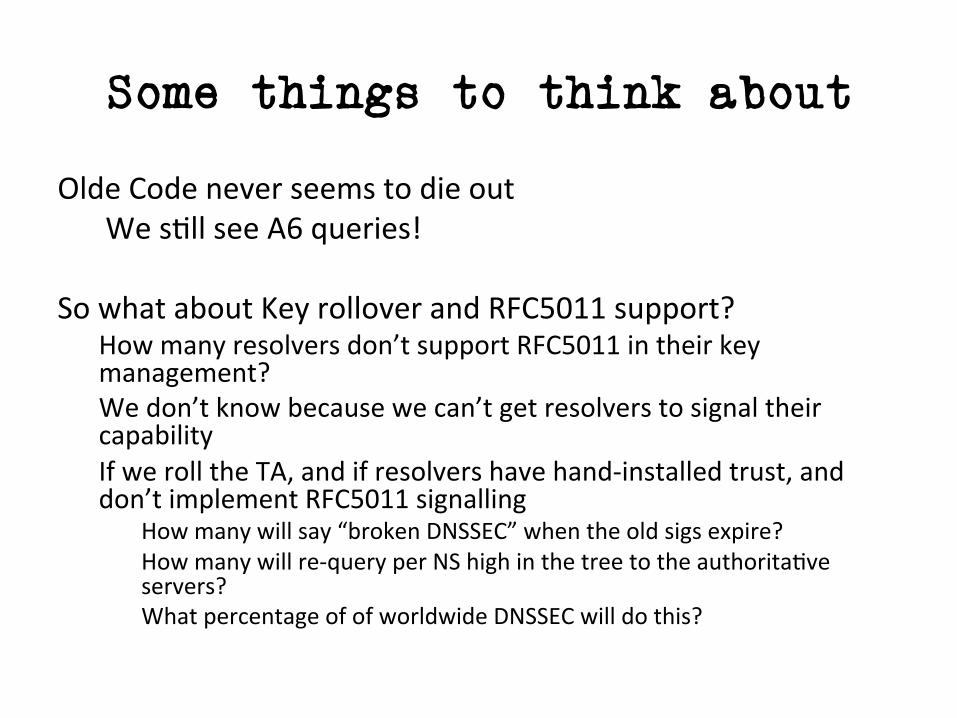
Olde Code never seems to die out We s3ll see A6 queries!
So what about Key rollover and RFC5011 support?
How many resolvers don’t support RFC5011 in their key management? We don’t know because we can’t get resolvers to signal their capability If we roll the TA, and if resolvers have hand-‐installed trust, and don’t implement RFC5011 signalling
How many will say “broken DNSSEC” when the old sigs expire? How many will re-‐query per NS high in the tree to the authorita3ve servers? What percentage of of worldwide DNSSEC will do this?
Some things to think about
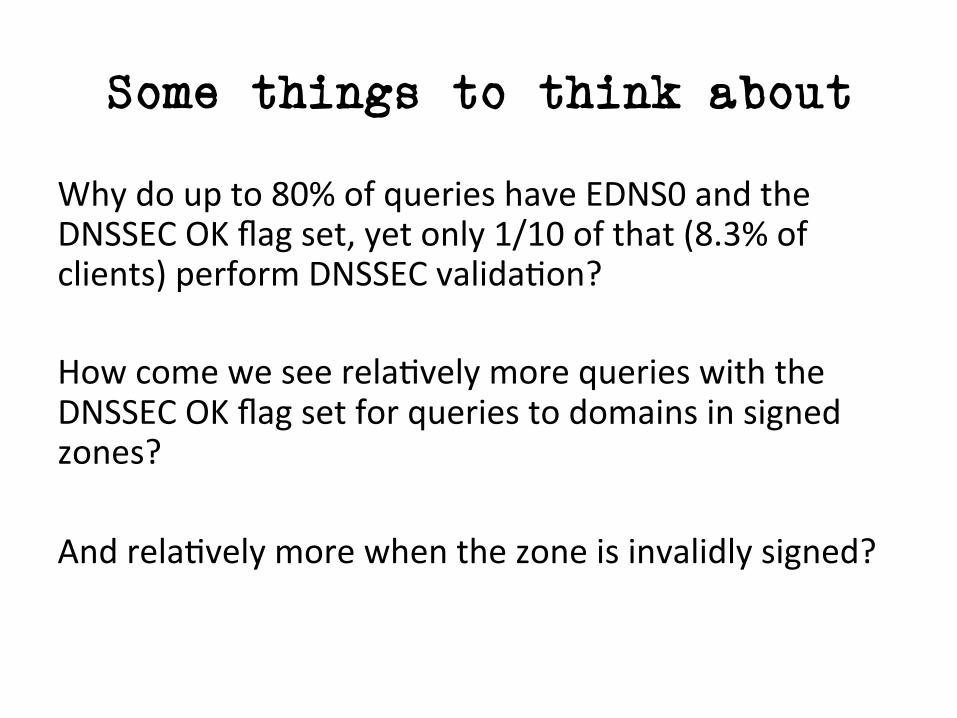
Why do up to 80% of queries have EDNS0 and the DNSSEC OK flag set, yet only 1/10 of that (8.3% of clients) perform DNSSEC valida3on?
How come we see rela3vely more queries with the DNSSEC OK flag set for queries to domains in signed zones? And rela3vely more when the zone is invalidly signed?
Some things to think about
• Google’s Public DNS is currently handling queries from 7.5% of the Internet’s end client popula3on – That’s around 1 in 13 users – In this 3me of heightened awareness about corporate and state surveillance, and issues around online anonymity and privacy, how do we feel about this level of use of Google’s Public DNS Service?

Thanks!
Questions?