measuring economic viability in a competitive italian market …€¦ · spread* raroc raroc band...
TRANSCRIPT

Edinburgh 26-28 August 2009
Measuring Economic Viability
in a Competitive Italian
Market Sector by Leveraging
Credit Bureau Data

©2009
Edinburgh 26-28 August 2009
2
Agenda
• CRIF
• Background � Market Overview
� Goals
• Methodology� Risk Adjusted Return On
Capital
� Capital Management
� Example
• Results
• Final Remarks
• Q & A

©2008
3
Edinburgh 26-28 August 2009
CRIF
Bologna, Italy
Rome, Italy
Mexico City, Mexico
Warsaw, Poland
Koper, Slovenia
Moscow, Russia
London, UK
Bangalore, India
Prague, Czech Rep.
Credit bureau
Decisioning
Business information
Software solutions forintegrated lending
Collection
Real estate information services
Software IT & Outsourcing
Bratislava, Slovak Rep.
Beijing, China
Bologna, Mestre, Italy
Atlanta, USA
Tampa, USA
Austin, USA
©2008
Edinburgh 26-28 August 2009
4
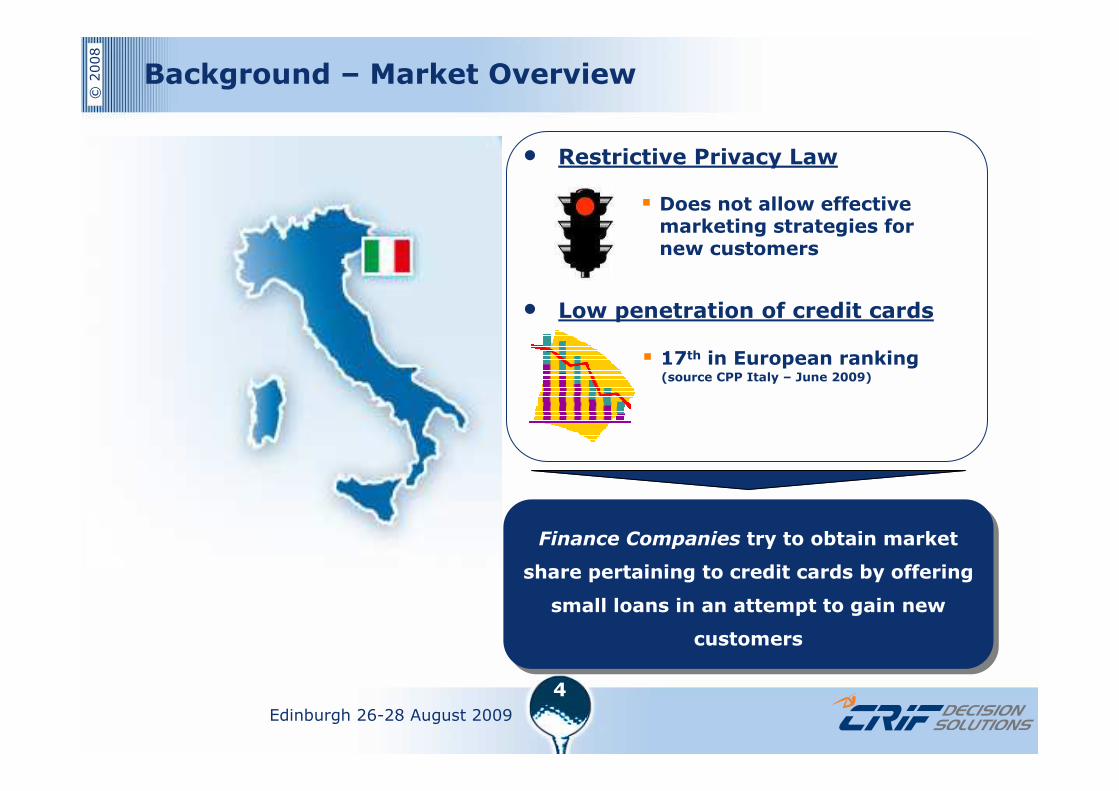
Background – Market Overview
• Restrictive Privacy Law
• Low penetration of credit cards
Finance Companies try to obtain market
share pertaining to credit cards by offering
small loans in an attempt to gain new
customers
Finance Companies try to obtain market
share pertaining to credit cards by offering
small loans in an attempt to gain new
customers
� Does not allow effective marketing strategies for new customers
� 17th in European ranking(source CPP Italy – June 2009)

©2008
Edinburgh 26-28 August 2009
5
Background – Market Overview
Finance Company Products
Clients
Dealer
New Customer Acquisition Schema New Customer Acquisition Schema
Finance Companies offer small loans through dealers
In order to capture new customers
To purchase furnishings, electronics and other consumer-based products
With very competitive and low interest rates
11 22
3344

©2008
Edinburgh 26-28 August 2009
6
Background – Market Overview
SMALL TICKET MARKET 2007 2008 Trend
Loan term 6-12 months 6-12 months
Applications Over 1m Over 1m
Funded contracts 80% 85%
Average Amount 1,080€ 1,020€
Funded Amount ~ 1,000m€ ~ 1,000m€
Lenders Over 20The same as 2007
+ 2
Average Contracts per Lender
~ 55,000 ~ 49,000
Average Contracts first 10 Lenders
~ 110,000 ~ 96,000
Market size remains stable
Competition increases
(source CRIF Credit Bureau)

©2008
Edinburgh 26-28 August 2009
7
Background – Market Overview
Step 2: Account Management
Value
Step 1: Acquisition
Lenders grant loans based on
other considerations such as
the potential for cross selling
Lenders grant loans based on
other considerations such as
the potential for cross selling
Customer Lifecycle
+
High Acquisition Cost
� High Fix Costs
� Low spread for the lender
Time
Credit Cards
Personal loans

©2008
Edinburgh 26-28 August 2009
8
Background – Goals of the Paper
To Measure the
Economic Viability of
this Market Sector
To Measure the
Economic Viability of
this Market Sector
To Show How to
Reduce Costs or..
To Show How to
Reduce Costs or..
…Create Value …Create Value
Focus in on AcquisitionFocus in on Acquisition
...by Leveraging Credit
Bureau Data
...by Leveraging Credit
Bureau Data
©2008
Edinburgh 26-28 August 2009
9
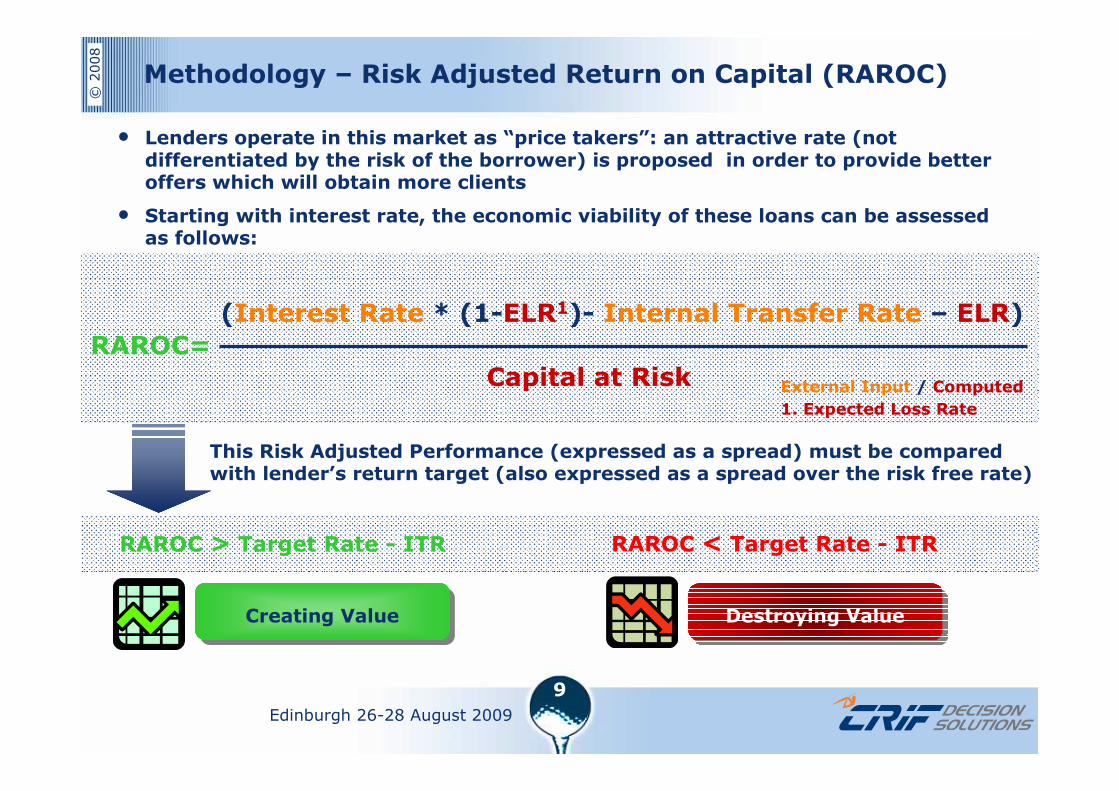
Methodology – Risk Adjusted Return on Capital (RAROC)
RAROC=
Capital at Risk
(Interest Rate * (1-ELR1)- Internal Transfer Rate – ELR)
External Input / Computed
RAROC > Target Rate - ITR RAROC < Target Rate - ITR
This Risk Adjusted Performance (expressed as a spread) must be compared with lender’s return target (also expressed as a spread over the risk free rate)
Destroying ValueCreating ValueCreating Value
• Lenders operate in this market as “price takers”: an attractive rate (not differentiated by the risk of the borrower) is proposed in order to provide better offers which will obtain more clients
• Starting with interest rate, the economic viability of these loans can be assessed as follows:
1. Expected Loss Rate

©2008
Edinburgh 26-28 August 2009
10
Methodology – Capital Management
Allocated Economic Capital
ELR LR at99.97% confidence level
Loss Rate
Probability Probability Density Function
of Losses (PDF)• Capital at Risk is the amount of capital needed to “reasonably” cover the risks being faced by a lender
• It can be measured using the concept of Value at Risk, as the maximum loss expected with a certain confidence interval, over a given period of time
There are many techniques to measure Capital at Risk, but in this case we use two specific approaches:
1. Basel II model: it measures capital requirements for regulatory purposes and is the most common in the Credit Industry
2. Beta model: another parametric approach used in order to define a more pessimistic scenario; empirical tests show that the Beta function is applicable, because of its asymmetric shape, which provides the highest value of CaR (higher unexpected losses)

©2008
Edinburgh 26-28 August 2009
11
Methodology – RAROC: An Example
RAROC=6%
(4.5% * (1- 0.4%)- 4% – 0.4%)
Suppose we have the following loan scenario:
From the previous equation we get:
= 1.6%
ELR: 0.4%
CaR: 6.0%
RAROC>=0%RAROC>=0%
Covering the cost of the unexpected loss
Losses Target
Which means a
Creating ValueCreating Value
Spread: 0.5%Spread: 0.5%
Pricing
A fix Rate of 4.5% split as followA fix Rate of 4.5% split as follow
Funding: 3.0%Funding: 3.0%
Costs
Dealer fee: 0.8%Dealer fee: 0.8%
Other costs: 0.2%Other costs: 0.2%

©2008
Edinburgh 26-28 August 2009
12
Results – Simulations (1)
Score Band % Total PD ELRCapital at Risk(Basel Formula)
Capital at Risk(Beta 99.97%)
High 1.8% 6.6% 3.0% 6.0% 8.1%
Medium-High 7.9% 4.1% 1.9% 5.7% 7.8%
Medium-Low 13.8% 2.9% 1.3% 5.3% 7.2%
Low 76.5% 0.8% 0.4% 3.6% 5.7%
Total 100% 1.5% 0.7%
LGD 45%LGD 45% EAD 100%EAD 100%
Probability of Default
at the end of loan term
The Credit Bureau Score at time of application was used to split the 2007 portfolio (booked) into 4 score bands.
For each score band, the Probability of Default, Expected Loss Rate and Capital at Risk were calculated.
Credit Bureau Score
at application time
CaR computed with the two approaches presented above

©2008
Edinburgh 26-28 August 2009
13
Results – Simulations (2)
Several simulations were made changing the credit spread from a range of 30BP
to 90BP. The following table shows the results for a spread of 70BP:
Cost of funding 4.5%Cost of funding 4.5% Other costs 1.2%Other costs 1.2% Target Rate 5.7%Target Rate 5.7%Parameters:
*Min Spread
1-ELR
(((Target Rate – Costs) * CaR)+ ELR+Costs)
– Costs
Score Band % TotalMin
Spread* RAROC RAROC Band
High 1.8% 3.3% -30.3%Destroying
Value
Medium-High 7.9% 2.3% -20.0%
DestroyingValue
Medium-Low 13.8% 1.2% -7.4%
DestroyingValue
Low 76.5% 0.4% 5.1%Creating Value
Total 100% 1.8%Creating Value
• For each score band we can
measure:
� Risk Adjusted Performance
� Minimum requested credit
spread to achieve the Target
Rate
� If these loans would
create/destroy value
=

©2008
14
Edinburgh 26-28 August 2009
Results – Simulations (3)
Score Band % Total RAROC % Total RAROC (2) % Total RAROC (3) % Total RAROC (4)
High 1.8% -30.3% 0.4% -30.3% 0.2% -30.3%
Medium-High 7.9% -20.0% 8.0% -20.0% 8.0% -20.0% 8.0% -20.0%
Medium-Low 13.8% -7.4% 14.0% -7.4% 14.0% -7.4% 14.1% -7.4%
Low 76.5% 5.1% 77.6% 5.1% 77.8% 5.1% 77.9% 5.1%
Total 100% 1.82% 100% 2.46% 100% 2.54% 100% 2.62%
3. Without High Risk
2. 10% overrides
1. 20% overrides
The impact of the “High Risk” score band on the risk adjusted performance was
calculated as follow:
How RAROC changes under different hypothesis:
1. Accepting 20% of High Risk band
2. Accepting 10% of High Risk band
3. Rejecting all High Risk band

©2008
Edinburgh 26-28 August 2009
15
Results - Economic Viability of this Market Sector
-5.7%
-3.2%
-0.7%
1.8%
4.3%
6.9%
-8.2%-9%
-7%
-5%
-3%
-1%
1%
3%
5%
7%
9%
30BP 40BP 50BP 60BP
70BP 80BP 90BP
Negative RAROC
Positive RAROC
The Graph shows the Portfolio RAROC (Basel approach) for the chosen spread range.
Break even: 70BP is the minimum requested spread in order to not erode value.
A credit spread of:
� 30BP means an acquisition cost of about 90€ per client
� 90BP means an earning of about 75€ per client
©2008
Edinburgh 26-28 August 2009
16
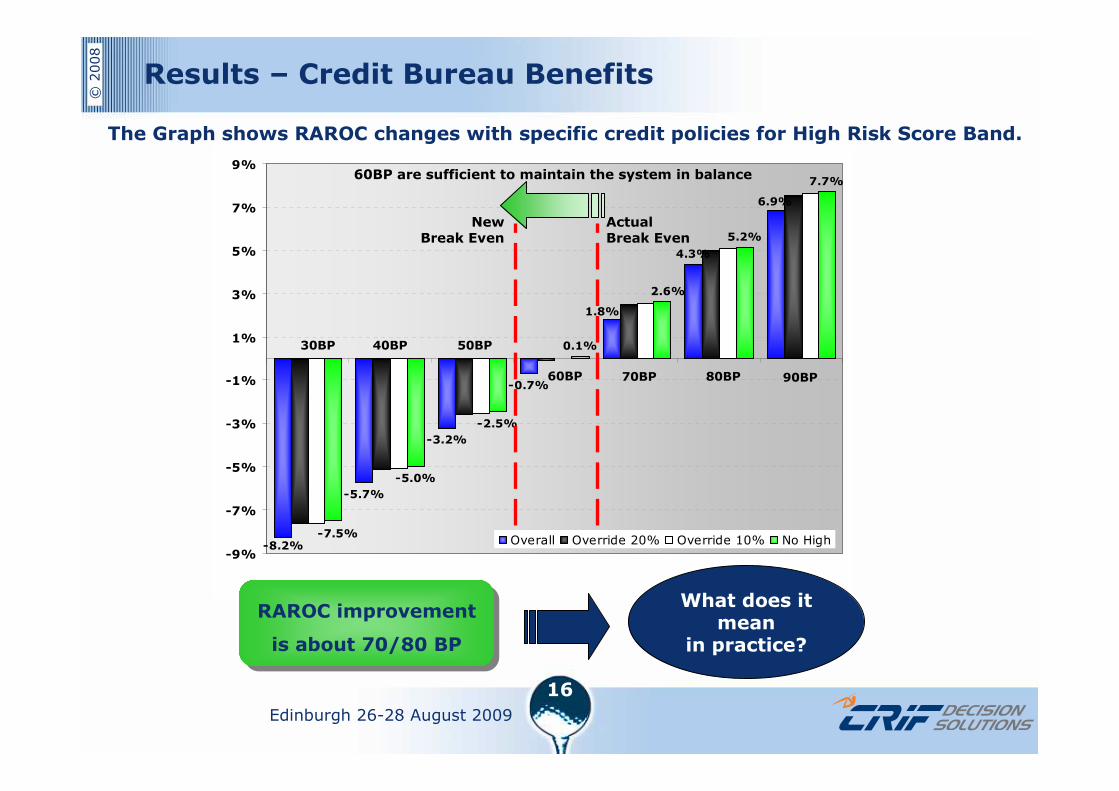
Results – Credit Bureau Benefits
-5.7%
-3.2%
-0.7%
4.3%
-5.0%
-2.5%
0.1%
5.2%
7.7%
-8.2%
6.9%
1.8%
2.6%
-7.5%
-9%
-7%
-5%
-3%
-1%
1%
3%
5%
7%
9%
Overall Override 20% Override 10% No High
30BP 40BP 50BP
60BP 70BP 80BP 90BP
Actual Break Even
New Break Even
60BP are sufficient to maintain the system in balance
The Graph shows RAROC changes with specific credit policies for High Risk Score Band.
RAROC improvement
is about 70/80 BP
RAROC improvement
is about 70/80 BP
What does it mean
in practice?

©2008
Edinburgh 26-28 August 2009
17
Results – Credit Bureau Benefits
6.4 €6.5 €
6.7 €6.8 €
6.9 €7.1 €
7.8 €
8.0 €
8.2 €
8.4 €
8.5 €8.7 €
6.2 €
8.9 €
6.0 €
6.5 €
7.0 €
7.5 €
8.0 €
8.5 €
9.0 €
30BP 40BP 50BP 60BP 70BP 80BP 90BP
Override 20% Override 10% No High
4.7 €4.7 €
4.8 €4.9 €
4.9 €5.0 €
5.1 €
5.9 €5.9 €
6.0 €6.1 €
6.2 €6.3 € 6.4 €
4.0 €
4.5 €
5.0 €
5.5 €
6.0 €
6.5 €
7.0 €
30BP 40BP 50BP 60BP 70BP 80BP 90BP
Override 20% Override 10% No High
• The graph shows, for each applied credit spread, how the marginal profit per contract may change managing “high risk” clients
• Reducing the number of high risk clients may increase the average profit per contract from about 6€ to 9€.
• For a portfolio of 50,000 contracts per year (the average for the reference market), a premium of about 300,000-450,000€.
Basel Approach
Beta Approach
• Even in a more pessimistic scenario reducing the number of high risk clients may increase the average profit per contract from about 5€ to 6.5€.
• For a portfolio of 50,000 contracts per year (the average for the reference market), a premium of about 250,000-325,000€.

©2008
Edinburgh 26-28 August 2009
18
Final Remarks
Historically, not all Italian lenders have utilized the credit bureau data in
decisioning for this specific type of portfolio.
This is due to:
� Low observed risk of default
� Reduced fixed costs from not purchasing the credit bureau data
This paper demonstrates that the risk is low, but:
� A small portion of the portfolio has a large impact on the risk adjusted
profitability because of the low credit spreads applied
� Managing risk via credit bureau data is an opportunity to create more economic
value
