measuring effectiveness of food quality management
TRANSCRIPT

Measuring effectiveness
of food quality management

Promotor: Prof. Dr. W.M.F. Jongen
Hoogleraar in Productontwerpen en Kwaliteitskunde
met bijzondere aandacht voor ketens
Co-promotoren: Dr. Ir. P.A. Luning
Universitair docent,
leerstoelgroep Productontwerpen en Kwaliteitskunde
Dr. Ir. G.W. Ziggers
Universitair docent, Katholieke Universiteit Nijmegen
Promotiecommissie: Prof. Dr. R. Verhé (Universiteit Gent, België)
Prof. Dr. O. van Kooten (Wageningen Universiteit)
Prof. Dr. Mr. B.M.J. van der Meulen (Wageningen Universiteit)
Dr. Ir. W.J. Marcelis (Wageningen Universiteit)

Measuring effectiveness
of food quality management
M. van der Spiegel
Proefschrift
Ter verkrijging van de graad van doctor
Op gezag van de rector magnificus
van Wageningen Universiteit,
Prof. Dr. Ir. L. Speelman,
in het openbaar te verdedigen
op vrijdag 14 mei 2004
des namiddags te 16.00 uur in de Aula

ISBN 90-8504-015-9

Aan mijn ouders


Contents
Abstract Chapter 1 General Introduction 1 Chapter 2 Evaluation of performance measurement instruments on their use 13
for food quality systems Chapter 3 Towards a conceptual model to measure effectiveness of 33
food quality systems Chapter 4 Development of the instrument IMAQE-Food to measure 49
effectiveness of food quality management Chapter 5 Validation of IMAQE-Food: Instrument for Management Assessment 73
and Quality Effectiveness in the Food sector Chapter 6 Assessment of effectiveness of food quality management 93
in the bakery sector Chapter 7 How to improve food quality management in the bakery sector 111 Chapter 8 General Discussion 131 Appendix Questionnaire 141 Summary 165 Samenvatting 169 Dankwoord 173 Curriculum vitae 177 List of publications 179 Training and supervision plan 181


Abstract
Spiegel, M. van der (2004). Measuring effectiveness of food quality management. PhD thesis, Wageningen University, the Netherlands, pp. 182. Keywords: effectiveness, food quality management, instrument, quality performance, contextual factors, agri-food production, conceptual model, performance measurement indicators, identification, validation, assessment, quality assurance systems, QA systems, HACCP, Hygiene code, ISO, BRC, GMP, bakery sector. In the last decade several incidents have occurred in the agri-food sector, such as the affairs of dioxin and BSE, whereas also the incidence of food-borne diseases and the production of higher risk products are increasing. In order to build and maintain trust of consumers in food quality and food safety, quality management is of major importance in the food sector. Food manufacturers use several quality assurance systems, like HACCP, ISO and BRC, to assure food quality. However, their effectiveness cannot be assessed because an instrument did not yet exist for the food industry. The aim of this thesis was to develop and validate an instrument that measures effectiveness of food quality management. This instrument enables the selection of appropriate QA systems and supports a proper application. A reliable and valid instrument �IMAQE-Food� was obtained that measures effectiveness of food quality management. The development was based on a structured procedure including a comprehensive literature research, development of a conceptual model, qualitative research, delphi sessions, quantitative research, and validation. IMAQE-Food is generic for the bakery sector and is expected to be applicable in other food sectors as well after small modifications. IMAQE-Food was used to investigate the effectiveness of food quality management in the bakery sector and to study the interdependency between the level of food quality management and the context of bakeries. Moreover, IMAQE-Food can also be used for assessment of quality performance and/or food quality management, obtaining insight in the interdependency between contextual factors and production quality, and analysing the appropriateness of QA systems in increasing the level of quality management to obtain a higher production quality. The insights of this study support food manufacturers in deciding which quality management activities are most suitable for their situation and how their objectives have to be achieved. Policy makers can use information about effectiveness to improve established QA systems and to develop effective implementation methods. This can result in a more effective quality management and an increased production quality, which will lead to more confidence of consumers in food production quality and improving competitiveness of food manufacturers. The developed methodology will also support other researchers to develop similar instruments. For application in other food sectors, IMAQE-Food could be further tailored using the structured procedure as described in this thesis.


1
General introduction

Chapter 1
2
1.1 Importance of food quality management
Food quality management has become increasingly important in the agri-food sector. The
perspective of quality management has been changed from quality inspection, quality control
and quality assurance, to total quality management 1-6. Quality has been more integrated in the
organisation culture; quality policy is more integrated in the strategy, quality management is
more found in all levels of the organisation, and quality is improved more continuously 5. In
the food industry, total quality management (TQM) is still not widely applied, however parts
of this concept are used 7, 8.
Simultaneously, the perspective of quality has been changed from physical product quality to
total quality like product quality, availability and costs. The perspective of production moves
increasingly from a product approach towards process and supply chain approaches 5.
In the last decade several incidents have occurred in the agri-food sector, such as Bovine
Spongiform Encephalopathy (BSE) and classical swine fever (CSF) in 1997, the dioxin affair
in 1999, foot and mouth disease (FMD) in 2001, the nitrophen and medroxyprogesteron
acetate (MPA) incidents in 2002, and the dioxin affair and Avian Influenza in 2003. These
incidents had an effect on food safety and health of animals 9-20.
Besides these specific affairs, the incidence of food-borne diseases is still increasing world-
wide 21, whereas the demography and lifestyle of consumers have also changed 21-24. The
proportion of elderly individuals in the population has grown, which increases the number of
people as risk for food-borne illness. Moreover, food is increasingly consumed outdoors.
Consumers prefer quick methods of food preparation. The consumption of convenience foods,
fresh and fresh-like foods, minimally processed foods, and foods that meet specific health
needs has increased. Due to an increased international trade and travel, consumers and
manufacturers are in touch with new types of products and processing methods, which
requires a more strict method of food control. To meet the consumer preferences and the
needs of a changing population, new processing, preservation and packaging techniques have
been incorporated into the manufacturing of food products and agriculture have been
intensified 21-26.
Due to these incidents, more food-borne diseases and higher risk products, quality awareness
of consumers has increased. Consequently, consumers have high demands on a broad range of
quality aspects like food safety, production characteristics, sensory properties, shelf life,
reliability, convenience, availability and quality/price ratio. Due to the consumer demands, the
end linkages of the supply chain e.g. retailers require guarantees of an appropriate production

General introduction
3
quality. Therefore, also other linkages such as farmers and food manufacturers have to
perform an appropriate food quality management, which is demonstrated by an increased
number of customers in the supply chain that requires the application of QA systems by their
suppliers.
1.2 Food quality management
What is food quality management? Food quality management consists of quality strategy and
policy, quality design, quality control, quality improvement, and quality assurance. These
activities are performed to produce and maintain a product with desired quality level against
minimal costs 27.
Food quality management is complicated because it involves the complex characteristics of
food and their raw materials due to variability, restricted shelf life, and the large range of (bio)
chemical, physical, and microbial processes. The food supply chain is also complex and
consists of a large number of linkages. Moreover, many people are involved in production
operations along the food supply chain. Therefore, human behaviour plays a crucial role due
to unpredictable and changeable handling.
Producing high quality food products requires a special approach due to the wide range of
factors in the food supply chain that can affect quality. Luning et al. 27, 28 proposed the techno-
managerial approach for food quality management as a way to analyse and solve the complex
quality issues. Both the use of technology to understand behaviour of living materials and the
use of managerial sciences to understand human behaviour are needed. Thus, both
technological aspects (i.e. food characteristics and technological conditions) and managerial
aspects (i.e. human behaviour and administrative conditions) should be managed.
1.2.1 Food characteristics and technological conditions
The quality of food products and raw materials change continuously and/or decrease rapidly
due to their variability or perishability. Food characteristics and process conditions have to be
analysed to know how these affect physical product properties. Examples of these aspects are
composition of raw materials and products, product structure, time-temperature profile during
processing, and composition of atmosphere within packaging. The relevant characteristics
have to be translated to proper control measures like control of respectively time-temperature

Chapter 1
4
conditions, raw materials, and final products. Typical measures to reduce effects of the
variation and perishability of food quality are selection of raw materials, processing and
preservation techniques, packaging, storage and distribution 29.
1.2.2 Quality behaviour and administrative conditions
Behaviour of the people within the context of the organisation also plays a crucial role in food
production. As a consequence, the result of agribusiness and food industry, as the combined
action of individuals working with agri-food products and striving for quality, is much more
uncertain than often is assumed 27.
Quality behaviour is dependent on the disposition and ability of employees 30. Disposition is
the employee�s own disposition to behave in a certain direction. Factors that influence the
disposition are e.g. knowledge of appropriate food production methods and standards,
information about the results. Ability is the objective opportunity to behave in a certain
direction. Factors that influence the ability are e.g. skills and competence, facilities and
means, and the availability of time. Typical measures to manage human aspects of food
production quality are e.g. providing suitable facilities, recruiting employees with required
skills and competencies, training and education, communication, motivational programs and
empowerment, and creating commitment.
The size of the organisation causes several problems for production quality. Many small and
medium enterprises in the agricultural and manufacturing sector have problems to produce
according to quality standards due to insufficient knowledge, time, resources, employees and
financial possibilities. Large companies have more problems to obtain commitment in the
total organisation, from workforce to top management. Besides, these companies often consist
of temporary employees with insufficient knowledge, motivation or linguistic skills.
1.3 Quality assurance systems
Food quality management has become increasingly important in food companies, which is
demonstrated in an increase of applied QA systems and higher requirements on these systems
by customers. QA systems differ in their characteristics i.e. aim, method, perspective, location
in supply chain, requirements, and composition (Table 1.1). These systems are distinguished
in basic and derived QA systems.

Table 1.1 Differences between QA systems and TQM with respect to aim, method, perspective, location in supply chain, and composition.
Characteristics GMP HACCP ISO 9001-3:1994
ISO 9001:2000
EUREP-GAP BRC SQF TQM
Food safety X X X X X X Product quality X X X X X X X X Organisation quality X X X X Environment, and health and safety at work
X X
Aim
Total quality X Plan of steps X X Checklist X X X X Guidelines X X
Method
Awards / Self-assessment X Technology X X X X X Perspective Management X X X X X X Agricultural sector X X X Manufacturing sector X X X X X X X
Location in supply chain
Retail X Composition Combination of QA
systems - - - - - GMP
HACCP ISO
HACCP ISO
-

Chapter 1
6
1.3.1 Basic quality assurance systems
The basic QA systems in the agri-food sector are GMP, HACCP and ISO.
GMP aims to combine procedures for manufacturing and quality control in such a way that
products are manufactured consistently to a quality appropriate to their intended use 31. GMP
consists of fundamental principles, procedures and means needed to design a suitable
environment for the production of food of acceptable quality. GMP-codes vary from general
guidelines to procedures that can be applied in a horizontal or a vertical supply chain. GMP
focuses on technology aspects 24. It creates the basic environmental and operating conditions
for food production. Therefore, the codes can be used as a basis for HACCP.
HACCP aims to assure the production of safe food products by identifying and controlling
the critical production steps 32, 33. It uses a systematic approach (i.e. a plan of steps) to the
identification, evaluation, and control of those steps in food manufacturing that are critical to
food safety. It is focused on technological aspects of the primary process. HACCP is included
in the Hygiene of Foodstuffs Directive 93/43/EEC.
ISO aims to achieve uniformity in products and/or services, and to prevent technical barriers
to trade throughout the world. It requires the establishment of all activities and handling in
procedures, which must be followed by ensuring clear assignment of responsibilities and
authority. The earlier ISO 9000:1994-series were focused on assuring customers that the
products meet the required specifications 24, 34. In the new standard ISO 9001:2000 a process
approach is used. It aims to achieve customer satisfaction by meeting customer requirements,
to improve the system continuously and to prevent nonconformity in products and/or services 35. ISO is a checklist to assure managerial aspects 24.
1.3.2 Derived quality assurance systems
Nowadays, the basic QA systems are often combined to assure several quality aspects, e.g. the
combination of HACCP and ISO 9000 3, 5, 36-38. Besides, directives are adjusted for integration
e.g. the ISO 15161 Guidance on the application of ISO 9001:2000 in the food and drink
industry 3, 5, 38, 39, and ISO will also develop a norm with requirements for food safety 40-42.
Moreover, QA systems are developed more specifically for an industry such as EUREP-GAP
(Euro Retailer Produce - Good Agricultural Practice), and are integrated in new systems such
as BRC (British Retail Consortium) 43-46 and SQF (Safe Quality Food) 47.
EUREP-GAP aims to maintain consumer confidence in food quality and safety, to minimise
detrimental impact on the environment and to conserve nature and wildlife, to reduce the use

General introduction
7
of agrochemicals, to improve the efficiency of natural resources use, and to ensure a
responsible attitude towards worker health and safety 48. EUREP-GAP is a world-wide
production standard for the production of agricultural products that are directly or indirectly
delivered to supermarkets. It is a checklist that contains minimum standards to the leading
retail groups in Europe with respect to food safety, welfare, environment, and health and
safety at work 47, 48.
BRC aims to assure product quality and food safety 46, 49. It is a technical standard for
companies supplying retail branded food products. BRC is a checklist that combines HACCP
with specific parts of GMP and parts of ISO 43-46. It is focused on both technological and
managerial aspects.
SQF aims to assure food quality and safety in the supply chain or successive linkages 47, 50, 51.
It consists of three standards based on the systematic of HACCP as described in the Codex
Alimentarius 51. SQF1000 is for the agricultural companies and low risk processing
companies, SQF2000 is for large supplying and processing industry (high-risk companies),
and SQF3000 is for the retail. It combines ISO and HACCP, although it also includes tracking
and tracing 47. It is focused on both technological and managerial aspects.
1.4 Measuring effectiveness of food quality management
Over the last few years, a large number of companies have implemented QA systems and total
quality management programmes in order to be able to achieve quality systems and to manage
food quality. Nevertheless, the implementation did not always result in the desired
performance due to aspects like company characteristics, insufficient quality behaviour and
inappropriate implementation methods 52.
Food manufacturers have to decide which quality management activities and QA systems are
most suitable for their specific situation, and how these activities and systems should be
implemented. Inappropriate management of food production operations can cause several
problems like product failures, safety problems, and loss of materials leading to customer
complaints and failure costs.
To make the right selection of appropriate quality management activities and QA systems, and
to obtain a proper application, the effectiveness has to be investigated. Effectiveness of food
quality management can be defined as the actual contribution of these activities to produce

Chapter 1
8
and maintain a product with desired quality level against minimal costs. For example,
HACCP is effective if it actually contributes to assurance of food safety.
The evaluation methods of QA systems and TQM consider the extent of implementation and
compliance with norms and requirements 53. Nevertheless, their effectiveness in assuring food
production quality is not measured.
For other industries, a broad range of instruments has been developed to measure performance
of quality management, for example Malcolm Baldrige National Quality Award, EFQM
Excellence Model, and the instrument by Saraph et al. 54. These instruments are not directly
applicable in agri-food production systems 55. Moreover, they do not analyse all relations
between production quality, quality management, and contextual factors, which is important
to measure effectiveness.
Therefore, the food industry requires an instrument that assesses effectiveness of food quality
management. Other authors have supported the need for such an instrument 35, 56.
1.5 Thesis
1.5.1 Aim of thesis and research method
The aim of this thesis is to develop and validate an instrument that measures effectiveness of
food quality management. This instrument is called IMAQE-Food [I make food], which is an
abbreviation for Instrument for Management Assessment and Quality Effectiveness in the
Food sector. IMAQE-Food has been designed and used to investigate the effectiveness of
food quality management and the effect of context of companies.
For the development of a reliable, valid and generic measurement instrument, literature
research, qualitative research (case studies), delphi sessions and quantitative research were
performed (Figure 1.1). For the quantitative research a food sector was selected that complies
with the following requirements:
- Size of the food sector should be large enough for the selection of an appropriate sample
size to apply statistic methods.
- The companies should vary in their contextual factors like QA systems, organisational
size, degree of automation, and product characteristics.
- The companies should be representative for the studied sector to use the results in
practice.

General introduction
9
Figure 1.1 Procedure of development and validation of IMAQE-Food.
Development IMAQE-Food
Identification of indicators
Selection: - Qualitative research - Delphi sessions
Verification: - Quantitative research
Analysis: - Literature research
Validation IMAQE-Food
Quantitative research
Evaluation: - Reliability - Validity - Generalisability
Development
conceptual model
Assessment
Chapter 2 Chapter 3
Chapter 6 Chapter 7
Chapter 5
Chapter 4

Chapter 1
10
For these reasons the bakery sector was selected. The procedure of development and
validation of IMAQE-Food is shown in Figure 1.1.
1.5.2 Outline of thesis
In Chapter 2 of this thesis, current performance measurement instruments are evaluated on
their use for food quality systems. In reviewing the literature, a broad range of instruments has
been developed in other industries to measure performance of quality management. However,
they cannot be used for measuring effectiveness of food quality systems. Three instruments
and an integrated approach were selected for the development of a conceptual model. In
Chapter 3 the development of the conceptual model that aims at developing an objective
diagnostic instrument is described. The purpose of Chapter 4 was to identify performance
measurement indicators of the instrument that measures effectiveness of food quality systems.
The development of the instrument IMAQE-Food is described. In Chapter 5 this instrument
is evaluated on generalisability, reliability and validity among a sample of 48 bakeries. This
evaluation resulted in a validated instrument that measures the effectiveness of food quality
management. Chapter 6 reports a study on the effectiveness of food quality management in
the bakery industry. The interdependency between the context of bakeries and the level of
food quality management was studied in Chapter 7. Quality management has to be simple
and explainable for its application in practice. In Chapter 8 the significance of this thesis for
food production systems will be discussed in a general discussion.
1.6 References
1. Dale, B.G. and Plunkett, J.J. (1990). Managing quality. New York: Philip Allen. 2. Golomski, W.A. (1993). Total Quality Management and the food industry: why is it important? Food
Technology, 47 (5), 74-79. 3. Koeleman, W.Ph.Th. (1995). Verandering in kwaliteitszorg: een onderzoek vanuit een veranderkundig
perspectief naar het invoeren van kwaliteitszorg bij middelgrote industriële bedrijven. Deventer: Kluwer Bedrijfsinformatie.
4. Dalen, G.A. (1996). Assuring eating quality of meat. Meat Science, 43 (S), 21-33. 5. Jonker, J. (Ed.). (1997). Trends in zorgsystemen: visie op de ontwikkeling van kwaliteits-, milieu- en
arbobeleid. Deventer: Kluwer Bedrijfsinformatie. 6. Zhang, Z. (1997). Developing a TQM quality management method model. Groningen: University of
Groningen. 7. Kramer, M. and Briel, van den S. (2002). Total Quality Management in the food industry. MSc thesis.
Wageningen: Wageningen University. 8. Hendriks, W. and E. Sonnemans. (2002). Drivers of TQM in the food industry. MSc thesis. Wageningen:
Wageningen University.

General introduction
11
9. LNV. (1997). Dossier varkenspest. http://www.minlnv.nl/varkenspest/dosidv03.htm. 10. LNV. (2001). Dossier BSE. http://www.minlnv.nl/infomart/dossiers/bse. 11. Crawford, L.M. (1999). Implications of the Belgian Dioxin Crisis. Food Technology, 53 (8), 130. 12. Braakman, L. and Damman, J. 1999. Dioxinestorm nog niet uitgeraasd. Voedingsmiddelentechnologie, 32
(14/15), 20-22. 13. USDA. (2001). Foot-and-Mouth disease Q�s and A�s. http://www.aphis.usda.gov/oa/pubs/qafmd301.html. 14. AgriHolland. (2001). Dossier mond en klauwzeer. http://www.agriholland.nl/dossiers/mkz/mkz.html. 15. AgriHolland. (2002). Raadsels rond landbouwgif nitrofen opgelost.
http://www.agriholland.nl/nieuws/artikel.html?id=29808. 16. AgriHolland. (2002). Honderden veehouderijen in Duitsland gesloten vanwege nitrofenschandaal.
http://www.agriholland.nl/nieuws/artikel.html?id=30020. 17. AgriHolland. (2002). Nederland ergst getroffen door MPA-affaire.
http://www.agriholland.nl/nieuws/artikel.html?id=32715. 18. AgriHolland. (2003). Dossier klassieke vogelpest. http://www.agriholland.nl/dossiers/vogelpest/home.html. 19. AgriHolland. (2003). Veerman doet nog 100 veebedrijven op slot vanwege dioxine.
http://www.agriholland.nl/ nieuws/artikel.html?id=34536. 20. Tacken, G.M.L. Leeuwen, van M.G.A. Koole, B. Horne, van P.M.L. Vlieger, de J.J. and Bont, de C.J.A.M.
(2003). Ketenconsequenties van de uitbraak van vogelpest. Den Haag: LEI. 21. Miles, S. Braxton, D. S. and Frewer, L. J. (1999). Public perceptions about microbiological hazards in food.
British Food Journal, 101 (10), 744-762. 22. Knabel, S. (1995). Foodborne illness: role of home handling practices. Food Technology, 49 (4), 119-131. 23. Early, R. (1997). Putting HACCP in practice. International Journal of Dairy Technology, 50 (1), 7-13. 24. Hoogland, J.P. Jellema, A. and Jongen, W.M.F. (1998). Quality Assurance Systems. pp. 139-158. In: Jongen,
W.M.F. and Meulenberg, M.T.G. (Eds.). Innovation of food production systems: Product quality and consumer acceptance. Wageningen Pers: Wageningen.
25. Motarjemi, Y. and Käferstein, F. (1999). Food safety, hazard analysis and critical control point and the increase in food borne diseases: a paradox? Food Control, 10 (4/5), 325-333.
26. Byrnes, H. (2000). The Global Food Safety Initiative. New Food, 3 (4), 29-31. 27. Luning, P.A. Marcelis, W.J. and Jongen, W.M.F. (2002). Food quality management: a techno-managerial
approach. Wageningen: Wageningen Pers. 28. Luning, P.A. Marcelis, W.J. and Jongen, W.M.F. (2002). Managen van voedselkwaliteit: De techno-
managerial benadering. Voedingsmiddelentechnologie, 35 (13), 42-43. 29. Kilcast, D. and Subramaniam, P. (2000). Introduction. In: Kilcast, D. and Subramaniam, P. (Eds.). The
stability and shelf-life of food. Cambridge: Woodhead Publishing Limited and CRC Press LCC. 30. Gerats, G.E.C. (1990). Werken aan kwaliteit: aspecten van kwaliteitszorg en hygiëne in de industriële
vleessector. S.l.: Gerats. 31. IFST. Institute of Food Science and Technology. (1991). Food and drink: good manufacturing practice: a
guide to its responsible management. London: IFST. 32. Leaper, S. (1997). HACCP: a practical guide. Technical manual / CCFRA; no. 38. s.l.: Chipping Campden,
CCFRA. 33. NACMCF. National Advisory Committee on Microbiological Criteria of Foods. (1998). Hazard analysis and
critical control point principles and application guidelines. Journal of Food Protection, 61 (6), 762-775. 34. Berg, van den M.G. (1993). Kwaliteit van levensmiddelen. Deventer: Kluwer. 35. ISO. (1999). ISO�s strategies in detail. http://www.iso.ch/presse/longrang.pdf. 36. Barendsz, A.W. (1998). Food safety and total quality management. Food Control, 9 (2-3), 163-170. 37. Roberts, J. (1999). Quality management � the way forward. Food Processing, 68 (5), S19-S20. 38. Dobbelaar, C. and Bergenhenegouwen, L. (2000). Door komst nieuwe ISO 9000-serie: betere integratie
kwaliteits- en voedselveiligheidsmanagement. Voedingsmiddelentechnologie, 33 (11), 25-11. 39. ISO. (2001). Guidelines on the application of ISO 9001:2000 for the food and drink industry. ISO 15161.
ISO: Geneva. 40. Vreeze, de M. (2001). ISO start met norm voor HACCP. Voedingsmiddelentechnologie, 34 (16/17), 12-13. 41. Damman, H. (2001). CIES betrekt industrie bij GFSI: wereldwijd voedselveiligheidsmodel mogelijk ook
voor merkartikelen. Voedingsmiddelentechnologie, 34 (25), 49-51.

Chapter 1
12
42. Kolsteren, O. and Vreeze, de M. (2002). Normen voor management- en traceerbaarheidssysteem in de maak. Voedingsmiddelentechnologie, 35 (16/17), 36-37.
43. Smit, M.J. (1999). De retailerseisen op een rij: HACCP-certificaat en BRC Standard vullen elkaar aan, Voedingsmiddelentechnologie, 32 (12), 11-13.
44. Smit, M.J. (1999). Search for a common standard. International Food Hygiene, 10 (4), 5, 7. 45. Smit, M. (2000). Het hoe en waarom van de BRC-inspectie. Voedingsmiddelentechnologie, 33 (11), 29-32. 46. Damman, J. (1999). CBL-akkoord over BRC-standaard moet aantal audits reduceren.
Voedingsmiddelentechnologie, 32 (22), 15-17. 47. AgriHolland. (2003). Dossier kwaliteitssystemen & certificering.
http://www.agriholland.nl/dossiers/kwaliteitssystemen/home_prn.html#qs. 48. EUREPGAP. (2001). EUREPGAP Protocol for fresh fruit and vegetables. Cologne: EUREPGAP/
FoodPLUS. 49. Loode, M. (2000). Van HACCP naar BRC: veiliger voedsel door �ketenbeïnvloeding�. Specifiek, (193), 4-5. 50. Peters, R.E. (1998). The broader application of HACCP concepts to food quality in Australia. Food Control,
9 (2-3), 83-89. 51. Delst, van P. and Hendriks, E. (2002). SQF koppelt veiligheid en kwaliteit in de keten.
Voedingsmiddelentechnologie, 35 (3), 18-19. 52. Spiegel, van der M. Luning, P.A. Ziggers, G.W. and Jongen, W.M.F. (2003). Towards a conceptual model to
measure effectiveness of food quality systems. Trends in Food Science and Technology, 14 (10), 424-431. 53. Spiegel, van der M. Luning, P.A. Ziggers, G.W. and Jongen, W.M.F. (2003). Development of the instrument
IMAQE-Food to measure effectiveness of quality management. Accepted in International Journal of Quality and Reliability Management.
54. Saraph, J.V. Benson, P.G. and Schroeder, R.G. (1989). An instrument for measuring the critical factors of quality management. Decision Sciences, 20 (4), 810-829.
55. Spiegel, van der M. Luning, P.A. Ziggers, G.W and Jongen, W.M.F. (2003). Evaluation of performance measurement instruments on their use for food quality systems. Accepted in Critical Reviews in Food Science and Nutrition.
56. Newall, D. and Dale, B.G. (1992). Meten van kwaliteitsverbetering: een kritische management-analyse. Sigma, 38 (4), 13-19.

2
Evaluation of performance measurement instruments
on their use for food quality systems
Abstract
This chapter describes the evaluation of instruments on their suitability for the development of
an instrument that measures the effectiveness of food quality systems. For this evaluation,
perspectives of quality, typical characteristics of agri-food production, quantification, and
performance measurement of quality management were studied.
Instruments that measure the performance of both quality management and production quality
were identified and evaluated on the basis of defined criteria. Criteria for performance of
production quality were six quality dimensions, i.e. product quality, availability, costs,
flexibility, reliability, and service. Criteria for performance of quality management were
analysis of relationships between quality management, context of the organisation, and
production quality; a normative procedure; validation; applicability; classification; and a
process approach. Finally, for the final instrument the evaluation resulted in an integrated
approach i.e. a techno-managerial approach, and three suitable instruments i.e. Wageningen
Management Approach, Extended Quality Triangle, and the quality concept of Noori and
Radford.
This chapter has been accepted for publication as:
Spiegel, van der M. Luning, P.A. Ziggers, G.W. and Jongen, W.M.F. Evaluation of performance measurement
instruments on their use for food quality systems. Critical Reviews in Food Science and Nutrition.

Chapter 2
14
2.1 Introduction
The general definition of a quality system is the organisational structure, responsibilities,
processes, procedures, and resources that facilitate the achievement of quality management 1.
Within the quality system, manufacturers of agri-food have to realise total quality to comply
with high demands of consumers. In the food industry often QA systems such as GMP,
HACCP, ISO and BRC are applied voluntary or obliged by legislation to ensure food quality
and food safety, to prevent liability claims, and to build and maintain trust of consumers. Total
quality can partly be realised by using these QA systems, because they only cover a part of a
complete quality system. Moreover, each QA system covers different quality aspects of this
complete quality system: e.g. some focus on management aspects (ISO) whereas others focus
on technology aspects (GMP, HACCP) 2, 3. This is shown in Figure 2.1.
Figure 2.1 Position of QA systems in the food industry in relation to quality aspects (Modified
from Hoogland et al. 2)
Product Safety Total Quality Product Quality
Quality
GMP
Quality, Health & Safety at Work, and Environment Systems
ISO
HACCP
BRC
- Generic - Safety
- Specific- Safety
- Specific - Safety - Quality - Organisation
- Generic - Integrated
TQM
- Generic - Integrated - Strategic - Consumer oriented
Quality Assurance Systems
Characteristics

Evaluation of performance measurement instruments on their use for food quality systems
15
Due to many available QA systems a transparent and unambiguous policymaking is
complicated. The QA systems are often combined or integrated to assure several quality
aspects (Chapter 1). They can also be extended to the whole supply chain and networks 4, 5.
However, the performance of a stand-alone or a combined QA system might not guarantee
total quality.
Additionally, it is still unknown to what extent these systems actually contribute to the total
quality, since this depends on the level that an organisation has developed e.g. the size of the
organisation, the automation degree of a production process, or the composition of a product.
Moreover, an instrument that measures the effectiveness of quality systems for agri-food
applications is lacking.
Little is known about which aspects of food production systems should be measured to
determine the effectiveness of food quality systems in realising total quality. A broad range of
instruments has been developed in other industries to measure performance of quality
management and total quality. However, these instruments have a generic perspective and are
not directly applicable in agri-food production systems.
This paper proposes that the following information is required for the development of an
instrument for measuring the effectiveness of food quality systems:
- From which points of view can quality of production systems be considered and how can
this be measured?
- What are the specific characteristics of the agri-food production compared with non-food
production?
- How can performance of quality management be measured as related to agri-food
production?
The objective of this study was to identify criteria to analyse, evaluate, and select instruments
and elements suitable for the development of an instrument applicable in agri-food production
systems.
2.2 Effectiveness of food quality systems
2.2.1 Quality concepts and performance
For the development of an instrument that measures the effectiveness of food quality systems,
quality concepts have been identified, evaluated, and selected.

Chapter 2
16
Identification
A quality concept should comply with three aims. The first aim is that quality must be
evaluated from a broad perspective to account for the expectations of customers. Secondly,
the quality concept must consider specific characteristics of agri-food production. Finally,
quality must be quantifiable in order to measure the effectiveness of the agri-food production
system.
Broad perspective
Quality must be evaluated from a broad perspective in order to account for the expectations of
customers.
In the literature, there are many definitions of quality. In this study, these have been classified
according to management and production based descriptions (see Table 2.1). Considering this
classification, it appears that many authors in quality management use a management based
quality description such as complying and/or exceeding customer expectations or satisfaction:
Crosby 6, 7, Feigenbaum 8, ISO 1, Zuurbier et al. 9, Juran 10, Deming 11. Some authors describe
quality as the difference between customer�s perceptions and customer�s expectations 12, 13.
Quality can also be subdivided according to specific viewpoints, e.g. Evans and Lindsay 15
who identify judgmental, product based, user based, value based, and manufacturing based
quality.
Other authors use a more production based description, which facilitates the quantification of
quality. Some of them focus on one quality aspect such as costs or loss (e.g. Crosby 6, 7,
Taguchi 17). Others include more quality aspects like product quality, price, availability, and
productivity (e.g. Ishikawa 18, Sloof et al. 19). These quality aspects can be specified and
measured using indicators. For example, physical product quality can be expressed as the
product composition, which can be measured by e.g. content of water and number of Bacillus
cereus per ml.
Some authors characterise quality in both management and technological aspects, e.g.
Barendz and De Groote 20 distinguish functional, professional, relational, and operational
aspects.
Because several descriptions of quality exists from different points of view, a suitable
description of quality has to be selected that can be used for measuring effectiveness of food
quality systems. Agri-food production exhibits specific characteristics 23-25, and therefore
these features have to be taken into account before selecting an appropriate definition.

Evaluation of performance measurement instruments on their use for food quality systems
17
Table 2.1 Classification of descriptions of quality, on the basis of management based and/or
organisation based descriptions.
Author
Description of quality
Management based descriptions Crosby 6, 7; Feigenbaum 8; ISO 1; Zuurbier et al. 9
To meet customer expectations
Juran 10 To meet customer satisfaction; fitness for use Deming 11 To exceed customer satisfaction Parasuraman et al. 12; Rowley 13 Difference between customer�s perception and customer�s
expectations Cramwinckel 14 Analytical and emotional quality Evans and Lindsay 15 Judgmental, product based, user based, value based,
manufacturing based quality Mulder 16 Goal quality, program quality, design quality, manufacturing
quality, user value Production based descriptions Taguchi 17 Loss (e.g. failure to reach ideal performance, failure to meet the
customer�s requirements, breakdowns, harmful side-effects by products) imparted to the society from the time a product is shipped.
Ishikawa 18 Development, design, production and service of a product that is most economical, most useful, and always satisfactory to the consumer.
Sloof et al. 19 Product, preferences of user (intended use, socio-physiological factors), market situation (price, availability). Assigned quality and the acceptability of a product.
Management and production based descriptions Barendz and de Groote 20 Functional, professional, related and operational quality
characteristics Steenkamp 21; van Trijp and Steenkamp 22 Quality cues (intrinsic and extrinsic) and quality attributes
Specific characteristics of agri-food production
The following features have been identified as characteristics of food production 23-25:
1. Restricted shelf life:
Food products are perishable; product properties can change very fast by physiological
processes and microbiological contamination, which can result in deterioration. This
requires both management and production aspects. High delivery frequencies are
necessary in order to supply the desired product quality, which calls for planning and
controlling. Besides, production methods like heating and conservation can prolong shelf
life.

Chapter 2
18
2. Temporary availability:
Plant foods are produced and harvested seasonally. As a consequence, products are
obtained from other countries or stored under specific conditions, which can affect the
product composition. Therefore, temporary availability requires both management and
production aspects. For example, variability of products can be prevented by special
demands on specifications or by mixing several batches of products.
3. Consumer awareness:
Consumers are aware of the relationship between diet and health, including undesired
components (e.g. pathogens and toxicants) as well as components that are desired (e.g.
vitamins). However, consumers cannot observe these components and require reliable
information about levels and effects on food safety and healthiness. Therefore, consumer
awareness requires both management and production aspects like informing consumers,
controlling the product composition, and using and developing production methods to
produce the desired product composition.
4. Heterogeneous products:
Food products are heterogeneous due to, amongst others, small-scale production, cultivar
and breeding differences, seasonal variables and harvesting time. This requires both
management and production aspects, although this kind of variation in quality can hardly
be controlled. However, effects can be minimised by special demands on specifications or
by mixing several batches of products.
5. High supply chain complexity:
The number of linkages in the food supply chain is large and complex: e.g. buyers,
suppliers, retail outlets, and wholesalers. The origin and treatment of products is hardly
traceable, which can have effects on the certainty on delivery of safe products. Therefore,
a high supply chain complexity requires both management and production aspects.
Monitoring and information systems can be used to trace the production system
characteristics, whereas packaging methods can be used for giving information about the
origin, treatment, and shelf life of the product.
6. Low added value:
Food products have a low added value which requires both management and production
aspects. If a product does not comply with the expectations, unsatisfied customers will not
complain and/or buy the product another time. Consequently, marketing efforts are
required to obtain information about customer satisfaction and to influence the quality

Evaluation of performance measurement instruments on their use for food quality systems
19
experience of customers. Besides, the profit margins of the production are low which calls
for scaling-up.
Since these characteristics are specific for the agri-food production, an integrated approach of
management and technology is required for the development of the instrument. Therefore,
both a management and a production based description for quality have been selected. The
following management based description has been used: �to comply with the expectations of
the user or consumer, while the production process is optimally organised, utilised, and
controlled�. This description includes expectations of customers as well as parts of quality
management. Nevertheless, a more production based description is needed to quantify
effectiveness of food quality systems. The following description has been used for the
development of the instrument: �the match between product specifications and actual
performance�. Also the attributes of the specifications have to be made concrete for agri-food
production and quantification.
In conclusion, quality is considered from a broad perspective by selecting both a management
and a production based description. However, these descriptions have to be made quantifiable
in order to measure the effectiveness of food quality systems.
Quantification
Quality must be quantifiable in order to measure the effectiveness of the production system.
Therefore, besides the quality description, a quality concept has to be selected in order to
measure the total quality performance.
For years, performance of production systems has commonly been evaluated by measuring
costs or by measuring the intrinsic product quality such as product safety and sensory
properties (taste, colour, texture) 9, 26. However, nowadays consumers are more aware of
additional quality dimensions of agri-food production, such as production system
characteristics, variation in product assortment and available information. Therefore, for
development of the instrument, a quality concept has to be selected which includes elements
for total quality performance, i.e. production quality.
Criteria
In order to quantify this production quality, several concepts are available in literature (Table
2.2). These concepts are based on the measurement of several quality aspects. As mentioned,
consumers not only have concerns about physical product features but also on quality aspects
related to for example the production system. Therefore, all these aspects should be

Chapter 2
20
incorporated in one concept that integrates management and product based aspects 25, 27, 28.
Therefore, the following quality dimensions have been selected to evaluate the quality
concepts:
1. Product quality:
Product quality concerns the physical product attributes (taste, shelf life, etc.). It is the
difference between the expected product quality according to the product specifications
and the realised product quality.
2. Availability:
Availability is the presence of the right quantity of products in the right place at the right
time.
3. Costs:
The costs incurred during the primary process including purchase, production and sales.
4. Flexibility:
Flexibility is the ability of an organisation to respond to new situations. Different forms of
flexibility exist, such as product flexibility (e.g. volume, innovation), process flexibility
(e.g. machine, routing, product range), and infrastructure flexibility (adaptation of
company or organisational structure to changes).
5. Reliability:
Reliability or dependability is the ability of an organisation to fulfil its commitments (e.g.
contracts with suppliers and customers).
6. Service:
The degree of services which are provided to customers besides the delivery of the
ordered product. This includes e.g. offering a variation in product assortment, making a
commitment to each customer as an industry entity, helping customers install their
products, and providing after-sales support.
Above-mentioned six quality dimensions are used for the evaluation of quality concepts in
order to quantify quality performance (Table 2.2).
Evaluation and selection
As shown in Table 2.2, most concepts that describe performance related to production quality
use product quality, availability and/or costs as parameter. In fact, these dimensions are
related to the quality of the product. The quality aspects that are important for the quality of
the organisation involve service, reliability and flexibility. Service is sometimes used in the
concepts referred to in Table 2.2. Nevertheless, reliability and flexibility are not commonly

Evaluation of performance measurement instruments on their use for food quality systems
21
used as quality dimensions. A reason might be that quality aspects of the organisation are
enclosed in the performance of quality management.
Table 2.2 Classification of quality concepts to measure performance of production quality, on
the basis of quality dimensions.
Concepts
Product quality
Availa-bility
Costs Flexi-bility
Relia-bility
Service Other dimensions
Garvin 29 X - - - X X - Evans and Lindsay 15 X X - - - X - De Toni et al. 30 X - X - - - Total quality offered:
a. In-bound quality b. Internal quality c. Out-bound quality
Isaksson and Wiklund 31 X - X - - X Capacity Environment
Challik and Waszink 32 - X X - - - Scope Sloof et al. 19 X X X - - - - de Waal and Bulthuis 33 X X X - - X Added value de Groote et al. 34 X X X X - - Improvement rate:
a. Quality b. Past improvement c. Future ambition
Jayaram et al. 35 X X X X - - - Extended Quality Triangle 25
X X X X X X -
Noori and Radford 36 X X X X X X -
In addition, some authors use other dimensions, like scope, added value (quality/price ratio),
total quality offered, capacity and environment. De Groote et al. 34 mention improvement rate
across outcome performance dimensions including quality dimensions and indicators of
management (past improvement achievements and future ambition). These other quality
aspects have been identified and also used for evaluation and selection of the dimensions.
Since only a few authors identify these aspects, these dimensions have not been selected.
Furthermore, the emphasis on dimensions and level of detail differ between the concepts. For
example, Garvin 29 emphasises on product quality by using several aspects such as
performance, features, conformance, durability, aesthetics, and perceived quality. In contrast,
for example, Jayaram et al. 35 use only the term product quality in general.
It can be concluded that only two concepts, the Extended Quality Triangle 25 and the model of
Noori and Radford 36, include quality dimensions of both product and organisation (i.e.

Chapter 2
22
production quality). Therefore, these are considered as the most suitable concepts for
performance measurement of production quality in agri-food.
2.2.2 Performance instruments of quality management
For the development of an instrument that measures the effectiveness of food quality systems,
performance instruments of quality management have been identified, evaluated by defined
criteria, and selected.
Identification
Performance of quality management can be measured 1) from different perspectives, and 2)
by several approaches and instruments.
Firstly, quality management can be approached from disciplinary or multidisciplinary
perspectives 25, 37. Disciplinary perspectives can be: a technological approach (e.g. process or
product approaches) or a management approach (e.g. process, contingency, decision-making
process, cybernetics, integral management approaches 9, 38). Multidisciplinary perspectives are
combinations of disciplinary perspectives. However, they have not been applied in many
studies. Since food characteristics can affect the food production quality to a large extent, a
techno-managerial approach 25 is proposed to determine the effectiveness of food quality
systems. The core element of this approach is the contemporary use of technological and
managerial theories and models in order to depict food systems behaviour and to generate
adequate improvements of the system (Chapter 1).
Secondly, several instruments have been proposed in literature that may be used for the
development of performance measurement systems. The main principles of those instruments
have been summarised by Kerssens-van Drongelen 39. In this study, these performance
measurement instruments have been classified from a techno-managerial perspective. These
classes are distinguished according to the focus on processes (e.g. process model approach,
horizontal approach), on organisation levels (e.g. performance pyramid), on predetermined
subject clusters (e.g. Balanced Scorecard) or on indicator formats (e.g. ProMES), as shown in
Table 2.3.

Evaluation of performance measurement instruments on their use for food quality systems
23
Table 2.3 Classification of instruments to develop performance measurement systems, from a
techno-managerial perspective (Modified from Kerssens-van Drongelen 39)
Approach Basic concept Measurement system format Process 1. System / process models approach
Indicators derived from four clusters of identified information needs essential to control a (sub) process: input information, process information, output information and effect information.
2. Horizontal approach
All indicators have a causal relationship with customer requirements.
3. Goal / Question / Metric approach
Process indicators derived from general business goals.
Organisation level 4. Vertical Approach
Set of indicators for each business level derived via deployment of quantified organisation goals.
5. Performance Pyramid
�� Nine clusters of indicators derived from corporate vision and spread over three levels;
�� Business unit level: market and financial clusters; �� Core business process level: customer satisfaction,
flexibility and productivity clusters �� Department / group / team level: quality, delivery,
cycle time and waste clusters (these four clusters have to be shown together).
6. Critical Success Factor
Mission and (contingent) strategy are translated into approximately five strategic and functional Critical Success Factors; At the bottom level approximately ten generic optional Critical Success Factors are identified in each functional area; For each Critical Success Factor one or more indicators have to be defined.
producesreceives Consist
of / holds
entities entities
attributes
entities
attributes attributes
customer
Core business process
Department/ Group/ Team
BU
Vision

Chapter 2
24
Continue Table 2.3
Approach Basic concept Measurement system format Predetermined subject clusters 7. Balanced Scorecard
Four clusters with 4-5 indicators reflecting the company strategy: the financial, customer, internal business and learning & growth perspectives.
Indicator formats 8. ProMES
Indicators derived from responsibilities (�products�) of unit subjected to measurement. Performance on each indicator is expressed in an effectiveness impact score using �contingency diagrams� that allow for non-linearity. Effectiveness scores on each indicator sum up to one effectiveness indicator, with a positive score indicating that the unit is exceeding expectations.
Criteria
Several measurement instruments have been used in literature to measure specifically
performance of (quality) management. In this study, six criteria have been developed to
evaluate measurement instruments of quality management. These criteria were assessed based
on factors to achieve a reliable tool as proposed by De Leeuw 40, 41 and Lichtenstein 42. De
Leeuw 40, 41 describes three criteria to evaluate the quality of instruments, i.e. (1) relevance,
(2) reliability and (3) efficacy. Lichtenstein 42 describes also factors that are relevant for the
application of instruments, whereas the description of the organisation is also mentioned
(external influences, agreement, organisational structure and size, level of risk of the
organisation, organisational size and philosophy, and automation). Besides, the criteria were
also evaluated on typical aspects necessary to study quality management and effectiveness
like approach, suggestions for implementation, and aspects that should be assessed to measure
effectiveness 20, 27, 43-45.
In this study the following criteria have been identified to evaluate the measurement
instruments on their usefulness to measure the effectiveness of food quality systems:
1. The instrument must analyse the relationships between quality management, production
quality and context of the organisation:
Analysis of quality management and its production quality can be a measure of the
effectiveness of a quality system. However, quality management and production quality
-100
100
Effecti-veness
Indicator score

Evaluation of performance measurement instruments on their use for food quality systems
25
can be affected by the context of the organisation such as the size of the organisation, the
automation degree of a production process, or the composition of a product 34, 46-48.
Differences in the context of organisations might explain why performance of quality
systems differs. Therefore, determination of the relationship between quality management,
production quality and context of the organisation is required.
2. The instrument must use a process approach:
Product quality is related to characteristics of delivered products, which result first from
processes. Studying these processes can result in assurance and improvement.
Consequently, a process approach is essential to study quality management 43. Moreover,
nowadays companies become aware that effectiveness and efficiency are served by a
process approach 27. Also Van der Bij and Broekhuis 46 observed this orientation on
processes and systems. A process approach is also used by the new ISO 9001:2000 series
to consider quality management 49. Therefore, quality management requires a process
approach.
3. The instrument must be normative:
A normative instrument is focused on how quality management should be performed.
Most publications about QA systems described what should be done (descriptive), but not
how to execute the quality management activities 20, 44, 45. It is expected that knowledge
about performance will facilitate the implementation of QA systems. Therefore, the
instrument must be normative.
4. The instrument must be validated and reliable:
An instrument is valid when it measures what it is intended to measure. An instrument is
reliable when it consistently yields the same results. This can be achieved by tests and
improvements before application or during usage in practice. The validity and reliability
can be determined by statistical analysis methods. A valid and reliable instrument is a
basis for a high validity and dependability of an instrument. Therefore, the instrument
must be validated and reliable.
5. The instrument must be applicable:
An applicable instrument has been developed in such a way that it is concrete, specific
and can be used without too many adjustments. Moreover, an applied instrument is more
accessible for use. Therefore, the instrument must be applicable.
6. The instrument must contain a classification system:
An instrument must be able to classify different performances of food quality systems.
Therefore, the instrument must contain a classification system.

Chapter 2
26
For the evaluation of instruments on their use for measuring the effectiveness of food quality
systems, the instruments have to comply with all six criteria. These criteria have not been
weighted for the evaluation, since they are considered to have all the same relevancy. The
identified criteria represent major requirements for the measurement of the effectiveness of
food quality systems and are shown in Table 2.4.
Evaluation and selection
The different instruments have been evaluated on the selected criteria. As shown in Table 2.4,
only one instrument complies with the six criteria i.e. Wageningen Management Approach
(WMA) 47, 61. It is described below how this instrument complies with the six criterions and
how it differs from other instruments.
WMA is an instrument that studies the relationships between management, performance and
the context of the organisation. It assumes that management and the context of the
organisation have to be fine-tuned to obtain performance. Table 2.4 shows that most
instruments measured quality management and its quality performance, or quality
management and context of the organisation, but do not evaluate the relationships between all
these elements. However, De Groote et al. 34 and Novak and Eppinger 60 also evaluate these
relationships.
WMA states that the decisions made by management result in the activities carried out in the
primary process, and it uses therefore a process approach. Table 2.4 shows that also three
other instruments use a process approach, i.e. instruments by Flynn et al. 57, Zhang 50, and De
Groote et al. 34.
Only WMA appears to be normative; it studies how quality management should be performed.
Although the Malcolm Baldrige National Quality Award 51 and the Dutch Quality Award 53
apply how-questions, these questions are descriptive. Table 2.4 also shows that most of the
instruments were validated or applied.
WMA uses a rating classification system to classify different performances of companies.
Table 2.4 shows that the quality awards include a classification method, but other
measurement instruments do not classify. The classification methods differ from each other;
they use a rating or a score classification or a combination of both.
Because WMA is the only instrument that complies with all six criteria, this instrument can be
used for measuring the effectiveness of food quality systems.

Table 2.4 Classification of instruments to measure performance of (quality) management, on the basis of six criteria
1. Subjects / Relations 2 3 4 5 6
Evaluation model
Concepts Performance Contextual Factors
Relation between Quality Management and Performance
Relation between Quality Management and Contextual Factors
Relation between Contextual Factors and Performance
Process Approach
Normative
Validity Reliability
Applied Classification Method
Deming Prize 50 X - - - - - - X - X Score Malcolm Baldrige National Quality Award 51
X X - - - - - X - X Score
EFQM Excellence Model 52 X - - - - - - X - X Score Dutch Quality Award 53 X - - - - - - X - X Score +
rating ICM-model 54 X - - - - - - X - - Rating Shingo Prize for Excellence in Manufacturing 55
X X - - - - - X - X Rating
Crosby 50 X - - - - - - X - X Rating Saraph et al. 56 - - - - - - - X X X - Benson et al. 46 - X - X - - - X X - - Flynn et al. 57 - X - - - X - X X - - Ahire et al. 58 X - X - - - - X X - - Black and Porter 59 - - - - - - - X X - - de Groote et al. 34 X X X X X X - X - X - Zhang 50 - X - - - X - - - - - Novak and Eppinger 60 X X X X X - - X - X - Wageningen Management Approach (WMA) 61, 47
X X X X X X X X X X Rating
Balanced Scorecard 62, 63 X - - - - - - - - X - Productivity Measurement and Enhancement System (ProMES) 64
X - - - - - - - - X -

Chapter 2
28
2.3 Conclusions
Although many QA systems have been implemented to realise total quality, it is still unknown
to what extent these systems contribute to the design, control, improvement and assurance of
total quality. Insight in this contribution can be used for the implementation and development
of QA systems. Moreover, the performance of different quality systems can be compared and
the value of each individual quality system can be assessed. Therefore, an instrument is
needed that measures the effectiveness of quality systems. The need for such an instrument is
also emphasised by ISO 65 that stated: �a significant new effort will be required to identify
objective indicators and develop appropriate procedures to monitor them as the basis for any
evaluation of strategy implementation�.
For the development of the instrument, information is required about the perspective of
quality, the typical characteristics of the agri-food production, quantification, and about
performance measurement of quality management.
In this study, instruments to measure performance of both production quality and quality
management were selected; quality concepts and performance instruments were identified and
evaluated on the basis of defined criteria. Firstly, criteria for the performance of production
quality included six quality dimensions, i.e. product quality, availability, costs, flexibility,
reliability, and service. Secondly, criteria for evaluation of instruments to measure the
performance of quality management were identified. The first criteria in order to evaluate
performance of quality management referred to the relationship between quality management,
context of the organisation and production quality. Besides, the instrument must be normative,
validated, and applicable. Finally, it must contain a classification system and must use a
process approach.
Considering the agri-food production, an integrated approach was selected i.e. a techno-
managerial approach. Based on the evaluation of instruments, the final instrument to measure
effectiveness of food quality systems combines the Wageningen Management Approach with
the Extended Quality Triangle and the quality concept of Noori and Radford 36.
In future research, a conceptual model will be developed that involves the relationship
between quality management, production quality and context of the organisation. On the basis
of this model, an instrument will be developed that can be used to assess the effectiveness of
food quality systems.

Evaluation of performance measurement instruments on their use for food quality systems
29
2.4 References
1. NNI. Nederlands Normalisatie Instituut Normcommissie Standaardprocedures en Criteria voor Evaluatie van Kwaliteitsbeheersingssystemen. (1989). Kwaliteit: Termen en definities. NEN-ISO 8402. Delft: NNI.
2. Hoogland, J.P. Jellema, A. and Jongen, W.M.F. (1998). Quality Assurance Systems. pp. 139-158. In: Jongen, W.M.F. and Meulenberg, M.T.G. (Eds.). Innovation of food production systems: Product quality and consumer acceptance. Wageningen: Wageningen Pers.
3. Waszink, A.C. Meyer, F.O. and Pelt, van A.C.W. (1995). Integratie van zorgsystemen. Sigma, 41 (1), 4-7. 4. Jonker, J. (Ed.). (1997). Trends in zorgsystemen: visie op de ontwikkeling van kwaliteits-, milieu- en
arbobeleid. Deventer: Kluwer Bedrijfsinformatie. 5. Koeleman, W.Ph.Th. (1995). Verandering in kwaliteitszorg: een onderzoek vanuit een veranderkundig
perspectief naar het invoeren van kwaliteitszorg bij middelgrote industriële bedrijven. Deventer: Kluwer Bedrijfsinformatie.
6. Crosby, P. B. (1979). Quality is free. New York: McGraw-Hill. 7. Crosby, P. B. (1984). Quality without tears. New York: McGraw-Hill. 8. Feigenbaum, A.V. (1991). Total Quality Control. New York: McGraw-Hill. 9. Zuurbier, P..J.P. Trienekens, J.H. and Ziggers, G.W. (1996). Verticale samenwerking: stappenplan voor
ketenvorming in food en agribusiness. Deventer: Kluwer BedrijfsInformatie. 10. Juran, J.M. (1990). Juran on leadership for quality. An executive handbook. New York: The Free Press. 11. Deming, W.E. (1986). Out of crisis. Cambridge: Massachusetts Institute of Technology. 12. Parasuraman, A. Zeithaml, V. and Berry, L. (1985). A conceptual model of service quality and its
implications for future research. Journal of Marketing, 49 (3), 41-50. 13. Rowley, J. (1997). Beyond service quality dimensions in higher education and towards a service contract.
Quality Assurance in Education, 5 (1), 7-14. 14. Cramwinckel, A.B. (1989). Wat is kwaliteit? De betekenis van �analytische� en �emotionele� kwaliteit.
Voedingsmiddelentechnologie, 22 (6), 17-21. 15. Evans, J.R. and Lindsay, W.M. (1996). Introduction to quality. pp. 3-29. In: Evans, J.R. and Lindsay, W.M.
(Eds.). The management and control of quality. St. Paul: West publishing Company. 16. Mulder, F.A. (1991). Manager en produktkwaliteit. Deventer: Kluwer Technische Boeken B.V. 17. Taguchi, G. (1986). Introduction to quality engineering: Designing quality into products and processes.
White Plains, NY: Kraus International, UNIPUB (Asian Productivity Organisation). 18. Ishikawa, K. (1985). What is Total Quality Control? � The Japanese way. London: Prentice Hall. 19. Sloof, M. Tijskens, L.M.M. and Wilkinson, E.C. (1996). Concepts for modelling the quality of perishable
products. Trends in Food Science and Technology, 7 (5), 165-171. 20. Barendsz, A.W. and Groote, de J.M.F.H. (1994). Kwaliteitsmanagement: HACCP, de ontbrekende schakel.
Voedingsmiddelentechnologie, 27 (6), 12-16. 21. Steenkamp, J-B.E.M. (1987). Perceived quality of food products and its relationship to consumer
preferences: theory and measurement. Journal of Food Quality, 9, 373-386. 22. Trijp, van J.C.M. and Steenkamp, J.E.B.M. (1998). Consumer-oriented new product development: principles
and practice. pp. 37-66. In: Jongen, W.M.F. and Meulenberg, M.T.G. (Eds.). Innovation of food production systems: Product quality and consumer acceptance. Wageningen: Wageningen Pers.
23. Jongen, W.M.F. (1999). Food supply chains and product quality: How to link sustainability and market. pp. 261-272. In: Boekestein, A. Diederen, P. Jongen, W. Rabbinge, R. and Rutten, H. (Eds.). Towards an agenda for agricultural research in Europe. Proceedings of a conference held in Wageningen, the Netherlands, from 13-15 April 1999. Wageningen: Wageningen Pers.
24. Berg, van den M G. (1993). Kwaliteit van levensmiddelen. Deventer: Kluwer. 25. Luning, P.A. Marcelis, W.J. and Jongen, W.M.F. (2002). Food quality management: a techno-managerial
approach. Wageningen: Wageningen Pers. 26. Jorissen, A. (1994). Prestatiemeting: naar een betere beheersing van bedrijfsactiviteiten. Management
Accounting. Antwerpen and Apeldoorn: MAKLU Uitgevers. 27. Jongen, W.M.F. and Meulenberg, M.T.G. (1998). Innovation of food production systems: Product quality
and consumer acceptance. Wageningen: Wageningen Pers.

Chapter 2
30
28. Linnemann, A.R. Meerdink, G. Meulenberg, M.T.G. and Jongen, W.M.F. (1999). Consumer-oriented technology development. Trends in Food Science and Technology, 9 (11-12), 409-414.
29. Garvin, D.A. (1987). Competing on the eight dimensions of quality. Harvard Business Review, 65 (6), 101-109.
30. De Toni, A. Nassimbeni, G. and Tonchia, S. (1995). An instrument for quality performance measurement. International Journal of Production Economics, 38 (2-3), 199-207.
31. Isaksson, R. and Wiklund, H. (2000). On the development of customer oriented improvement processes. pp. 27-34. In: Dar-El, E. Notea, A. and Hari, A. (Eds.). Productivity & Quality Management Frontiers � IX. Proceedings of the 9th International Conference on Productivity and Quality Research, held in Jerusalem, Israel, from June 25-27th 2000. Bradford: MCB University Press.
32. Challik, R.G. and Waszink, A.C. (1990). Leidraad voor kwaliteitsverbeteringen. Alphen a/d Rijn etc.: Samson Bedrijfsinformatie.
33. Waal, de A.A. and Bulthuis, H. (1995). Cijfers zeggen niet alles! Methoden ter verbetering van de interne managementrapportage. Deventer: Kluwer Bedrijfswetenschappen.
34. Groote, de X. Loch, C. Heyden, van der L. Wassenhove, van L. and Yücesan, E. (1996). Measuring management quality in the factory. European Management Journal, 14 (6), 540-554.
35. Jayaram, J. Droge, C. and Vickery, S.K. (1999). The impact of human resource management practices on manufacturing performance. Journal of Operations Management, 18 (1), 1-20.
36. Noori, H. and Radford, R. (1995). Production and Operations Management, Total Quality and Responsiveness. New York: McGraw-Hill, Inc.
37. Schinning, A. (1991). Zwerven tussen proces, organisatie en beleid. Zijn betere projectdoelstellingen mogelijk door een ruimere visie op kwaliteit? Sigma, 37 (1/2), 12-15.
38. Bots, J.M. (1991). De besturing van het primaire agrarische bedrijf: een toepassing van de Wageningse Besturings Benadering in een voorstudie met betrekking tot potplantenbedrijven. Wageningen: s.n.
39. Kerssens-van Drongelen, I.C. (1999). Systematic design of R&D performance measurement systems. Enschede: Print Partners Ipskamp.
40. Leeuw, de A.C.J. (1996). Bedrijfskundige methodologie: management van onderzoek. Assen: Van Gorcum & Comp. B.V.
41. Leeuw, de A.C.J. (1999). Kwaliteit van bedrijfskundige kennis: kennisproducten en hun bruikbaarheid. pp. 185-205. In: Riemsdijk, de M.J. (Ed.). Dilemma�s in bedrijfskundige wetenschap. Assen: Van Gorcum & Comp. B.V.
42. Lichtenstein, S. (1996). Factors in the selection of a risk assessment method. Information Management & Computer Security, 4 (4), 20-25.
43. Waszink, A.C. (1995). Complexiteit, proces- en klantgerichtheid. Sigma, 41 (3), 7-10. 44. Stanley, S.E. (1998). The challenges and opportunities of ISO 9000 registration: 'Your customers are
calling'. CIM Bulletin, 91 (1018), 215-220. 45. GC Management. (1996). ISO 9002 Quality System. http://www.gcmgmt.com/iso9002.html. 46. Bij, van der J.D. and Broekhuis, H. (1998). The design of quality systems: A contingency approach.
International Journal of Production Economics, 55 (3), 309-319. 47. Ziggers, G.W. (1993). Agrarisch ondernemerschap in een bedrijfskundig perspectief. s.l.: s.n. 48. Benson, P.G. Saraph, J.V. and Schroeder R.G. (1991). The effects of organizational context on quality
management: an empirical investigation. Management Science, 37 (9), 1107-1124. 49. ISO. (1999). ISO/CD2 9001:2000. Quality management systems � requirements. Document ISO/TC/SC
2/N4334. Geneva: ISO. 50. Zhang, Z. (1997). Developing a TQM quality management method model. Groningen: University of
Groningen. 51. NIST. National Institute of Standards and Technology. (2001). National Quality Award Program. 2001
Criteria for Performance Excellence. http://www.quality.nist.gov. 52. EFQM. (1999). The EFQM Excellence model. http//:www.efqm.org,. 53. Hardjono, T.W. and Hes, F.W. (1996). De Nederlandse Kwaliteitsprijs en Onderscheiding. Deventer: Kluwer
BedrijfsInformatie.

Evaluation of performance measurement instruments on their use for food quality systems
31
54. Folkerts, H. Kramer, F.B. and Timmermans, M.H.C. (1996). Ontwikkeling referentiemodel voor integrale ketenzorg. Onderdeel 6 van het "TKZ project Tuinbouwveilingen". 's Hertogenbosch: NEHEM Consulting Group.
55. USU and NAM. Utah State University, college of business and National Association of Manufacturers. (2000). Shingo Prize for excellence in manufacturing, Logan, UT: s.n.
56. Saraph, J.V. Benson, P.G. and Schroeder, R.G. (1989). An instrument for measuring the critical factors of quality management. Decision Sciences, 20 (4), 810-829.
57. Flynn, B.B. Schroeder, R.G. and Sakakibara, S. (1994). A framework for quality management research and an associated measurement instrument. Journal of Operations Management, 11 (4), 339-366.
58. Ahire, S.L. Golhar, D.Y. and Waller, M.A. (1996). Development and validation of TQM implementation constructs. Decision Sciences, 27 (1), 23-56.
59. Black, S.A. and Porter, L.J. (1996). Identification of the critical factors of TQM. Decision Sciences, 27 (1), 1-21.
60. Novak, S. and Eppinger, S.D. (2001). Sourcing by design: Product complexity and the supply chain. Management Science, 47 (1), 189-204.
61. Kampfraath, A.K. and Marcelis, W.J. (1981). Besturen en organiseren. Deventer: Kluwer. 62. Kaplan, R.S. and Norton, D.P. (1996). Using the Balanced Scorecard as a strategic management system.
Harvard Business Review, 71 (1), 75-85. 63. PEA. Procurement Executives' Association. (1998). Guide to a Balanced Scorecard performance
management methodology. Moving from performance measurement to performance management. http://oamweb.osec.doc.gov/bsc/guide.htm.
64. Pritchard, R.D. Jones, S.D. Roth, P.L. Stuebing, K.K. and Ekeberg, S.E. (1989). The evaluation of an integrated approach to measuring organizational productivity. Personnel Psychology, 42, 69-115.
65. ISO. (1999). ISO�s strategies in detail. http://www.iso.ch/presse/longrang.pdf.


3
Towards a conceptual model
to measure effectiveness of food quality systems
Abstract
This chapter analyses several QA systems, and discusses the development of a conceptual
model that aims at developing an objective instrument. Successive research can use this
instrument to assess performance of food quality systems.
This chapter has been published as:
Spiegel, van der M. Luning, P.A. Ziggers, G.W. Jongen, W.M.F. (2003). Towards a conceptual model to measure
effectiveness of food quality systems. Trends in Food Science and Technology, 14 (10), 424-431.
A part of this chapter has been published as:
Spiegel, van der M. Ziggers, G.W Luning, P.A. and Jongen, W.M.F. (2000). Development of a diagnostic
instrument for food quality systems: a conceptual model, pp. 193-200. In: Dar-El, E. Notea, A. and Hari, A.
(eds.) Productivity & Quality Management Frontiers � IX. Proceedings of the 9th International Conference on
Productivity and Quality Research, held in Jerusalem, Israel, from 25-27 June 2000. Bradford: MCB University
Press.

Chapter 3
34
3.1 Introduction
Food manufacturers have to decide which QA system is most suitable to their specific
situation, and how this system should be implemented. Especially specific characteristics of
agri-food production 1 require the correct application of the appropriate QA system. However,
it is still unknown to what extent these QA systems contribute to the actual assurance of food
quality, because the performance of these systems cannot yet be measured. Although a broad
range of instruments has been developed in other industries to measure performance of quality
management and total quality, in specific they are neither normative nor do analyse
effectiveness 2. Therefore, the food industry requires an instrument that assesses effectiveness
of food quality systems in order to make a better selection of appropriate QA systems and to
obtain a better application. Improved QA systems should be developed that are adjusted to the
specific situation of an organisation. The need for an instrument is also emphasised by ISO 3
that stated that �a significant new effort will be required to identify objective indicators and
develop appropriate procedures to monitor them as the basis for any evaluation of strategy
implementation�. As a result, a higher assurance of food quality can be obtained, which in turn
results in trust of consumers.
This chapter discusses the analysis of QA systems in the food industry. Additionally, a
conceptual model is represented that reflects the interrelationship between quality
management, contextual factors and total quality. In future research, this model will be used to
develop an objective diagnostic instrument to assess performance of quality systems in agri-
food production.
3.2 Analysis of QA systems in the food industry
3.2.1 Quality Assurance systems
The general definition of a quality system is the organisational structure, responsibilities,
processes, procedures and resources that facilitate the achievement of quality management 4.
The organisational structure is the formal pattern of functions and tasks, the relations between
them and the order of the processes within the organisation 5; it clarifies the arrangement of an
organisation. Within this organisational structure, the responsibilities, tasks and competencies
of the employees have to be determined in order to know who is accountable for a specific

Towards a conceptual model to measure effectiveness of food quality systems
35
activity. This activity is part of processes in the organisation, e.g. the production process,
purchase, and product development. What has to be done, by whom and how is written in
procedures. The execution of tasks requires resources including employees, raw materials and
equipment.
QA systems cover only different aspects of the complete quality system 1, 2, 6, 7. This is shown
in Table 3.1. In comparison with GMP, HACCP, ISO and BRC, TQM is not a QA system but
a concept to improve organisations continuously, to satisfy both the external and internal
customer, to achieve quality of products, and to save costs by doing things right the first time 8-10. TQM is a management view that covers the complete quality system.
As shown in Table 3.1, other differences between above-mentioned systems exist. GMP and
HACCP are especially developed to assure food safety. BRC deals like HACCP with food
safety and product quality but evaluates also on management aspects (ISO) and facility
conditions (GMP). TQM aims to improve total quality. Additionally, ISO and TQM focus
more on management aspects, whereas GMP and HACCP focus on technology aspects 6.
GMP, HACCP and ISO are more detailed than BRC and TQM. Furthermore, food
manufacturers are obliged by legislation to apply HACCP, while the other systems are applied
voluntary in the food industry. Whereas quality control and quality assurance are central
issues in HACCP, the ISO 9000:1994-series and BRC, continuous quality improvement is
aimed by ISO 9001:2000 and the philosophy of total quality management. HACCP is the only
QA system that consists of a plan of steps, in contrast to the checklists of ISO and BRC. GMP
includes guidelines, and TQM uses awards or self-assessments. Thus, HACCP has a
normative approach, while the other systems are descriptive.
Because QA systems differ in several aspects, they are combined or integrated to assure more
aspects of food quality. For example, HACCP and ISO are combined to take technological
and management measures for assuring food safety and food quality 11-15. Especially the new
ISO norm with requirements for food safety could be helpful for the application of HACCP 16-
18. Although food manufacturers use several QA systems and concepts, the application still
fails.

Chapter 3
36
Table 3.1 Differences between QA systems and TQM with respect to quality system
characteristics, result, perspective, extensiveness, requirements, quality management,
method, and suggestions for implementation.
Tools GMP HACCP ISO
9001-3:1994BRC ISO
9001:2000 TQM
Quality system characteristics Organisational structure X X X X Responsibilities X X X X Processes X X X X Procedures X X X X X Resources X X X Result Food safety X X X X Product quality X X X X X X Organisation quality X X X X Total quality X Perspective Technology X X X Management X X X X Extensiveness More detailed X X X X Requirements Legislation X Voluntary X X X X X Quality management Quality control X X X X X X Quality assurance X X X X X Quality improvement X X Method Plan of steps X Checklist X X X Guidelines X Awards / Self-assessment X Suggestions for implementation Descriptive X X X X X Normative X

Towards a conceptual model to measure effectiveness of food quality systems
37
3.2.2 Implementation
Food manufacturers have to decide which QA system is most suitable to their specific
situation, and how this system should be implemented.
Over the last few years, a large number of companies have implemented QA systems and total
quality management programmes in order to introduce effective quality systems and to
achieve high-quality products. Nevertheless, the introduction did not always result in the
desired performance. Several studies investigated the causes of failures. Some mentioned
company characteristics as major cause, whereas others suggested that improper
implementation was the reason. Noci and Toletti 19 mentioned that distinctive features of
small companies and general problems affecting all companies in the assessment of quality-
based programmes are responsible for these failures. Other authors also suggested that some
pitfalls are caused by implementation failures, such as a fixed organisation culture, lack of
commitment or knowledge, and no clear goals 10, 20-31. Moreover, several authors suggested
that the uniform method is not suitable due to the different business environment (the context)
of the organisation. They mentioned the complexity of the organisation 5, 23, 32-37, the
complexity of the production process 29, 35, 38, 39, the complexity of the product 29, 35, 40, 41, and
human resource management practices 42. These implementation failures and the context of
the organisation require continuous adjustments of quality management activities, which
should be based on assessment of quality performance.
3.2.3 What and how
Most publications about QA systems described what should be done, but not how the
activities should be accomplished to manage quality 2, 7, 24, 43-45,. QA systems are often too
generic in nature in order to be applicable for each company. Consequently, they only
describe what level of quality system a company must achieve and not the necessary steps to
arrive at this level. Therefore, failures are made due to an inappropriate implementation
method. Moreover, since agri-food production differs from non-food production 1, it is
expected that this sector also requires a specific approach to achieve the expected quality
level. To know to what extent the systems contribute to total quality, an instrument is required
that measures performance of quality systems. The development of such an instrument
necessitates information about which factors affect the realisation of the production quality.
The relationships of these factors and the production quality are represented in a conceptual
model.

Chapter 3
38
3.3 The conceptual model
Figure 3.1 shows the conceptual model, which reflects the interrelationship between factors
influencing quality performance, quality management and production quality. The selection of
a relevant instrument for the development of the conceptual model was based on a
comprehensive literature research. Several performance measurement instruments were
compared and selected upon a set of criteria 2. Two instruments were selected as a basis for
the model, i.e. the Wageningen Management Approach 33, 46 and the Extended Quality
Triangle 1.
Figure 3.1 The conceptual model to measure effectiveness of food quality systems (adapted from
van der Spiegel et al. 45)
This integrated conceptual model consists of three elements: I. production quality, II. quality
management, and III. contextual factors. Arrows reflect the relationship between these
elements. According to the model the primary process is managed by quality management (II)
to obtain an appropriate production quality (I). In fact, the decisions made by employees on
Quality Management
Primary Process
Complexity of Product Assortment
Complexity of Supply Chain
Complexity of Organisation
III II I
ProductionQuality Complexity of
Production Process

Towards a conceptual model to measure effectiveness of food quality systems
39
each organisation level result in activities carried out in the primary process. The contextual
factors (III) can affect the production quality directly 32, 33. Proper quality management (II) is
assumed to obtain an appropriate food production quality by adjusting quality management
activities to these contextual factors.
It is hypothesised that a higher production quality is obtained by a higher level of quality
management. A higher complexity of contextual factors is expected to relate to a lower
production quality; a higher level of quality management is assumed to reduce the influence
of the contextual factors on production quality. These hypotheses will be explained below.
3.3.1 Quality management and production quality
Production quality is the end result of quality management and the primary process (Figure
3.1). For defining production quality in the model, the Extended Quality Triangle 1 (Figure
3.2) was selected by evaluating quality concepts on a set of criteria 2.
Figure 3.2 The Extended Quality Triangle 1.
prod
organisation
Costs
Product quality
Availability
Reliability
Flexibility
Serviceproduct

Chapter 3
40
For years, performance of production systems has commonly been evaluated by measuring
costs or the intrinsic product quality 47. However, the quality perception of consumers is not
only affected by physical product attributes (taste, shelf life, etc.) or costs, but also by
additional dimensions such as availability of the product, and flexibility, service and
reliability offered by the organisation 1, 39, 42, 48-50. Therefore, quality has to be considered in a
broad perspective including technological and managerial aspects. The Extended Quality
Triangle distinguishes production quality between quality dimensions of the product (product
quality, availability and costs) as well as those of the organisation (flexibility, reliability and
service). Production quality can be measured by the extent to which quality dimensions are
achieved. These quality dimensions must comply with the expectations of the customers 4,
and therefore with the agreed specifications.
Production quality can be controlled by quality management. In our view, quality
management of primary production consists of activities that control, improve and assure the
primary process, which in turn results in a certain production quality. It is focused on
obtaining and controlling the expected production quality against minimal costs and efforts.
In literature, several relations between quality management and production quality are
described: e.g. selection of suppliers or mixing several batches of raw materials improves
product quality 1, 51, 52, quality management activities improve financial results or reduce
quality costs 32, 33, 48, selection of suppliers improves availability of products 51.
3.3.2 Contextual factors, quality management and production quality
The contextual factors are part of the environment in which a company operates that affect the
production quality. Some factors cannot be controlled (e.g. regulations of the government) in
contrast to other factors such as type of the process. The last mentioned factors have to be
controlled to realise the desired quality performance. This control requires a certain level of
quality management. The diversity in contextual factors might explain why the performance
of quality systems differs.
In literature, several contextual factors are described which affect both quality management
and production quality, such as size of the company, type of the product, technology, type of
the process, human resource management practices, networks of relationships, and
organisational culture 5, 22, 23, 32, 34, 35, 38, 39, 42, 53-55. For example, if the variety of raw materials
is large, the number of aspects that has to be considered during decision-making will also be
large in order to obtain the desired production quality. These aspects are controlled by
Towards a conceptual model to measure effectiveness of food quality systems
41
activities like mixing several batches of raw materials, investing in systems in order to obtain
information of preceding production systems, or co-operation between linkages in the supply
chain 1, 2, 52, 56.
Although all above-mentioned contextual factors affect the quality management tasks, four
variables were selected that are related to food production quality and quality management by
analysing food production characteristics. These variables include complexity of the supply
chain, complexity of the organisation, complexity of the production process, and complexity
of the product assortment.
Complexity of the supply chain
Food supply chains are special forms of networks in which food companies are the actors 57.
A supply chain consists of at least three sequential companies in a vertical relationship,
including multiple partnerships 54. In general, food supply chains are characterised by a large
number of linkages, a lot of suppliers and customers, a small-scale production in the primary
sector, and seasonal supply of raw materials 1, 58. However, differences between individual
food supply chains also exist, e.g. the number of linkages, location of a linkage in the supply
chain, relationships and co-ordination between linkages, and characteristics of food
production (like organic production, genetic modification, and origin of raw materials). The
diversity of these aspects is called complexity of the supply chain.
The complexity of the supply chain requires co-operation and trust between linkages in order
to ensure quality, such as agreements of production specifications and exchange of
information. This can result in a synergistic effect on quality performance. However, which
partner takes advantage of the co-operation is dependent on the way individual companies
operate, the degree of dependency and the extent to which the co-operation dominates. Thus,
interdependencies, behaviour of co-operating companies and their context affect performance
of a supply chain 53-55, 57, 59, 60. Therefore, performance of the company is also influenced by
supply chain complexity 57. Consequently, differences in the supply chain can affect
performance of quality management activities in a company.
It is expected that the diversity of the food supply chain will affect performance of quality
management and/or production quality of an individual food company. The diversity of food
supply chains may explain why food quality systems of several supply chains differ in the
realisation of the production quality.

Chapter 3
42
Complexity of the organisation
Food-producing companies differ in several aspects, e.g. the origin of raw materials and
resources, the number of suppliers, the number of employees, the number of products
produced, and type of outlets. The diversity of these aspects is called complexity of the
organisation 32, 33.
Several researchers have observed an effect of some organisation aspects on quality
management, e.g. the origin of raw materials and resources or the company size 33, 35, 38. Due
to the complexity of the organisation, a food-producing company performs different activities.
For example, a company distributes or sells products by itself, or leaves these activities to
other organisations such as a distribution company or a supermarket. Additionally, the
production occurs at one or several affiliates. Besides, the extent of differentiation and
specialisation affect quality management. A diverse and specialised organisation structure
(e.g. a large number of departments and hierarchical levels) hinders obtaining insight in
processes. Therefore, control of goals and requirements are complicated and a larger amount
of control measures might be necessary. Thus, complexity will complicate the effective
application of quality management considerably 34, 61.
It is expected that the diversity of the food organisation will affect performance of quality
management and/or production quality. The diversity of the food organisation may explain
why food quality systems differ in the realisation of the production quality. In our study,
complexity of the organisation is focused on merely management aspects.
Complexity of the production process
Food production processes differ in e.g. the number of process steps, specificity of production
processes, and the heterogeneity of raw materials due to seasonal harvesting and natural
variation. This diversity is called complexity of the production process 62. The complexity
causes variation during manufacturing, which makes demands on quality management to
control food production quality.
Additionally, operation and design of the production processes differ. For example, the ratio
between batch and continuous processes affect quality management activities 39, 63- 65. Besides,
the number of closed and open processes differ which affect risks and actions during
production. Automatic and manual operations also influence risks, speed and actions of the
production process. Therefore, complexity of the production process is expected to affect
performance of quality management and/or production quality. The diversity of food
production processes may explain why food quality systems differ in the realised production

Towards a conceptual model to measure effectiveness of food quality systems
43
quality. In our study, the complexity of the production process contains merely technological
aspects, whereas management aspects are classified in the complexity of the organisation.
Complexity of the product assortment
The product assortment of food-producing companies consists mostly of a variety of products
that have diverse product compositions. This diversity is called complexity of the product
assortment. The complexity requires diverse production techniques, manufacturing processes
or highly specialised knowledge to ensure acceptability and asks for diverse controls and
checks to ensure quality 40.
As an example, in a study in the automobile industry the impact of different product varieties
on performance varied but was in general less than expected. Nevertheless, a large number of
parts affected the productivity negatively 66. Benson et al. 35 also revealed that product or
process contextual factors have little effect on quality management. Nevertheless, product
complexity affected service companies, probably due to more diverse industries and different
type of product environment. Because of the diverse and specific characteristics of food
production 1, 58, it is expected that the complexity of the food product assortment cause the
same or even a larger effect on production quality.
Food characteristics are affected by the composition of individual raw materials, the recipe of
the product, and the processing conditions. Especially manufactured food products may
consist of a large number of raw materials, often present in complex matrices. The
characteristics of these ingredients are modified by several reactions that affect the food shelf
life in different manners. Control of these reactions requires quality management activities
e.g. selection of raw materials or production methods. Therefore, it is expected that the
complexity of the product assortment affects the performance of the quality management
and/or the production quality. Also, the diversity in production assortment may explain why
food quality systems differ in the realisation of the production quality.
3.4 Conclusion
Quality assurance is of major importance in the food sector. Food manufacturers have to
decide which QA system is most suitable to their specific situation and how this system
should be implemented. However, effectiveness of food quality systems cannot be assessed

Chapter 3
44
because an instrument does not exist. In this study, a conceptual model was developed as a
basis for an instrument.
On the basis of a comprehensive literature research and model development it is assumed that
a relationship exists between production quality, quality management, and contextual factors.
Four contextual factors are relevant for food production. These factors include complexity of
the supply chain, complexity of the organisation, complexity of the production process, and
complexity of the product assortment. The diversity of these factors between companies may
explain why quality systems differ in the realisation of the production quality, and can be used
for implementing and developing QA systems. The different situations of food companies and
the specific characteristics of food production ask for a specific approach consisting of
technological and managerial aspects, which should be included into a normative QA system
in order to achieve the objectives of the system.
Successive research can use this model for the development of an instrument to measure
effectiveness of food quality systems. This instrument can be developed by identifying
performance measurement indicators for production quality, quality management, and
contextual factors. Examples of indicators are: results of analyses, market share, number of
complaints, selection of raw materials, type of product groups. Quantitative research and
statistical tests should be used to test assumed relationships of the conceptual model, which
will indicate how quality systems are related to production quality.
Knowledge about this effectiveness supports food manufacturers to decide which system is
most suitable and how to achieve their objectives. This can result in a higher production
quality, compliance with expectations of consumers, maintenance and building trust of
consumers in food production quality, and maintenance and improvement of competitiveness
of food manufacturers. Additionally, method development in performance measurement of
food quality systems obtains insight in relations between technological and managerial
aspects, and in factors that influence production quality to determine the desired level of
quality management.
3.5 References
1. Luning, P.A. Marcelis, W.J. and Jongen, W.M.F. (2002). Food quality management: a techno-managerial approach. Wageningen: Wageningen Pers.
2. Spiegel, van der M. Luning, P.A. Ziggers, G.W. and Jongen, W.M.F. (2003). Evaluation of performance measurement instruments on their use for food quality systems. Accepted in Critical Reviews in Food Science and Nutrition.

Towards a conceptual model to measure effectiveness of food quality systems
45
3. ISO. (1999). ISO�s strategies in detail. http://www.iso.ch/presse/longrang.pdf. 4. NNI. Nederlands Normalisatie Instituut Normcommissie Standaardprocedures en Criteria voor Evaluatie
van Kwaliteitsbeheersingssystemen (1989). Kwaliteit: Termen en definities. NEN-ISO 8402. Delft: NNI. 5. Mulder, F.A. (1991). Manager en produktkwaliteit. Deventer: Kluwer. 6. Hoogland, J.P. Jellema, A. and Jongen, W.M.F. (1998). Quality Assurance Systems. pp. 139-158. In: Jongen,
W.M.F. and Meulenberg, M.T.G. (Eds.). Innovation of food production systems: Product quality and consumer acceptance. Wageningen: Wageningen Pers.
7. Dalen, G.A. (1996). Assuring eating quality of meat. Meat Science, 43 (S), 21-33. 8. Wilkinson, A. Redman, T. Snape, E. and Marchington, M. (1998). Managing with Total Quality Management:
Theory and Practice. Basingstoke, etc.: MacMillan. 9. Evans, J.R. and Lindsay, W.M. (1996). The management and control of quality. St. Paul: West publishing
Company. 10. Golomski, W.A. (1993). Total Quality Management and the food industry: why is it important? Food
Technology, 47 (5), 74-79. 11. Barendsz, A.W. (1998). Food safety and total quality management. Food Control, 9 (2-3), 163-170. 12. Roberts, J. (1999). Quality management � the way forward. Food Processing, 68 (5), S19-S20. 13. Dobbelaar, C. and Bergenhenegouwen, L. (2000). Door komst nieuwe ISO 9000-serie: betere integratie
kwaliteits- en voedselveiligheidsmanagement. Voedingsmiddelentechnologie, 33 (11), 25-26. 14. Jonker, J. (1997). Trends in zorgsystemen: visie op de ontwikkeling van kwaliteits-, milieu- en arbobeleid.
Deventer: Kluwer Bedrijfsinformatie. 15. Koeleman, W.Ph.Th. (1995). Verandering in kwaliteitszorg: een onderzoek vanuit een veranderkundig
perspectief naar het invoeren van kwaliteitszorg bij middelgrote industriële bedrijven. Deventer: Kluwer Bedrijfsinformatie.
16. Kolsteren, O. and Vreeze, de M. (2002). Normen voor management- en traceerbaarheidssysteem in de maak. Voedingsmiddelentechnologie, 35 (16-17), 36-37.
17. Vreeze, de M. (2001). ISO start met norm voor HACCP. Voedingsmiddelentechnologie, 34 (16-17), 12-13. 18. Damman, H. (2001). CIES betrekt industrie bij GFSI: wereldwijd voedselveiligheidsmodel mogelijk ook
voor merkartikelen. Voedingsmiddelentechnologie, 34 (25), 49-51. 19. Noci, G. and Toletti, G. (2000). Selecting quality-based programmes in small firms: A comparison between
the fuzzy linguistic approach and the analytic hierarchy process. International Journal of Production Economics, 67 (2), 113-133.
20. Hunter, S. (1998). Total Quality Management: the profits and the pitfalls. http://www.thehost.com/Hunter/tqm2.htm.
21. Hunter, S. (1998). Building a successful TQM Program. http://www.thehost.com/Hunter/tqm1.htm. 22. Messner, K. (1998). Barriers to implementing a quality improvement program. Nursing Management, 29
(1), 1-8. 23. Loo, van der H.R. and Giljam, M.J. (1995). De blinde vlekken van Total Quality Management. M&O, 3,
202-217. 24. Krause, M.S. (1996). ISO 9001 benefits and pitfalls: the path to successful certification. Clinical Chemistry,
42 (9), 1561-1565. 25. Pallett, A.J.M. (1994). ISO 9000 � The company�s viewpoint. Food Technology, 48 (12), 60-62. 26. Green, A. (1993). Applying quality assurance principles to food control. Food Control, 4 (1), 2-6. 27. Leblanc, J.M.J. (2000). Rapportage eerste effectmeting implementatie hygiënecode voor de brood- en
banketbakkerij. �s-Hertogenbosch: Keuringsdienst van Waren Zuid. 28. Garrett III, E.S. and Hudak-Roos, M. (1991). Developing a HACCP-based inspection system for the seafood
industry. Food Technology, 45 (12), 53-57. 29. Mitchell, R.T. (1998). Why HACCP fails. Food Control, 9 (2-3), 101. 30. Motarjemi, Y. and Käferstein, F. (1999). Food safety, hazard analysis and critical control point and the
increase in foodborne diseases: a paradox? Food Control, 10 (4/5), 325-333. 31. Longo, C.R.J. and Cox, M.A.A. (1997). Total quality management in financial services: Beyond the fashion
the reality has to take off. Total Quality Management, 8 (6), 323-333. 32. Bots, J.M. (1991). De besturing van het primaire agrarische bedrijf: een toepassing van de Wageningse
Besturings Benadering in een voorstudie met betrekking tot potplantenbedrijven. Wageningen: s.n.

Chapter 3
46
33. Ziggers, G.W. (1993). Agrarisch ondernemerschap in een bedrijfskundig perspectief. s.l.: s.n. 34. Waszink, A.C. (1995). Complexiteit, proces- en klantgerichtheid. Sigma, 41 (3), 7-10. 35. Benson, P.G. Saraph, J.V. and Schroeder, R.G. (1991). The effects of organizational context on quality
management: an empirical investigation. Management Science, 37 (9), 1107-1124. 36. Kirby, R. (1994). HACCP in practice. Food Control, 5 (4), 230-236. 37. Motarjemi, Y. (1999). New practices in food quality and food safety. Food Technology International, 17-19. 38. Bij, van der J.D. and Broekhuis, H. (1998). The design of quality systems: A contingency approach.
International Journal of Production Economics, 55 (3), 309-319. 39. Groote, de X. Loch, C. Heyden, van der L. Wassenhove, van L. and Yücesan, E. (1996). Measuring
management quality in the factory. European Management Journal, 14 (6), 540-554. 40. Worldwide HR. Defense Logistics Agency (DLA) Administrative Support Centre (1997). Classification
Standards: Quality Assurance Series GS-1910. MAR 83. http://www.worldwidehr.hq.dla.mil/library/standards/GS1910.html.
41. Leitenberger, E. and Röcken, W. (1998). HACCP in small bakeries. Food Control, 9 (2-3), 151-155. 42. Jayaram, J. Droge, C. and Vickery, S.K. (1999). The impact of human resource management practices on
manufacturing performance. Journal of Operations Management, 18 (1), 1-20. 43. Stanley, S.E. (1998). The challenges and opportunities of ISO 9000 registration: 'Your customers are
calling'. CIM Bulletin, 91 (1018), 215-220. 44. GC Management. (1996). ISO 9002 Quality System. http://www.gcmgmt.com/iso9002.html. 45. Barendsz, A.W. and Groote, de J.M.F.H. (1994). Kwaliteitsmanagement: HACCP, de ontbrekende schakel.
Voedingsmiddelentechnologie, 27 (6), 12-16. 46. Kampfraath, A.K. and Marcelis, W.J. (1981). Besturen en organiseren. Deventer: Kluwer. 47. Zuurbier, P.J.P. Trienekens, J.H. and Ziggers, G.W. (1996). Verticale samenwerking: stappenplan voor
ketenvorming in food en agribusiness. Deventer: Kluwer Bedrijfsinformatie. 48. Noori, H. and Radford, R. (1995). Production and Operations Management, Total Quality and
Responsiveness. New York: McGraw-Hill, Inc. 49. Waal, de A.A. and Bulthuis, H. (1995). Cijfers zeggen niet alles! Methoden ter verbetering van de interne
managementrapportage. Deventer: Kluwer Bedrijfswetenschappen. 50. Garvin, D.A. (1987). Competing on the eight dimensions of quality. Harvard Business Review, 65 (6), 101-
109. 51. Mainsah, E. and Stout, K.J. (1995). Het ontwerp en de toepassing van een 'vendor-rating'-model voor
kwaliteitsbeheersing. Sigma, 41 (2), 28-31. 52. Louwes, A.C.M. (1996). Samen met anderen in de keten de kwaliteit van bakkerijproducten verder
verbeteren. Voedingsmiddelentechnologie, 29 (7), 18-19. 53. Gulati, R. Nohria, N. and Zaheer, A. (2000). Strategic networks. Strategic Management Journal, 21, 203-
215. 54. Mentzer, J.T. Min, S. and Zacharia, Z.G. (2000). The nature of interfirm partnering in supply chain
management. Journal of Retailing, 76 (4), 549-568. 55. Ziggers, G.W. (1997). Integrated quality assurance in the pork supply chain. In: Schiefer, G. and Helbig, R.
(Eds.). Quality management and process improvement for competitive advantage in agriculture and food. Bonn: Universität Bonn-ILB.
56. Galbraith, J.K. (1976). Het ontwerpen van complexe organisaties. Alphen aan de Rijn: Samson. 57. Godfroij, A.J.A. (1993). Interorganizational network analysis. In: Beije, P. Groenewegen, J. and Nuys, O.
Networking in Dutch industries. Apeldoorn: Garant. 58. Jongen, W.M.F. (1999). Food supply chains and product quality: How to link sustainability and market. pp.
261-272. In: Boekestein, A. Diederen, P. Jongen, W. Rabbinge, R. and Rutten, H. (Eds.). Towards an agenda for agricultural research in Europe. Proceedings of a conference held in Wageningen, the Netherlands, from 13-15 April 1999. Wageningen: Wageningen Pers.
59. Ziggers, G.W. and Trienekens, J. (1999). Quality assurance in food and agribusiness supply chains: Developing successful partnerships. International Journal of Production Economics, 60-61, 271-279.
60. Kamann, D.J.F. (1989). Actors in Networks. In: Boekema, F.W.M. and Kamann, D.J.F. (Eds.). Social-economical networks. Groningen: Wolters-Noordhoff.

Towards a conceptual model to measure effectiveness of food quality systems
47
61. Kila, J.J. (1988). Oost west, thuis best? In: Kerklaan, L.A.F.M. Kwaliteit in beweging. Amerongen: Delta press B.V.
62. Kloosterboer, P.P. (1993). Topkwaliteit schuilt in een verrassende hoek. Sigma, 39 (4), 2-6. 63. Monden, Y. (1993). Toyota Management System: linking the seven key functional areas. Portland:
Productivity Press. 64. Garvin, D.A. (1983). Quality on the line. Harvard Business Review, 61 (5), 64-75. 65. Schonberger, R.J. (1982). Japanese Manufacturing Techniques: nine hidden lessons in simplicity. New York
and London: The Free Press. 66. MacDuffie, J.P. Sethuraman, K. and Fisher, M.L. (1996). Product variety and manufacturing performance:
evidence from the international automotive assembly plant study. Management Science, 42 (3), 350-369.


4
Development of the instrument IMAQE-Food
to measure effectiveness of food quality management
Abstract
This chapter is based on a study that was set up to identify performance measurement
indicators of an instrument that measures effectiveness of food quality systems, called
IMAQE-Food. This instrument has been developed by translating a conceptual model in
quantifiable performance measurement indicators. Literature research, qualitative research,
delphi sessions, and quantitative research resulted in 28 relevant and comprehensible
indicators that measure performance of quality management, production quality and their
influencing factors in the bakery sector. IMAQE-Food is useful to obtain information and
knowledge about effectiveness of food quality systems, which support manufacturers in
deciding which system is most suitable to achieve their objectives. The developed procedure
can be used for providing insight in determining the desired level of quality management, and
for extending the instrument for other applications.
This chapter has been accepted for publication as:
Spiegel, van der M. Luning, P.A. Ziggers, G.W. and Jongen, W.M.F. Development of the instrument IMAQE-
Food to measure effectiveness of quality management. International Journal of Quality and Reliability
Management, 22 (2).
A part of this chapter has been published as:
Spiegel, van der M. Luning, P.A. Ziggers, G.W. and Jongen, W.M.F. (2002). Identification of indicators to
measure effectiveness of food quality systems. pp. 563-570. In: Neely, A. and Walters, A. (Eds.) Performance
Measurement and Management: Research and Action, held in Boston, USA, from 17-19 July 2002. Cranfield:
Centre for Business Performance.

Chapter 4
50
4.1 Introduction
The food manufacturing industry uses in particular three internationally acknowledged QA
systems, i.e. HACCP, ISO, and BRC, and less frequently the concept of TQM. Based on
HACCP principles, Hygiene codes have been developed which aim to assure the production
of safe food products for non-industrial companies.
Table 4.1 shows that these QA systems and the TQM concept differ in aim, procedure,
evaluation, and assessment. HACCP, Hygiene code, and ISO 9001:2000 use more detailed
evaluation methods than BRC and TQM. The evaluation methods of the QA systems and
TQM consider the extent of implementation and compliance with norms and requirements.
Nevertheless, their effectiveness in assuring food production quality is not measured.
Moreover, a broad range of instruments has been developed to measure performance of
quality management and/or total quality, however they do also not measure effectiveness of
QA systems. Therefore, the food sector needs an instrument to measure effectiveness of food
quality systems.
This chapter discusses the development of an instrument that measures effectiveness of
quality systems in the bakery sector. For this purpose, an identification procedure to identify
performance measurement indicators has been developed, which is described in detail in this
paper. We discuss comprehensibility, availability, and relevancy of indicators to measure
effectiveness of quality systems in the bakery sector. Moreover, we compare our instrument
with other instruments and discuss the application in other sectors.
This study will make a contribution to the body of knowledge in the field of food quality
management by developing an instrument to measure effectiveness in stead of compliance of
norms and requirements or only performance. This will support food manufacturers to select
suitable quality management activities, and the research method will support researchers to
develop similar instruments.
4.2 Development of IMAQE-Food
The conceptual model (Figure 3.1) has been used to develop IMAQE-Food i.e. Instrument for
Management Assessment and Quality Effectiveness in the Food sector: our instrument that
aims at measuring effectiveness of food quality systems.

Table 4.1 Characteristics of HACCP, Hygiene code, ISO 9001:2000, BRC, and TQM.
QA system Aim Procedure Evaluation Assessment HACCP Assurance of production of safe food
products by prevention 1, 2 Systematic approach to the identification, evaluation and control of those steps in food manufacturing that are critical to food safety
Criteria to test reliability and implementation 3-6. Aspects: • Information about the
organisation • Requirements of the
HACCP system 7
Use of HACCP principles and execution of control and instructions, e.g.: • Verification procedures and their
implementation • Number of times that critical control points
exceed norms and frequency of taking corrective actions
• Completeness of registrations • Results of audits, analyses, and hygiene
controls • Number of complaints about food safety • Extent of quality attitude 8
Hygiene code Assurance of production of safe food products for non-industrial companies consisting of processes similar to those of Hygiene code
Description of production processes and guidelines to assure food safety, based on HACCP principles
Requirements prescribed, e.g.: • Flow diagrams • Temperature control • Pest control • GMP (Good
Manufacturing Practice) requirements
Use of Hygiene code requirements and implementation, e.g.: • Receiving inspection • Temperature control • Prevention of cross contamination • Cleaning and disinfecting • Pest control 9
ISO 9001:2000 1. Customer satisfaction by meeting customer requirements
2. Continuous improvement of the system
3. Prevention of nonconformity 10, 11
Checklist on: • Management
responsibility • Resource management • Product and/or service
realisation • Measurement, analysis,
and improvement
Establishment of all activities and handling in procedures, and implementation of the written procedures 11, 12
• Description of the elements of ISO in a quality manual complying with the ISO norms 11, 12.
• Record keeping and audits must reveal if procedures have been followed 13.
• Check of the actual implementation of the written procedures 11, 12.

Continue Table 4.1
QA system Aim Procedure Evaluation Assessment BRC Assurance of product quality and food
safety for companies supplying retail branded food products 5, 6.
Checklist on: • HACCP • parts of GMP • parts of ISO 3-5, 14
• Presence of management systems
• Implementation 15
Classification (foundation level/higher level) on performance of six parts: • HACCP system • Quality management system • Factory environment standards • Product control • Process control • Personnel 18
TQM 1. Continuous improvement of organisations
2. Satisfaction of both the external and internal customer
3. Achievement of quality of products
4. Saving costs by doing things right the first time 17-19.
• Quality awards (e.g. Deming Prize, Malcolm Baldrige National Quality Award, European Quality Award)
1. Quality awards: • Identification of companies
utilising the best practices 20 • Evaluation of quality
management methods and their deployment, and end results of organisations 21
• Self-assessment 2. Quantitatively based
instruments 22-24
Classification (degree of excellence) on extent to which some quality management activities are executed: • Leadership • People • Policy and strategy • Partnerships and resources • Processes • People results • Customer results • Society results • Key performance results 25 • Customer and market focus 26

Development of the instrument IMAQE-Food to measure effectiveness of food quality management
53
The conceptual model has been translated in performance measurement indicators. The
indicators have been identified based on selected concepts 27. An identification procedure has
been developed that comprises an analysis, a selection, and a verification phase (Figure 1.1).
This procedure is described in detail below.
4.2.1 Analysis
The aim of the analysis phase was to obtain a list of generic performance measurement
indicators that could be used as pool for selection of relevant indicators for the food industry.
A broad range of indicators was compiled and analysed by a comprehensive literature
research and a screening on relevancy.
Table 4.2 provides an overview of the variety of indicators in literature: types of indicators,
lists of examples, and types of utilisation.
Table 4.2 Type of indicators, lists of examples, and utilisation of performance measurement
indicators used in the analysis phase
Type of indicators
• Financial and non-financial • Qualitative and quantitative • Tangible and intangible • Long term and short term • Strategic and operational • Individual and integrated • Direct and indirect • Feedback and predictive • Internal and external Mann and Kehoe 28, Wingren 29, Fortuin 30, Jorissen31, Bonnet and Krens 32, Kerssens-van Drongelen 33, Roozen 34, ten Have et al. 35, Newall and Dale 36, Kerklaan et al. 37, McNair et al. 38
List of examples of indicators • Strategic and operational indicators 28, 30 • Process and customer related indicators 39, 40 • Vendor rating indicators 41, 42 • Research and development related indicators 33 • Indicators related to types of processes 37 • Indicators related to quality management 23, 24, 43, 44 • Indicators related to quality performance 24, 44 • Indicators related to contextual factors 23, 43, 44
Utilisation • Application • Subjectivity • Measurement units Fortuin 30, Jorissen 31, Kerssens-van Drongelen 33, Hilverdink 39

Chapter 4
54
Our indicators were mentioned by several authors and were chosen on their application (e.g.
type of process, organisation, and results), subjectivity (dependent on number and
involvement of the interviewer), and measurement units (Table 4.2). To measure all relevant
aspects optimally, indicators were identified that belong to each type of indicators (Table 4.2).
All indicators were screened on relevancy by assessing how meaningful it was to apply the
indicators for measuring performance of quality systems in the food situation in general.
4.2.2 Selection
The aim of the selection phase was to identify indicators relevant for the bakery sector and to
modify generic indicators into specific ones for this sector. Only indicators dealing with the
primary process (purchase, production, sales) were studied, meaning that processes like
quality design and customer service were not considered.
The selection phase consisted of two parts: a qualitative research and delphi sessions. For the
qualitative research, eight (quality) managers of bakeries were selected on their knowledge
about quality management and production quality. Bakeries were chosen that differed in
organisational size, degree of automation and type of bakery. A questionnaire was used
including indicators for production quality, activities to realise and improve production
quality, bottlenecks in realising production quality. For the delphi sessions, six experts on
quality management and the bakery sector were selected on their expertise in quality
management, food safety, product quality, financial aspects, production process,
characteristics of bakeries. Selected indicators of the qualitative research were discussed to
add information and to optimise the selection.
During the selection phase indicators were screened next to relevancy on two additional
requirements i.e. comprehensibility and availability. Comprehensibility is defined as the
extent to which indicators are understandable for all respondents. Availability means that data
should be obtained in the same way for all respondents.
4.2.3 Verification
The aim of the verification phase was to check if the selected indicators were relevant,
comprehensible, and available at all bakeries in practice. For this purpose, a quantitative
research among 48 bakeries was performed using a questionnaire that consists of the
translated indicators.

Development of the instrument IMAQE-Food to measure effectiveness of food quality management
55
4.3 Performance measurement indicators
As a result of the developed procedure, 28 performance measurement indicators were
identified for respectively production quality, quality management, and contextual factors in
the bakery sector. Table 4.3, 4.4 and 4.5 show the indicators that were chosen or eliminated in
each identification phase, resulting in the finally identified indicators.
4.3.1 Production Quality (I)
Production quality is the first element of the model presented (Figure 3.1). In our study,
production quality is defined as the match between production specifications and actual
performance. This means that every time that a product will be produced, performance of
production should comply with production specifications as established with customers. This
reproduction quality is especially important in the bakery industry because bakeries use batch
processes 45.
In a previous study, the Extended Quality Triangle was selected to measure performance of
production quality 27. In this concept, quality of the product (i.e. physical product quality,
availability and costs) and quality of the organisation (i.e. flexibility, reliability and service)
are distinguished 46.
In our study, actual performance was related to quality of the product, whereas quality of the
organisation was reflected in the quality management element. Relevant dimensions of
production quality for the bakery industry were physical product quality, availability, and
costs.
Physical product quality
Physical product quality concerns product attributes like taste, shelf life, etc.. It is the match
between the expected product quality according to product specifications and actual product
quality.
Table 4.3 shows that the identified indicators for physical product quality were: percentage of
rejected products; results of legislative evaluation; results of technical evaluation; and
percentage of complaints about product quality. These indicators are measured by the
company itself (internal) and inspection agencies (external).
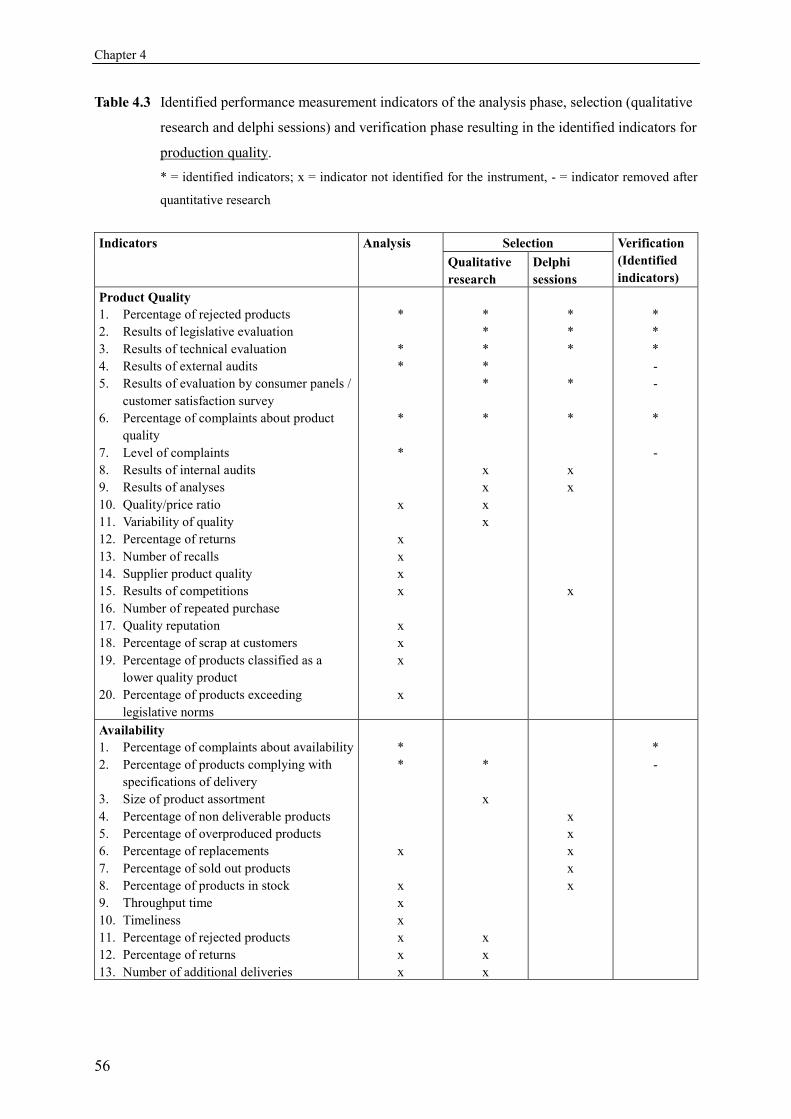
Chapter 4
56
Table 4.3 Identified performance measurement indicators of the analysis phase, selection (qualitative
research and delphi sessions) and verification phase resulting in the identified indicators for
production quality. * = identified indicators; x = indicator not identified for the instrument, - = indicator removed after
quantitative research
Selection Indicators Analysis
Qualitative research
Delphi sessions
Verification (Identified indicators)
Product Quality 1. Percentage of rejected products 2. Results of legislative evaluation 3. Results of technical evaluation 4. Results of external audits 5. Results of evaluation by consumer panels /
customer satisfaction survey 6. Percentage of complaints about product
quality 7. Level of complaints 8. Results of internal audits 9. Results of analyses 10. Quality/price ratio 11. Variability of quality 12. Percentage of returns 13. Number of recalls 14. Supplier product quality 15. Results of competitions 16. Number of repeated purchase 17. Quality reputation 18. Percentage of scrap at customers 19. Percentage of products classified as a
lower quality product 20. Percentage of products exceeding
legislative norms
* * * * * x x x x x x x x x
* * * * *
*
x x x x
* * *
*
*
x x
x
* * * - -
* -
Availability 1. Percentage of complaints about availability 2. Percentage of products complying with
specifications of delivery 3. Size of product assortment 4. Percentage of non deliverable products 5. Percentage of overproduced products 6. Percentage of replacements 7. Percentage of sold out products 8. Percentage of products in stock 9. Throughput time 10. Timeliness 11. Percentage of rejected products 12. Percentage of returns 13. Number of additional deliveries
* * x x x x x x x
*
x
x x x
x x x x x
* -

Development of the instrument IMAQE-Food to measure effectiveness of food quality management
57
Continue Table 4.3
Selection Indicators Analysis Qualitative research
Delphi sessions
Verification (Identified indicators)
Costs 1. Quality costs 2. Failure costs 3. Prevention costs 4. Total costs 5. Return on investment 6. Cost price 7. Scrap 8. Time of non production 9. Economical ratios (e.g. liquidity) 10. Rework 11. Number of additional deliveries 12. Productivity 13. Efficiency 14. Reduction in costs 15. Cost/benefit performance 16. Activity Based Costing 17. Percentage of costs complying with
budgeting
x * x * * x x x x x x x x x x x
* * x x x x
* x x x x x
- * -
Flexibility 1. Delivery time 2. Size of batches 3. Storage capacity 4. Response time 5. Possibility to order special products 6. Possibility to rush orders 7. Extra time in planning 8. Possibility to change product line for
another product(ion) 9. Margins of tolerances 10. Number of new products introduced
x x x x
x x x x x x x x
Reliability 1. Usage of QA system 2. Certification of QA system 3. Results of audits 4. Results of monitoring 5. Results customer satisfaction survey 6. Possibility to submit complaints 7. Number of times informing customers in
time 8. Percentage of complaints 9. Percentage of products complying with
specifications 10. Results of analyses 11. Number of repeating buying 12. Response time
x x x x x x x
x x x x x x x

Chapter 4
58
Continue Table 4.3
Selection Indicators Analysis Qualitative research
Delphi sessions
Verification (Identified indicators)
Service 1. Degree of customer service 2. Possibility to submit complaints 3. Informing customers 4. Response time 5. Accessibility 6. Number of bonuses and actions 7. Flexibility 8. Reliability 9. Variability of product assortment
x x x x
x x x x x x x x x
x
Total number of indicators 54 45 20 6 Number of new identified indicators 10 2 0 0 Total number of identified indicators 10 9 6 6
Several other authors mentioned �number of rejected products� as indicator of performance of
quality 28, 33, 41, 45. It indicates how the production process is controlled and how internal
standards are established. �Legislative evaluations� and �technical evaluations�, as proposed
by Diepstraten 45 and Kerssens-van Drongelen 33, measure physical product quality against
standards of safety and quality. �Percentage of complaints� was selected because it indicates
the extent to which products comply with expectations of customers 28, 33, 45.
Availability
Availability is the presence of the right quantity of products at the right place in the right time.
The identified indicator for availability was percentage of complaints about availability (Table
4.3). This indicator proposed by Diepstraten 45 and Mann and Kehoe 28 measures the extent to
which availability complies with delivery requirements of customers.
Costs
Costs are the costs made during the primary process. The identified indicator was total costs
corrected for payments, interest, and income of the owner (Table 4.3). Total costs measures
the financial result of the organisation 28, 47, including quality costs.

Development of the instrument IMAQE-Food to measure effectiveness of food quality management
59
4.3.2 Quality management (II)
Quality management is the second element of the model presented (Figure 3.1). For
measuring performance of quality management the Wageningen Management Approach
(WMA) was selected 27. This concept assumes that management should result in right
decisions, resulting in proper execution of the primary process and an optimal quality. It
distinguishes strategic and operational management, and evaluates decision-making on the
basis of four criteria 48:
1. Systematics: extent to which a planning is developed in the same way.
2. Feed forward: extent to which decision-making is anticipated on aspects that will
influence production quality in future.
3. Feedback: extent to which aspects of the past are used.
4. Integration: extent to which aspects of other decisions or activities are used.
In our study, quality management consists of activities that control, improve, and assure the
primary process, which in turn results in a certain production quality.
Performance of quality management was evaluated on how decisions about quality
management activities are made. Most publications about QA systems described what should
be done, but not how activities should be accomplished to manage quality 27, 49-54. This
evaluation was based on the four criteria of WMA.
Table 4.4 shows that five indicators for performance of quality management in the bakery
sector were identified i.e. strategy, supply control, production control, distribution control, and
execution of production tasks. All indicators were composed of more elements, called sub
indicators. These sub indicators consisted of both what and how aspects (not shown).
Strategy
In the strategy is formulated how the organisation�s mission and objectives have to be
accomplished. Identified sub indicators of strategy were policy and operational strategy, and
development and evaluation of a long term planning (not shown).
Several authors emphasised that it is important for a good strategy to focus on quality policy
as a part of the business strategy establishing how to achieve quality goals 18, 20, 22-25, 46, 55, 56.
To achieve these goals, resources have to be acquired and allocated 23, 45, 46. Therefore, �policy
and operational strategy� was identified as sub indicator.

Chapter 4
60
�Development and evaluation of a long term planning� was also identified as sub indicator,
because long term planning is important to make appropriate decisions with regard to the
primary process 18, 20, 26. Realisation of this planning has also to be monitored to know if
objectives are accomplished or have to be adjusted or improved 18, 20, 22, 24, 25, 55.
Table 4.4 Identified performance measurement indicators of the analysis phase, selection
(qualitative research and delphi sessions) and verification phase resulting in the
identified indicators for quality management. * = identified indicators; x = indicator not identified for the instrument
Selection Indicators Analysis Qualitative research
Delphi sessions
Verification (Identified indicators)
1. Strategy 2. Supply control 3. Production control 4. Distribution control 5. Execution of production tasks 6. Quality design 7. Customer service
* * * * * x x
* * * * x x
* * * * * x x
* * * * *
Total number of indicators 7 6 7 5 Number of new identified indicators 5 0 0 0 Total number of identified indicators 5 4 5 5
Supply control
Supply control is that part of quality control that focuses on the purchase process. It is an
ongoing process of evaluating performance of suppliers and raw materials, and taking
corrective actions when necessary. Identified sub indicators for supply control were: purchase
and selection of raw materials; selection and evaluation of suppliers; and co-operation with
suppliers (not shown).
�Purchase and selection of raw materials� was identified as sub indicator because especially
in the food sector quality performance of raw materials has a major influence on production
quality of final products 24, 42, 46. Quality performance of raw materials is controlled by
selection on e.g. specifications and conditions, and is evaluated by receiving inspections and
audits 20, 22, 24, 45, 46.
�Selection and evaluation of suppliers� was identified because selecting suppliers on criteria
(like quality, price, flexibility, and reliability) and auditing their QA systems have an influence

Development of the instrument IMAQE-Food to measure effectiveness of food quality management
61
on performance of suppliers, and therefore on performance of production quality of final
products 18, 20, 22-24, 41, 42, 45, 46, 57.
The level of production quality is also influenced by agreements and co-operation between
manufacturers and suppliers 20, 22-24, 45. Therefore, �co-operation with suppliers� was identified
as indicator as well.
Production control
Production control is that part of quality control that is focused on the production process.
Identified sub indicators for production control were: development of a short term production
planning; standardisation of production methods; and product and process control (not
shown).
Several authors emphasised that the production planning is important in order to control
production quality by e.g. order of products, production time, and selection of production
lines, operators and equipment 18, 20, 22, 26, 45, 46, 56. Therefore, �development of production
planning� was identified as sub indicator.
�Standardisation of production methods� was identified because documentation of production
methods and execution of these methods by employees control production quality 20, 23, 45, 55.
Several authors mentioned that �product and process control� is also important for control of
production 18, 20, 22, 23, 25, 46, 55. Process parameters and product specifications should be
monitored, recorded, and used for improvement.
Distribution control
Distribution control deals with the process of transporting final products from manufacturers
to customers. Identified sub indicators for distribution control were divided in two groups i.e.
agreements and physical distribution (not shown).
Identified sub indicators of agreements were: making agreements with customers; analysis,
acceptation and processing of orders; and communication (not shown). �Making agreements
with customers� was identified because agreements made before production (e.g. customer
orders) facilitate compliance with requirements of customers and development of the planning 20, 58.
�Analysis, acceptation and processing of orders� and �communication� are identified as sub
indicators, because Diepstraten 45, Flynn et al. 23 and Zuurbier et al. 59 described that
manufacturers analyse orders to comply with requirements of customers. Accepted orders are

Chapter 4
62
communicated to all departments involved and are processed into the production planning.
Customers are informed if orders can not be produced according to the requirements.
Identified sub indicators of physical distribution were: development and evaluation of
distribution planning and distribution conditions. �Development and evaluation of distribution
planning� was identified because distribution planning controls production quality by
anticipating on delivery times and delivery places 45, 59. Some manufacturers always use the
same distribution routes or contract out their delivery orders, whereas others make a new
planning every time 45.
Luning et al. 46 and TLN 60 emphasised that �distribution conditions� are also important.
Cooled or frozen products ask for other conditions than fresh products, as unpacked and
packed products. Distribution equipment may also only be used for food. These conditions are
monitored by inspections of equipment and products.
Execution of production tasks
The planned production tasks should be performed in such a way that production quality is
obtained. Identified sub indicators for execution of production tasks were: training and
education; communication; assignment of tasks; and adjustments of procedures (not shown).
Many authors described that �training and education of employees� and �communication�
control performance of execution 18, 20, 22-26, 46, 55, 56, 61. Evaluation of assigned tasks and
established procedures also control performance of production tasks and consequently
production quality 45. Therefore, these aspects controlling performance of production tasks
were identified as appropriate sub indicators.
4.3.3 Contextual factors (III)
Contextual factors are the third element of the model presented (Figure 3.1). These factors are
part of the environment in which a company operates, which affect production quality. The
diversity of these factors is called complexity. For the conceptual model, four variables were
assessed i.e. complexity of the supply chain, complexity of the organisation, complexity of the
production process, and complexity of the product assortment 49. However, complexity of the
supply chain was assumed not to be relevant for the current instrument for the bakery sector,
because no comparison was possible with other types of supply chains.

Development of the instrument IMAQE-Food to measure effectiveness of food quality management
63
Complexity of the organisation
Food-producing companies differ in several aspects, e.g. origin of raw materials, number of
suppliers, number of employees, and type of outlets. The diversity of these aspects is called
complexity of the organisation.
Table 4.5 shows that identified indicators for complexity of the organisation were: number
and composition of employees; percentage of not-producing affiliates; number of suppliers;
percentage of produced products; number of customers and delivery points; percentage of
products sold to third parties; and number of relationships. �Number and composition of
employees� consists of the sub indicators: number of employees, percentage of part timers,
percentage of temporary contracts, and number of production shifts.
Several authors described �number and composition of employees� as an indicator to
characterise organisations 43, 47, 62. �Number of suppliers� and �percentage of products sold to
third parties� were also used as indicators by Ziggers 47. NBC 63 mentioned that bakeries
differ in type of affiliates, produced and purchased products, and in relationships with other
bakeries or linkages. �Number of customers / delivery points� was based on delphi sessions,
and was not previously mentioned in literature.
Complexity of the production process
Food production processes differ in e.g. number of process steps, specificity of production
processes, and heterogeneity of raw materials due to seasonal harvesting and natural variation.
This diversity is called complexity of the production process.
Table 4.5 shows that identified indicators for complexity of the production process were:
number of production lines; average number of times that a production line is changed or
adjusted in a day (due to e.g. change of product group, variability or heterogeneity of raw
materials); average number of process steps; average number of critical control points; and
degree of automation. NBC 63 mentioned that bakeries differ in degree of automation. The
remaining indicators were based on qualitative research and delphi sessions, and were not
previously mentioned in literature.

Chapter 4
64
Table 4.5 Identified performance measurement indicators of the analysis phase, selection
(qualitative research and delphi sessions) and verification phase resulting in the
identified indicators for contextual factors. * = identified indicators; x = indicator not identified for the instrument.
Selection Indicators Analysis
Qualitative research
Delphi sessions
Verification (Identified indicators)
Complexity of the organisation 1. Number and composition of employees 2. Number of employees working at one
location 3. Percentage of not-producing affiliates 4. Location of affiliate 5. Number of suppliers 6. Percentage of produced products 7. Number of customers / delivery points 8. Number of deliveries in a day 9. Percentage of products sold to third parties 10. Number of relationships (co-operation) 11. Usage of external warehouse 12. Percent of contracting out distribution 13. Employees morale 14. Skill level of employees 15. Type of organisational structure 16. Type of QA system
* * * * * * x x x x
*
*
*
* *
x
x
* x
* x *
* x
* x
x x
* * * * * * *
Complexity of the production process 1. Number of production lines 2. Average number of times changing a
production line in a day 3. Average number of times adjusting a
production line in a day 4. Average number of process steps 5. Average number of critical control points 6. Degree of automation 7. Number of different conditions 8. Number of different actions 9. Percentage of failures 10. Extent that an employee influence the
production quality 11. Extent of batch vs. continuous process 12. Degree of variation in processes
* x x x x x
* *
*
*
* *
* * *
x
x
* * * * * *

Development of the instrument IMAQE-Food to measure effectiveness of food quality management
65
Continue Table 4.5
Selection Indicators Analysis Qualitative research
Delphi sessions
Verification (Identified indicators)
Complexity of the product assortment 1. Number of product groups 2. Type of product groups 3. Number of dough types 4. Number of recipes 5. Number of product numbers 6. Percentage of products directly delivered
or sold 7. Percentage of private label products 8. Percentage of new products 9. Percentage of exchange of products
* * * x
* *
*
x
* * x * x *
x
* * * *
Total number of indicators 20 15 25 17 Number of new identified indicators 10 3 4 0 Total number of identified indicators 10 12 14 17 Overall number of indicators (Table 4.3, 4.4, 4.5)
81
66
52
28
Overall number of new identified indicators (Table 4.3, 4.4, 4.5)
25 5 4 0
Overall number of identified indicators (Table 4.3, 4.4, 4.5)
25 25 (=89%)
25 (=89%)
28 (=100%)
Complexity of the product assortment
The product assortment of food-producing companies consists mostly of a variety of products
that have diverse product compositions. This diversity is called complexity of the product
assortment.
Table 4.5 shows that identified indicators for complexity of the product assortment were:
number of product groups; type of product groups; number of recipes; and percentage of
products that are directly delivered or sold without stock.
�Number and type of product groups� and �number of recipes� were identified because
several authors emphasised the effect of product complexity and product variety on quality
management or on quality performance 43, 46, 47, 62, 64. �Percentage of products that are directly
delivered or sold without stock� was based on our delphi sessions, and was not previously
mentioned in literature.

Chapter 4
66
4.4 Relevancy, comprehensibility and availability
IMAQE-Food is composed based on the identified performance measurement indicators.
These indicators were analysed, selected and verified on three practical requirements i.e.
relevancy, comprehensibility and availability.
IMAQE-Food is relevant for measuring performance of quality systems in the bakery sector,
because the identified indicators measure both performance of quality management and
quality performance in the bakery sector to assess effectiveness. Besides, the contextual
factors are measured to know why performance of quality systems differs.
The identified indicators were comprehensible, which means that contents of the indicators
were understandable for all respondents in a face-to-face situation. The indicators were mostly
clear, simple, and easy to use, although some indicators had to be clarified by the interviewer.
Hence, our respondents understood the indicators and could give the appropriate information.
Nevertheless, the indicators of the instrument were not all available at the bakeries, because
they were not recorded and collected by all respondents. It was not possible to obtain these
indicators in another manner. For an appropriate measurement of effectiveness these missing
indicators should be assessed as well. Table 4.6 presents the missing indicators. Obviously,
more data about production quality should be recorded.
Table 4.6 Additional indicators about which bakeries should collect information for an appropriate
measure of effectiveness of food quality systems.
Aspects Indicators Product Quality Results of analyses (chemical, microbiological, physical)
Complaints classified on level of risks and severe Percentage of rejected products Percentage of returns Results of audits Results of evaluation by consumer panels / customer satisfaction survey
Availability Percentage of products complying with delivery specifications Costs Quality costs

Development of the instrument IMAQE-Food to measure effectiveness of food quality management
67
4.5 Discussion
4.5.1 Performance measurement indicators
Our instrument IMAQE-Food differs in several aspects from other instruments such as
application, aim, and type of indicators, which makes the instrument valuable for measuring
effectiveness of food quality systems.
IMAQE-Food has been developed for the food sector and thus differs from other instruments
that are generic 22, 43 or specific for non-food sectors 23, 24. Additionally, IMAQE-Food
measures the effectiveness by assessing relationships between performance of both quality
management and production quality in contrast to other instruments that did not examine the
impact of quality management on quality performance 22-24.
Our indicators for quality performance consist of product quality, availability and costs in
contrast to other instruments that use only product quality 22- 24. We identified strategy, supply
control, production control, distribution control, and execution of production tasks as
indicators for quality management. Saraph et al. 22, Flynn et al. 23 and Ahire et al. 24 exclude
distribution control, although they include quality design in contrast to our instrument.
Contextual factors are used to explain why the performance of quality systems differs. Other
instruments do not examine contextual factors 22-24 or the selected factors are not relevant for
the food industry 43. Corresponding indicators are organisational size, percentage of produced
products, and product complexity.
Moreover, IMAQE-Food is partly normative, whereas other instruments are only descriptive 22-24, 43. The normative instrument is focused on how quality management should be
effectively performed, which facilitates the implementation of quality systems.
4.5.2 Availability of indicators
Due to lack of data not all indicators were available at the studied bakeries. For an appropriate
measure of effectiveness, bakeries should measure more data about production quality. Other
authors also measured production quality not comprehensively, although this was due to
insufficient selected indicators e.g. Ahire et al. 24.
Especially if IMAQE-Food will be used for predicting performance of a quality system of a
specific company, information about production quality will be required. For tests of
relationships between quality management, production quality, and contextual factors, lack of
data will reduce the explained variance. Thus, lack of relevant data limits validity and

Chapter 4
68
reliability of the instrument at the current stage. In future research, IMAQE-Food should be
validated to evaluate reliability, validity, and generalisability.
4.5.3 Application in other sectors
Most identified indicators appear to be generic for the food sector. Although the indicators
have been identified as appropriate for the bakery sector, we also selected almost the same
indicators for the vegetable and fruit processing sector 65. For application in other sectors
qualitative research and delphi sessions are required to verify relevancy of these indicators
and to specify the sub indicators.
4.6 Conclusion
The aim of this study was to identify performance measurement indicators for an instrument
that measures effectiveness of food quality systems. The developed identification procedure
revealed 28 appropriate indicators that measure performance of production quality, quality
management, and contextual factors in the bakery sector. The indicators were relevant and
comprehensible, but were not all available among the studied bakeries.
Most indicators appeared to be generic for the food sector. However, for application in other
sectors additional qualitative research and delphi sessions are required to verify relevancy of
these indicators and to specify the sub indicators.
The strength of IMAQE-Food as instrument is that it assesses the relation between food
quality management, production quality and contextual factors. Based on this relationship, the
effectiveness of food quality management is measured. Moreover, the instrument has been
developed for the food sector. Due to food characteristics, quality assurance is of major
importance for the agri-food sector.
Knowledge about the effectiveness of food quality systems will support food manufacturers in
deciding which quality management activities are most suitable to achieve their objectives.
Additionally, insight in factors that influence production quality will be useful to determine
the required level of food quality management.
Next research involves validation of IMAQE-Food to evaluate reliability and validity and to
improve the robustness of the instrument. Successive research should extend IMAQE-Food
for assessing effectiveness of specific food QA systems. It should be tailored for these
systems in order to know the actual contribution of QA systems to food quality assurance.

Development of the instrument IMAQE-Food to measure effectiveness of food quality management
69
4.7 References
1. Leaper, S. (1997). HACCP: a practical guide. Technical manual / CCFRA; no. 38. s.l.: Chipping Campden, CCFRA.
2. NACMCF. National Advisory Committee on Microbiological Criteria of Foods. (1998). Hazard analysis and critical control point principles and application guidelines. Journal of Food Protection, 61 (6), 762-775.
3. Smit, M.J. (1999). De retailerseisen op een rij: HACCP-certificaat en BRC Standard vullen elkaar aan, Voedingsmiddelentechnologie, 32 (12), 11-13.
4. Smit, M.J. (1999). Search for a common standard. International Food Hygiene, 10 (4), 5, 7. 5. Damman, J. (1999). CBL-akkoord over BRC-standaard moet aantal audits reduceren.
Voedingsmiddelentechnologie, 32 (22), 15-17. 6. Loode, M. (2000). Van HACCP naar BRC: veiliger voedsel door �ketenbeïnvloeding�. Specifiek, (193), 4-5. 7. CCvD-HACCP. (1998). Criteria voor het toetsen van een operationeel HACCP-systeem. Driebergen:
CCvD-HACCP. 8. Waelkens, A.C. (2002). Effectiviteit van HACCP en Hygiënecode voor de brood- en banketbakkerij in
Nederland. MSc-thesis. Wageningen: Wageningen University. 9. Leblanc, J.M.J. (2000). Rapportage eerste effectmeting implementatie hygiënecode voor de brood- en
banketbakkerij. �s-Hertogenbosch: Keuringsdienst van Waren Zuid. 10. ISO. (1999) ISO/CD2 9001:2000. Quality management systems � requirements. Document ISO/TC/SC
2/N4334. Geneva: ISO. 11. Aarts, W.M. (2000). Werken met ISO 9001:2000. Deventer, Alphen a/d Rijn: Samson. 12. Beekman, J. (1996). ISO 9000 en certificatie: wat mag je ervan verwachten? Deventer: Kluwer. 13. Hoogland, J.P. Jellema, A. and Jongen, W.M.F. (1998). Quality Assurance Systems. pp. 139-158. In: Jongen,
W.M.F. and Meulenberg, M.T.G. (Eds.). Innovation of food production systems: Product quality and consumer acceptance. Wageningen: Wageningen Pers.
14. Smit, M. (2000). Het hoe en waarom van de BRC-inspectie. Voedingsmiddelentechnologie, 33 (11), 29-32. 15. Kranghand, J. (2001). CBL-BRC-code inspectiestandaard voor leveranciers van levensmiddelen.
Voedingsmiddelentechnologie, 34 (9), 16-18. 16. BRC. (2000). Technical standard and protocol for companies supplying retailer branded food products.
London: British Retail Consortium. 17. Wilkinson, A. Redman, T. Snape, E. and Marchington, M. (1998). Managing with Total Quality
Management: Theory and Practice. Basingstoke, etc.: MacMillan. 18. Evans, J.R. and Lindsay, W.M. (Eds.). (1996). The management and control of quality. St. Paul: West
publishing Company. 19. Golomski, W.A. (1993). Total Quality Management and the food industry: why is it important? Food
Technology, 47 (5), 74-79. 20. Black, S.A. and Porter, L.J. (1996). Identification of the critical factors of TQM. Decision Sciences, 27 (1),
1-21. 21. Zhang, Z. (1997). Developing a TQM quality management method model. Groningen: University of
Groningen. 22. Saraph, J.V. Benson, P.G. and Schroeder, R.G. (1989). An instrument for measuring the critical factors of
quality management. Decision Sciences, 20 (4), 810-829. 23. Flynn, B.B. Schroeder, R.G. and Sakakibara, S. (1994). A framework for quality management research and
an associated measurement instrument. Journal of Operations Management, 11 (4), 339-366. 24. Ahire, S.L. Golhar, D.Y. and Waller, M.A. (1996). Development and validation of TQM implementation
constructs. Decision Sciences, 27 (1), 23-56. 25. EFQM. (2002). The EFQM Excellence model. http//:www.efqm.org. 26. NIST. National Institute of Standards and Technology. (2002). Baldrige National Quality Award Program
2002: Criteria for Performance Excellence. http://www.quality.nist.gov. 27. Spiegel, van der M. Luning, P.A. Ziggers, G.W. and Jongen, W.M.F. (2003). Evaluation of performance
measurement instruments on their use for food quality systems. Accepted in Critical Reviews in Food Science and Nutrition.

Chapter 4
70
28. Mann, R. and Kehoe, D. (1994). An evaluation of the effects of quality improvement activities on business performance. International Journal of Quality &Reliability Management, 11 (4), 29-44.
29. Wingren, T. (2002). Management accounting in the new economy: from �tangible and production-focused� to �intangible and knowledge-driven� MAS by integrating BSC and IC (BSCIC). pp. 603-610. In: Neely, A. and Walters, A. (Eds.). Proceedings of the third international conference on theory and practice in performance measurement, held in Boston, USA, from 17-19 July 2002. Cranfield: Centre for Business Performance.
30. Fortuin, L. (1994). Operationele prestatiemeting: onmisbaar op de weg naar voortdurende verbetering. pp. 139-177. In: Jorissen, A. (Ed.). Prestatiemeting: naar een betere beheersing van bedrijfsactiviteiten, Management Accounting. Antwerpen-Apeldoorn: MAKLU Uitgevers.
31. Jorissen, A. (1994). Woord vooraf. pp. 9-12. In: Jorissen, A. (Ed.). Prestatiemeting: naar een betere beheersing van bedrijfsactiviteiten. Management Accounting. Antwerpen and Apeldoorn: MAKLU Uitgevers.
32. Bonnet, M.P.B. and Krens, F. (1994). Prestatie-indicatoren. pp. 13-74. In: Jorissen, A. (Ed.). Prestatiemeting: naar een betere beheersing van bedrijfsactiviteiten, Management Accounting. Antwerpen-Apeldoorn: MAKLU Uitgevers.
33. Kerssens-van Drongelen, I.C. (1999). Systematic design of R&D performance measurement systems. Enschede: Print Partners Ipskamp.
34. Roozen, F. (1994). Naar een geïntegreerd systeem van prestatiemeting: de Balanced Scorecard. pp. 205-219. In: Jorissen, A. (Ed.). Prestatiemeting: naar een betere beheersing van bedrijfsactiviteiten, Management Accounting. Antwerpen-Apeldoorn: MAKLU Uitgevers.
35. Have, ten S. Have, ten W. and Hardjono, T. (1997). De besturingsdialoog: een praktische basis voor prestatiebesturing. Holland/Belgium Management Review, (54), 32-41.
36. Newall, D. and Dale, B.G. (1992). Meten van kwaliteitsverbetering: een kritische management-analyse. Sigma, 38 (4), 13-19.
37. Kerklaan, L.A.F.M. Kingma, J. and Kleef, van F.P.J. (1994). De cockpit van de organisatie. Deventer: Kluwer BedrijfsInformatie B.V.
38. McNair, C.J. Lynch, R.L. and Cross, K.F. (1990). Do financial and nonfinancial performance measures have to agree? Management Accounting, November.
39. Hilverdink, R. (2000). Praktijkhandboek kwaliteit: een stappenplan en naslagwerk voor het opzetten en verbeteren van uw kwaliteitssysteem volgens ISO-9000-normen, boordevol praktijkvoorbeelden, hulpmiddelen en checklists. Amsterdam, etc.: WEKA.
40. Fierens, M. (1997). Staff Quality Management: een onderzoeksmodel voor het meten van interne-klantentevredenheid. Sigma, 43 (2), 28-32.
41. Mainsah, E. and Stout, K.J. (1995). Het ontwerp en de toepassing van een 'vendor-rating'-model voor kwaliteitsbeheersing. Sigma, 41 (2), 28-31.
42. Achten, G. and Roodhooft, F. (1994). Vendor Rating: De beoordeling van leveranciersprestaties. pp. 179-203. In: Jorissen, A. (Ed.). Prestatiemeting: naar een betere beheersing van bedrijfsactiviteiten, Management Accounting. Antwerpen-Apeldoorn: MAKLU Uitgevers.
43. Benson, P.G. Saraph, J.V. and Schroeder, R.G. (1991). The effects of organizational context on quality management: an empirical investigation. Management Science, 37 (9), 1107-1124.
44. Groote, de X. Loch, C. Heyden, van der L. Wassenhove, van L. and Yücesan, E. (1996). Measuring management quality in the factory. European Management Journal, 14 (6), 540-554.
45. Diepstraten, J. (2000). Kwalitatieve analyse van zeven cases in de bakkerijsector op basis van de productiekwaliteit. MSc-thesis. Wageningen: Wageningen University.
46. Luning, P.A. Marcelis, W.J. and Jongen, W.M.F. (2002). Food quality management: a techno-managerial approach. Wageningen: Wageningen Pers.
47. Ziggers, G.W. (1993). Agrarisch ondernemerschap in een bedrijfskundig perspectief. s.l.: s.n. 48. Kampfraath, A.K. and Marcelis, W.J. (1981). Besturen en organiseren. Deventer: Kluwer. 49. Spiegel, van der M. Luning, P.A. Ziggers, G.W. and Jongen, W.M.F. (2003). Towards a conceptual model to
measure effectiveness of food quality systems. Trends in Food Science and Technology, 14 (10), 424-431. 50. Stanley, S.E. (1998). The challenges and opportunities of ISO 9000 registration: 'Your customers are
calling'. CIM Bulletin, 91 (1018), 215-220.

Development of the instrument IMAQE-Food to measure effectiveness of food quality management
71
51. GC Management. (1996). ISO 9002 Quality System. http://www.gcmgmt.com/iso9002.html 52. Barendsz, A.W. and Groote, de J.M.F.H. (1994). Kwaliteitsmanagement: HACCP, de ontbrekende schakel.
Voedingsmiddelentechnologie, 27 (6), 12-16. 53. Krause, M.S. (1996). ISO 9001 benefits and pitfalls: the path to successful certification. Clinical Chemistry,
42 (9), 1561-1565. 54. Dalen, G.A. (1996). Assuring eating quality of meat. Meat Science, 43 (S), 21-33. 55. Deming, W.E. (1986). Out of crisis. Cambridge: Massachusetts Institute of Technology. 56. Crosby, P. B. (1979). Quality is free. New York: McGraw-Hill. 57. Camperi, J.A. (1994). Vendor approval and audits in total quality management. Food Technology, 48 (9),
160-162. 58. Berg, van den M.G. and Delsing, B.M.A. (1999). Kwaliteit van levensmiddelen. Deventer: Kluwer. 59. Zuurbier, P.J.P. Bots, J.M. Edwards, A.R. Heck, van E. Hendricks, M.B.A. Meer, van der C.J. Stemne, S.I.
and Zwanenberg, A.C.M. (1991). Besturen van organisaties. Een inleiding tot in de bedrijfskunde. Culemborg: Educaboek.
60. TLN. Transport en Logistiek Nederland. (1996). Hygiënecode voor transport, opslag en distributie van levensmiddelen.
61. Borrendam, van A. (1997). Motivatie grote succesfactor bij invoering kwaliteitszorg: En: hoe houd ik mijn personeel betrokken? Sigma, 43 (2), 36-39.
62. Bij, van der J.D. and Broekhuis, H. (1998). The design of quality systems: A contingency approach. International Journal of Production Economics, 55 (3), 309-319.
63. NBC. (2000). Inspelen op verluxing: Structuurrapport 2000. Wageningen: Nederlands Bakkerij Centrum. 64. MacDuffie, J.P. Sethuraman, K. and Fisher, M.L. (1996). Product variety and manufacturing performance:
evidence from the international automotive assembly plant study. Management Science, 42 (3), 350-369. 65. Nijssen, I.T.C. (2001). Toepasbaarheid van het conceptuele model van Spiegel voor de groente- en
fruitbewerkingssector: Kwalitatieve analyse betreffend de realisatie van kwaliteit in groentesnijderijen. MSc-thesis. Wageningen: Wageningen University.


5
Validation of IMAQE-Food: Instrument for Management
Assessment and Quality Effectiveness in the Food sector
Abstract
This chapter describes the validation of IMAQE-Food: the instrument that measures
effectiveness of food quality systems. Generalisability, reliability and validity of the
instrument were analysed at a sample of 48 bakeries.
IMAQE-Food contains performance measurement indicators measuring production quality,
quality management, and contextual factors. In this study, five individual variables for
production quality were developed. Eight reliable and valid constructs for quality
management were extracted using a procedure based on Cronbach�s alpha and rotated factor
analysis. Contextual factors were divided into six constructs assessing complexity of the
organisation, five constructs assessing complexity of the production process, and two
constructs assessing complexity of the product assortment.
It was concluded that IMAQE-Food is a reliable and valid tool to assess effectiveness of
quality systems in the bakery sector. IMAQE-Food appears to be also applicable for the
vegetable and fruit processing sector. It is expected that the instrument will be applicable for
other food sectors as well after small modifications. Successive research can extend IMAQE-
Food for other applications such as other food sectors and QA systems.
This chapter has been submitted for publication as:
Spiegel, van der M. Boer, de W.J. Luning, P.A. Ziggers, G.W. and Jongen, W.M.F. Validation of IMAQE-Food:
Instrument for Management Assessment and Quality Effectiveness in the Food sector. Journal of Operations
Management.
A part of this chapter has been published as:
Spiegel, van der M. Luning, P.A. Ziggers, G.W and Jongen, W.M.F. (2002). Identification of indicators to
measure effectiveness of food quality systems. pp. 563-570. In: Neely, A. and Walters, A. (Eds.) Performance
Measurement and Management: Research and Action, held in Boston, USA, from 17-19 July 2002. Cranfield:
Centre for Business Performance.

Chapter 5
74
5.1 Introduction
A broad range of instruments has been developed in other industries to measure performance
of quality management 1. Only a few researchers evaluated their instruments scientifically on
reliability and validity 2-4. Ahire et al. 4 proposed that a mixture of the three instruments
developed by the before-mentioned authors could result in highly stable, reliable and valid
variables of quality management. These measurement instruments are used for assessing
quality management, but they can not be used for measuring effectiveness of food quality
systems. In specific they are neither normative nor do analyse all relations between quality
performance, quality management, and contextual factors 1.
In a previous study, the instrument IMAQE-Food has been developed. It measures
effectiveness of food quality systems, consisting of production quality, quality management,
and contextual factors 5. The current chapter describes the validation of this instrument:
generalisability, reliability and validity were analysed at a sample of 48 bakeries.
5.2 Method
5.2.1 Development of IMAQE-Food
In a previous study, IMAQE-Food has been developed as an instrument that measures
effectiveness of food quality management (Chapter 4). Identification revealed indicators that
were relevant, comprehensible, available, generic, reliable, and valid at all bakeries in practice 5. Figure 1.1 shows the procedure that was followed to develop this instrument.
Sample
The bakery sector is characterised by a large variety in products differing in shelf life i.e.
bread, confectionery, and biscuits. In 2000, the Dutch bakery sector consisted of 79 large
bread companies and 2980 small and medium enterprises (SMEs) producing bread and
confectionery 6. Most bakeries (75%) consisted of less than 10 employees. Bakeries with
more than 10 employees were responsible for the largest part of the production volume 7. The
bakeries differed in their contextual factors like company size, degree of automation, and type
of products 6, 8. For assurance of their production quality, bakeries used HACCP, the Hygiene

Validation of IMAQE-Food: Instrument for Management Assessment and Quality Effectiveness in the Food sector
75
code for bread and confectionery bakeries, ISO 9000-series, GMP, BRC and systems that
integrate quality, health and safety at work, and environment.
In our study, only bakeries with more than 10 employees were examined. These bakeries were
responsible for the highest production volumes in the bakery sector. They did apply QA
systems and were willing to participate in contrast to smaller bakeries that did not yet apply
QA systems, were unwilling to participate due to a high workload, and were only responsible
for a small part of the production volume either.
Of 235 contacted bakeries 20% (48 bakeries) agreed to participate in the study. Persons
responsible for quality management of bakeries were contacted by a phone call. Figure 5.1
shows several characteristics of the sample: the 48 bakeries differed in type of product groups,
number of employees, degree of automation, type of outlets, relationships with other linkages
or bakeries, and applied QA systems.
0
20
40
60
80
100
Bread Confec-tionery
Mixed Biscuit
%
0
20
40
60
80
100
10-50 50-100 100-150 > 150Number of employees
%
0
20
40
60
80
100
Non-industrial Industrial
%
0
20
40
60
80
100
Own shop(s) External outlet(s)
%
Figure 5.1 Percentage of bakeries with specific characteristics.
a) type of product groups; b) number of employees; c) degree of automation (based on type of ovens used); d) type of outlets.
a b
c d

Chapter 5
76
0
20
40
60
80
100
Horizontal co-operation
Vertical co-operation
No co-operation
%
0
20
40
60
80
100
ImplementedQA system
Certified QAsystem
No QA system
%
0
20
40
60
80
100
GMP HACCP ISO BRC Other
%
0
20
40
60
80
100
HACCP ISO BRC
%
Figure 5.1 Percentage of bakeries with specific characteristics. (continue) e) type of relationships; f) extent to which QA systems have been implemented; g) applied QA systems:
HACCP consists of Hygiene code (□) and HACCP (■), ISO consists of ISO 9001(■), ISO 9002 (□), ISO 9001:2000 (■); h) Certified QA systems: HACCP consists of Hygiene code (□) and HACCP (■), ISO consists of ISO 9001 (□) and ISO 9002 (■).
With a response of 48 out of 765 bakeries with more than 10 employees, the reliability of the
sample is 86.3%, which means that the representativeness of the sample is acceptable. In
detail, the sample represented the bakery sector in type of product groups (Figure 5.2). We
interviewed a higher percentage of bakeries with more than 100 employees. In the bakery
sector the number of small bakeries is decreasing and the number of large bakeries is
increasing due to scaling-up, competitiveness of supermarkets and non-bakery products, and
lack of successors 6, which increases the usefulness of our sample. Moreover, the differences
in characteristics of the companies in our sample enabled the development and validation of
IMAQE-Food.
e f
g h

Validation of IMAQE-Food: Instrument for Management Assessment and Quality Effectiveness in the Food sector
77
0
20
40
60
80
100
Bread & Mixed Confectionery &Biscuit
%
0
20
40
60
80
100
20-100 > 100
Number of employees
%
Figure 5.2 Representativeness of the sample (■) in relation to the bakery sector (■). Data
obtained from CBS 7. a) type of product groups; b) number of employees.
IMAQE-Food
Table 5.1 shows the identified indicators of IMAQE-Food as obtained from previous research 5. These indicators were translated into a questionnaire (Appendix). This was built up
according to the following aspects: background information, contextual factors, quality
management, production quality, and a section about the experienced effect of implemented
QA system(s). Questions about background information and contextual factors were answered
beforehand using the internet or mail. Questions about quality management, production
quality, and finishing questions were answered in a face-to-face interview. Both quantitative
and qualitative indicators were used. Data were collected by open questions with field coding
combined with absolute answers. A scoring system was applied that measures differences
within the sample.
5.2.2 Evaluation of IMAQE-Food
According to Gamble 9 a measurement instrument that consists of several items should be
evaluated on accuracy and applicability, which involves reliability, validity, and
generalisability (Figure 5.3).
In our study, IMAQE-Food was tested on these three methodological requirements. The
procedure to analyse reliability, validity, and generalisability is described below.
a b

Chapter 5
78
Table 5.1 Identified performance measurement indicators for production quality, quality
management, and contextual factors (complexity of the organisation, complexity of the
production process, and complexity of the product assortment) after identification 5.
Element Identified indicators Production quality Product quality
1. Percentage of rejected products 2. Results of legislative evaluation 3. Results of technical evaluation 4. Percentage of complaints about product quality Availability 5. Percentage of complaints about availability Costs 6. Total costs
Quality management 1. Strategy 2. Supply control 3. Production control 4. Distribution control 5. Execution of production tasks Complexity of the organisation 1. Number and composition of employees
a. Number of employees b. Number of part timers c. Number of temporary employees d. Number of shifts
2. Percentage of not-producing affiliates 3. Number of suppliers 4. Percentage of produced products 5. Number of customers / delivery points 6. Percentage of products sold to third parties 7. Number of relationships (co-operation) Complexity of the production process 1. Number of production lines 2. Average number of times changing a production line in a day 3. Average number of times adjusting a production line in a day 4. Average number of process steps 5. Average number of critical control points 6. Degree of automation
Contextual factors
Complexity of the product assortment 1. Number of product groups 2. Type of product groups 3. Number of recipes 4. Percentage of products directly delivered or sold

Validation of IMAQE-Food: Instrument for Management Assessment and Quality Effectiveness in the Food sector
79
Figure 5.3 Evaluation of the measurement instrument (adapted from Gamble 9).
Reliability
Reliability is the ability to reproduce the same results under the same conditions in a
consistent way 3, 10-12. Reliable indicators allow generalising from one particular use of the
method to a wide variety of related circumstances 11.
Reliability of an indicator can be determined by the degree of correlation between the items
that comprise an indicator. If the association is high, the instrument yields consistent results
and is therefore reliable 9. The reliability coefficient is an index of the effectiveness of the
instrument, needed for validity reasons 11.
In our study, Cronbach�s alpha was used as reliability coefficient to estimate the internal
consistency of the indicators. For calculating alpha of a new instrument, a sample of 30 or
more respondents is statistically sufficient 3. In our study we sampled 48 bakeries which is
considered to be sufficient to test Cronbach�s alpha. A satisfactory level of reliability depends
on how a measure is being used. Although reliability coefficients of 0.70 or more are often
considered as a criterion for internally consistent established scales, the use of a minimum
alpha value of 0.60 will be sufficient for new scales in early stages of validation research 9, 13.
For our newly developed instrument, indicators were accepted when the value of alpha was
higher than 0.60.
All identified indicators that consisted of sets of items were tested on their internal
consistency. For example, the identified indicator �number and composition of employees�
Reliability GeneralisabilityValidity
Internal consistency
Evaluation of measurement instrument
Content
Criterion-related
Construct

Chapter 5
80
was tested on internal consistency with the items �number of employees�, �number of part-
timers�, �number of temporary employees�, and �number of shifts� (Table 5.1). In order to
improve the internal consistency, a newly developed procedure was used that automatically
removes items that show low inter-item correlations and calculates repeatedly Cronbach�s
alpha. Starting with a set of items, Cronbach�s alpha is calculated for all subsets of items that
could be formed by excluding one item from the set and keeping all other items in the set. For
each subset Cronbach�s alpha was calculated and compared with the alpha value of the whole
set. Now, two situations can be distinguished. (1) When Cronbach�s alpha improves, the
excluded item correlates low with all the other items in the set. (2) When Cronbach�s alpha
worsened, the excluded item correlates high with the all other items in the set. Definitely, this
item should be incorporated in the indicator. Using the procedure, items were deleted one at
the time, starting with the item with the largest change. This procedure of re-calculating
Cronbach�s alpha for subsets was repeated until the value for the whole set was 0.70 or more.
If the value of alpha did not improve to at least 0.60, the indicator was removed.
Subsequently, the reduced sets were analysed on construct validity, and reliability of the
obtained constructs was recalculated (see below).
Validity
Validity means that the instrument measures indeed what it should measure 2, 3, 10-12, 14. It
denotes the scientific utility of a measurement instrument, in terms of how well it measures
what it claims to measure 11. In our study, three types of validity were assessed i.e. construct
validity, criterion-related validity, and content validity.
Construct validity
Construct validity is the extent to which items of an indicator all measure the same construct 2,
3, 9, 11, 12. A construct is a set of items that measure the same underlying variable. The goal of
studying constructs is to obtain one or more indicators representing a set of items that use one
name 11.
In our study, construct validity of each reliable set of items was tested by rotated factor
analysis (varimax) to obtain constructs including items that all measure the same underlying
variable. This method assesses the unidimensionality of a set of items. A multidimensional set
needs more than one indicator to represent the value of a scale 15.
Meaningful items were selected based on factor loading. Items with high loadings (>0.20)
have high correlations, which means that they measure the same construct 11. Provided that at

Validation of IMAQE-Food: Instrument for Management Assessment and Quality Effectiveness in the Food sector
81
least one of the factor loadings was higher than 0.20, items were combined into a construct
that had similar loadings on two dimensions. The developed constructs were screened on
relationships concerning the content; those items with a low relationship were removed. For
each construct, Cronbach�s alpha was recalculated and compared with the criterion of internal
consistency i.e. Cronbach�s alpha > 0.60.
Criterion-related validity
Criterion-related validity is the extent to which the indicators are related to external
independent referents 2, 3, 9, 11, 12, 14.
In our study, a set of constructs of quality management was correlated with a set of variables
that measure production quality. The criterion-related validity was tested by canonical
correlation analysis and redundancy index to study relations between the two sets of quality
management and production quality.
Canonical correlation analysis maximises the correlation between two linear functions of sets
of variables 16, 17. The linear functions that yield the maximum (canonical) correlations are
termed canonical variates. The correlations of the variables within the set with the canonical
variate indicate the contribution of each variable to the canonical variate. The mean of the
squared correlations is the proportion of the variance of each set that is accounted for by the
first canonical variate 16.
The redundancy index summarises the overlap between two sets of variables. It quantifies the
ability of one set of variables, expressed as a canonical variate, to explain the variation of the
variables in the other set 11, 17.
Content validity
Content validity is the extent to which all aspects are measured 9-12, 14, in other words, whether
IMAQE-Food is truly a comprehensive measure of performance of food quality systems.
Content validity can be ensured whether the instrument contains a representative collection of
indicators and whether methods of test construction are used 11. In our study, the identification
procedure was taken to assure content validity of the indicators. A balanced usage of different
types of indicators and several measure units was also applied to be able to measure all
relevant aspects.

Chapter 5
82
Generalisability
Generalisability is the extent to which indicators can be applied in different research settings
and situations 9-11, 14. Indicators should be generic to be applicable as instrument within a
specific sector and in other sectors. In this study, the applicability of IMAQE-Food in
different settings and situations was examined by analysing characteristics of the bakery
industry. Besides, in another study, we also adapted the instrument for the vegetable and fruit
processing industry to study the applicability of the instrument in another food sector.
5.3 Results
Results of the evaluation of IMAQE-Food on reliability, validity and generalisability are
described below. In the next section, the variables of IMAQE-Food are explained.
5.3.1 Evaluation of IMAQE-Food
Reliability and construct validity
Table 5.2 shows the variables of IMAQE-Food that comply with the criteria on reliability and
construct validity. These variables are divided in the elements production quality, quality
management, and contextual factors (i.e. complexity of the organisation, complexity of the
production process, and complexity of the product assortment).
Items were selected for a construct, i.e. an indicator that consisted of a set of items, if the
subset of items was internally consistent and unidimensional. All variables in Table 5.2 are
unidimensional or valid constructs resulting from factor loading. As shown, the Cronbach�s
alpha value of 12 indicators was higher than 0.64, which is acceptable for a newly developed
measurement instrument. Removing more items increased reliability but decreased validity,
which makes the instrument less useful. Indicators that consisted of one item have obviously a
Cronbach�s alpha value of 1, and therefore they are marked (*).

Validation of IMAQE-Food: Instrument for Management Assessment and Quality Effectiveness in the Food sector
83
Table 5.2 Overall internal consistency of valid constructs for the elements production quality,
quality management, and contextual factors (complexity of the organisation, complexity
of production process, complexity of product assortment); compliance with reliability of
valid constructs. * = variable consisting of one item (Cronbach�s alpha = 1)
Element Variables Reliability (Cronbach�s
alpha)
Number of items
Percentage of rejected products * 1 Results of legislative evaluation * 1 Results of technical evaluation * 1 Percentage of complaints about product quality * 1
Production Quality
Percentage of complaints about availability * 1 Strategy: - Control of strategy
0.6497
3
Supply control: - Allocation of supplying raw materials - Supply control
0.7527 0.7792
3 8
Production control: - Planning of production - Control of production
0.7859 0.7933
3 5
Distribution control: - Control of receiving orders - Planning of distribution
0.7829 0.8486
7 5
Quality management
Execution of production tasks: - Control of execution of production tasks
0.7386
5
Number of external relations 0.6747 2 Number of temporary employees * 1 Percentage of not-producing affiliates * 1 Percentage of produced products * 1 Number of customers / delivery points * 1 Number of employees (log) 0.8192 2
Complexity of organisation
Number of relationships (co-operation) * 1 Degree of automation 0.8057 2 Average number of times changing a production line in a day (log)
* 1
Average number of times adjusting a production line in a day (log)
* 1
Average number of process steps * 1
Complexity of production process
Average number of critical control points * 1 Number of product groups 0.7336 3
Contextual factors
Complexity of product assortment
Type of product groups * 1

Chapter 5
84
Criterion-related validity
The statistical data were evaluated, although production quality was not a sufficient measure
for quality management because it could not be determined completely due to lack of data in
practice 5. A set of constructs of quality management was correlated with a set of variables
that measure production quality. For production quality, the first canonical variate accounted
for 24% of the variance of the set. The redundancy index in the set of production quality was
0.10 meaning that only 10% of the variance in this set was accounted for by the canonical
variate of the set of quality management variables.
It was concluded that IMAQE-Food had low criterion-related validity, which means that the
indicators of quality management were not strongly related to the variables of production
quality. Therefore, effects of quality management on production quality could not be
confirmed nor rejected for the current sample.
Content validity
Based upon the identification procedure the majority of the identified indicators were found in
the beginning. Figure 5.4 shows the relation between the number of respondents interviewed
and the percentage of identified indicators.
Figure 5.4 Percentage of the performance measurement indicators identified by N respondents
(where 62 respondents* = 100%). * = qualitative research: N=8; delphi sessions: N=6; quantitative research: N=48
0
2 0
4 0
6 0
8 0
1 0 0
1 2 0
0 1 0 2 0 3 0 4 0 5 0 6 0N u m b e r o f re s p o n d e n ts in te rv ie w e d
Perc
enta
ge o
f ind
icat
ors
iden
tifie
d (%
)

Validation of IMAQE-Food: Instrument for Management Assessment and Quality Effectiveness in the Food sector
85
Most indicators (89%) were identified in the qualitative research (N=8 interviews) and the
delphi sessions (N=6 interviews). The latter method did not alter the percentage but was
required to develop an instrument that is applicable in practice. The verification phase
adjusted 11% of the indicators resulting in the current identified performance measurement
indicators. Our results correspond with research of Griffin and Hauser 18; they hypothesised
that 20-30 interviews are necessary to get 90-95% of the identified items. Although some
indicators may have been missed, the major number of our indicators has been identified for
the bakery sector. Therefore, it is concluded that the indicators with a Cronbach�s alpha value
of 1 (Table 5.2) are indeed represented by one item.
Because content validity was obtained by a structured identification procedure, which resulted
in a representative collection of indicators and methods of test construction (i.e. construction,
pre-testing, and evaluation), it was concluded that IMAQE-Food is truly a comprehensive
measure of performance of food quality systems.
Generalisability
Indicators should be generic to be applicable as instrument within a specific sector and in
other food sectors. The sample of our study produced the largest part of production volumes
in the bakery sector. It represents the bakery sector with the exception of small non-industrial
mixed bakeries. However, the number of small bakeries is decreasing, whereas the number of
large companies is increasing. Therefore, the indicators of validated IMAQE-Food are
considered to be generic for the bakery sector.
Moreover, although a specific food sector make results less generalisable for others, the
bakery industry includes differences in e.g. shelf life of products, type of processes, type of
customers and organisation size, which are relevant for other food sectors as well. Therefore,
a wider application of IMAQE-Food is expected.
In addition, in another study, we adapted the instrument for the vegetable and fruit-processing
sector. Only small modifications of the indicators were needed to make the instrument
suitable for that specific sector 19. Table 5.3 shows the selected indicators for the vegetable
and fruit-processing sector compared to the validated indicators in the bakery industry. The
results suggest that IMAQE-Food is also applicable in other food sectors as well, with
relatively small modifications.

Chapter 5
86
Table 5.3 Indicators for the vegetable and fruit processing sector (obtained by delphi sessions
(N=4) and qualitative research (N=6)) compared to validated indicators in the bakery
sector (N=62).
Element Indicators for the vegetable and fruit processing sector (non-validated)
Indicators for the bakery sector (validated)
Production Quality Product quality Results of legislative evaluation Percentage of complaints about product quality Availability Percentage of undelivered products Percentage of additional deliveries Percentage of out-of-stock Percentage of overproduced products Costs Turnover
Product quality Percentage of rejected products Results of legislative evaluation Results of technical evaluation Percentage of complaints about product quality Availability Percentage of complaints about availability
Strategy Control of strategy Supply control Allocation of supplying raw materials
Supply control Production control Planning of production
Control of production Distribution control Control of receiving orders
Planning of distribution
Quality management
Execution of production tasks Control of execution of production tasksComplexity of organisation Number of employees Percentage of produced products Number of relationships (co-operation) Percentage of contracted distribution Complexity of purchase Percentage of unchanging points of purchase Number of co- operative relations with suppliers / number of points of purchase Maximum distribution time of raw materials
Contextual factors
Complexity of organisation
Complexity of sales Percentage of frequently buying customers Number of co-operative relations with suppliers / number of customers Maximum distribution time of final products
Number of employees (log) Number of temporary employees Percentage of produced products Number of external relations Number of relationships (co-operation) Percentage of not-producing affiliates Number of customers / delivery points

Validation of IMAQE-Food: Instrument for Management Assessment and Quality Effectiveness in the Food sector
87
Continue Table 5.3
Element Variables for the vegetable and fruit processing sector (non-validated)
Variables for the bakery sector (validated)
Complexity of production process
Degree of automation Average number of times changing a production line in a day Number of cutting machines Average number of washing steps Percentage of products with preparing steps
Degree of automation Average number of times changing a production line in a day (log) Average number of times adjusting a production line in a day (log) Average number of process steps Average number of critical control points
Contextual factors
Complexity of product assortment
Number of product groups Type of product groups Percentage of stored products Total number of products
Number of product groups Type of product groups
5.3.2 Variables of IMAQE-Food
Table 5.2 shows the reliable and valid variables of IMAQE-Food divided in production
quality, quality management, and contextual factors.
Production quality
In a previous study, production quality was divided into physical product quality, availability
and costs 5. Table 5.1 shows the four identified items of physical product quality: percentage
of rejected products; results of legislative evaluation; results of technical evaluation;
percentage of complaints about product quality. For availability, the identified indicator was
percentage of complaints about availability. For costs, no indicators were identified because
of lack of data in practice 5.
In this study, after removal of items the set of product quality resulted in only two internally
consistent items, which is too few for a response variable to measure effectiveness of food
quality systems. Therefore, to explain the response variable production quality with more
items, the five identified items were considered as five independent response variables (Table
5.2). The use of independent variables increased the validity, which results in a better measure
of production quality.

Chapter 5
88
Quality management
Table 5.2 shows that quality management consisted of eight internally consistent and valid
variables.
The variables of quality management were divided in planning and control. Planning is the
process of determining exactly what a company will do to accomplish its objects. Controlling
is the process of measuring performance, comparing performance to planning, and taking
corrective actions if necessary.
Contextual factors
Table 5.2 shows that the contextual factors included four constructs i.e. number of external
relations; number of employees; degree of automation; and number of product groups. These
constructs and the identified indicators with a Cronbach�s alpha value of 1 were used as
individual variables to analyse the influence of these variables on the five variables of
production quality.
The contextual factor complexity of the organisation consisted of six reliable and valid
variables, whereas five variables were found for complexity of the production process.
Complexity of the product assortment consisted of two reliable and valid variables (Table
5.2).
Table 5.2 shows that three variables i.e. number of employees, average number of times
changing a production line in a day, and average number of times adjusting a production line
in a day, were transformed into the natural logarithm (log). This was done to diminish the
influence of extreme observations and to get a more even spread along the scale.
5.4 Conclusions and considerations
5.4.1 Evaluation of IMAQE-Food
Our instrument IMAQE-Food that measures effectiveness of food quality systems was
evaluated on reliability, validity, and generalisability. In quality management literature,
measurement issues related to reliability and validity are slightly substantiated 3. Although
some studies have focused on the relationship between various quality management elements
and performance, they did not identify and validate the quality management constructs, nor
did they analyse relationships among the constructs 4. A few researchers have developed

Validation of IMAQE-Food: Instrument for Management Assessment and Quality Effectiveness in the Food sector
89
instruments for quality management, which were scientifically validated: Saraph et al. 2,
Flynn et al. 3, Ahire et al. 4, Black and Porter 20, and Benson et al. 21. These researchers used
various types of validation and reliability tests. The application of their instruments differed
and was not specific for the food sector. Our instrument IMAQE-Food was developed for the
food industry in specific.
Although Ahire et al. 4 studied correlations among constructs, they emphasised that their
results could not be used directly to confirm interactions among the various constructs and
their impact on product quality. They revealed possible second-order relationships and
therefore the interactions could be mediated by another construct. Only Benson et al. 21
studied relationships between quality management and context, but they did not examine the
impact on quality performance in contrast to our instrument.
5.4.2 Usefulness of IMAQE-Food for application in the food sector
IMAQE-Food
IMAQE-Food is a reliable and valid instrument that determines the relations between quality
management, production quality, and contextual factors. The instrument is considered to be
generic for the bakery sector. Adaptation of the instrument in the vegetable and fruit-
processing sector required only small modifications, indicating that IMAQE-Food will be
easily applicable in other food sectors as well. For application of IMAQE-Food in other
sectors, qualitative research and delphi sessions will be required to verify relevancy of
indicators for that sector and to specify the sub indicators or items 5. These items should be
evaluated on reliability and validity by use of our developed procedure before effectiveness
can be assessed by regression analysis.
Improvement of IMAQE-Food
IMAQE-Food can be improved if more data are available and a larger sample size is obtained.
An appropriate data collection and a larger sample size will improve validity and reliability of
the current instrument and will enable the assessment of effectiveness by IMAQE-Food. An
appropriate measure of production quality enables to use the criterion-related validity between
quality management and production quality for assessment of effectiveness of food quality
management. Only a full data set enables the direct rejection or confirmation of the
hypotheses of the conceptual model that quality management and/or contextual factors
influence production quality. Moreover, a more comprehensive reliability test can be used that

Chapter 5
90
not only tests the internal consistency of the instrument but also compares with other
moments or methods by performing test-retest and parallel-forms reliability estimates.
Although improvement is possible, IMAQE-Food is a reliable and valid instrument. The
sample size was sufficient for calculating Cronbach�s alpha of a new instrument 3. The studied
bakeries differ in relevant aspects for measuring effectiveness whereas disturbing factors have
been reduced.
Application of IMAQE-Food
IMAQE-Food can be used for obtaining knowledge about effectiveness of food quality
systems. The developed procedure is useful for obtaining insight in which contextual factors
should be managed, which technological and managerial measures should be taken, and what
level of quality management should be achieved in order to assure food quality. This supports
food manufacturers in deciding which system is most suitable and how to achieve their
objectives. This can result in a higher production quality, a better compliance with
expectations of consumers, regaining and maintaining trust of consumers in food production
quality, and maintaining and improving competitiveness of food manufacturers.
IMAQE-Food can be detailed for existent QA systems in order to know the actual
contribution of these QA systems to food quality assurance. Furthermore, the instrument can
be applied in other food sectors using qualitative research, delphi sessions, and our developed
procedure to evaluate reliability and validity and to analyse relationships.
5.5 References
1. Spiegel, van der M. Luning, P.A. Ziggers, G.W. and Jongen, W.M.F. (2003). Evaluation of performance measurement instruments on their use for food quality systems. Accepted in Critical Reviews in Food Science and Nutrition.
2. Saraph, J.V. Benson, P.G. and Schroeder, R.G. (1989). An instrument for measuring the critical factors of quality management. Decision Sciences, 20 (4), 810-829.
3. Flynn, B.B. Schroeder, R.G. and Sakakibara, S. (1994). A framework for quality management research and an associated measurement instrument. Journal of Operations Management, 11 (4), 339-366.
4. Ahire, S.L. Golhar, D.Y. and Waller, M.A. (1996). Development and validation of TQM implementation constructs. Decision Sciences, 27 (1), 23-56.
5. Spiegel, van der M. Luning, P.A. Ziggers, G.W. and Jongen, W.M.F. (2003). Development of the instrument IMAQE-Food to measure effectiveness of quality management. Accepted in International Journal of Quality and Reliability Management.
6. NBC. (2000). Inspelen op verluxing: Structuurrapport 2000. Wageningen: Nederlands Bakkerij Centrum. 7. CBS. (2003). Financiële en algemene gegevens. http://neon.vb.cbs.nl. 8. Diepstraten, J. (2000). Kwalitatieve analyse van zeven cases in de bakkerijsector op basis van de
productiekwaliteit. MSc-thesis. Wageningen: Wageningen University.

Validation of IMAQE-Food: Instrument for Management Assessment and Quality Effectiveness in the Food sector
91
9. Gamble, B. (1999). Measurement and scaling: Noncomparative scaling techniques. pp. 266-291. In: Malhotra, N.K. Marketing Research: An Applied Orientation. Upper Saddle River, New Jersey: Prentice Hall.
10. Leeuw, de A.C.J. (1996). Bedrijfskundige methodologie: management van onderzoek. Assen: Van Gorcum & Comp.
11. Nunnally, J.C. and Bernstein, I.H. (1994). Psychometric Theory. New York: McGraw-Hill. 12. Bohrnstedt, G. (1983). Measurement. pp. 69-121. In: Rossi, P. Wright, J. Anderson, A. (Eds.). A handbook of
survey research. San Diego, CA: Academy Press. 13. Nunnally, J.C. (1978). Psychometric Theory. New York: McGraw-Hill. 14. Kumar, V. Aaker, D.A. and Day, G.S. (2002). Essentials of marketing research. New York, etc.: Wiley &
Sons. 15. Venkatraman, N. (1989). Strategic orientation of business enterprises: The construct, dimensionality and
measurement. Management Science, 35 (8), 942-962. 16. Thompson, B. (1984). Canonical Correlation Analysis: uses and interpretation. Beverley Hills, etc.: Sage. 17. Stewart, D. and Love, W. (1968). A general canonical correlation index. Psychological Bulletin, 70 (3), 160-
163. 18. Griffin, A. and Hauser, J.R. (1993). The voice of the customer. Marketing Science, 12 (1), 1-27. 19. Nijssen, I.T.C. (2001). Toepasbaarheid van het conceptuele model van Spiegel voor de groente- en
fruitbewerkingssector: Kwalitatieve analyse betreffend de realisatie van kwaliteit in groentesnijderijen. MSc-thesis. Wageningen: Wageningen University.
20. Black, S.A. and Porter, L.J. (1996). Identification of the critical factors of TQM. Decision Sciences, 27 (1), 1-21.
21. Benson, P.G. Saraph, J.V. and Schroeder, R.G. (1991). The effects of organizational context on quality management: an empirical investigation. Management Science, 37 (9), 1107-1124.


6
Measuring effectiveness of food quality management
in the bakery sector
Abstract
This chapter investigates the effectiveness of food quality management. The bakery sector
was selected to study the effectiveness. Relations between production quality, quality
management and contextual factors were studied from a generic and a specific point of view.
On the generic level, performance of quality management was related to contextual factors i.e.
complexity of respectively organisation, production process, and product assortment.
Assessment on the specific level revealed that effective quality management activities in the
bakery sector were (1) control of strategy, (2) allocation of supplying raw materials, (3)
supply control, (4) control of production, (5) control of execution of production tasks, (6)
control of receiving orders, and (7) planning of distribution. These quality management
activities were effective, since interdependency was found between a higher level of these
activities and a higher score for specific indicators for production quality i.e. higher results of
respectively legislative and technical evaluation, lower percentage of rejected products, and
lower percentage of complaints about respectively product quality and availability. Each
bakery has a different set of contextual factors such as type of QA systems, size of the
company, degree of automation, and product assortment. Depending on these differences in
context, bakeries should select and implement specific quality management activities suitable
to their situation to increase their production quality.
This chapter has been submitted for publication as:
Spiegel, van der M. Luning, P.A. Boer, de W.J. Ziggers, G.W. and Jongen, W.M.F. Measuring effectiveness of
food quality management in the bakery sector. Total Quality Management and Business Excellence.

Chapter 6
94
6.1 Introduction
Inappropriate management of food production operations can cause several problems on
quality aspects like food safety, customer satisfaction, and availability. For example,
inappropriate temperature control of confectionery containing e.g. cream, fresh fruit and meat
causes growth of micro-organisms, which can result in safety problems, product failures, and
customer complaints. Inappropriate planning of production and distribution causes either
overproduction resulting in loss of materials or unavailability of products, which require
additional production and deliveries leading to customer complaints and failure costs.
Food manufacturers have to decide which quality management activities are most suitable for
their specific situation and how they should be implemented. Therefore, the actual
contribution of food quality management, i.e. the effectiveness, has to be established. Food
quality management is considered to be effective when a higher level of quality management
results in a higher production quality. Moreover, quality management is effective when it
reduces the influence of contextual factors on production quality. IMAQE-Food measures
effectiveness by assessing relations between quality management activities, production
quality and contextual factors.
When evaluating the appropriateness of an assessment method, a tension exists between
approaching reality and performing a robust analysis. To approach reality as best as possible,
all identified indicators should be used. However, the analysis of relations is more robust by
using only necessary indicators based on statistical calculations 1.
This chapter investigates the measurement of effectiveness of food quality management,
specifically for the bakery sector. Relations between production quality, quality management
and contextual factors are studied from two points of view i.e. a generic approach that
estimates reality as best as possible by using identified indicators, and a specific approach that
estimates relations by using only statistically relevant constructs.
6.2 Measurement method of effectiveness
For measuring the effectiveness of food quality management on the generic level, content-
validated indicators were used, whereas on the specific level constructs were used.
Effectiveness was measured by the assessment of relations between quality management,
production quality and contextual factors using appropriate indicators (Figure 1.1). These

Measuring effectiveness of food quality management in the bakery sector
95
indicators were identified and validated through interviews with experts and (quality)
managers in the bakery sector 2, 3, i.e. content validity. Subsequently, these indicators were
statistically analysed to reduce the number of indicators to relevant constructs, i.e. construct
validity. Constructs are sets of indicators that measure the same relations. Their use results in
a more robust instrument 3.
6.2.1 Generic approach
In the generic approach relations were analysed between the elements of Figure 3.1 using
content-validated indicators.
Before identifying relations, firstly the internal consistency of the elements was determined by
calculating Cronbach�s alpha and the total score of each element. Table 6.1 shows the internal
consistency of the elements and the indicators that comprise the elements. An element was
relevant when Cronbach�s alpha was at least 0.60. Results show that for production quality
Cronbach�s alpha was not calculated. This was due to the fact that data for several indicators
were not available at all bakeries, reducing the number of respondents. Consequently, the
indicators of production quality could not be used as measures of the element. The indicator
with the highest number of available data was �results of legislative evaluation� (N=44 out of
N=48).
Data for the indicators were collected among a sample of 48 bakeries. These data were
quantified with scores in a range of 0-10 to measure differences within the sample. The total
score of each element was calculated by summarising the scores of indicators that comprise
one internal consistent element. No weight factors were used.
Secondly, the relations were explored using regression analysis. Relations were considered
significant at the 5%-level (p<0.05).
Finally, the effectiveness of food quality management was determined by evaluating the
relations. Food quality management was considered effective when a higher level of quality
management was related to a higher production quality, and when relations of contextual
factors and a lower production quality were turned into relations with a higher production
quality due to food quality management.

Table 6.1 Indicators of the internal consistent elements on the generic level and indicators of the internal consistent constructs on the specific level. * = variable consisting of one item (Cronbach�s alpha = 1)
Element Indicators Cronbach�s alpha
Constructs Cronbach�s alpha
Number of external relations 0.6747 Number of temporary employees * Percentage of not-producing affiliates * Percentage of produced products * Number of customers / delivery points * Number of employees (log) 0.8192
Complexity of organisation
1. Number and composition of employees 2. Number of suppliers 3. Number of customers / delivery points 4. Percentage of products sold to third parties
0.7255
Number of relationships (co-operation) * Degree of automation 0.8057 Average number of times changing a production line in a day * Average number of times adjusting a production line in a day * Average number of process steps *
Complexity of production process
1. Number of production lines 2. Average number of times changing a production line in a day 3. Average number of times adjusting a production line in a day 4. Average number of critical control points
0.7367
Average number of critical control points * Number of product groups 0.7336 Complexity of
product assortment 1. Number of product groups 2. Type of product groups 3. Number of recipes 4. Percentage of products directly delivered or sold
0.7029 Type of product groups *
Control of strategy 0.6497 Allocation of supplying raw materials 0.7527 Supply control 0.7792 Planning of production 0.7859 Control of production 0.7933 Control of receiving orders 0.7829 Planning of distribution 0.8486
Quality management 1. Strategy 2. Supply control 3. Production control 4. Distribution control 5. Execution of production tasks
0.6765
Control of execution of production tasks 0.7386 Percentage of rejected products * Percentage of rejected products * Results of legislative evaluation * Results of legislative evaluation * Results of technical evaluation * Results of technical evaluation * Percentage of complaints about product quality * Percentage of complaints about product quality *
Production quality
Percentage of complaints about availability * Percentage of complaints about availability *

Measuring effectiveness of food quality management in the bakery sector
97
6.2.2 Specific approach
In the specific approach relations between the elements were also analysed. However, in this
study we used statistically established constructs of indicators. This approach obtains
unambiguous results due to modification of data and relations into high orthogonal data and
linear relations, which are requirements for a regression analysis.
Before identifying relations, firstly construct validity of each reliable set of indicators was
tested by rotated factor analysis (varimax) to obtain constructs consisting of indicators that all
measure the same underlying variable. The internal consistency of the constructs was
determined by calculating Cronbach�s alpha, and the total score of each construct was
calculated. Table 6.1 shows the constructs and their internal consistency. Results show that a
large number of constructs was developed all measuring another aspect. Therefore, on a
statistical basis, these constructs were not a measure for the elements but should be considered
separately. Like the generic approach, production quality was divided in five separate
indicators.
For each studied bakery the total score of each construct was established by the average of
indicators that comprise one construct of an element without weight factors.
Secondly, relations were assessed using GenStat procedure RSELECT 4. This procedure
evaluates all sets of possible relations and selects a small number of best sets, which prevents
that possible relations are overlooked due to the large number of highly orthogonal constructs.
The relations were identified by using three criteria for measuring goodness of fit i.e. R2, R2
adjusted, and Mallow�s Cp.
R2 is the percentage of variance accounted for and shows the extent to which indicators of
production quality relate to constructs of quality management and contextual factors. It
always improves with the addition of another construct. The adjusted version of R2 is usually
a better guide in the selection of sets because it takes into account the number of constructs.
R2 adjusted improves when the F-ratio due to the addition of a construct is larger than 1.
Mallow�s Cp is a measure for the robustness of the relations and is related to the Akaike
information criterion. Mallow�s Cp tends to select smaller subsets than R2 and R2 adjusted. It
improves when the F-ratio due to the addition of a construct is larger than 2.
A construct was added when Mallow�s Cp value improved. Occasionally, the calculation of
Mallow�s Cp failed due to the number of not available values in the response variable. In
those cases, selecting best sets of relations was based on R2 adjusted. Although all three
Chapter 6
98
criteria were used, Mallow�s Cp was used as the predominant one. The selection was
complicated due to the high degree of correlation among constructs in our data. To obtain
stable relations, only those relations were selected that showed the lowest degree of
correlation.
When selection is governed by statistical criteria only, alternative sets of relations with good
interpretative purposes may easily been overseen. Therefore, for indicators of production
quality three or four alternative sets of relations (see Table 6.2 and 6.3) were selected which
all fit equally well differing in priority of the above-mentioned criteria.
Finally, effectiveness was determined similar to the generic approach.
6.3 Results
In this section, we first describe the relations on both a generic and a specific level. Next the
effectiveness of food quality management is discussed.
6.3.1 Generic approach
Figure 6.1 shows the significant relations between �results of legislative evaluation�, quality
management and complexity of respectively organisation, production process and product
assortment. As shown �results of legislative evaluation� was negatively related to complexity
of the production process. Between the level of quality management and the score of �results
of legislative evaluation� no effect was found. Complexity of respectively organisation and
production process were positively related to quality management, whereas complexity of
product assortment was negatively related.
These relations mean that bakeries with a higher complexity of respectively the organisation
and production process and a lower complexity of the product assortment performed at a
higher level of quality management. However, this had no effect on �results of legislative
evaluation�.

Measuring effectiveness of food quality management in the bakery sector
99
Figure 6.1 Identified relations between �results of legislative evaluation�, quality management
and contextual factors obtained by regression analysis using the generic approach (R2
= 14.3%, p<0.05). + = positive relation, - = negative relation, numbers express the regression coefficient
6.3.2 Specific approach
To study the generic relations in more detail and to examine the robustness of the instrument,
we used constructs of the identified indicators. In Table 6.2, significant relations between
indicators of production quality and constructs of quality management and contextual factors
are marked (+/-). A plus indicates a positive relation and a minus a negative relation. Table 6.3
shows the relations between constructs of quality management and contextual factors.
Table 6.2 and 6.3 show that robustness of the instrument was obtained, because maximal
seven constructs were necessary. Moreover, these constructs explain a large part of the
indicators of production quality. The explained variance varied dependent on the indicator of
production quality. The indicators of production quality were related to the constructs of
quality management and contextual factors in a range of R2=42.8-73.3%. The constructs of
quality management were related to constructs of contextual factors in a range of R2=16.0-
52.5%.
Table 6.2 and 6.3 show that all indicators of production quality were related to the constructs
of quality management and contextual factors, whereas all constructs of quality management
related to the constructs of contextual factors.
+0.421
- 0.330
Complexity of the production process Production quality Results of legislative evaluation
Quality management
+0.479
Complexity of the product assortment
Complexity of the organisation
-0.289

Table 6.2 Relations between five indicators for production quality, and constructs for quality management and contextual factors obtained by regression analysis (1 to 4 = number of fitted sets of relations, + = positive relation, - = negative relation)
% Rejected products % Complaints about
product quality Results of legislative evaluation
Results of technical evaluation
% Complaints about availability
Constructs
1 2 3 4 1 2 3 1 2 3 1 2 3 1 2 3 Complexity of the organisation Number of external relations Percentage of non-producing affiliates Percentage of produced products Number of customers / delivery points Number of employees (log) Number of temporary employees Number of relationships (co-operation) Complexity of the production process Degree of automation Average number of times changing a production line in a day (log) Average number of times adjusting a production line in a day (log) Average number of process steps Average number of critical control points Complexity of the product assortment Number of product groups Type of product groups Quality management Control of strategy Allocation of supplying raw materials Supply control Planning of production Control of production Control of execution of production tasks Control of receiving orders Planning of distribution
- - -
-
+ - -
- - - -
-
+ - - -
+
+ - - -
+
+
+ - - -
+
+
+ - - -
-
+ -
+
-
+ -
+
+
- + -
+
+
- -
+ -
+
+
- -
+ -
+
+
+
- -
+
+ -
+
+
-
+ - -
-
+ - -
-
+ - - -
R2 (%) 42.8 48.6 46.8 55.5 54.5 59.3 57.4 45.0 47.4 47.0 57.6 64.7 63.2 66.7 66.3 73.3 R2
adj (%) 34.7 38.4 36.2 43.7 45.8 49.5 47.2 39.0 40.1 39.7 47.0 54.0 52.0 60.4 60.1 66.5

Table 6.3 Relations between seven constructs for quality management, and constructs for contextual factors obtained by regression analysis (1 to 3 = number of fitted sets of relations, + = positive relation, - = negative relation)
Control of strategy Allocation of supplying raw materials
Supply control Planning of production
Control of produc-tion
Control of execution of production tasks
Control of recei-ving orders
Planning of distribution
Constructs
1 2 3 1 2 3 1 2 3 1 2 1 1 2 3 1 1 2 Complexity of the organisation Number of external relations Percentage of non-producing affiliates Percentage of produced products Number of customers / delivery points Number of employees (log) Number of temporary employees Number of relationships (co-operation) Complexity of the production process Degree of automation Average number of times changing a production line in a day (log) Average number of times adjusting a production line in a day (log) Average number of process steps Average number of critical control points Complexity of the product assortment Number of product groups Type of product groups
+
+ - -
+ +
+
+
+ - -
+
+ +
+ - -
+ +
+ +
+ - -
+ +
+ - -
+ + - -
+
+ - -
- -
+ -
- -
+ -
+
+
+
+
+ -
+
-
+ +
+
-
+
+ -
-
+
+ -
+ - - +
+
+
+
+
+
R2 (%) 42.0 40.3 46.1 52.5 50.8 50.5 34.1 37.3 37.2 44.7 44.5 16.0 48.2 47.0 46.9 19.7 28.5 31.6 R2
adj (%) 33.0 31.0 36.2 46.5 44.6 44.3 29.0 31.2 31.1 42.1 41.9 10.1 43.6 41.8 41.7 11.8 25.2 26.7

Chapter 6
102
Table 6.2 reveals that the relations with �percentage of complaints about availability� are best
explained by the constructs (R2=66.7-73.3%). The most stable relations of this indicator are
those with the constructs �planning of distribution� and �control of production�, because they
are found in the three possible sets of relations. �Planning of distribution� combines
information on delivery requirements like delivery time, location, distribution conditions,
orders and capacity, into a distribution schedule. Bakeries with a higher level of this construct
used more information for the planning and changed their schedule when necessary. This may
result in a better compliance of the delivery of products with customer requirements, which in
turn decreases the percentage of complaints. Bakeries with a higher level of �control of
production� evaluated products and processes on a larger number of aspects using many types
of information, and they used registrations and evaluations to improve the production process
including procedures and communication to employees. This may result in a higher quality of
products and processes, which leads to a decrease in the percentage of complaints.
In Table 6.2 is also shown that �results of technical evaluation� have the most stable relations,
since six relations were found in the three possible sets of relations of this indicator. For
example, higher �results of technical evaluation� were related to a smaller number of external
relations (e.g. suppliers). Possibly a smaller number of suppliers causes less variation of raw
materials resulting in a higher product quality. Besides, the results were positively related to
number of employees. In general, larger organisations have more facilities and knowledge
than smaller organisations, which may result in a higher level of product quality and food
safety. Another relation was shown between higher �results of technical evaluation� and a
lower degree of automation. Possibly professional skills and experience of bakers improved
the product quality. Furthermore, �results of technical evaluation� were positively related to
number of critical control points. When more critical control points are established, more
potential food safety hazards are identified and controlled, which may result in a higher level
of food safety.
6.3.3 Effectiveness of food quality management
The found relations were used to assess the effectiveness of food quality management among
the group of studied bakeries. Food quality management is considered to be effective when a
higher level of quality management and a higher production quality are interdependent.
Quality management is also effective when it changes the relation between contextual factors
and a lower production quality into a relation with a higher production quality.

Measuring effectiveness of food quality management in the bakery sector
103
Seven activities of food quality management were effective in the bakery sector: (1) control of
strategy, (2) allocation of supplying raw materials, (3) supply control, (4) control of
production, (5) control of execution of production tasks, (6) control of receiving orders, and
(7) planning of distribution. Table 6.4 shows the indicators of production quality for which the
quality management activity is effective and the related contextual factors.
The quality management activities were effective, since interdependency was found between
a higher level of these activities and a higher score for indicators of production quality i.e.
higher results of respectively legislative and technical evaluation, lower percentage of rejected
products, and lower percentage of complaints about respectively product quality and
availability. The activities were effective for bakeries with various characteristics of
organisation, production process and product assortment.
6.4 Discussion and conclusions
6.4.1 Measurement of production quality
Production quality was measured by the bakeries themselves and by inspection agencies. We
studied five indicators of production quality separately, because we could not use one measure
for production quality due to unavailability of data in the bakery sector 2, 3. For an appropriate
measure of effectiveness, bakeries should collect more data about production quality. As a
consequence of measuring the indicators of production quality separately, we have only been
able to study the effects of quality management and contextual factors on one specific
indicator of production quality. If production quality was assessed as one single measure,
other relations have been found with effective quality management activities for more aspects
of production quality.
6.4.2 Relevancy of indicators
Relations were found between the five indicators of production quality and constructs of
quality management and contextual factors. The total variance varied in a range of R2=42.8-
73.3%. The variance shows that our procedure selected relevant indicators and omitted
disturbing influences, although the indicators for production quality were also associated with
other unknown variables. Examples of possible variables are: experience, organisational
culture, quality strategy and policy, quality design and quality improvement. These variables
should be evaluated on relevancy, reliability and validity using our structured procedure.

Table 6.4 Effective activities of food quality management for indicators of production quality in the bakery sector. O = complexity of the organisation; PP = complexity of the production process; PA = complexity of the product assortment
Quality management Effective activity Description
Indicator of production quality Contextual factors related with quality management
% Complaints about product quality
Results of technical evaluation
Control of strategy In the strategy is formulated how the organisation�s mission and objectives have to be accomplished. Items were focused on the evaluation of a long-term plan.
% Complaints about availability
Number of external relations (O) % Non-producing affiliates (O) Number of relationships (O) Degree of automation (PP) Number of changes (PP) Number of process steps (PP) Number of critical control points (PP) Number of product groups (PA) Type of product groups (PA)
Allocation of supplying raw materials
The activities of supplying raw materials can be performed by the bakery itself and can be allocated to a concern or a purchase organisation. Items: • allocation of purchasing raw materials • allocation of selecting suppliers • allocation of making agreements with
suppliers.
% Complaints about availability Number of external relations (O) % Non-producing affiliates (O) % Produced products (O) Number of customers / delivery points (O) Number of employees (O) Degree of automation (PP) Number of process steps (PP) Number of product groups (PA) Type of product groups (PA)
% Rejected products
Supply control Supply control is that part of quality control that focuses on the purchase process. It is an ongoing process of evaluating performance of suppliers and raw materials, and taking corrective actions when necessary. Items: • purchase and selection of raw materials; • selection and evaluation of suppliers; • co-operation with suppliers.
Results of legislative evaluation
% Non-producing affiliates (O) % Produced products (O) Number of changes (PP) Number of process steps (PP) Number of critical control points (PP) Type of product groups (PA)

Continue Table 6.4
Quality management
Effective activity Description Indicator of production quality Contextual factors related with
quality management % Complaints about product quality Control of production Part of quality control that is focused on the
production process. Items: • product and process control including
control of food safety and product quality; • improvement of the process.
% Complaints about availability
% Non-producing affiliates (O) Number of relationships (O) Number of adjustments (PP)
Control of execution of production tasks
Part of quality control that is focused on the execution of production tasks. Items: • information, instruction and supervision; • evaluation of results and communication; • flexibility of procedures and methods.
% Complaints about product quality Number of external relations (O) Number of temporary employees (O) Number of relationships (O) Degree of automation (PP) Number of changes (PP) Number of adjustments (PP)
Control of receiving orders Items: analysis, acceptation and processing of orders.
% Rejected products Number of customers / delivery points (O) Number of process steps (PP) Number of changes (PP) Number of critical control points (PP)
% Complaints about product quality Results of technical evaluation
Planning of distribution Items: development and evaluation of distribution planning. % Complaints about availability
Number of customers / delivery points (O) Number of relationships (O) Number of process steps (PP)

Chapter 6
106
6.4.3 Measurement method
Two measurement methods were used to study the effectiveness of food quality management
i.e. on a generic and a specific level. On the generic level only �results of legislative
evaluation� was examined since most respondents measured this indicator. Typical examples
of legislative evaluation are inspections on food safety (e.g. contamination by bacteria),
product quality (e.g. compliance of ingredients with labelling), hygiene, application and
implementation of food safety systems like HACCP. Thus legislative production quality
involves the minimal requirements for a food product. No relations were found between
quality management and �results of legislative evaluation�, probably because all bakeries
have to comply with legislative standards. The other indicators of production quality showed
no significant relations with quality management and contextual factors due to unavailable
and low orthogonal data.
We performed the analysis on the specific level to examine the relations in detail with a robust
instrument. The set of data and relations were modified into high orthogonal data by using the
statistically established constructs. In contrast to the results on the generic level, this analysis
resulted in unambiguous relations. On the detailed level, relations with the indicators of
production quality were found.
The measurements on both levels consist of positive and negative aspects. On the generic
level, total scores for the elements were obtained which are useful for prediction. The
reliability of the elements was acceptable for developing a new instrument. However,
indicators that measure the same aspect were also included in the elements, whereas opposite
effects neutralised each other. Consequently, the total score of the elements need not be the
actual score. On the specific level, all constructs measured different aspects, which makes the
instrument robust. The reliability of the constructs was acceptable as well. Many constructs
were used which enables examination of the relations in detail. However, the constructs
cannot be used for one measure of an element because the element is not the underlying
variable. Therefore, we selected only indicators for a construct that belong to a specific
element, which enables extrapolation of scores of the constructs to those of the elements.
Therefore, specific relations could be translated into generic relations.
6.4.4 Relations
The results confirmed our hypothesised relations: a higher level of quality management is
interdependent with a higher production quality; and a higher level of quality management

Measuring effectiveness of food quality management in the bakery sector
107
changes the relation between contextual factors and a lower production quality into a relation
with a higher production quality.
Evaluation of our results on causality by observations in literature shows that our relations are
in compliance with results by other researchers. Several authors emphasised relations between
quality management and production quality 5-11. Moreover, others describe the relation of the
business environment to quality management or production quality 11-22.
Although other researchers obtained comparable relations, they did not study how an effective
food quality management could be achieved in order to obtain an optimal production quality
within the context of the organisation. Most studies were performed for other sectors than the
agri-food sector.
6.4.5 Effectiveness of food quality management
This study shows that effective activities of quality management in the bakery sector were: (1)
control of strategy, (2) allocation of supplying raw materials, (3) supply control, (4) control of
production, (5) control of execution of production tasks, (6) control of receiving orders, and
(7) planning of distribution. Interdependency was found between a higher level of these
activities and a higher score on specific indicators of production quality i.e. higher results of
respectively legislative and technical evaluation, lower percentage of rejected products, and
lower percentage of complaints about respectively product quality and availability.
Some of these effective activities have been suggested by others as well. For example,
�supply control� and �results of legislative evaluation�. Luning et al. 5, Ahire et al. 23 and
Achten and Roodhooft 24 mention that the quality of raw materials has a major influence on
production quality of final products, which requires supply control. Besides, selection of
suppliers on criteria (such as quality, price, flexibility, and reliability) and audits of their
quality assurance systems have an influence on performance of suppliers, and therefore on
production quality of final products 5, 8, 23-30.
Others also found that "supply control" and "control of receiving orders" decrease the
variation of raw materials. This results in prevention of loss of materials during the production
process. In addition, customer requirements are analysed on their feasibility. Agreements
made before production (e.g. customer orders) and order analysis facilitate both compliance
with requirements of customers and development of the planning 25, 27, 28, 31, 32.
Several authors emphasise that the primary process is prepared and evaluated by �control of
strategy�, �allocation of supplying raw materials�, �control of production�, and �planning of

Chapter 6
108
distribution�. Preparation and evaluation control failures and result in delivery of products
according to delivery requirements (amount of products, location, time) 5, 25-28, 32, 33, which
may reduce complaints about availability. Anticipation on delivery times and conditions
controls also the physical product quality 5, 25, 32, which may reduce complaints about product
quality. Acquiring and allocation of resources and employees result in production conditions
needed to obtain the desired product quality 5, 25, 28.
In addition, several authors mention that �control of production� and �control of execution of
production tasks� decrease failures during production, which may reduce complaints about
product quality. Training of employees and communication improve performance of execution 5, 23, 26-29, 33. Product and process control, and evaluation of assigned tasks and established
procedures control performance of production tasks and consequently product quality 25.
Remarkably, �planning of production� was identified to be significantly not effective; a lower
score of �percentage of complaints about availability� was related to a lower level of
�planning of production�. The bakeries probably compensate the lower level of quality
management with experience and skills to obtain the desired production quality.
6.4.6 IMAQE-Food
The effectiveness of quality management activities is shown for bakeries with various
contextual factors. The relation of the context to a lower production quality can be converted
into a higher production quality by improving the level of quality management activities.
Changes in the complexity of the bakeries can also improve the production quality. Our
findings show that bakeries should take into account their organisation, production process,
product assortment, and quality management activities. Development and change of the
business environment modify the production quality, which requires an effective selection and
implementation of specific quality management activities to obtain an appropriate production
quality.
Bakeries can use IMAQE-Food to obtain a better implementation and an effective food
quality management. IMAQE-Food measures the level of both quality management activities
and production quality, and anticipates on the context of the company. The instrument can
measure the effectiveness of quality management activities for bakeries with a specific
context. If a bakery has a lower score on a specific quality management activity that is
effective for bakeries with a comparable context, it should improve that activity to obtain a

Measuring effectiveness of food quality management in the bakery sector
109
higher production quality. In this way, bakeries can select and implement quality management
activities suitable to their situation in order to obtain an effective food quality management.
6.4.7 Future research
In future research, measurement of effectiveness should be performed with the method on
specific level due to its robustness and non-neutralising effects. However, the underlying
variables of the constructs should be investigated in order to use fewer measures for
prediction. More data about production quality should be collected and registered for an
appropriate measure of effectiveness. Successive research can develop methods to support
bakeries with data collection and registration. IMAQE-Food can be used for predicting and
benchmarking the level of food quality management or production quality. The relation of the
contextual factors of bakeries (e.g. type of product groups, organisational size, degree of
automation) to food quality management can be investigated by studying differences of
activities within specific groups of the bakeries. Knowledge about this relation of contextual
factors can be used to advise bakeries how to optimally implement and execute their quality
management.
6.5 References
1. Oude Voshaar, J.H. (1994). Statistiek voor onderzoekers: met voorbeelden uit de landbouw- en milieuwetenschappen. Wageningen: Wageningen Pers.
2. Spiegel, van der M. Luning, P.A. Ziggers, G.W. and Jongen, W.M.F. (2003). Development of the instrument IMAQE-Food to measure effectiveness of quality management. Accepted in International Journal of Quality and Reliability Management.
3. Spiegel, van der M. Boer, de W.J. Luning, P.A. Ziggers, G.W. and Jongen, W.M.F. (2004). Validation of IMAQE-Food: Instrument for Management Assessment and Quality Effectiveness in the Food sector. Submitted for publication.
4. Goedhart, P.W and Thissen, J.T.N.M. (2002). Biometris GenStat Procedure Library Manual 6th Edition. Wageningen: Biometris.
5. Luning, P.A. Marcelis, W.J. and Jongen, W.M.F. (2002). Food quality management: a techno-managerial approach. Wageningen: Wageningen Pers.
6. Hendricks, K.B. and Singhal, V.D. (2000). The impact of Total Quality Management (TQM) on financial performance: Evidence from quality award winners. s.l.: s.n.
7. Louwes, A.C.M. (1996). Samen met anderen in de keten de kwaliteit van bakkerijproducten verder verbeteren. Voedingsmiddelentechnologie, 29 (7), 18-19.
8. Mainsah, E. and Stout, K.J. (1995). Het ontwerp en de toepassing van een 'vendor-rating'-model voor kwaliteitsbeheersing. Sigma, 41 (2), 28-31.
9. Noori, H. and Radford, R. (1995). Production and Operations Management, Total Quality and Responsiveness. New York: McGraw-Hill, Inc.
10. Ziggers, G.W. (1993). Agrarisch ondernemerschap in een bedrijfskundig perspectief. s.l.: s.n.

Chapter 6
110
11. Bots, J.M. (1991), De besturing van het primaire agrarische bedrijf: een toepassing van de Wageningse Besturings Benadering in een voorstudie met betrekking tot potplantenbedrijven. Wageningen: s.n.
12. Gulati, R. Nohria, N. and Zaheer, A. (2000). Strategic networks. Strategic Management Journal, 21, 203-215.
13. Mentzer, J.T. Min, S. and Zacharia, Z.G. (2000). The nature of interfirm partnering in supply chain management. Journal of Retailing, 76 (4), 549-568.
14. Jayaram, J. Droge, C. and Vickery, S.K. (1999). The impact of human resource management practices on manufacturing performance. Journal of Operations Management, 18 (1), 1-20.
15. Bij, van der J.D. and Broekhuis, H. (1998). The design of quality systems: A contingency approach. International Journal of Production Economics, 55 (3), 309-319.
16. Messner, K. (1998). Barriers to implementing a quality improvement program. Nursing Management, (1), 1-8.
17. Ziggers, G.W. (1997). Integrated quality assurance in the pork supply chain. In: Schiefer, G. and Helbig, R. (Eds.). Quality management and process improvement for competitive advantage in agriculture and food. Bonn: Universität Bonn-ILB.
18. Groote, de X. Loch, C. Heyden, van der L. Wassenhove, van L. and Yücesan, E. (1996). Measuring management quality in the factory. European Management Journal, 14 (6), 540-554.
19. Waszink, A.C. (1995). Complexiteit, proces- en klantgerichtheid. Sigma, (3), 7-10. 20. Loo, van der H.R. and Giljam, M.J. (1995). De blinde vlekken van Total Quality Management. M&O, 3,
202-217. 21. Benson, P.G. Saraph, J.V. and Schroeder, R.G. (1991). The effects of organizational context on quality
management: an empirical investigation. Management Science, 37 (9), 1107-1124. 22. Mulder, F.A. (1991). Manager en produktkwaliteit. Deventer: Kluwer. 23. Ahire, S.L. Golhar, D.Y. and Waller, M.A. (1996). Development and validation of TQM implementation
constructs. Decision Sciences, 27 (1), 23-56. 24. Achten, G. and Roodhooft, F. (1994). Vendor Rating: De beoordeling van leveranciersprestaties. pp. 179-
203. In: Jorissen, A. (Ed.). Prestatiemeting: naar een betere beheersing van bedrijfsactiviteiten, Management Accounting, MAKLU Uitgevers, Antwerpen-Apeldoorn.
25. Diepstraten, J. (2000). Kwalitatieve analyse van zeven cases in de bakkerijsector op basis van de productiekwaliteit. MSc-thesis. Wageningen: Wageningen University.
26. Evans, J.R. and Lindsay, W.M. (eds.). (1996). The management and control of quality. St. Paul: West publishing Company.
27. Black, S.A. and Porter, L.J. (1996). Identification of the critical factors of TQM. Decision Sciences, 27 (1), 1-21.
28. Flynn, B.B. Schroeder, R.G. and Sakakibara, S. (1994). A framework for quality management research and an correlated measurement instrument. Journal of Operations Management, 11 (4), 339-366.
29. Saraph, J.V. Benson, P.G. and Schroeder, R.G. (1989). An instrument for measuring the critical factors of quality management. Decision Sciences, 20 (4), 810-829.
30. Camperi, J.A. (1994). Vendor approval and audits in total quality management. Food Technology, 48 (9), 160-162.
31. Berg, van den M.G. and Delsing, B.M.A. (1999). Kwaliteit van levensmiddelen. Deventer: Kluwer. 32. Zuurbier, P.J.P. Bots, J.M. Edwards, A.R. Heck, van E. Hendricks, M.B.A. Meer, van der C.J. Stemne, S.I.
and Zwanenberg, A.C.M. (1991). Besturen van organisaties. Een inleiding tot in de bedrijfskunde. Culemborg: Educaboek.
33. NIST. National Institute of Standards and Technology. (2002). Baldrige National Quality Award Program 2002: Criteria for Performance Excellence. http://www.quality.nist.gov.

7
How to improve food quality management
in the bakery sector
Abstract
This chapter investigates the interdependency between contextual factors of bakeries and their
level of food quality management. Contextual factors that are studied are (1) QA systems, (2)
organisational size, (3) degree of automation, and (4) type of product groups. Implications for
bakeries are provided. The level of food quality management within these groups was
analysed by ANOVA. The context of bakeries revealed differences in the level of five quality
management activities i.e. �control of strategy�, �allocation of supplying raw materials�,
�supply control�, �planning of production�, and �control of execution of production tasks�.
Bakeries that applied BRC, bakeries with more than 150 employees, industrial bakeries, and
confectionery and biscuits bakeries performed a higher level of some of these activities. Food
manufacturers can select suitable quality management activities and QA systems for their
specific situation by using IMAQE-Food in order to obtain an effective quality management.
This chapter has been submitted for publication as:
Spiegel, van der M. Luning, P.A. Boer, de W.J. Ziggers, G.W. and Jongen, W.M.F. How to improve food quality
management in the bakery sector. NJAS - Wageningen Journal of Life Sciences.

Chapter 7
112
7.1 Introduction
QA systems that are applied in the bakery sector are HACCP, Hygiene code for bread and
confectionery, ISO 9000-series and BRC. Most QA systems are too generic in nature to be
applicable for each company 1. Consequently, bakeries have several options to apply the QA
systems. Each bakery has to interpret the systems in a different way by translating the generic
aspects into their specific situation. Therefore, methods should be applicable to make QA
systems suitable for specific situations in order to prevent failures due to inappropriate
management of food production operations and inappropriate methods of design,
implementation, and improvement.
Bakeries have to decide which activities of food quality management and which QA system(s)
are most suitable to their specific needs, and how this system should be implemented. To
apply QA systems for specific situations, insight is needed in the interdependency between
contextual factors of bakeries and their level of quality management activities.
The aim of this study is to investigate how contextual factors of bakeries relate to the level of
food quality management. Implications for bakeries are provided. Contextual factors that are
studied are (1) QA systems, (2) organisational size, (3) degree of automation, and (4) type of
product groups.
7.2 Assessment method
The interdependency between contextual factors and level of food quality management in the
bakery sector was investigated by using IMAQE-Food. The contextual factors were classified
and the relations were analysed.
7.2.1 Classification of contextual factors
In order to study the relations between contextual factors and the level of food quality
management in the bakery sector, a secondary analysis of data among the 48 respondents was
applied. The respondents were classified according to (1) type of applied QA systems, (2)
organisational size, (3) degree of automation (based on type of oven used), and (4) type of
product groups (Table 7.1). Each class consisted of specific subgroups.

Table 7.1 Differences in quality management activities within subgroups of bakeries classified according to type of QA system, organisational size, degree
of automation, and type of bakery. Significant differences of these quality management activities (p<0.05, Student t-test) are marked with a, b, or
c. N = number of cases.
Quality management activities Contextual factors N Control of strategy
Allocation of supplying raw materials
Supply control
Planning of production
Control of production
Control of execution of production tasks
Control of receiving orders
Planning of distribution
No QA system 3 5.8 2.6 10.0 b 3.1 a 4.8 2.5 a 5.5 6.4 Hygiene code 8 4.4 2.3 9.1 b 3.9 a 7.9 4.0 b 6.1 6.1 HACCP 17 4.6 3.0 9.4 b 5.3 a 6.5 4.4 b 6.3 6.7 ISO 5 5.5 3.0 5.1 a 7.6 b 7.6 5.9 b 6.3 7.2
QA systems
BRC 15 5.7 4.6 8.3 b 7.4 b 7.4 6.6 c 5.4 6.6 10-49 13 4.4 a 1.9 a 9.1 3.7 a 6.3 3.7 a 5.7 5.7 50-99 14 4.8 a 3.7 b 9.2 5.7 b 6.7 4.7 a 6.3 6.4 100-149 11 4.5 a 3.2 b 7.6 7.1 b 7.8 5.7 a 4.9 7.6
Organisational size (in number of employees) >150 10 7.1 b 5.0 b 8.1 7.4 b 7.4 6.6 b 6.8 7.1
Non-industrial 22 4.3 a 2.3 a 9.2 4.2 a 6.8 3.9 a 5.6 6.7 Degree of automation 1 Industrial 26 5.7 b 4.3 b 8.1 7.2 b 7.2 6.0 b 6.2 6.6
Bread 10 5.1 3.9 6.6 a 7.0 8.0 7.2 b 5.7 6.2 Confectionery 11 5.7 4.0 9.3 b 5.5 6.9 5.3 b 6.5 5.2 Mixed 22 4.7 2.5 8.8 b 5.1 6.9 3.7 a 5.4 7.9
Type of bakery
Biscuits 5 5.4 4.9 10.0 b 7.5 5.8 6.4 b 7.4 5.0 1 based on type of oven used

Chapter 7
114
Subgroups of the type of QA systems were made based on the common situation in practice in
the bakery sector. Bakeries were classified according to their most comprehensive QA system.
For example, bakeries with the Hygiene code and HACCP were classified in the subgroup
HACCP, and bakeries with BRC and other systems were classified in the subgroup BRC.
Classification on organisational size has not explicitly been used in literature or in practice.
Therefore, subgroups were established by classification of the respondents in four groups of
similar size. Subgroups of degree of automation and type of bakery were based on
classifications used in practice 2, 3.
7.2.2 Analysis of relations
For each subgroup, the relations to the level of quality management activities were analysed
by using ANOVA. The level of food quality management was measured by indicators that
were identified and validated 4, 5 (Chapter 4, 5). The following indicators for quality
management were assessed: (1) control of strategy, (2) allocation of supplying raw materials,
(3) supply control, (4) planning of production, (5) control of production, (6) control of
execution of production tasks, (7) control of receiving orders, and (8) planning of distribution.
Differences in the level of quality management activities between subgroups were analysed
using Student�s t-test and were considered significant at p≤0.05. On the basis of these
relations, the interdependency between contextual factors and level of food quality
management was analysed. This interdependency was investigated in detail by a qualitative
analysis of the typical quality management activities within the subgroups to obtain more
insight why contextual factors and quality management activities are related.
7.3 Results
Table 7.1 shows the significant differences in the level of quality management activities
within the subgroups of bakeries classified according to type of QA systems, organisational
size, degree of automation, and type of bakery. To obtain insight in relations between
contextual factors and quality management activities, these differences were qualitatively
analysed. Results of this analysis are shown in detail in Table 7.2 to 7.5.

How to improve food quality management in the bakery sector
115
7.3.1 Type of Quality Assurance systems
The first classification was on type of QA systems. Table 7.1 shows that subgroups of the
classified types of QA systems were bakeries that applied the Hygiene code, HACCP, HACCP
combined with ISO 9001:1994 or ISO 9002:1994, BRC, or no QA system. Most bakeries
without HACCP applied the Hygiene code. The bakeries with ISO and HACCP applied first
ISO due to requirements by customers and next HACCP due to legislative requirements.
Bakeries with BRC applied first HACCP and some performed also ISO.
Table 7.1 shows that most bakeries performed HACCP (N=17) or BRC (N=15). Only three
bakeries applied no QA system and only five bakeries applied ISO. In spite of these variations
in sample size, we revealed significant differences. The subgroups of bakeries differed
significantly in the level of �supply control�, �planning of production� and �control of
execution of production tasks�. Bakeries with BRC performed all activities on a higher level.
Bakeries that applied ISO performed �supply control� on a lower level than the other
bakeries, and �planning of production� on the same higher level as BRC. Moreover, bakeries
with a Hygiene code, HACCP and/or ISO performed �control of execution of production
tasks� on a higher level than bakeries without a QA system and on a lower level than bakeries
with BRC.
Table 7.2 shows in detail the interdependency between type of QA systems and level of the
quality management activities. The activities of bakeries with BRC and the differences with
other QA systems are described below.
Most bakeries with BRC selected suppliers on criteria. They selected only other suppliers if
failures were noticed or if no improvements were perceived after making agreements. These
bakeries evaluated raw materials mainly by a random check. Bakeries with BRC used always
the same design of production plan and established their product order. They included failures
and unexpected orders in the planning or they used margins for quiet days. Most bakeries with
BRC scheduled the tasks of employees per week or per day. They used information,
demonstration and supervision for instruction. When shifts changed, they communicated by
consultation. Product quality was evaluated by registration and control. Most bakeries gave
feedback of results by consultation, and they improved their procedures after evaluation.

Table 7.2 Differences in quality management activities within subgroups of bakeries classified according to type of QA system. % = Percentage of bakeries within a subgroup that performs that level of the quality management activity, explained per aspect of the quality management
activity.
Quality management activities
Hygiene code HACCP ISO BRC
Supply control
- No selection (50%) or selection of suppliers on criteria (25%): product quality, price, delivery time.
- Other suppliers are selected if failures are noticed (38%) or if no improvements after making agreements (50%).
- Selection by one person who is always involved (88%).
- Raw materials are evaluated by a random check (75%)
- No selection (35%) or selection of suppliers on criteria (65%): product quality, price, delivery time, application of QA system.
- Other suppliers are selected if no improvements after making agreements (65%).
- Selection by one (29%) or more persons (47%) who are always involved.
- Raw materials are evaluated by a random check (71%).
- Selection of suppliers selected by purchase organisation (80%): product quality, price, delivery time, flexibility, application and implementation of QA system.
- Suppliers are always selected and evaluated (40%). Other suppliers are selected if no improvements after making agreements (60%).
- Selection by more persons who are always (60%) or sometimes (40%) involved.
- Raw materials are evaluated by receiving inspection, analyses and audits (60%).
- Selection of suppliers on criteria (73%): product quality, price, reliability, information about specifications, application and implementation of QA system.
- Other suppliers are selected if failures are noticed (27%) or if no improvements after making agreements (53%).
- Selection by more persons who are always involved (87%).
- Raw materials are evaluated by a random check (53%) or by receiving inspection, analyses and audits (40%).
Planning of production
- Design of production plan is always the same (75%) or based on experience (25%).
- Product order is based on experience (38%) or established (55%) by: possibilities of contamination, types of dough, temperature of the oven, baking time, cooling, delivery time of products, capacity.
- Design of production plan is always the same (65%) or based on experience (24%).
- Product order is based on experience (47%) or established (41%) by: possibilities of contamination, number of times of cleaning, temperature of the oven, baking time, types of dough, packaging, amount of products.
- Design of production plan is always the same (100%).
- Product order is established (100%) by: temperature of the oven, types of dough, cutting, number of changing of equipment, possibilities of contamination, baking and rise time, packaging, specific product requirements, number of times of cleaning, delivery time of products.
- Design of production plan is always the same (87%).
- Product order is established (80%) by: possibilities of contamination, number of times of cleaning, number of changing of equipment, capacity, temperature of the oven, baking time, types of dough, specific product requirements, packaging.

Continue Table 7.2 Quality management activities
Hygiene code HACCP ISO BRC
Planning of production - Failures and unexpected orders are not included (50%) or are included in margins for only quiet days (50%).
- Failures and unexpected orders are not included (59%) or are included in margins for only quiet days (29%).
- Failures and unexpected orders are included in margins for only quiet days (60%) or in the planning (20%).
- Failures and unexpected orders are included in the planning (40%), or in margins for only quiet days (33%), or are not included (27%).
Control of execution of production tasks
- Tasks of employees were scheduled per week (38%), per day (25%), or the tasks per day were the same (38%).
- Instruction by demonstration and supervision (75%) and information (25%) or only demonstration (25%). No shifts (63%). Communication for changing shifts by consultation (38%).
- Product quality evaluated by supervision (88%).
- Feedback of results by communication and evaluation (63%) or written (25%).
- Procedures are improved (50%) after evaluation (25%) or are not improved (50%).
- Tasks of employees were scheduled per week (18%), per day (41%), or the tasks per day were the same (41%).
- Instruction by demonstration and supervision (83%) and information (24%) or only demonstration (18%). No shifts (29%). Communication for changing shifts by consultation (65%).
- Product quality evaluated by supervision (59%) or registration and control (29%).
- Feedback of results by communication and evaluation (47%) or ad hoc (41%).
- Procedures are improved (59%) after evaluation (41%).
- Tasks of employees were scheduled per week (60%) or per day (40%).
- Instruction by demonstration and supervision (100%) and information (20%).
- Communication for changing shifts by consultation (60%).
- Product quality evaluated by registration and control (80%).
- Feedback of results by communication and evaluation (20%), written (60%) or ad hoc (20%).
- Procedures are improved after evaluation (80%).
- Tasks of employees were scheduled per week (53%), per day (20%), or the tasks per day were the same (27%).
- Instruction by demonstration and supervision (80%) and information (53%).
- Communication for changing shifts by consultation (93%).
- Product quality evaluated by registration and control (87%).
- Feedback of results by communication and evaluation (60%) or written (27%).
- Procedures are improved after evaluation (80%).

Chapter 7
118
Bakeries applying ISO performed selection and evaluation of suppliers (as a part of �supply
control�) on a lower level than other bakeries. Bakeries with ISO selected suppliers from a list
of the purchase organisation. Some bakeries (40%) selected and evaluated their suppliers
every time by several varying persons. However, they evaluated raw materials on a higher
level by receiving inspection, analyses and audits than the other bakeries. For �control of
execution of production tasks�, bakeries with ISO differed from BRC because they used
mainly demonstration and supervision for instruction. Moreover, they used a written paper on
a publication board to give feedback of results.
Bakeries with HACCP or Hygiene code performed a lower level of �planning of production�
in contrast to bakeries with BRC or ISO (Table 7.1). They based their production plan and
product order also on experience (Table 7.2). They did not include time for unexpected
situations in the planning. For �control of execution of production tasks�, 41% of the bakeries
with HACCP and 38% of the bakeries with Hygiene code performed the same tasks per day in
contrast to the bakeries with BRC and ISO. They applied mainly demonstration and
supervision for instruction, and not all bakeries used shifts. They evaluated product quality by
supervision and did not improve their procedures after evaluation.
In conclusion, HACCP and Hygiene code scored lower on �planning of production� due to
less flexibility and based on experience. ISO scored lower on �supply control� due to a less
extensive and ambiguous selection and evaluation of suppliers. Considering these findings
and the higher level of quality management by BRC, a combination of HACCP and ISO
appears to result in a higher level of quality management.
7.3.2 Organisational size
The second classification was on organisational size. Table 7.1 shows that four subgroups
were made on the basis of the number of employees i.e. 10-49; 50-99; 100-149; and more
than 150 employees. The subgroups of bakeries differed significantly in level of �control of
strategy�, �allocation of supplying raw materials�, �planning of production�, and �control of
execution of production tasks�. Bakeries involving 10-49 employees performed a lower level
of these four quality management activities than bakeries with more than 150 employees
(Table 7.1). Bakeries with 50-149 employees also performed a higher level of �supply
control� and �planning of production�, although they performed a lower level of �control of
strategy� and �control of execution of production tasks�.

How to improve food quality management in the bakery sector
119
Table 7.3 shows in detail the interdependency between organisational size and level of quality
management activities.
Most bakeries with more than 150 employees used a relatively long-term strategy in contrast
to smaller bakeries that used mainly a simple plan. Besides long-term aspects, the long-term
plan was evaluated on several aspects like certification and market situation in contrast to the
smaller bakeries that evaluated on amount of produced products. Only large bakeries used the
evaluation for improvement of the long-term plan and integrated data in an information
system. Furthermore, larger bakeries improved their procedures after evaluation, whereas
smaller bakeries used not always evaluation for improvement.
Bakeries with more than 50 employees purchased raw materials and selected suppliers not
only by themselves but also via their trading company. They used the same design of
production plan whereas smaller bakeries based their production plan also on experience.
Bakeries with more than 50 employees adjusted the production plan on basis of realisation
and used it for improvement of the long-term plan in contrast to the smaller bakeries. Bakeries
with more than 100 employees established the product order, whereas smaller bakeries based
the product order also on experience. Most bakeries evaluated product quality by product and
process control in contrast to smaller bakeries that evaluated mainly by supervision.
In conclusion, larger bakeries (>150 employees) performed a higher level of quality
management activities due to a long-term perspective and improvement. Smaller bakeries
(<100 employees) performed a lower level due to less evaluation and improvement and based
their activities on experience.
7.3.3 Degree of automation
The third classification is based on degree of automation. Table 7.1 shows that subgroups
were non-industrial and industrial bakeries. The classification was based on the type of ovens
used. Industrial bakeries used mechanical moving ovens. Non-industrial bakeries used ovens
that require removal of products manually. Each subgroup consisted of a similar sample size
(Table 7.1). The subgroups of bakeries differed significantly in level of �control of strategy�,
�allocation of supplying raw materials�, �planning of production�, and �control of execution
of production tasks�. The industrial bakeries performed a higher level of these four quality
management activities than the non-industrial bakeries.

Table 7.3 Differences in quality management activities within subgroups of bakeries classified according to organisational size. % = Percentage of bakeries within a subgroup that performs that level of the quality management activity, explained per aspect of the quality management
activity.
Quality management activities
10-49 employees 50-99 employees 100-149 employees >150 employees
Control of strategy
- A simple long-term plan (<1 week) based on production process (62%), comparable with production plan.
- Evaluation on the amount of produced products (54%).
- A relatively long-term strategy (1-5 years) (50%) or a simple long-term plan (<1 week) based on production process (36%).
- Evaluation on long term aspects like capacity, sales, etc. (57%).
- A simple long-term plan (<1 week) based on production process (73%), comparable with production plan.
- Evaluation on long term aspects like capacity, sales, etc. (55%).
- A relatively long-term strategy (1 month to 5 years) (80%).
- Evaluation on aspects like quality policy, certification, investments, prognoses, market situation, product development, volumes, employees, and supply of raw materials (80%).
- Improvement of long-term plan. Allocation of supplying raw materials
- Purchase of raw materials and selection of suppliers by bakery itself (100%).
- Purchase of raw materials by bakery itself (86%), selection of suppliers by bakery itself (93%).
- Purchase of raw materials and selection of suppliers by bakery itself (64%) or via trading company (18%).
- Purchase of raw materials by bakery itself (70%) or via trading company (20%).

Continue Table 7.3
Quality management activities
10-49 employees 50-99 employees 100-149 employees >150 employees
Planning of production - Design of production plan is always the same (50%) or based on experience (29%).
- Product order is based on experience (50%) or established (43%) by: possibilities of contamination, temperature of the oven, baking time.
- Production plan is adjusted on the basis of realisation (43%) or not adjusted (43%).
- Production plan has always the same design (64%) or is always new designed (36%).
- Product order is based on experience (50%) or established (50%) by: possibilities of contamination, temperature of the oven, packaging, capacity, delivery time.
- Production plan is adjusted on the basis of realisation (91%), and used for adjustment of the long-term plan (57%).
- Design of production plan is always the same (100%).
- Product order is established (91%) by: temperature of the oven, baking time, types of dough, cutting, packaging, delivery time, number of changing equipment
- Production plan is adjusted on the basis of realisation (81%), and used for adjustment of the long-term plan (45%).
- Design of production plan is always the same (100%).
- Product order is established (80%) by: possibilities of contamination, temperature of the oven, baking time, types of dough, specific product requirements, cutting, packaging, capacity, number of times of cleaning, number of changing equipment.
- Integration of data in an information system.
- Production plan is adjusted on the basis of realisation and used for adjustment of the long-term plan (70%).
Control of execution of production tasks
- Product quality evaluated by supervision (100%).
- Procedures are improved if necessary (54%) after evaluation (31%).
- Product quality evaluated by supervision (57%) and product and process control (36%).
- Procedures are improved if necessary after evaluation (50%).
- Product quality evaluated by product and process control (64%).
- Procedures are improved if necessary (91%) after evaluation (55%).
- Product quality evaluated by product and process control (80%).
- Procedures are improved if necessary after evaluation (80%).

Chapter 7
122
Table 7.4 shows in detail the interdependency between degree of automation and level of
quality management activities.
Industrial bakeries used mainly a long-term strategy, which was evaluated on long-term
aspects or aspects like quality policy, certification, market situation. They purchased raw
materials not only by themselves but also via their trading company. For �planning of
production�, industrial bakeries established their product order. They used the evaluation of
the production plan for improvement of the long-term plan. They communicated by
consultation when shifts change. Industrial bakeries evaluated product quality by product and
process control. They improved their procedures after evaluation.
Non-industrial bakeries performed the quality management activities on a lower level. They
used a simple plan comparable with the production plan, which was evaluated on the amount
of produced products. They purchased raw materials by themselves. For �planning of
production�, they established their product order or it was based on experience. Evaluation of
the production plan was not used to improve the production plan in stead of the long-term
plan. Most non-industrial bakeries produced without shifts. They evaluated product quality by
supervision, and did not improve their procedures after evaluation.
In conclusion, industrial bakeries performed a higher level of quality management activities
due to their long-term perspective and improvement. Non-industrial bakeries performed a
lower level due to less evaluation and improvement and based their activities on experience.
7.3.4 Type of product groups
The last classification was based on type of product groups. Table 7.1 shows that the bakeries
were classified in the subgroups: bakeries that produce bread, confectionery, a mix of bread
and confectionery (i.e. mixed bakeries), and biscuits.
Table 7.1 shows that most bakeries produced a mix of bread and confectionery (N=22). Only
five bakeries produced biscuits, but they revealed significant differences. The subgroups of
bakeries differed significantly in level of �supply control� and �control of execution of
production tasks�. Especially confectionery and biscuit bakeries performed these activities on
a higher level. Bread bakeries performed �supply control� on a lower level, while mixed
bakeries performed �control of execution of production tasks� on a lower level.

Table 7.4 Differences in quality management activities within subgroups of bakeries classified according to degree of automation. % = Percentage of bakeries within a subgroup that performs that level of the quality management activity, explained per aspects of the quality management
activity.
Quality management activities Industrial Non-industrial Control of strategy - A relatively long-term strategy (1 month to 5 years) (65%).
- Evaluation on long-term aspects (42%) or aspects like quality policy, certification, investments, prognoses, market situation, product development, volumes, employees, and supply of raw materials (35%). Improvement of long-term plan.
- A simple long-term plan (<1 week) based on production process (64%), comparable with production plan.
- Evaluation on the amount of produced products (60%).
Allocation of supplying raw materials - Purchase of raw materials by bakery itself (69%) or via trading company (16%).
- Purchase of raw materials by bakery itself (95%).
Planning of production - Product order is established (81%) by: possibilities of contamination, temperature of the oven, types of dough, specific product requirements, packaging, number of times of cleaning, number of changing equipment.
- Production plan is adjusted on the basis of realisation (92%) and used for adjustment of the long-term plan (65%).
- Product order is based on experience (55%) or established (41%) by: possibilities of contamination, temperature of the oven, baking time, delivery time.
- Production plan is adjusted on the basis of realisation (68%) and used for adjustment of the long-term plan (23%) or not adjusted (32%).
Control of execution of production tasks - Communication for changing shifts by consultation (90%). - Product quality evaluated by product and process control
(65%) or supervision (27%). - Procedures are improved after evaluation (65%).
- Communication for changing shifts by consultation (36%) or no shifts (55%).
- Product quality evaluated by supervision (86%). - Procedures are improved after evaluation (32%) or are not
improved (50%).

Chapter 7
124
Table 7.5 shows in detail the interdependency between type of product group and level of
quality management activities.
Confectionery and biscuits bakeries performed both �supply control� and �control of
execution of production tasks� on a higher level. They ordered raw materials mainly at the
same time and used also contracts for delivering raw materials frequently. They selected
suppliers mainly on criteria. One or more unchanging persons performed supervision of
production tasks. Confectionery bakeries evaluated product quality by supervision, and
biscuits and bread bakeries by product and process control. Most confectionery, bread and
biscuits bakeries improved procedures after evaluation.
Bread bakeries performed �supply control� on a lower level than other bakeries (Table 7.1).
Table 7.4 shows that they ordered raw materials mainly at the same time but used no
contracts. They selected suppliers not mainly on criteria but also within the selection made by
a purchase organisation. However, bread bakeries evaluated their raw materials by receiving
inspection, analyses and audits in contrast to other bakeries that mainly used a random check.
Mixed bakeries performed �control of execution of production tasks� on a lower level than
other bakeries. Several varying persons performed supervision. They instructed their
employees by supervision and/or demonstration but used no information. Mixed bakeries
evaluated product quality by supervision. They did not improve procedures or did not
evaluate procedures before improvement.
In conclusion, confectionery and biscuits bakeries performed a higher quality management
due to an unambiguous supervision and a more extensive selection, evaluation and
improvement. Bread bakeries performed a lower level of �supply control� due to a less
extensive selection of suppliers and ordering of raw materials. Mixed bakeries performed a
lower level of �control of execution of production tasks� due to an ambiguous supervision and
a less extensive evaluation and improvement.

Table 7.5 Differences in quality management activities within subgroups of bakeries classified according to type of bakery. % = Percentage of bakeries within a subgroup that performs that level of the quality management activity, explained per aspect of the quality management
activity.
Quality management activities
Bread Confectionery Mixed Biscuits
Supply control - Raw materials are always ordered at the same time (50%).
- Selection of suppliers is done within selection by purchase organisations (40%) or selection on criteria (40%): product quality, price, delivery time, relation to suppliers, reliability, quality of the products, information about specifications, product quality, and production method, flexibility, application and implementation of QA system.
- Raw materials are evaluated by a receiving inspection, analyses and audits (70%).
- Raw materials are always ordered at the same time (45%) or contracts are made (27%).
- No selection (36%) or selection of suppliers on criteria (64%): product quality, price, delivery time, reliability, variation in assortment, flexibility.
- Selection is based on evaluation of former deliveries, experience by other bakeries, results of tests, information by suppliers and purchase organisation.
- Raw materials are evaluated by a random check (55%) or by receiving inspection, analyses and audits (27%).
- Raw materials are always ordered at the same time (55%) or contracts are made (27%).
- No selection (36%) or selection of suppliers on criteria (50%): product quality, price, delivery time, application of QA system.
- Selection is based on evaluation of former deliveries, experience by other bakeries, results of tests, information by suppliers and purchase organisation.
- Raw materials are evaluated by a random check (73%).
- Raw materials are always ordered at the same time (20%) or contracts are made (40%).
- Selection of suppliers on criteria (100%): product quality, price, delivery time, reliability, information about specifications, product quality, and production method, flexibility, application and implementation of QA system.
- Raw materials are evaluated by a random check (80%).

Continue Table 7.5 Quality management activities
Bread Confectionery Mixed Biscuits
Control of execution of production tasks
- Supervision by 1 same person (30%), by more the same persons (30%) or by various persons (40%).
- Instruction by demonstration and supervision (100%) and information (50%).
- Product quality evaluated by product and process control (80%).
- Feedback of results by consultation (80%).
- Procedures are improved after evaluation (70%).
- Supervision by 1 same person (45%) or by more the same persons (45%).
- Instruction by demonstration and supervision (91%) and information (27%).
- Product quality evaluated by supervision (64%).
- Feedback of results by consultation (73%).
- Procedures are improved after evaluation (55%) or are not improved (36%).
- Supervision by 1 same person (36%) or by various persons (55%).
- Instruction by demonstration and supervision (45%) or only demonstration (36%).
- Product quality evaluated by supervision (68%).
- Feedback of results by consultation (41%), or written (23%) or ad hoc (36%).
- Procedures are improved (59%) after evaluation (32%) or are not improved (41%).
- Supervision by 1 same person (60%) or by more the same persons (40%).
- Instruction by demonstration and supervision (100%) and information (40%).
- Product quality evaluated by product and process control (80%).
- Feedback of results by written (60%).
- Procedures are improved after evaluation (80%).

How to improve food quality management in the bakery sector
127
7.4 Implications for the bakery sector
7.4.1 Contextual factors and quality management
This study revealed that specific groups of bakeries performed some quality management
activities on a lower level than other bakeries. The required level of quality management and
contextual factors were interdependent. In literature, only a few relations between quality
management and contextual factors were investigated. Ziggers 6 revealed that the number of
non-temporary and part-time employees was related to the execution of cultivation of pot-
plants. However, Benson et al. 7 showed no relationships between company size and quality
management. They also suggested that process and product contextual factors have little
effect on quality management in manufacturing companies, although product complexity
affected service companies. However, other authors did observe positive relationships i.e.
between product complexity and vertical integration 8, between number of products and
execution of cultivation 6, and between type of industry and delegation, participation, and
measurement in distribution 9.
7.4.2 Improvement of production quality
A previous study showed that the level of quality management and production quality are
interdependent 10. We assume that this relation will also be found for the differences within
the groups, although we could not investigate the differences in production quality per
classification due to unavailability of data. The interdependency between level of quality
management and production quality shows that bakeries should improve their quality
management activities to increase the level of production quality. However, this study
revealed that a lower level of food quality management does not necessarily lead to a lower
production quality, because several companies with a low food quality management executed
activities based on experience.
7.4.3 Application of IMAQE-Food
In practice, established QA systems have a generic approach. They focus on processes,
products, linkages of the supply chain, or company size. QA systems are often combined,
because each QA system covers different aspects of the complete quality system 1, 11-14.
However, the implementation of QA systems is still not optimal 15-20.

Chapter 7
128
Due to the interdependency between contextual factors and quality management, it is of major
importance that contextual factors are integrated into implementation methods of quality
management. Van der Bij and Broekhuis 21 also propose this contingency approach for
contextual factors and quality systems.
However, development of new QA systems can not be suitable for specific situations of each
organisation. QA systems should be generic and transparent in order to inspect and certify a
QA system in various organisations and sectors. Thus, the implementation method should be
optimal for a group of companies by selecting generic methods and each company should
adjust generic QA systems to their specific situation. This results in a better application
whereas an unambiguous inspection and certification method is also possible.
Jonker 22 proposes to investigate the implementation of integrated QA systems in small and
medium companies due to their non-specialised functions in an informal organisation,
whereas individual QA systems could be more useful for large companies due to specialised
functions. However, to our opinion the classification of companies should be studied in a
broader perspective; relevant contextual factors should be considered.
IMAQE-Food can be used to identify the contextual factors that should be integrated into
implementation methods. Moreover, the instrument can identify which quality management
activities are important for a specific situation to obtain an optimal production quality.
IMAQE-Food can also be used to analyse which quality management activities are improved
by a specific QA system. Finally, IMAQE-Food can also be detailed to measure effectiveness
of established QA systems.
7.4.4 Future research
Future research should analyse the interdependency between level of food quality
management and production quality to measure the effectiveness of quality management
activities for the subgroups. This will show which quality management activities should be
improved and/or added by the subgroups of bakeries. Moreover, insight will be obtained
which effective quality management activities will be improved by applying a specific QA
system.
Experience can replace the need for a high level of quality management to obtain an
appropriate quality production. In IMAQE-Food, experience is a part of food quality
management. The relation between experience and production quality can be quantitatively

How to improve food quality management in the bakery sector
129
studied by the addition of experience as an indicator of contextual factors in IMAQE-Food.
Scenarios can be used to measure the intangible experience.
Due to the interdependency between contextual factors and quality management, it is of major
importance that contextual factors are integrated into implementation methods of quality
management. In successive research implementation methods can be developed that uses a
contingency approach. This will improve the applicability and can result in an effective
quality management and an optimal production quality.
7.5 References
1. Spiegel, van der M. Luning, P.A. Ziggers, G.W. and Jongen, W.M.F. (2003). Towards a conceptual model to measure effectiveness of food quality systems. Trends in Food Science and Nutrition, 14 (10), 424-431.
2. NBC. (2000). Inspelen op verluxing: Structuurrapport 2000. Wageningen: Nederlands Bakkerij Centrum. 3. Diepstraten, J. (2000). Kwalitatieve analyse van zeven cases in de bakkerijsector op basis van de
productiekwaliteit. MSc-thesis. Wageningen: Wageningen University. 4. Spiegel, van der M. Luning, P.A. Ziggers, G.W. and Jongen, W.M.F. (2003). Development of the instrument
IMAQE-Food to measure effectiveness of quality management. Accepted in International Journal of Quality and Reliability Management.
5. Spiegel, van der M. Boer, de W.J. Luning, P.A. Ziggers, G.W. and Jongen, W.M.F. (2004). Validation of IMAQE-Food: instrument for management assessment and quality effectiveness in the food sector. Submitted for publication.
6. Ziggers, G.W. (1993). Agrarisch ondernemerschap in een bedrijfskundig perspectief. s.l.: s.n. 7. Benson, P.G. Saraph, J.V. and Schroeder, R.G. (1991). The effects of organizational context on quality
management: an empirical investigation. Management Science, 37 (9), 1107-1124. 8. Novak, S. and Eppinger, S. D. (2001). Sourcing by design: Product complexity and the supply chain.
Management Science, 47 (1), 189-204. 9. Groote, de X. Loch, C. Heyden, van der L. Wassenhove, van L. and Yücesan, E. (1996). Measuring
management quality in the factory. European Management Journal, 14 (6), 540-554. 10. Spiegel, van der M. Luning, P.A. Boer, de W.J. Ziggers, G.W. and Jongen, W.M.F. (2004). Measuring
effectiveness of food quality management in the bakery sector. Submitted for publication. 11. Hoogland, J.P. Jellema, A. and Jongen, W.M.F. (1998). Quality Assurance Systems. pp. 139-158. In: Jongen,
W.M.F. and Meulenberg, M.T.G. (Eds.). Innovation of food production systems: Product quality and consumer acceptance. Wageningen: Wageningen Pers.
12. Spiegel, van der M. Luning, P.A. Ziggers, G.W. and Jongen, W.M.F. (2003). Evaluation of performance measurement instruments on their use for food quality systems. Accepted in Critical Reviews in Food Science and Nutrition.
13. Luning, P.A. Marcelis, W.J. and Jongen, W.M.F. (2002). Food quality management: a techno-managerial approach. Wageningen: Wageningen Pers.
14. Dalen, G.A. (1996). Assuring eating quality of meat. Meat Science, 43 (S), 21-33. 15. Leblanc, J.M.J. (2000). Rapportage eerste effectmeting implementatie hygiënecode voor de brood- en
banketbakkerij. �s-Hertogenbosch: Keuringsdienst van Waren Zuid. 16. Motarjemi, Y. and Käferstein, F. (1999). Food safety, hazard analysis and critical control point and the
increase in foodborne diseases: a paradox? Food Control, 10 (4/5), 325-333. 17. Mitchell, R.T. (1998). Why HACCP fails. Food Control, 9 (2-3), 101. 18. Krause, M.S. (1996). ISO 9001 benefits and pitfalls: the path to successful certification. Clinical Chemistry,
42 (9), 1561-1565. 19. Pallett, A.J.M. (1994). ISO 9000 � The company�s viewpoint. Food Technology, 48 (1), 60-62.

Chapter 7
130
20. Green, A. (1993). Applying quality assurance principles to food control. Food Control, 4 (1), 2-6. 21. Bij, van der J.D. and Broekhuis, H. (1998). The design of quality systems: A contingency approach.
International Journal of Production Economics, 55 (3), 309-319. 22. Jonker, J. (Ed.). (1997). Trends in zorgsystemen: visie op de ontwikkeling van kwaliteits-, milieu- en
arbobeleid. Deventer: Kluwer Bedrijfsinformatie.

8
General discussion

Chapter 8
132
8.1 Research motives
Food quality management is of major importance in the agri-food sector. It is complicated
because it involves both complex characteristics of food and effects of human behaviour.
Therefore, food production systems need both technological and managerial measures
(Chapter 1). Food manufacturers use various QA systems to assure food quality. However,
these systems focus on different aspects of a complete quality system (Chapter 1, 2, 3, 4). The
different situations of food companies and the specific characteristics of food production
require a selection of appropriate QA systems and an effective implementation. Therefore, the
food sector needs an instrument that measures effectiveness. A broad range of instruments has
been developed to measure performance of quality management (Chapter 2). However, they
do not measure effectiveness of food quality management, whereas many quality costs are
spend to obtain an appropriate quality level. The aim of this thesis is to develop and validate
an instrument that measures effectiveness of food quality management.
8.2 Methodology
Our instrument IMAQE-Food has been developed and validated by a structured procedure. A
conceptual model was developed (Chapter 3) and was translated into quantifiable
performance measurement indicators for the bakery sector by literature research, qualitative
research, delphi sessions, and quantitative research (Chapter 4). These indicators of IMAQE-
Food were tested on reliability, validity and generalisability (Chapter 5).
IMAQE-Food is a reliable and valid instrument that measures the relations between quality
management, production quality, and contextual factors. The instrument is generic for the
bakery sector and is expected to be applicable in other food sectors (Chapter 5). IMAQE-
Food has been used to investigate effectiveness of food quality management in the bakery
sector (Chapter 6) and interdependency between context of bakeries and level of food quality
management (Chapter 7).
IMAQE-Food uses the techno-managerial approach. Every construct of food quality
management consists of items that measure both the extent to which technological and
managerial aspects are executed or used. The integration of technology and management is of
major importance in food quality management due to the specific characteristics of food
production (Chapter 1) and applicability in practice. Companies can recognise practical

General discussion
133
situations in the integrated approach, which leads to commitment and a higher motivation for
improvement of their food quality management.
8.3 What are the opportunities of IMAQE-Food?
IMAQE-Food can be used for several objectives: measuring effectiveness of food quality
management, assessment of production quality, assessing interdependency between contextual
factors and production quality, assessment of food quality management, and analysing
appropriateness of QA systems in increasing the level of quality management.
8.3.1 Measuring effectiveness of food quality management
IMAQE-Food can be used for measuring effectiveness of food quality management activities
to obtain an appropriate production quality within the context of the organisation (Chapter 6).
Effectiveness is measured by analysis of relations between production quality, quality
management and contextual factors. Food quality management is considered to be effective
when a higher level of quality management was related to a higher production quality.
Moreover, quality management is also effective when contextual factors and quality
management were related to a higher production quality, whereas contextual factors without
quality management were related to a lower production quality.
Effectiveness can be assessed for individual companies and for a group of companies by
evaluation of the level of quality management and production quality. On the basis of this
assessment, companies can improve production quality by improving and/or adding quality
management activities that are suitable to their contextual situation. Within a group of
companies, benchmarking can be used to compare the level of quality management activities
and production quality. Differences in effectiveness may be an indication for how an effective
food quality management can be achieved to increase production quality.
Insight in effectiveness supports food manufacturers in deciding which system is most
suitable and how to achieve their objectives. This can result in a higher production quality,
compliance with expectations of consumers, regaining and maintaining trust of consumers in
food production quality, and maintaining and improving competitiveness of food
manufacturers.

Chapter 8
134
8.3.2 Assessment of production quality
IMAQE-Food can also be used to measure production quality in order to determine quality
performance and how this can be improved (Chapter 2, 3, 4, 6). Indicators for production
quality in the bakery sector were: percentage of rejected products; results of legislative
evaluations; results of technical evaluations; and percentage of complaints about respectively
product quality and availability. This study showed that bakeries did not record and collect
sufficient data to develop one indicator for production quality in a broad perspective for the
bakery sector (Chapter 4, 5, 6). Only �results of legislative evaluation� was measured by most
bakeries (94%); the availability of the other four indicators differed in a range from 54-71%
of the bakeries. Data about costs were obtained from only 48% of the bakeries. An
appropriate data collection will enable the assessment of effectiveness by IMAQE-Food.
Data collection also requires execution of more activities resulting in higher costs. However,
data show which failures are made in the production process, which gives insight in failure
costs. In practice, failure costs appear to be higher than manufacturers expect 1, 2 and should
be lowered. Prevention (e.g. quality assurance, specifications) and/or inspection (e.g.
receiving inspection, process control, collection of data) decrease production failures (e.g.
waste, rework, claims) resulting in a higher product quality and availability, and/or lower
costs. Therefore, companies should determine an optimum of quality performance and quality
costs i.e. prevention, inspection and failure costs 3. The optimum situation for a food
manufacturer is not necessarily the quality performance with the lowest quality costs, because
high requirements on production quality need more prevention than what will be concluded
from quality costs. Due to the higher requirements by consumers, customers and legislation,
food manufacturers should prevent failures of food safety, product quality, availability and
environmental aspects. Therefore, investing in quality assurance and quality management is of
major importance. The optimum between quality performance and quality costs is dependent
on factors like product type, company size, size of the product assortment 1. IMAQE-Food
can be used for considering the optimum situation between quality performance and quality
costs.
8.3.3 Assessing interdependency between contextual factors and production quality
Another application of IMAQE-Food is gaining insight in interdependency between
contextual factors and production quality to determine the required level of food quality
management (Chapter 5, 6). On the basis of insight in these contextual factors, food

General discussion
135
manufacturers can select suitable quality management activities for their specific situation in
order to obtain effective quality management.
Each bakery in our sample had a different set of contextual factors with respect to
organisation, production process, and product assortment (Chapter 6). In practice, bakeries are
often distinguished according to four contextual factors: (1) type of QA systems, (2)
organisational size, (3) degree of automation, (4) type of product groups. These contextual
factors revealed differences in the level of five quality management activities i.e. �control of
strategy�, �allocation of supplying raw materials�, �supply control�, �planning of
production�, and �control of execution of production tasks� (Chapter 7). If the
interdependency between these contextual factors, quality management activities and
production quality are studied, the effectiveness of these activities for the specific groups can
be investigated.
Differences between companies are commonly known (Chapter 3), however it was not studied
how effective food quality management could be achieved. IMAQE-Food reveals quality
management activities that are required to obtain an optimal production quality within the
context of the organisation. This can be used to develop effective QA systems and
implementation methods for companies with a specific context, which makes them better
applicable and useful. This will decrease the gap between the actual context of the company
and QA systems.
In addition, IMAQE-Food can also be used for measuring interdependency between diversity
in food supply chains, quality management and production quality (Chapter 3). In IMAQE-
Food typical performance measurement indicators for complexity of the supply chain are
enclosed like number of linkages, relationships and co-ordination between linkages, and
characteristics of food production 4. Supply chain performance should consist of the total of
performances of individual linkages and an added value due to co-operation 5, 6. This will
show which partner takes advantage of the co-operation and how performance can be
improved.
8.3.4 Assessment of food quality management
IMAQE-Food can be used to measure the level of food quality management (Chapter 4, 5).
On the basis of the assessment, food manufacturers can decide to add or improve quality
management activities. The relation between food quality management and production quality
shows which quality management activities are effective.

Chapter 8
136
This study revealed that effective quality management activities in the bakery sector were (1)
control of strategy, (2) allocation of supplying raw materials, (3) supply control, (4) control of
production, (5) control of execution of production tasks, (6) control of receiving orders, and
(7) planning of distribution (Chapter 6). These quality management activities were effective in
improving results of legislative and technical evaluation, and reducing percentage of rejected
products and percentage of complaints about respectively product quality and availability.
Although IMAQE-Food can assess effectiveness, for some bakeries a relation between a
lower level of quality management and a higher production quality was found due to presence
of experience (Chapter 6, 7).
IMAQE-Food also evaluates quality management on its flexibility (Chapter 4). A company
needs flexibility to anticipate unexpected or unusual situations and to comply with customer
requirements. A certain extent of bureaucratic system is necessary to record methods, tasks
and responsibilities in procedures. However, registration and working according to procedures
can also be carried out too far, leading to an ineffective bureaucracy and a too formal
organisation. Therefore, companies should find a balance between flexibility and bureaucracy,
and between an informal and a formal organisation 7, 8. For this purpose, a strategy should be
developed which establishes the required quality behaviour and administrative conditions.
8.3.5 Analysis of suitable quality assurance systems
IMAQE-Food can be used to analyse the appropriateness of QA systems in increasing level of
specific quality management activities. This study showed differences in interdependency
between level of quality management activities and QA systems (Chapter 7).
IMAQE-Food can basically be used to measure effectiveness of these QA systems. For this
purpose, IMAQE-Food should be detailed, because it has been developed for food quality
systems in the broadest sense. Quality management should consist of relevant quality
management activities of the QA system (e.g. risk analysis, verification), whereas production
quality should contain indicators that measure the objective of the QA system (e.g. food
safety) 9.
Food manufacturers have to decide which QA systems are most suitable for their specific
situation. However, this decision is not completely voluntary due to external requirements by
legislation and customers (Chapter 3). Legislation requires application and implementation of
a food safety system like HACCP. Moreover, an increased number of customers in supply

General discussion
137
chains requires application of QA systems by their suppliers: e.g. farmers require GMP
certified animal feed, and supermarkets require BRC and EUREP-GAP.
8.4 Application of IMAQE-Food in other food sectors
IMAQE-Food was considered to be generic for the bakery sector, whereas only small
modifications of indicators were needed to make the instrument suitable for the vegetable and
fruit-processing sector (Chapter 5). IMAQE-Food is expected to be applicable in other food
sectors as well after specific modifications. For example, animal sectors have to manage other
factors to obtain desired quality than for sectors of plant origin. In the last decade more food
incidents occurred in supply chains of animal origin than in sectors of plant origin, indicating
that the factors are probably more critical for food safety. Therefore, it is expected that
IMAQE-Food will require considerable modifications to be applicable for animal sectors. The
contextual factors should also include production characteristics in other linkages of the
supply chain, because aspects like feed, welfare, hereditary, pre-slaughter handling and
transport influence production quality of animal products 8, 10. Quality management should
consist of extra activities like exchanging information and inspection to know how quality is
controlled in other linkages to minimise risk of contamination and growth of micro-
organisms, residues and contaminants. In contrast to bakeries and vegetable and fruit
processors, sectors of meat products collect, record and exchange more information about
production quality by identification and registration systems that are integrated through the
supply chain 11, 12. More available data will increase validity and reliability of the instrument
and will result in a better assessment of the effectiveness.
8.5 Conclusion
IMAQE-Food is a reliable and valid instrument that enables measuring effectiveness of food
quality management in the bakery sector. The insights of this study support food
manufacturers in deciding which system is most suitable for their situation and how their
objectives have to be achieved. Policy makers can use this information to improve established
QA systems and to develop effective implementation methods. This can result in effective
quality management and an increased production quality, which will lead to more confidence

Chapter 8
138
of consumers in food production quality and improving competitiveness of food
manufacturers. The developed methodology will also support other researchers to develop
similar instruments.
8.6 Recommendations
8.6.1 Recommendations for research
IMAQE-Food could serve as a basis for other applications in the agri-food sector such as:
- specifying IMAQE-Food for other food sectors (e.g. animal production). For this purpose,
qualitative research should be done to verify relevancy of current indicators for the
specific sector, and indicators should be evaluated on reliability and validity using the
structured procedure (Chapter 5).
- studying the effect of complexity of the food supply chain on food quality management.
IMAQE-Food should be extended with the additional element �complexity of the supply
chain� as a new element (Chapter 3). Current indicators have to be further specified and
validated. This study will provide insight in why food quality systems of several supply
chains differ in their realisation of the production quality and how they can be improved.
- measuring effectiveness of QA systems. IMAQE-Food should be detailed for specific
conditions of QA systems.
For food quality management an integrated approach of technological and managerial aspects
is of major importance. The interdependency between production quality and technological
and managerial aspects of food quality management can be further studied to support food
manufacturers in making decisions if activities should be improved regarding quality
behaviour and administrative conditions and/or food characteristics and technological
conditions. For this purpose, new constructs should be developed.
8.6.2 Recommendations for bakeries
Bakeries should collect, record and analyse more data about production quality to improve
their food quality management and to enable assessment of effectiveness. Knowledge about
quality performance and effectiveness gives insight in how production quality can be
improved.

General discussion
139
QA systems focus on different aspects of a complete quality system and differ in several
aspects. Bakeries should combine specific elements of these QA systems depending on their
contextual factors; each company should adjust the generic QA systems to their specific
situation.
Bakeries can use IMAQE-Food for:
- measuring effectiveness of food quality management;
- assessment of production quality;
- gaining insight in interdependency between contextual factors and production quality;
- assessment of level of food quality management;
- analysing appropriateness of QA systems to their contextual situation.
8.7 References
1. Mulder, F. A. (1991). Manager en produktkwaliteit. Deventer: Kluwer Technische Boeken. 2. Heer, de A. Ahaus, C.T.B. and Vos, A.M.A.M. (1988). Kwaliteitskosten, wat baat het? Deventer: Kluwer
Technisch Boeken. 3. Juran, J.M. (1951). Quality Control Handbook. New York: The Grown Hill. 4. Nijssen, I.T.C. (2001). Toepasbaarheid van het conceptuele model van Spiegel voor de groente- en
fruitbewerkingssector: Kwalitatieve analyse betreffend de realisatie van kwaliteit in groentesnijderijen. MSc-thesis. Wageningen: Wageningen University.
5. Spiegel, van der M. and Ziggers, G.W. (1999). The application of the TQM-concept in Food Supply Chains. pp. 724-736. In: Werther, W. Takala, J. and Sumanth, D.J. (Eds.). Productivity and Quality management Frontiers � VIII. Proceedings of the International Conference on Productivity and Quality Management �99 held at Vaasa, Finland at June 14-16th, 1999. West Yorkshire: MCB University Press.
6. Spiegel, van der M. and Ziggers, G.W. (2000). Development of a Supply Chain Quality Management Model. pp. 147-155. In: Trienekens, J.H. and Zuurbier, P.J.P. (Eds.). Chain Management in Agribusiness and the Food Industry. Proceedings of the Fourth International Conference, held at Wageningen, the Netherlands at May 25-26th, 2000. Wageningen: Wageningen Pers.
7. Vetjens, R. (1995). De werkelijkheid achter kwaliteitszorg. Amsterdam: Addison-Wesley. 8. Luning, P.A. Marcelis, W.J. and Jongen, W.M.F. (2002). Food quality management: a techno-managerial
approach. Wageningen: Wageningen Pers. 9. Waelkens, A.C. (2002). Effectiviteit van HACCP en Hygiënecode voor de brood- en banketbakkerij in
Nederland. MSc-thesis. Wageningen: Wageningen University. 10. Tarrant, P.V. (1989). The effects of handling, transport, slaughter and chilling on meat quality and yield in
pigs � a review. Irish Journal of Food Science and Technology, 13 (2), 79-107. 11. Plaggenhoef, van W. (2003). Kip, een gecontroleerd stukje vlees? Inventarisatie van de bruikbaarheid en
doorgifte van voedselveiligheidsinformatie in de pluimveevleesketen. MSc-thesis. Wageningen: Wageningen University and Research Centre.
12. PVE. (2002). Actieplan Salmonella en Campylobacter in de pluimveevleessector 2000+. Zoetermeer: Productschap voor Vee, Vlees en Eieren.


Questionnaire
141
Appendix: Questionnaire Section I: Background information about respondent and company Name company : �����������������������. Name respondent : �����������������������. Function : �����������������������. To be employed from (dd-mm-yy) : �����������������������. E-mail address : �����������������������. Organisational structure 1. Could you show your organisational structure?
How many levels does your organisational structure consist of? ������ levels
2. What is the location of the quality manager?
�� No quality manager �� Production manager �� Quality assurance department �� Staff department
�� Individual department �� Part of the production department �� ��
3. Does external people support your organisation?
�� No �� Yes, support on:
�� QA system �� Advise �� Development / design �� Implementation
�� Analyses �� Hygienic evaluation
�� Maintenance �� Cleaning and disinfecting �� Pest control �� Improvement of production lines �� ��
QA systems 4. A. Has a QA system been implemented?
�� No �� Yes,
�� GMP �� HACCP �� Hygiene code �� Process control plan for Meat products
(RVV) �� ISO 9001 �� ISO 9002 �� ISO 9003 �� ISO 9004
�� ISO 9001:2000 �� ISO 14001 �� BRC �� TQM (e.g. Dutch Quality Award, EFQM) �� Health & Safety at Work �� AMvB �� Quality, Health & Safety at Work, and
Environment �� ��
4. B. Where is this system based on?
�� Norms �� Processes 4. C. Which level of details does the QA system have?
�� Generic �� Detailed

Appendix
142
5. Has the QA system been certified? �� No �� Yes,
System: �������. Certified by: ��������. 6. Who has developed the QA system?
�� Director �� QA manager �� Product expert �� Process expert �� Technologist �� Production employees
�� Packaging expert �� Distribution expert �� Customers �� External organisation �� Students �� ��
7. Who has implemented the QA system?
�� Director �� QA manager �� Product expert �� Process expert �� Technologist �� Production employees
�� Packaging expert �� Distribution expert �� Customers �� External organisation �� Students �� ��
8. A. How has the QA system been implemented?
�� Once �� In phases: ��������������
8. B. From which date has the QA system actually been implemented in practice?
i.e. date from when all employees in the organisation really work according to the entire QA system. ����.
9. Who does inspect your organisation (extern)?
�� Keuringsdienst van Waren �� RVV �� Regional authorities �� Certification / Inspection agency �� Environment inspection
�� Voluntary inspection, like by NBC �� Customers �� Consumer organisations �� ��
Mission 10. Order following dimensions according to relevancy for your company:
(1 = most relevant, 6 = less relevant): �� product quality: Compliance with product specifications and requirements of customers. �� availability: Deliverance of appropriate quantity of products at the appropriate place and time. �� costs: Costs incurred during purchase, production and sales. �� flexibility: Ability of an organisation to respond to new situations. �� reliability: Ability of an organisation to fulfil its commitments. �� service: Degree of services which are provided to customers besides the delivery of the
ordered product.

Questionnaire
143
11. Does your company co-operate with a specific trade company or co-operation? �� No �� Yes,
�� Bake Five �� Bakery Concepts:
�� Alles even lekker �� De Gebackerij �� Kern Bakkers
�� Bakkersland �� BEKO-Benelux �� CIVOBA �� Echte Bakkers Gilde �� Heerlijk & Heerlijk (MCB)
�� Kamps: �� Bakker Bart Food Group �� Bakker Bart �� Bakerstreet �� �t Stoepje �� Quality Bakers
�� Top Bakkers �� Verbisko �� Warme bakkers �� ��
12. Which outlets does your company have?
�� Petrol station �� Bread and confectionery bakeries �� Own store(s) �� Own deliverance, delivery districts �� Market stall holders �� Driving stores �� Independent bread merchants
�� Large customers: �� Institutes, hotel and catering industry,
canteens �� In store bakeries �� Supermarkets �� Department stores
�� �� Section II: Contextual factors Complexity of the organisation 1. How many employees are involved in your company?
����� employees ����� part timers ����� temporary employees ����� shifts (in production) in a day
2. How many affiliates are part of your organisation?
����� affiliates (including stores, production, etc.) ����� affiliates with a department of production
3. How many suppliers of raw materials are co-operating with your organisation?
����� suppliers (e.g. supply co-operations, individual suppliers) 4. A. How many products are purchased by your organisation?
����� final products ����� half fabricates
4. B. How many final products are sold by your organisation?
����� final products 5. To how many delivery points (i.e. locations where products are delivered e.g. store, affiliate of a
supermarket, a centre for distribution) are you delivering? ����� delivery points

Appendix
144
6. How many customers (exclusive sales to consumers via own shop) do you have? ����� customers
7. How many products do you sell to customers?
����� products to customers ����� products to consumers via own shop
8. To how many co-operations (i.e. co-operations between bakeries or between a bakery and other linkages of
the supply chain, including exchange resulting in advantages for each) are you participating? ����� horizontal co-operations (with other bakeries like Bakkersland, Bake Five) ����� vertical co-operations (with other linkages like grower, supplier, organisation of supply,
customer) Complexity of the production process 9. How many production lines do you use for production?
����� production lines No production lines? Go to question 12.
10. What is the average number of times that a production line is changed (change of parameters e.g. due to
change of a product group) in a day? ����� times of changing in a day
11. What is the average number of times that a production line is adjusted (adjustment of parameters e.g. due to
variations of raw materials) in a day? ����� times of adjustments in a day
11. Which process steps are used for the production of a specific product group? Product group Products Process steps
�� Bread �� Purchase of half fabricates �� Rising with a rest period �� Cutting
�� Prebaked bread �� Purchase of half fabricates �� Freezing �� Cooling �� Atmosphere packaging
�� Bake-off (pieces of dough) �� Atmosphere packaging �� Spreaded bread
Bread and bake-off
�� Repacked bread �� Crust dough / fruit pie �� Purchase of half fabricates �� Flan �� Purchase of half fabricates
�� Freezing
Confectionery ((whipped) cream, fresh fruit)
�� Other confectionery �� Purchase of half fabricates �� Freezing
�� Fresh �� Purchase of half fabricates �� Storage of butter dough
�� Long shelf life �� Purchase of half fabricates �� Freezing �� Atmosphere packaging �� Storage of butter dough
�� Bake-off �� Storage of butter dough
Biscuits (filled, cake, cookies)
�� Repacked

Questionnaire
145
Product group Products Process steps �� Crust dough / turned risen
dough �� Purchase of half fabricates �� Freezing �� In between storage
�� Yeast dough �� Purchase of half fabricates �� Freezing �� In between storage
�� Bake-off �� Freezing �� Atmosphere packaging
Filled snacks (meat, sausage, pizza, chicken, spicy, bacon cheese, apple, cream, and comparable products)
�� Repacked �� Chocolate �� In between storage �� Bonbons �� In between storage
Bonbons and chocolate products
�� Repacked 12. What is the degree of automation of your production process?
A production process is automated when no physical operations are executed. Product group Process step Automated Manual
Supply of flour Mixing Division of dough Preparing / filling of tins Cutting / decoration Transport of filled baking tins Post rising Transport Baking Mechanical moving
ovens Non-mechanical moving ovens
Removing bread from tin Transport of tins Cooling of bread Ventilators Cutting / packaging Putting in boxes
Bread and bake-off
Preloading Preparation of baked half fabricates
Preparation of (whipped) cream, sugar containing half fabricates
Manufacturing of confectionery Transport of confectionery Preparation of dough for flan Preparation of fruit filling, cream, rice pudding
Manufacturing of flan Transport of flan Cooling
Confectionery
Packaging

Appendix
146
Product group Process step Automated Manual
Supply of flour Moulding Shaping / decoration of dough Baking Cooling
Biscuits
Packaging Preparation of dough Preparation of filling Manufacturing of snacks Cooling
Filled snacks
Packaging Manufacturing of interior Preparation of chocolate Manufacturing of bonbons Cooling
Bonbons and chocolate products
Packaging Complexity of the product assortment 13. How many recipes does your organisation produce?
Bread: number of recipes is the number of types of dough with different decorations (e.g. sesame). This can be the same as the number of types of dough. For example, a type of dough with six decorations has six recipes.
Product group Number of recipes Bread (loaf of bread, buns, baguette)
Filled bread Bake-off (atmosphere packaged bread, cooled prebaked bread and (un)risen pieces of dough)
Confectionery ((whipped) cream, fresh fruit)
Filled biscuits etc. Cake Cookies Filled snacks (meat, sausage, pizza, chicken, spicy, bacon cheese, apple, cream, and comparable products)
Spreaded bread Bonbons and chocolate products
14. How many final products are stored?
This involves all final products that are stored for minimal one day before selling or distribution. ����� final products that are stored for minimal one day ����� final products that are directly delivered or sold

Questionnaire
147
Section III: Quality Management In this part of the questionnaire questions are asked about several plans (strategy (i.e. creation of resources and capacity), purchase plan, production plan, distribution plan. Besides, some questions are about the execution of production tasks. These aspects can be executed from simple to complex. Strategy In the part Strategy questions are asked about the long-term plan which describes when and which products and in which amount will be produced. Formulation 1. Do you formulate a long-term plan?
�� No, no long-term plan �� Yes,
�� Day �� Week �� 1-3 Months �� Year
2. Is the long-term plan recorded?
�� No �� Yes,
�� Planning system �� Printed �� Written 3. How do you plan for a long term?
�� Planning is always different. �� Planning is always the same. �� Planning is approximately the same, although major aspects will be changed if required.
4. To which extent do you plan at the same time?
�� The planning is established at different times, which results in various throughput times. �� The planning is mostly established at the same time. �� The planning is always established at a fixed time and has the same throughput time.
5. Which information is used for the strategy?
�� Former strategies �� Plans of related co-operative organisations
or trading companies �� Strategic objectives, like investments,
acquiring personnel, certification, co-operation, advertising, participation to expositions, adjustments of the product assortment.
�� Data of turnover �� Delivery times of raw materials
�� Availability of raw materials �� Promotions of suppliers �� Promotions of customers �� Orders �� Previous orders �� Level of storage �� Forecast of customers �� Orders by colleagues due to failures �� Data of capacity �� ��

Appendix
148
6. Which aspects are included in the strategy? �� Difference between beginning and end of
the week �� Holiday �� Weather �� Type of consumer �� Maintenance, cleaning �� Intermission of production �� Audits �� Process improvement �� Costs and profits �� Capacity (personnel, resources) �� Failures
�� Production time (time of changing, effective production time)
�� Product order �� Training and education �� Innovation by other linkages of the supply
chain �� Planning by other linkages of the supply chain �� Promotions by other linkages of the supply
chain �� Requirements by other linkages of the supply
chain �� ��
7. To what extent do you take account of innovations, promotions, and events?
�� No taking into account. �� All aspects that directly influence the production (e.g. weather) are taken into account. �� All aspects that directly influence the strategy (e.g. capacity, holidays) are taken into account. �� All relevant aspects are taken into account and alternatives are established.
8. To what extent do you use data of previous plans?
�� A new plan is always established. �� Relevant aspects of previous plans are taken into account. �� The new plan is entirely established on the basis of previous plans.
9. A. Who is involved in the strategy?
�� Internal: �� Director �� Factory manager �� Production manager �� Department of production �� Department of packaging �� Department of warehousing �� Department of expedition
�� Department of planning �� Department of purchase �� Department of sales �� Quality manager �� Trading company �� ��
�� External: �� Institutes �� Consultants �� Study clubs �� Colleagues
�� Branch organisation of the industry �� Other linkages of the supply chain �� ��
9. B. To what extent are employees involved in the establishment of the strategy?
�� Several employees are sometimes involved. �� One employee is always involved. �� One employee is always involved, others sometimes. �� All employees are always involved, or several persons are always involved whereas others sometimes.
Progression 10. A. Is the realisation of the strategy evaluated?
�� No �� Yes

Questionnaire
149
10. B. How is the realisation of the strategy evaluated? �� Realisation of a number of aspects. �� Realisation of all aspects that directly influence the production (e.g. product quality). �� Realisation of all aspects that directly influence the strategy (capacity, sales). �� Realisation of all relevant aspects. If required, the strategy will be adjusted or alternatives will be used.
11. To what extent are other plans established on the basis of the strategy?
�� Strategy is only used for establishment of required resources. �� Strategy is also used for establishment of the operational production planning, purchase plan, sales plan,
etc. Supply of raw materials In this part the questions are about selection and evaluation of suppliers, and ordering and evaluation of raw materials. Ordering of raw materials 12. Do you buy raw materials by yourself?
�� No, purchase is executed by the trading company �� Yes, partly by our organisation �� Yes, completely by our organisation
13. A. Do you order raw materials by yourself?
�� No �� Yes 13. B. To what extent do you order raw materials regularly?
�� The moment changes every time on basis of the information system of the supply organisation, level of storage or sales of final products.
�� Raw materials are always ordered at the same time. �� Some raw materials are always ordered at the same time, other are ordered once on the basis of a
contract and are delivered with a certain frequency. �� Raw materials are ordered once on the basis of a contract and are delivered with a certain frequency.
14. What information is available before ordering?
�� Former orders �� Data of order �� Production plan �� Long-term production plan �� Production values from last year �� Data of stock of raw materials �� Data of stock of products �� Specifications of raw materials �� Storage conditions �� List of suitable suppliers (like
Ingrediëntenwijzer, preferred suppliers)
�� Data of complaints about suppliers �� Price list �� List of delivery times �� List of batch sizes, packaging units �� Price reductions by suppliers �� Price reductions by customers �� Capacity of distribution �� Data of other bakeries �� Journals �� Information of institutes, like NBC �� ��

Appendix
150
15. To what extent do you anticipate on situations in which raw materials are not delivered in time? �� No anticipation. In such case we are not able to produce. Other bakeries are contacted to purchase raw
materials or to order products, or the supplier solves the problem at that moment, or on the spot another supplier is searched for who can deliver.
�� Other suppliers have been selected beforehand. These can be appealed to when suppliers are not able to deliver. Dependent on the situation raw materials can or cannot be delivered
�� Raw materials are always available: or at suppliers, or at other bakeries or sufficient raw materials are in stock to continue the production. A new agreement is made to deliver at another time.
16. To what extent does the order differ from the long-term plan?
�� The long-term plan is not used or the order differs often because ordering of raw materials is hardly to plan beforehand.
�� Sometimes, when suppliers are not able to deliver, when new raw materials are used, change by customers or when new products are developed.
�� No difference. Contact with suppliers 17. A. Do you contact suppliers besides ordering?
�� No �� Yes 17. B. To what extent do you contact suppliers besides ordering?
�� Only with problems �� Regular contact �� Frequent contact 18. About what kind of aspects do you contact suppliers (besides ordering)?
�� With problems with respect to production �� New possibilities and developments �� New possibilities are discussed with
suppliers of the purchase organisation �� Discussion about complaints �� Design of improvement routes �� Evaluation of customer satisfaction by
suppliers �� Development of specific raw materials �� Information about specifications of raw
materials �� Formulation of product specifications
�� Exchange of information with respect to production method, product quality and application of HACCP
�� Auditing of suppliers �� Design of production plans in consultation with
suppliers �� Requirements for the suppliers of suppliers are
together designed �� Co-operation in special offers �� Exchange of employees �� ��
Selection of suppliers of raw materials 19. A. Do you select your suppliers by yourself?
�� No, selection is performed by the trading company�� Yes, partly �� Yes, all suppliers
19. B. How do you select your suppliers?
�� Purchase via purchase organisation or trading company, or the same suppliers are almost maintained. �� Suppliers are selected from a list of suppliers that are selected by the purchase organisation. �� Suppliers are evaluated on criteria that influence directly production quality (e.g. price, availability). If
necessary, a supplier will be visited and evaluated.

Questionnaire
151
20. Based on which criteria do you select suppliers and raw materials? �� Relation with suppliers �� Reliability �� Service �� Product quality (like compliance with
legislation e.g. Meelbesluit, microbiological and chemical requirements)
�� Quality of the application (e.g. baking quality)
�� Variation in assortment (product and packaging units)
�� Information about product specifications (e.g. GMO-free)
�� Information about product quality, production method
�� Development of specific raw materials �� Price �� Actions and special offers �� Quantity �� Delivery time �� Delivery frequency �� Flexibility (quick delivery) �� Neighbourhood of supplier �� Margin in capacity �� Application of a QA system, like HACCP, ISO �� Implementation of a QA system (results of
audits) �� Positive results of other bakeries �� Requirements to suppliers of suppliers �� ��
21. What information do you use to select suppliers and raw materials?
�� Evaluation of former deliveries, complaints
�� Results of baking tests, demonstrations �� List of suppliers, like Ingrediëntenwijzer �� Price list �� Results of audits �� Information of account managers �� Image, name in market �� Journals, exhibitions �� Data of colleagues �� Data of customers
�� Information by suppliers and purchase organisations (BEKO-Benelux, CIVABO)
�� Information by accreditation agencies, like ISA, Lloyds, etc.
�� Information by institutes like NBC �� Information by branch organisations (NBOV,
NVB) �� Production plan �� Long-term plan �� ��
22. To what extent are (new and current) suppliers regularly selected and evaluated?
�� Suppliers are selected and evaluated every time. �� Only new suppliers are selected and evaluated. �� If bad experiences or evaluations, the list of suppliers will be adjusted and another supplier will be
selected. �� If bad experiences or evaluations, an agreement about an improvement method will be developed with
the supplier. If no improvements, the list of suppliers will be adjusted and another supplier will be selected.
23. A. Who is involved in selection of suppliers of raw materials?
�� Internal: �� Director �� Production manager �� Production employees �� Planner �� Supply department
�� Sales department �� QA manager �� Product designer �� Trading company �� ��
�� External: �� Institutes �� Consultants �� Student society �� Other bakeries
�� Branch organisation �� Customers �� ��

Appendix
152
23. B. To what extent are employees involved in selection of suppliers of raw materials? �� More employees are sometimes involved. �� One employee is always involved. �� One employee is always involved, other sometimes. �� All employees are always involved, or more employees are always involved whereas others sometimes.
Receipt control 24. To what extent are raw materials evaluated?
�� Raw materials are not evaluated. �� Specifications of raw materials are evaluated. �� Spot-check procedure (i.e. raw materials are at random evaluated on compliance with specifications and
conditions) or acceptance sampling (i.e. after a specific number of products raw materials are evaluated).
�� 100% Inspection: all delivered raw materials are evaluated. �� Receipt control and analyses raw materials are always evaluated on compliance with specifications and
conditions. Suppliers are also audited to evaluate registration and performance of the production process.
Agreements with suppliers 25. A. Do you make agreements with suppliers by yourself?
�� No �� Yes, partly �� Yes, all suppliers
25. B. How do you make agreements with suppliers?
�� This varies per order, supplier, product or subject: agreements are sometimes made or sometimes not made.
�� This varies only at specific situations (e.g. new products, changes of price). �� Agreements with the suppliers are always made.
26. Which agreements do you make with suppliers?
�� Quality of raw materials (including absence of contamination)
�� Adjustments of products �� Information about e.g. product
specifications, shelf life �� Providing results of audits �� Price, bonus �� Price reductions �� Quantity and batch size �� Delivery requirements
�� Delivery time �� Delivery frequency �� Delivery location �� Key to deliver at night �� Agreement about returns �� Labelling �� Packaging �� Guarantees �� Agreements about specificity of raw materials �� ��
27. Are agreements with suppliers recorded?
�� No �� Yes, partly, i.e.
�� Information system �� Printed �� Written
�� Yes, all suppliers

Questionnaire
153
Order analysis This part consists of questions about order analysis, evaluation on ability to comply with orders, processing orders and communicate data to department of production planning. Order analysis 28. Do you produce on order?
�� No, �� Via quotations �� Agreements �� On stock
�� On prognoses �� ��
�� Yes, partly on order �� Yes, all products on order 29. A. Do you analyse orders?
�� No �� Yes 29. B. To what extent do you analyse orders?
�� Seldom, only orders of new customers or when failures were made last time. �� Sometimes, this is dependent on customer, method of providing orders (fax, computer), or type of order. �� Orders are always analysed.
30. What aspects of orders do you analyse?
�� Possibility to comply with requirements of customers: �� Product quality �� Availability �� Storage and distribution conditions �� Delivery time �� Quantity �� Price
�� Article number, naming by customer �� Price reductions �� Time of providing �� Consistence of ordering: presence of order,
exception of former orders �� Customer �� Fit in route �� ��
31. To what extent do you use data of former orders for evaluation or planning of new orders?
�� Former orders are not used with the exception of failures of the computer system. �� Orders are used to make a temporary plan. �� Former and new orders are compared. When last times no required production quality could be
delivered or when orders differ, adjustment of the order is discussed with the customer. 32. What information is sued for order analysis?
�� Product specifications �� Process specifications �� Data of production plan �� Former orders �� Data about stock of products
�� Data about stock of raw materials �� Orders, phone lists, fax lists �� Price reductions of customers �� ��
Order acceptation 33. To what extent are orders accepted?
�� Each order is accepted. �� Standards for acceptation of orders have been established, e.g. time of providing orders, presence of
data (number, products), customer. When the production quality can not comply with the order, customer is informed and new agreements are made.

Appendix
154
34. Are accepted orders recorded? �� No �� Yes,
�� Planning system �� Database in computer, printed paper �� Written
35. To what extent is anticipated on production plan during order analysis?
�� No anticipation. �� Anticipation on capacity. �� Anticipation on capacity and realisation. If necessary, less or more orders will be accepted.
36. A. Who is involved in order acceptation?
�� Director �� Supply department �� Production manager �� Production employees
�� Sales department �� Planning department �� Administration department �� ��
36. B. To what extent is employee involved in order acceptation?
�� More employees are sometimes involved. �� One employee is always involved. �� One employee is always involved, others sometimes. �� All employees are always involved. �� More employees are always involved, others sometimes.
37. To what extent are other plans developed on basis of order analysis?
�� Order analysis is not used for development of other plans. �� Production plan, distribution plan or purchase plan are developed on basis of order analysis.
Production plan This part consists of questions about development of production plan which described what, when, where, and by whom is produced. Production plan contains the production process from storage of raw materials to storage of end products. Development 38. A. Is a production plan developed?
�� No �� Yes 38. B. To what extent is a production plan developed?
�� Production plan is always new developed. �� Production plan is developed on basis of experience. �� Design is mainly the same, but major aspects will be changed if necessary.

Questionnaire
155
39. Which information is used for development of a production plan? �� Orders �� Level of stored products �� Level of stored raw materials �� Data about delivery times of raw materials �� Price reductions by customers �� Former production plans �� Long-term plan �� Results of former productions (percentage
of failures, bottlenecks)
�� Store plan �� Distribution plan �� Product specifications �� Process specifications �� Information of the trading company �� Information of other bakeries �� Information of institutes �� Plans of other linkages of the supply chain �� ��
40. On basis of which data is the production plan developed?
�� Data of orders �� Data of stored products �� Data of stored raw materials �� Delivery requirements �� Product order �� Process specifications �� Priority of activities (production,
maintenance, cleaning)
�� Available capacity (equipment, people) �� Delivery time �� Production time �� Changing time �� Organisation of production and storage �� Cost price �� Customer �� ��
41. Is the production plan recorded?
�� No �� Yes,
�� Planning system �� Printed paper �� Written paper * Product order 42. To what extent do you establish the product order in the production plan?
�� No establishment. �� Product order is based on experience and can change dependent on the situation. �� Product order is established, e.g. on basis of type of product. Based on this product order the production
plan is developed. 43. Which aspects determine the product order?
�� Probability on cross-contamination �� Specific product requirements (like diet
products, gluten-free, free of milk proteins)
�� Number of failures �� Number of times of cleaning �� Organisation of production and storage �� Number of times changing equipment �� Size of product �� Preliminary treatment of raw materials
(e.g. soak and well of currants) �� Types of dough �� Rising time
�� Baking time �� Temperature of the oven �� Cutting �� Packaging �� Cooling �� Shelf life �� Quantity �� Capacity (baking tins, oven room, etc.) �� Customer �� Delivery time of products �� Costs �� ��

Appendix
156
44. Do you anticipate on cross-contamination during production? �� No, no anticipation �� Yes, by
�� Temperature �� Humidity �� High care / low care rooms �� Products are separated produced �� Separated storage of products
�� Control of product flow �� Reuse of dough: not for all products �� Packaging �� ��
* Time 45. In what extent is time determined which is necessary for production?
�� Not determined. �� Time is estimated based on experience, via capacity of equipment or is determined by testing of the
production of new products. �� Time per employee is recorded. Based on this time, standards are established and adjusted.
46. To what extent are failures and unexpected orders (rush orders, backorders, cancellations) included in the
production plan? �� No anticipation. Failures and unexpected orders cause that the plan can not be realised and no
compliance with customer requirements. �� If necessary, extra capacity will be mobilised (personnel, shift), the production time will be lengthened,
or maximal capacity corresponds with the most full plan. Margins are available for more quiet days, although no margins are available for busy days.
�� Margins are included within the plan to prevent problems or beforehand agreements are made about hiring personnel or contracting out production.
Realisation 47. A. Is the realisation of the production plan evaluated?
�� No �� Yes 47. B. To what extent is the realisation of the production plan evaluated?
�� After production the realisation of the plan is evaluated. No adjustment of the plan during production. �� During production the realisation of the plan is regularly evaluated. Based on this evaluation the plan is
adjusted during production. �� Employees register the realisation and report when the plan is not realised or if the plan has to be
adjusted. Based on this report the production plan is adjusted during production. 48. To what extent are other plans adjusted based on the production plan?
�� Production plan is not used for development of other plans. �� Plans connected operationally on the production plan, like purchase plan or distribution plan. �� All plans use the production plan, like purchase plan, distribution plan, sales plan, long-term plan.
Distribution plan This part consists of questions about development of the distribution plan that describes what, when and where products have to be delivered. Development 49. A. Do you develop a distribution plan?
�� No �� Yes, partly: transport company designs the route, although we plan preloading by ourselves. �� Yes, whole distribution plan

Questionnaire
157
49. B. To what extent do you develop the distribution plan? �� Distribution plan is always new developed. �� Distribution plan is developed on basis of experience. A selection is made from known possible routes. �� Distribution plan is mainly the same (established routes), but if necessary major aspects will be
changed. 50. What information do you use for development of the distribution plan?
�� Data of orders �� Prognosis, expected number of orders �� Realisation of production plan �� Realisation of long term production plan �� Other distribution plans
�� Data of other bakeries �� Planning of other linkages of the supply chain �� Information about storage conditions �� ��
51. On basis of which aspects is the distribution plan developed?
�� Customer �� Delivery time �� Margins of delivery times �� Shelf life of the product, FIFO �� Average quantity of products per customer �� Location of deliverance
�� Regional regulation �� Available capacity (number of company trucks,
loading volume, return capacity) �� Route �� Required transport conditions of products �� ��
52. Is the distribution plan recorded?
�� No �� Yes,
�� Planning system �� Printed paper �� Written paper 53. To what extent do you anticipate on unexpected situations with developing the distribution plan?
�� When the plan is not realised, the problem will be solved on that moment. �� The distribution plan anticipates on unexpected situations (e.g. by an extra chauffeur). Therefore, the
distribution plan is always realised. �� The distribution plan anticipates on unexpected situations and alternatives are developed. Therefore, the
distribution plan is always realised. Realisation 54. A. Is the realisation of the distribution plan evaluated?
�� No �� Yes 54. B. To what extent is the realisation of the distribution plan evaluated?
�� The realisation of the distribution plan is evaluated after the distribution. The plan is not adjusted during distribution.
�� Time of deliverance is recorded and compared with margins of delivery times. When these times differ, customers are informed during distribution.
�� Time of deliverance is recorded and compared with margins of delivery times. When these times differ, the distribution plan is adjusted and customers are informed during distribution.
55. To what extent are other plans adjusted based on the distribution plan?
�� The distribution plan is not used for development of other plans. �� Plans that operationally connect to the distribution plan, like sales plan and production plan. �� All plans use the distribution plan, like purchase plan, sales plan, production plan.

Appendix
158
56. To what extent do you account on cross-contamination and shelf life during transport of products? �� No anticipation. �� Anticipation by organisation of company truck and/or packaging of products. �� Anticipation by organisation of company truck and/or packaging of products. Besides, transport
conditions the distribution time are recorded and evaluated. If necessary, conditions will be adjusted. 57. How do you anticipate on cross-contamination and shelf life during transport of products?
�� Temperature control �� Control of humidity �� Separated compartments �� Empty boxes are separated �� Return drive for old bread �� Distribution time
�� Packaging �� Hygiene control of truck �� Information about shelf life with customer �� FIFO �� ��
Execution of production tasks This part consists of questions about production tasks to obtain production quality. First general questions, next quality control. Execution (general) 58. A. Are production tasks divided among the employees?
�� No �� Yes,
�� One department �� Most production departments
�� Each production department
58. B. To what extent are production tasks divided among the employees?
�� Production tasks are not divided; everyone knows what have to be done. Or everyone has own tasks, but sometimes it changes.
�� Production tasks are different and are divided per day. �� Every week employees receive a list of production tasks that have to be performed in a week. The
realisation is evaluated everyday. 59. A. Are production tasks supervised?
�� No �� Yes 59. B. To what extent are production tasks supervised?
�� All supervisors do sometimes supervise. �� One supervisor does always supervise, other do sometimes. �� All supervisors do always supervise.
60. Who supervises production tasks?
�� Employee �� Other employees �� Manager of production, foreman, assistant
foreman �� Quality manager �� Planner
�� Sales department (visual inspection of end products)
�� Manager �� Director �� ��
61. How do employees know how production tasks have to be performed?
�� By internal education and training �� On basis of experience �� By procedures and instructions
�� By consultation �� ��

Questionnaire
159
62. How are employees instructed? �� Tasks are demonstrated and experience is obtained during production. �� Tasks are demonstrated and an experienced employee supervises. �� Tasks are demonstrated and an experienced employee supervises. Besides, information is available how
to perform the tasks. Process- and product control * Changing shifts 63. A. Is the production handed over to another shift?
�� No �� Yes 63. B. To what extent is the production handed over to another shift?
�� Production is not handed over. �� Realisation and bottlenecks are written. �� Realisation and bottlenecks are communicated by consultation. Possible problems are solved together.
* Realisation 64. A. Is the realisation of the product quality evaluated?
�� No �� Yes 64. B. To what extent is the realisation of the product quality evaluated?
�� By supervision �� Realisation is recorded. �� Realisation is recorded, evaluated and compared with standards (e.g. product is compared with a sample
or it is analysed afterwards). If necessary, production will be adjusted. 65. Based on which data is the performance of production tasks evaluated?
�� Information about realisation: �� Number of finished products �� Number of products in storage �� Number of raw materials �� Product quality �� Percentage of rejected products
�� Production time �� Process parameters �� Inspections and measurements during
production (e.g. weight, length) �� ��
�� Reporting of supervisors �� Results of evaluations (audits and legislative, technical or consumer requirements) �� Financial reporting �� Complaints of customers �� ��
66. A. Is the realisation of production tasks communicated to employees?
�� No �� Yes 66. B. To what extent is the realisation of production tasks communicated to employees?
�� No communication, with the exception of situations like failures or ad hoc changes. �� Results are shown on a publication board, the journal of the company, etc. �� Results are always communicated and consequences are discussed by consultation.
67. To what extent are procedures or methods changed?
�� Procedures and methods are not changed, or these are generic. �� If a procedure is not workable during more times, it will be changed. �� If a procedure is not workable during more times, it will be evaluated and solutions will be searched for.
Based on this evaluation the procedure will be changed or not.

Appendix
160
68. To what extent are data about realisation used for adjustment of the production plan? �� Production plan is not adjusted. �� If the production is not realised, production plan will be adjusted. �� If the production is not realised, production plan will be adjusted. If necessary, customers will be
informed and the long-term plan will be adjusted. 69. A. Do you anticipate on possible variations in the production process?
�� No �� Yes 69. B. To what extent do you anticipate on possible variations in the production process (e.g. by variation in
quality of raw materials, influences of weather, temperature variations during rising)? �� No anticipation. �� Process parameters are adjusted during the production process (e.g. by a graphic T/aw). Compliance of
the product is evaluated on basis of experience or pictures. �� Beforehand measures are taken, like mixing of batches of raw materials, adjustment of recipe, cooling
of meal and dough, organisation of rising room. 70. To what extent do you make a continuous production process?
�� A continuous process is not possible due to lack of capacity. �� The same types of products are planned on one production line or sequentially. Besides, preventive
maintenance is performed. �� The same types of products are planned on one production line or sequentially. Besides, preventive
maintenance is performed and the production process is adjusted (like storage, rising with a rest period) with a minimal waiting time.
71. To what extent is the product quality and food safety controlled?
�� Quality of the product is evaluated on experience. �� Process parameters are recorded and the end product is evaluated. �� Process parameters are recorded and compared with a standard. Besides, the end product is compared
with product specifications. If necessary, the parameters will be adjusted. 72. How is product quality and food safety controlled?
�� Recipe of products (low pH or aw, preservatives, antileng, emulsifiers, etc.)
�� Receipt inspection (visual, analyses, conditions)
�� Evaluation of process parameters �� Metal detector �� Evaluation of storage conditions
(parameters and organisation of storage) �� Hazard analysis �� Risk analysis (possibility x severe) �� Audits �� Evaluation of end product
�� Control of product flow �� FIFO �� Training of personnel �� Evaluation of measurement equipment �� Hygienic design of equipment and buildings
(equipment after 1995 or revision of older equipment)
�� Hygienic inspection (by manager) �� Cleaning and disinfecting plan �� Method of piling up of products �� Procedures and instructions �� ��

Questionnaire
161
73. What information is used for evaluation of product quality and food safety? �� Registration of process parameters �� Visual inspection during production
process �� Results of internal evaluations of end
products �� Results of evaluations of inspection
agencies like Keuringsdienst van Waren �� Results of technical evaluations by NBC
�� Results of analyses �� Results of consumer tests �� Results of evaluation by accounts �� Results of audits �� Results of van hygienic inspections �� Results of competitions �� Information by customers �� ��
74. To what extent is the production process improved by process registrations?
�� No process improvement by process registrations. �� Results are documented. �� Results are documented and evaluated. When process parameters or execution have to be improved,
procedures and instructions are adjusted. �� Results are documented and evaluated. When process parameters or execution have to be improved,
procedures and instructions are adjusted. This is communicated to employees by training, written announcements and/or consultation.
75. To what extent is the production process improved by product evaluations?
�� No process improvement by product evaluations. �� Results are documented. �� Results are documented and evaluated. When process parameters or execution have to be improved,
procedures and instructions are adjusted. �� Results are documented and evaluated. When process parameters or execution have to be improved,
procedures and instructions are adjusted. This is communicated to employees by training, written announcements and/or consultation.

Appendix
162
Section IV: Production Quality This part consists of questions about product quality, availability and costs. Product quality and availability Indicator Product group Answer
Bread Number of bags of meal per 4 weeks
Number of produced products per 4 weeks
Total number of rejected products
Bread
Dough per kgDosing
Bread
DoughMixing
Baking
Metal detection
Packaging / cutting
Number of rejected products per number of produced products per 4 weeks
Delivering
Product quality Type of complaints: Number of complaints per number of products per product group per 4 weeks
Availability Type of complaints:
Legislative requirements - Keuringsdienst van Waren (sanctions, warnings, results evaluation QA system) - RVV
Technical requirements: - NBC - Bakkersland - Echte Bakkers Gilde - Gilde van de Betere Banketbakkers - Topbakkers
External audits
Number of failed legislative evaluations per number of samples per year
Consumer requirements - Consumer tests

Questionnaire
163
Costs Do you formulate a financial report? �� Yes: Could I please have a copy of the report? �� No:
Indicator Financial data Returns per year excluding tax
Total costs: Personnel, transport, accommodation, costs of organisation, costs of sales, general costs, payments, costs of interest
Payments: - Immovable property - Inventory - Means of transport
Costs of interest
Calculated income of entrepreneur and partner
Costs
Purchase - Raw materials - Half fabricates - Sales of purchased products
Failure costs:
Indicator Product group Financial data Quantity of products Rejected products and raw materials
Overproduction
Returns
Extra deliveries (transport costs)
Failure costs
Delay of production
Section V: Finishing question Which effects have the application of the QA system on your organisation? ��������������������������������������������..


Summary
165
Summary
Food quality management is of major importance in the agri-food sector due to the complex
characteristics of food and unpredictable human behaviour. Food manufacturers use various
QA systems to assure food quality. These systems focus on different aspects of the complete
quality system. The specific characteristics of food production and the different situations of
food companies require a selection of appropriate QA systems and an effective
implementation. Therefore, the food sector needs an instrument that measures effectiveness.
The aim of this thesis was to develop and validate an instrument that measures effectiveness
of food quality management. Knowledge about effectiveness of food quality management will
support food manufacturers to select quality management activities suitable to their specific
situation. Policy makers can use this information to improve established QA systems and to
develop effective implementation methods. This can result in effective quality management
and an increased production quality, which will lead to more confidence of consumers in food
production quality and improving competitiveness of food manufacturers. The developed
methodology will also support other researchers to develop similar instruments. This thesis
makes a contribution to the body of knowledge in the field of food quality management by
developing an instrument that measures effectiveness instead of only performance or
compliance with norms and requirements.
In Chapter 2 current performance measurement instruments were evaluated on their
suitability for the development of an instrument that measures the effectiveness of food
quality systems. For this evaluation, perspectives of quality, typical characteristics of agri-
food production, quantification, and performance measurement of quality management were
studied. In reviewing the literature, a broad range of instruments has been developed in other
industries to measure performance of quality management. However, they cannot be used for
measuring effectiveness of food quality systems. Three instruments were selected for the
development of a conceptual model i.e. Wageningen Management Approach, Extended
Quality Triangle, and the quality concept of Noori and Radford.
Chapter 3 described the development of the conceptual model that reflects the
interrelationships between quality management, production quality and contextual factors i.e.
complexity of respectively the supply chain, the organisation, the production process, and the
product assortment. The model proposes that a higher level of quality management results in a

Summary
166
higher production quality. A higher complexity of contextual factors is expected to relate with
a lower production quality, but a higher level of quality management is assumed to reduce the
influence of the contextual factors on production quality. This model was used to develop the
objective instrument to assess performance of quality management in agri-food production.
Chapter 4 aimed to identify performance measurement indicators of the instrument that
measures effectiveness of food quality management, called IMAQE-Food i.e. Instrument for
Management Assessment and Quality Effectiveness in the Food sector. This instrument was
developed by translation of the conceptual model in quantifiable performance measurement
indicators. An identification procedure resulted in 28 indicators that measure performance of
quality management, production quality and contextual factors in the bakery sector. The
indicators enable assessment of interrelationships between the elements.
Chapter 5 evaluated IMAQE-Food on generalisability, reliability and validity among a
sample of 48 bakeries. The validity was tested on content, criterion-relation and construct to
develop a robust instrument. This evaluation resulted in a reliable and validated instrument
that measures the effectiveness of food quality management in the bakery sector. It is
expected that IMAQE-Food will be applicable for other food sectors as well after small
modifications.
Chapter 6 reported a study on the effectiveness of food quality management in the bakery
sector. Effectiveness was measured by assessment of relations between quality management
activities, production quality and contextual factors. The relations were studied from a generic
and a specific point of view. On the generic level, performance of food quality management
was related to contextual factors i.e. complexity of respectively the organisation, the
production process, and the product assortment. Assessment on the specific level revealed that
effective quality management activities in the bakery sector were (1) control of strategy, (2)
allocation of supplying raw materials, (3) supply control, (4) control of production, (5) control
of execution of production tasks, (6) control of receiving orders, and (7) planning of
distribution. These quality management activities were effective since interdependency was
found between these activities and indicators of production quality i.e. higher results of
respectively legislative and technical evaluation, lower percentage of rejected products, and
lower percentage of complaints about respectively product quality and availability. Each
bakery had a different set of contextual factors. Depending on these differences in context,
bakeries should select and implement specific quality management activities that are suitable
to their situation to obtain an optimal production quality.

Summary
167
In Chapter 7 the interdependency between contextual factors of bakeries and their level of
food quality management was investigated. Contextual factors that were studied are QA
systems, organisational size, degree of automation, and type of product groups. The context of
bakeries revealed differences in the level of five quality management activities i.e. control of
strategy, allocation of supplying raw materials, supply control, planning of production, and
control of execution of production tasks. Bakeries that applied BRC, bakeries with more than
150 employees, industrial bakeries, and confectionery and biscuits bakeries performed a
higher level of some of these activities. Food manufacturers can select suitable quality
management activities and QA systems for their specific situation by using IMAQE-Food in
order to obtain an effective quality management.
In Chapter 8 the results of this thesis and their significance for food production systems were
discussed. Possible applications of IMAQE-Food were summarised. This thesis has shown
that IMAQE-Food is a reliable and valid instrument to measure effectiveness of food quality
management in the bakery sector. The instrument should serve as a basis for other
applications in the agri-food sector. The insights of this study support food manufacturers in
deciding which system is most suitable for their situation and how their objectives have to be
achieved. Policy makers can use this information to improve established QA systems and to
develop effective implementation methods. This can result in an effective quality management
and an optimal production quality.


Samenvatting
169
Samenvatting
Kwaliteitszorg is erg belangrijk in de agri-food sector vanwege de complexe eigenschappen
van voedingsmiddelen en het onverwachte gedrag van mensen. Voedingsmiddelenbedrijven
gebruiken verschillende kwaliteitsborgingsystemen om de kwaliteit van voedingsmiddelen te
borgen. Deze systemen richten zich op verschillende aspecten van het totale
kwaliteitssysteem. De specifieke eigenschappen van de voedingsmiddelenproductie en de
uiteenlopende situaties van voedingsmiddelenbedrijven vereisen selectie van geschikte
kwaliteitsborgingsystemen en een effectieve implementatie. Daarom heeft de
voedingsmiddelensector een instrument nodig dat effectiviteit kan meten.
Het doel van dit proefschrift is om een instrument te ontwikkelen en valideren dat effectiviteit
van kwaliteitszorg kan meten. Kennis over effectiviteit van kwaliteitszorg ondersteunt
voedingsmiddelenbedrijven in het selecteren van kwaliteitszorgactiviteiten die passend zijn
voor hun specifieke situatie. Beleidsmedewerkers kunnen deze informatie gebruiken om
huidige kwaliteitsborgingsystemen te verbeteren en om effectieve implementatiemethoden te
ontwikkelen. Dit kan resulteren in effectieve kwaliteitszorg en een toename in
productiekwaliteit, wat kan leiden tot meer vertrouwen van consumenten in de
productiekwaliteit van voedingsmiddelen en in een verbetering van de concurrentiepositie van
bedrijven. De ontwikkelde methodologie kan andere onderzoekers aanzetten om vergelijkbare
instrumenten te ontwikkelen. Dit proefschrift draagt bij aan het kennisveld van kwaliteitszorg
door het ontwikkelen van een instrument dat effectiviteit meet in plaats van alleen
performance of het voldoen aan normen en eisen.
In hoofdstuk 2 zijn huidige performance meetinstrumenten geëvalueerd op hun geschiktheid
voor het ontwikkelen van een instrument dat de effectiviteit van kwaliteitssystemen in de
voedingsmiddelensector meet. Voor deze evaluatie werden perspectieven van kwaliteit,
typische eigenschappen van de voedingsmiddelenproductie, kwantificering en prestatiemeting
van kwaliteitszorg bestudeerd. Uit literatuuronderzoek bleek dat er in andere industrieën een
grote range aan instrumenten ontwikkeld is om de prestatie van kwaliteitszorg te meten. Deze
instrumenten kunnen echter niet gebruikt worden om de effectiviteit van kwaliteitssystemen
in de voedingsmiddelensector te meten. Drie instrumenten zijn geselecteerd die gebruikt
kunnen worden om een conceptueel model te ontwikkelen, namelijk de Wageningse

Samenvatting
170
Besturingsbenadering, de Extended Quality Triangle, en het kwaliteitsconcept van Noori en
Radford.
Hoofdstuk 3 beschrijft de ontwikkeling van het conceptuele model dat de interrelaties tussen
kwaliteitszorg, productiekwaliteit en contextuele factoren weergeeft. De contextuele factoren
bestaan uit de complexiteit van respectievelijk de keten, de organisatie, het productieproces en
het productassortiment. Het model veronderstelt dat een hoger niveau van kwaliteitszorg zal
leiden tot een hogere productiekwaliteit. Er wordt verwacht dat een hogere complexiteit van
contextuele factoren een lagere productiekwaliteit veroorzaakt, en dat een hoger niveau van
kwaliteitszorg deze invloed van contextuele factoren op productiekwaliteit kan verminderen.
Dit model werd gebruikt om het objectieve instrument te ontwikkelen dat de prestatie van
kwaliteitszorg in de voedingsmiddelenproductie kan meten.
Het doel van hoofdstuk 4 was om prestatie-indicatoren te identificeren voor het instrument
dat de effectiviteit van kwaliteitszorg in de voedingsmiddelensector meet. Dit instrument is
IMAQE-Food genoemd, wat een afkorting is voor �Instrument for Management Assessment
and Quality Effectiveness in the Food sector�. Het instrument werd ontwikkeld door het
conceptuele model te vertalen in kwantificeerbare prestatie-indicatoren. Aan de hand van een
identificatieprocedure zijn 28 indicatoren verkregen die de performance van kwaliteitszorg,
productiekwaliteit en contextuele factoren in de bakkerijsector meten. Deze indicatoren
maken het mogelijk om de interrelaties tussen deze elementen te meten.
In hoofdstuk 5 is IMAQE-Food beoordeeld op generaliseerbaarheid, betrouwbaarheid en
validiteit in een steekproef van 48 bakkerijen. De validiteit werd getest op inhoud,
criteriumrelatie en construct om een robuust instrument te ontwikkelen. Aan de hand van deze
beoordeling werd een betrouwbaar en valide instrument verkregen dat de effectiviteit van
kwaliteitszorg in de bakkerijsector meet. Er wordt verwacht dat IMAQE-Food ook toepasbaar
is in andere voedingsmiddelensectoren na kleine modificaties.
In hoofdstuk 6 is de effectiviteit van kwaliteitszorg in de bakkerijsector onderzocht.
Effectiviteit werd gemeten door de relaties tussen kwaliteitszorgactiviteiten,
productiekwaliteit en contextuele factoren te analyseren. De relaties werden op een generiek
en een specifiek niveau bestudeerd. Op het generieke niveau was de mate van kwaliteitszorg
gerelateerd aan contextuele factoren, namelijk complexiteit van respectievelijk de organisatie,
het productieproces, en het productassortiment. Uit de meting op het specifieke niveau bleek
dat effectieve kwaliteitszorgactiviteiten in de bakkerijsector waren: (1) strategiebeheersing,
(2) zelfstandige inkoop van grondstoffen, (3) inkoopbeheersing, (4) productiebeheersing, (5)
beheersing van de uitvoering van productiehandelingen, (6) beheersing van orderontvangst en

Samenvatting
171
(7) distributieplanning. Deze kwaliteitszorgactiviteiten waren effectief vanwege hun relatie
met hogere resultaten van respectievelijk wettelijke en technische beoordeling, een lager
percentage afgekeurde producten, en met een lager percentage klachten over respectievelijk
productkwaliteit en beschikbaarheid. Elke bakkerij bevatte andere contextuele factoren.
Afhankelijk van deze verschillen in context zouden bakkerijen specifieke
kwaliteitszorgactiviteiten moeten selecteren en implementeren die geschikt zijn voor hun
situatie om een optimale productiekwaliteit te verkrijgen.
In hoofdstuk 7 is de relatie tussen de contextuele factoren van bakkerijen en hun niveau van
kwaliteitszorg onderzocht. Contextuele factoren die bestudeerd waren zijn
kwaliteitsborgingsystemen, organisatiegrootte, automatiseringsgraad, en type productgroepen.
Deze bakkerijen met verschillende context verschilden onderling in het niveau van
kwaliteitszorgactiviteiten, namelijk strategiebeheersing, zelfstandige inkoop van grondstoffen,
inkoopbeheersing, productieplanning, en beheersing van de uitvoering van de
productiehandelingen. Bakkerijen met BRC, bakkerijen met meer dan 150 werknemers,
industriële bakkerijen, en banket- en koekbakkerijen voerden een hoger niveau van een aantal
van deze activiteiten. Voedingsmiddelenbedrijven kunnen passende kwaliteitszorgactiviteiten
en kwaliteitsborgingsystemen selecteren voor hun specifieke situatie door IMAQE-Food te
gebruiken om een effectief kwaliteitszorg te verkrijgen.
In hoofdstuk 8 worden de resultaten van dit proefschrift en hun betekenis voor
voedingsmiddelenproductiesystemen bediscussieerd. De mogelijke toepassingen van
IMAQE-Food zijn besproken. Dit proefschrift heeft laten zien dat IMAQE-Food een
betrouwbaar en valide instrument is voor de effectiviteitmeting van kwaliteitszorg in de
bakkerijsector. Het instrument zou moeten dienen als een basis voor andere toepassingen in de
agri-food sector. De inzichten van deze studie ondersteunen voedingsmiddelenbedrijven in de
besluitvorming welk systeem het meest geschikt is voor hun situatie en hoe hun doelen
moeten worden verkregen. Dit kan leiden tot een effectief kwaliteitszorg en een optimale
productiekwaliteit.


Dankwoord
173
Dankwoord
Mijn interesse naar een promotieonderzoek ontstond al tijdens mijn afstudeerperiode. Toch
wilde ik eerst ervaring opdoen bij onderzoeksinstituten en levensmiddelenbedrijven. Vooral
toen ik met productiemedewerkers samenwerkte, zag ik in de praktijk dat het belangrijk is om
de kwaliteit van levensmiddelen te beheersen met zowel technologische als organisatorische
aspecten. Ook merkte ik dat de ene organisatie heel strikt bezig was met het uitvoeren van
kwaliteitssystemen, en dat de andere organisatie het veel belangrijker vond om gestructureerd
te werken volgens een eigen plan in plaats van het volgen van een kwaliteitssysteem. Ik vroeg
me af of een kwaliteitssysteem echt nodig was in bepaalde situaties en of het soms niet zijn
doel voorbij ging. Toen ik de vacature van een AIO naar de kwaliteit van kwaliteitssystemen
tegenkwam, heb ik gelijk gereageerd. Nu, na ruim vijf jaar lezen, schrijven, congressen
bezoeken in o.a. Vaasa, Jeruzalem en Boston, identificeren van prestatie-indicatoren, opzetten
van vragenlijsten, het brengen van vele bezoekjes aan bakkers, en statistische analyses, is het
einde van mijn promotieonderzoek in zicht. Ik heb in deze periode niet alleen
onderzoekservaring opgedaan, maar ook veel over mezelf geleerd. Veel mensen hebben mij
tijdens deze periode bijgestaan. Graag wil ik hen op deze plaats bedanken.
Pieternel Luning, jou wil ik bedanken voor alle begeleiding. Je nam altijd de tijd om mijn
stukken kritisch te lezen en gaf goede suggesties om de puzzelstukjes op zijn plaats te krijgen.
Je hebt me niet alleen gemotiveerd en gestimuleerd om me inhoudelijk te ontwikkelen, maar
ook om mijn capaciteiten verder uit te breiden en te verbeteren. Mijn onderwijsbaan heeft
daaraan ook bijgedragen. Ik heb onze samenwerking altijd als erg plezierig ervaren. Gerrit
Willem Ziggers, bedankt voor de introductie in de methodologie en management. Aan de
hand van onze discussies over concepten en aanpak in je �RIKILT-tijd� heb ik de kapstok van
mijn onderzoek vorm gegeven en heb ik het conceptueel model ontwikkeld. Daarna heb je
meer op afstand mijn publicaties kritisch gelezen, waarbij je vooral het bereiken van het doel
goed in de gaten hield. Wim Jongen, bedankt voor het lezen van alle artikelen en je objectieve
commentaar hierop. Je hebt als promotor altijd de grote lijnen in de gaten gehouden en hebt
me geleerd om mijn eigen lijn te trekken en mijn onderzoek in een breder kader te plaatsen.
Om meer over de bakkerswereld te weten te komen voor de ontwikkeling van de vragenlijst
heb ik contact gezocht met het Nederlands Bakkerij Centrum in Wageningen. Lilian
Briggeman en Maurice Starren, bedankt voor jullie informatie over kwaliteitszorg in de

Dankwoord
174
bakkerijsector en de suggesties voor methoden om bakkerijen te benaderen. Ook wil de
adviseurs bedanken die me specifieke informatie over de bakkerijsector hebben gegeven. Met
deze informatie heb ik de vragenlijst kunnen verbeteren.
Voor het kwalitatieve en het kwantitatieve onderzoek heb ik verschillende bakkerijen
geïnterviewd. Ondanks de hoge werkdruk zagen ze kans om tijd vrij te maken. Ik wil alle
bakkerijen bedanken die aan mijn onderzoek hebben meegewerkt.
De gegevens van de bakkers zijn in een database gebracht en gebruikt voor statistische
analyses. Waldo de Boer, bedankt voor je inbreng van je statistische expertise. Het was een
hele tijd zoeken om een procedure te vinden en om de database eenduidig te gebruiken.
Uiteindelijk hebben we toch een mooie methode ontwikkeld om het instrument te valideren
en de effectiviteit te bepalen. Saskia Burgers, bedankt voor je suggesties voor zowel de opzet
van de database als de verwerking van de interviews. Martijn Fox en Lous Schedler, bedankt
voor jullie hulp met mijn internetpagina. Met jullie hulp konden de bakkers een gedeelte van
het interview via internet invullen, waarna de gegevens vrij makkelijk in de database gebracht
konden worden.
In het kader van hun afstudeervak hebben Josée Diepstraten, Ingrid Nijssen en Anne-
Cathérine Waelkens bijgedragen aan dit proefschrift. Daarnaast heeft Josée ook nog als
student assistent geholpen bij het afnemen van de interviews waarbij ze met een kritische blik
naar de bakkerswereld keek. Bedankt voor jullie werk en de prettige samenwerking. Jullie
enthousiasme heeft mij extra gemotiveerd.
In een kwalitatief onderzoek is onderzocht of het meetinstrument ook toepasbaar is in de
groente- en fruitverwerkende industrie. De experts en bedrijven die hieraan hebben
meegewerkt, wil ik hiervoor bedanken.
Tijdens mijn promotieonderzoek ben ik gedetacheerd geweest op het RIKILT. Ik heb het
cluster Ketenmanagement zien starten en veranderen. Ik wil Marcel en Joop bedanken voor
hun suggesties voor de artikelen. Daarnaast wil ik alle (ex-)collega�s van het RIKILT
bedanken voor de gezelligheid, ondersteuning en faciliteiten. Jeannette, ik ben blij dat je mijn
paranimf wilt zijn.
Omdat ik gedetacheerd was op het RIKILT, bleef mijn contact met de vakgroep vaak beperkt
tot overleg en leerstoelgroeppresentaties. Daarnaast nam ik af en toe deel aan de gezellige
uitjes zoals promoties, borrels, barbecues en de AIO-reis naar Denemarken en Zweden. Ik wil
alle mede-AIO�s en leerstoelgroepgenoten bedanken voor hun gezelligheid.
Naast mijn promotieonderzoek kon ik meerdere keren per week me op sportief vlak uitleven
bij badmintonclub BC de Lobbers. In deze tijd hebben we met het eerste team mooie
Dankwoord
175
resultaten gehaald, waarbij de promotie naar de vierde divisie landelijk en het kampioenschap
van de Nationale Districts Masters in 2002 de hoogtepunten waren. Naast de leuke trainingen,
trainingspartijtjes en wedstrijden, heb ik veel steun gehad van Jochem, Huiberdien, Marian,
Jeroen, Marleen, Ariënne, Mariëlle, Ivo en Henk. Ik wil jullie bedanken voor jullie
gezelligheid en medeleven. Anja, bedankt voor je taalsuggesties. Huiberdien, fijn dat je mijn
paranimf wilt zijn.
Alle familie, vrienden en kennissen, bedankt voor jullie interesse die jullie hebben getoond in
mijn promotieonderzoek.
Remco en Gaby, bedankt voor de gezellige uurtjes. Leuk dat ik de ontwikkeling van Femke
van zo dichtbij kan meemaken.
Lieve pap en mam, jullie wil ik bedanken voor al jullie medeleven en steun door dit
proefschrift aan jullie op te dragen. Jullie bleven mij aanmoedigen en bleven geïnteresseerd in
mijn voor- en tegenslagen. De weekendjes thuis hebben me altijd weer de rust gegeven om er
weer tegenaan te kunnen. Ook jullie kijken nu heel anders tegen bakkers aan en zijn zelfs
expert in kwaliteit van brood geworden. Bedankt voor alles wat ik van jullie heb
meegekregen. Ik hou van jullie!


Curriculum Vitae
177
Curriculum Vitae
Marjolein van der Spiegel werd geboren op 15 juni 1972 in Utrecht. In 1991 behaalde zij het
VWO-diploma aan de Utrechtse Dag- en Avondschool in Utrecht. In datzelfde jaar begon ze
met de studie Levensmiddelentechnologie aan de toenmalige Landbouwuniversiteit in
Wageningen, waarin ze zich specialiseerde in de richting kwaliteitsborging en
levensmiddelenchemie. Als onderdeel van haar studie deed zij afstudeervakken bij de
vakgroep Levensmiddelenchemie- en microbiologie, bij Boering (Campina) in De Meern en
de vakgroep Bedrijfskunde, en liep ze stage bij de afdeling Enzyme Research van Quest
International (Unilever) in Naarden. In 1996 studeerde ze af. Na haar studie werkte ze drie
maanden bij de afdeling Enzyme Research van Quest International in Naarden. Van februari
tot en met mei 1997 deed ze onderzoek bij de afdeling Agrogrondstoffen van TNO Voeding in
Zeist. Vervolgens was ze van juni 1997 tot en met januari 1998 als technoloog werkzaam bij
CPC Benelux (Bestfoods) in Loosdrecht. Van augustus 1999 tot en met januari 2002 was ze
als toegevoegd docent betrokken bij onderwijs in Food Quality Management bij de
leerstoelgroep Productontwerpen en Kwaliteitskunde van Wageningen Universiteit. Van
februari 1998 tot en met maart 2003 was ze aangesteld als Assistent in Opleiding bij de
leerstoelgroep Productontwerpen en Kwaliteitskunde van het Departement Agrotechnologie
en Voedingswetenschappen aan Wageningen Universiteit en was ze gedetacheerd bij het
cluster Ketenmanagement van het RIKILT � Instituut voor Voedselveiligheid in Wageningen.
Dit onderzoek wordt beschreven in dit proefschrift.


List of publications
179
List of publications
Spiegel, van der M. and Ziggers, G.W. (1999). The application of the TQM-concept in Food Supply Chains, pp. 724-736. In: Werther, W. Takala, J. and Sumanth, D.J. (Eds.). Productivity and Quality management Frontiers � VIII. Proceedings of the International Conference on Productivity and Quality Management �99 held in Vaasa, Finland, from 14-16 June 1999. West Yorkshire: MCB University Press. Spiegel, van der M. and Ziggers, G.W. (2000). Development of a Supply Chain Quality Management Model, pp. 147-155. In: Trienekens, J.H. and Zuurbier, P.J.P. (Eds.). Chain Management in Agribusiness and the Food Industry. Proceedings of the Fourth International Conference, held in Wageningen, the Netherlands, from 25-26 May 2000. Wageningen: Wageningen Pers. Spiegel, van der M. Ziggers, G.W Luning, P.A. and Jongen, W.M.F. (2000). Development of a diagnostic instrument for food quality systems: a conceptual model, pp. 193-200. In: Dar-El, E. Notea, A. and Hari, A. (Eds.). Productivity & Quality Management Frontiers � IX. Proceedings of the 9th International Conference on Productivity and Quality Research, held in Jerusalem, Israel, from 25-27 June 2000. Bradford: MCB University Press. Spiegel, van der M. Luning, P.A. Ziggers, G.W and Jongen, W.M.F. (2002). Identification of indicators to measure effectiveness of food quality systems, pp. 563-570. In: Neely, A. and Walters, A. (Eds.) Performance Measurement and Management: Research and Action, held in Boston, USA, from 17-19 July 2002. Cranfield: Centre for Business Performance. Spiegel, van der M. Luning, P.A. Ziggers, G.W and Jongen, W.M.F. (2003). Evaluation of performance measurement instruments on their use for food quality systems. Accepted for publication in Critical Reviews in Food Science and Nutrition (February 2003). Spiegel, van der M. Luning, P.A. Ziggers, G.W and Jongen, W.M.F. (2003). Towards a conceptual model to measure effectiveness of food quality systems. Trends in Food Science and Technology, 14 (10), 424-431. Spiegel, van der M. Luning, P.A. Ziggers, G.W and Jongen, W.M.F. (2003). Development of the instrument IMAQE-Food to measure effectiveness of quality management. Accepted for publication in International Journal of Quality & Reliability Management (accepted at November 2003, publication in 2005, 22 (2)). Spiegel, van der M. Boer, de W.J. Luning, P.A. Ziggers, G.W. and Jongen, W.M.F. (2004). Validation of IMAQE-Food: Instrument for Management Assessment and Quality Effectiveness in the Food sector. Submitted for publication in Journal of Operations Management. Spiegel, van der M. Luning, P.A. Boer, de W.J. Ziggers, G.W and Jongen, W.M.F. (2004). Measuring effectiveness of food quality management in the bakery sector. Submitted for publication in Total Quality Management and Business Excellence. Spiegel, van der M. Luning, P.A. Boer, de W.J. Ziggers, G.W. and Jongen, W.M.F. (2004). How to improve food quality management in the bakery sector. Submitted for publication in NJAS � Wageningen Journal of Life Sciences.

Training and supervision plan
181
Training and supervision plan
Discipline specific activities
- Course �Food Technology and Food Safety, Module Total Quality Assurance and Quality Management�, VLAG, held in Wageningen, the Netherlands, from 6-9 April 1998.
- 3rd International Conference �Chain Management in Agribusiness and the Food Industry�, AKK, held in Wageningen, the Netherlands, from 28-29 May 1998.
- 8th International Conference on Productivity and Quality Research, ISPQR, held in Vaasa, Finland, from 14-16 June 1999.
- 4th International Conference �Chain Management in Agribusiness and the Food Industry�, AKK, held in Wageningen, the Netherlands, from 25-26 May 2000.
- 9th International Conference on Productivity and Quality Research, ISPQR, held in Jerusalem, Israel, from 25-27 June 2000.
- Symposium �Nieuwe kansen voor food innovation�, PAVO, held in Wageningen, the Netherlands, at 14 September 2000.
- Conference on BRC �Internationale ontwikkelingen rond BRC�, VMT and ISA, held in Bussum, the Netherlands, at 14 February 2001.
- Workshop �Wetenschapsdag, Thema Voeding�, Wageningen University and Research Centre, held in Wageningen, the Netherlands, at 6 October 2001.
- Conference on Traceability �Traceerbaarheid en voedselveiligheid�, VMT and RIKILT, held in Maarssen, the Netherlands, at 27 November 2001.
- 3rd International Conference on Performance Measurement and Management �Performance Measurement and Management: Research and Action�, PMA, held in Boston, USA, from 17-19 July 2002.
- Workshop �Management and Control of Food Safety�, Tempus, held in Banya Luka, Bosnia-Herzegovina, at 20 October 2003.
General courses
- Methodology of research and design, NOBO, from 14 December 1998 to 16 March 1999. - Acquisition of research projects, Verstrate and RIKILT, from 26 March to 24 June 1999. - English for research trainees, Wageningen University, from 7 October 1999 to 4 February
2000. - Personal charisma and stressing the distinctive features, KLV, from 8 May to 5 June 2000. PhD student week
PhD student week, VLAG, held in Bilthoven, the Netherlands, from 23-27 November 1998, including courses on teamwork and project-based thinking and working. Optionals
- Preparation of research proposal. - Food Science Study Tour in Denmark and Sweden, from 26 March to 2 April 2000,
including Symposium �Technical Perspectives of Food Science� held in Lund, Sweden, at 29 March 2000.
- Presentations and meetings with respect to food safety, product design and quality management, and supply chains.

The study described in this thesis was carried out at Wageningen University and Research
Centre in the Netherlands; Product Design and Quality Management Group of Wageningen
University in co-operation with Supply Chain Management Group of RIKILT � Institute of
Food Safety. The thesis is result of independent research by Ir. M. van der Spiegel, under
supervision of Prof. Dr. W.M.F. Jongen, Dr. Ir. P.A. Luning and Dr. Ir. G.W. Ziggers.
Biometris Group of Plant Research International supported statistical analyses. The work was
part of the research programme of the Graduate School VLAG (Food Technology, Nutrition &
Health Sciences). The project was financially supported by the Netherlands Ministry of
Agriculture Nature Management and Fisheries (LNV) and LEI (Agricultural Economics
Research Institute).
Cover: Conceptual model to measure effectiveness of food quality systems.
Background: non-industrial bakery. Back: raw materials, mixing, rising, filled
bread. Designed by Hans and Marjolein van der Spiegel
Printing: Ponsen & Looijen, Wageningen