measuring geopolitical risk - its - boston college · measuring geopolitical risk ... the...
TRANSCRIPT
Measuring Geopolitical Risk∗
Dario Caldara† Matteo Iacoviello‡
January 10, 2018
Abstract
We present a monthly indicator of geopolitical risk based on a tally of newspaper articles
covering geopolitical tensions, and examine its evolution and effects since 1985. The geopolit-
ical risk (GPR) index spikes around the Gulf War, after 9/11, during the 2003 Iraq invasion,
during the 2014 Russia-Ukraine crisis, and after the Paris terrorist attacks. High geopolitical
risk leads to a decline in real activity, lower stock returns, and movements in capital flows away
from emerging economies and towards advanced economies. When we decompose the index
into threats and acts components, the adverse effects of geopolitical risk are mostly driven by
the threat of adverse geopolitical events. Extending our index back to 1900, geopolitical risk
rose dramatically during the World War I and World War II, was elevated in the early 1980s,
and has drifted upward since the beginning of the 21st century.
KEYWORDS: Geopolitical Risk; Economic Uncertainty; War; Terrorism; Business Cycles.
JEL CLASSIFICATION: C1. D80. E32. H56.
Latest version at https://www2.bc.edu/matteo-iacoviello/gpr_files/GPR_PAPER.pdf
∗We thank Alessandra Bonfiglioli, Nick Bloom, Nathan Converse, Ricardo Correa, Chris Erceg, Colin Flint, Mas-simo Morelli, Bo Sun and seminar participants at the Federal Reserve Board, the Stanford Institute for TheoreticalEconomics, the Chengdu International Macro-Finance Conference, the CEF Conference in New York, the CentralBank of Chile, Pontificia Universidad Catolica de Chile, Bank of Italy, University of Cambridge, Bocconi University,DIW Berlin, and LSE. Joshua Herman, Lucas Husted, Andrew Kane, and Aaron Markiewitz provided outstandingresearch assistance. All errors and omissions are our own responsibility. The views expressed in this paper are solelythe responsibility of the authors and should not be interpreted as reflecting the views of the Board of Governors ofthe Federal Reserve System or of anyone else associated with the Federal Reserve System.†Federal Reserve Board of Governors. Email: [email protected]‡Federal Reserve Board of Governors. Email: [email protected]
1 Introduction
Entrepreneurs, market participants, and central bank officials view geopolitical risks as key de-
terminants of investment decisions and stock market dynamics. In a Gallup 2017 survey of more
than 1,000 investors, 75 percent of respondents expressed worries about the economic impact of
the various military and diplomatic conflicts happening around the world, ranking geopolitical risk
ahead of political and economic uncertainty.1 Carney (2016) includes geopolitical risk—together
with economic and policy uncertainty—among an ‘uncertainty trinity’ that could have significant
adverse economic effects. More recently, the European Central Bank, in its April 2017 Economic
Bulletin, and the International Monetary Fund, in the October 2017 WEO, highlight geopolitical
uncertainties as a salient risk to the economic outlook.
However, the importance of geopolitical risks in shaping the macroeconomic and financial cycles
has not been the subject of systematic empirical analysis. The main limitation has been the lack
of an indicator of geopolitical risk that is consistent over time, and that measures in real time
geopolitical risk as perceived by the press, the public, global investors, and policy-makers. This is the
perspective we adopt here. Using newspaper records, we construct a monthly index of geopolitical
risk (GPR) and examine its evolution and determinants since 1985. We then study the economic
effects of geopolitical risks, and find that higher geopolitical risk depresses economic activity, lowers
stock returns, and leads to flows of capital from emerging economies towards advanced economies.
The construction of the GPR index involves three main steps: definition, measurement, and
audit.2 In the definition step, we follow one common usage of the term “geopolitics,” and refer to
it as the practice of states and organizations to control and compete for territory. In particular,
we want to identify geopolitical events in which power struggles over territories cannot be resolved
peacefully. Accordingly, we define geopolitical risk as the risk associated with wars, terrorist acts,
and tensions between states that affect the normal and peaceful course of international relations.
Geopolitical risk captures both the risk that these events materialize, and the new risks associated
with an escalation of existing events.
In the measurement step, we draw on the methodology pioneered by Saiz and Simonsohn (2013)
and Baker, Bloom, and Davis (2016), and construct the GPR index with an algorithm that counts
the frequency of articles related to geopolitical risks in leading international newspapers published
in the United States, the United Kingdom, and Canada. These newspapers—which include The
New York Times, the Financial Times, and The Wall Street Journal—cover geopolitical events that
1 See http://www.businesswire.com/news/home/20170613005348/en/.2 The index is updated monthly and is available at https://www2.bc.edu/matteo-iacoviello/gpr.htm.
2
are of global interest, which often implies U.S. involvement. Thus, the GPR index can be viewed
either as a measure of global geopolitical risks that are relevant for major companies, investors, and
policy-makers, or as a measure of risks that are mostly relevant from a North-American and British
perspective.3
We plot the resulting benchmark index from 1985 to 2016 in Figure 1. The three largest spikes
are recorded during the Gulf War, after 9/11, and during the 2003 invasion of Iraq.4 More recently,
the index spikes during the Ukraine/Russia crisis and after the Paris terrorist attacks. We also
construct an historical version of the index—dating back to 1899 and plotted in Figure 2—which
reaches its highest values at the beginning of World War I and World War II, as well as at the onset
of the U.S. involvement in them.
In the audit step, we assess whether the GPR index is an accurate measure of underlying
geopolitical risks. First, we develop a formal audit process based on a human reading of more than
16,000 newspaper articles. To quantify type I and type II errors, we audit both articles that comprise
the GPR index, and articles that we sample from a broader set likely mentioning geopolitical events.
The audit provides an important input to refine the search terms used by our algorithm, and
allows us to construct a human-generated GPR index, which correlates remarkably well with the
benchmark index. Second, we compare our index to various metrics of wars and terrorism intensity
and to popular measures of economic uncertainty and financial volatility. Finally, we show that
potential media bias in the coverage of geopolitical events is not a driver of fluctuations in our index.
We then turn our analysis to the role that geopolitical risks play for the macroeconomy. Using
vector autoregressive (VAR) models estimated on U.S. data, we find that an increase in geopolitical
risk induces persistent declines in industrial production, employment, and international trade, and
that both economic policy uncertainty and consumer confidence enhance the transmission of geopo-
litical risk shocks. We also document that stock returns experience a short-lived but significant
drop in response to higher geopolitical risk. The stock market response varies substantially across
industries, with the defense sector experiencing positive excess returns, and with sectors exposed
to the broader economy—for instance steelworks and mining—experiencing negative returns.
An important question is whether the economic effects of higher geopolitical risk are due to
heightened threats of adverse events or to their realization. To answer this question, we construct
two subindexes that, together with some exclusion restrictions discussed in the paper, allow us to
3 Hassan, Hollander, Tahoun, and van Lent (2016) construct a measure of firm-specific political risk using tran-scripts from quarterly earnings conference calls.
4 Throughout the paper, we refer to historical events by adopting the naming convention followed by the Wikipediaentry for that event.
3
separate shocks to geopolitical acts from shocks to geopolitical threats. We find that the realization
of adverse geopolitical events leads to the resolution of uncertainty and produces economically small
effects, while shocks to geopolitical threats lead to a protracted rise in uncertainty and induce a
persistent decline in real activity. These findings lend support to theoretical models where agents
form expectations using a worst-case probability—as, for instance, in Ilut and Schneider (2014)—and
to models where elevated levels of uncertainty cause a decline in employment and investment—as
in Dixit and Pindyck (1994) and Bloom, Bond, and Van Reenen (2007).5
When we expand the analysis to international variables, we find that higher geopolitical risks
lead to a decline in activity among advanced economies. Moreover, using monthly stock market
data for a panel of 17 countries, we document that geopolitical risks depress stock prices. Last,
we show that geopolitical tensions determine significant movements in international capital flows:
following higher geopolitical risk, investors pull capital out of emerging economies and move towards
safe havens, including the United States.
We are not the first to attempt to measure geopolitical risk. Indeed, many companies publish
or market various indicators of political and geopolitical uncertainty.6 However, the construction of
our GPR index overcomes the various shortcomings of existing indicators that make them poorly
suited for empirical analysis. First, many indexes either do not define geopolitical risk or use a
wide-ranging definition that includes very different events, ranging from wars to major economic
crises to climate change. Accordingly, it is unclear what these indexes measure. Second, existing
indexes are extremely hard to replicate. Indexes constructed by private companies are often not
publicly available, are constructed subjectively, and come with a less-than-transparent methodology.
By contrast, our index can be both replicated and audited, as both our algorithm and audit guide
are publicly available. Third, many indexes exhibit very little variability and are available only for
a few years. Many of them are qualitative indicators of whether countries are politically stable, and
are reported using color-coded maps or integer numbers ranging from one to five.7
This paper complements the literature that studies the measurement and effects of macroeco-
nomic uncertainty in two ways. First, many proxies for macroeconomic uncertainty increase during
5 Drautzburg, Fernandez-Villaverde, and Guerron-Quintana (2017) document significant changes in the capitalshare after large political events, and argue—using a modified version of the neoclassical growth model—that bar-gaining shocks account for one third of aggregate fluctuations.
6 For example, the first 20 entries of a Google search of the terms “Geopolitical Risk” link to the followingcompanies providing businesses with geopolitical-related intelligence: Marsh-McLennan, Control Risks Online, ZurichInsurance, Cambridge Econometrics, U.S. Energy Stream, Aon plc, Verisk Maplecroft, CSO Online, Euler Hermes,Risk Advisory, and Strategic Risk.
7 A notable example, the Doomsday Clock, measures the countdown to a possible global catastrophe, with fewerminutes to midnight measuring higher risk, but the value of this index has changed only six times in the past 20years. The Bulletin of the Atomic Scientists webpage has more details about the Doomsday Clock.
4
recessions and financial crises.8 Whether this empirical regularity implies that uncertainty is an
endogenous response to adverse macroeconomic and financial conditions or one of their drivers re-
mains an open question.9 An advantage of our index relative to the existing uncertainty proxies is
that it singles out episodes of geopolitical tensions that, for most countries and in particular for the
United States, are largely independent of business fluctuations within a short period of time, such
as one month. In fact, our index does not systematically spike in recessions or during the Global
Financial Crisis, but rises—as many uncertainty proxies do—during the two Gulf wars and 9/11.
Thus, we do not require strong identification assumptions to support the finding that geopolitical
risk has recessionary effects. Second, we provide a first attempt within this literature to isolate
pure movements in risk—that is, movements in our GPR index during periods when the underlying
threat does not materialize. We are able to do so because we can accurately time actual geopolitical
events and control for their direct effect.
Our work is also related to the literature that studies the implications of disaster risks (Barro,
2006, and Gourio, 2008). In particular, Berkman, Jacobsen, and Lee (2011) measure disaster
risk by counting the number of international political crises. Using data starting in 1919, they
find that disaster risk depresses stock returns. Compared to this study, we find a larger effect
of disaster risk on stock returns. The effect is especially large after 1985 and is associated with
threats of geopolitical events rather than their realization. Our analysis is also complementary
to several papers that measure the economic consequences of wars, terrorist attacks, and other
forms of collective violence, such as Blomberg, Hess, and Orphanides (2004), Tavares (2004), Glick
and Taylor (2010), and, more recently, Moretti, Steinwender, and Van Reenen (2014) and Aghion,
Jaravel, Persson, and Rouzet (2017).
Section 2 describes the construction of the GPR index. Section 3 discusses what our index
measures, presents a daily version of the index, and compares the GPR index to alternative proxies
for geopolitical risk and macroeconomic uncertainty. Section 4 studies the effects of changes in
geopolitical risk on the U.S. economy. Section 5 estimates the international propagation of GPR
shocks—on economic activity, capital flows and stock returns—. Section 6 concludes.
8 See the proxies used and constructed by, among many, Bloom (2009), Bachmann, Elstner, and Sims (2013),Gilchrist, Sim, and Zakrajek (2014), Jurado, Ludvigson, and Ng (2015) and Scotti (2016).
9 Ludvigson, Ma, and Ng (2015) use a structural VAR model identified with external information and find atwo-way relationship between uncertainty and the business cycle. Caldara, Fuentes-Albero, Gilchrist, and Zakrajek(2016) also use a structural VAR and document that macroeconomic uncertainty does endogenously respond totightening in financial conditions.
5
2 Construction of the Geopolitical Risk Index
The construction of the GPR index involves three main steps: definition, measurement, and audit.
We first describe the definition of geopolitics and geopolitical risk that we adopt in our paper. We
then discuss how we construct the index and describe its key features. Finally, we provide a detailed
review of the audit process.
2.1 Definition: Geopolitics and Geopolitical Risk
Geopolitics is a term that encompasses multiple definitions, and historically has been used to de-
scribe the practice of states to control and compete for territory.10 However, in recent decades,
power struggles and other events involving a diverse set of agents—including corporations, non-
governmental organizations, rebel groups, and political parties—have also been classified as part
of geopolitics. For this reason, the current usage of the word “geopolitics” covers a diverse set of
events with a wide range of causes and consequences, from terrorist attacks to climate change, from
Brexit to the Global Financial Crisis.
In defining geopolitical risk, we want to identify situations in which the power struggles of
agents over territories cannot be resolved peacefully and democratically. Accordingly, we define
geopolitical risk as the risk associated with wars, terrorist acts, and tensions between states that
affect the normal and peaceful course of international relations. Geopolitical risk captures both the
risk that these events materialize, and the new risks associated with an escalation of existing events.
Our definition closely follows the historical use of the term geopolitics and—in line with recent
assessments of modern international relations among states—includes terrorism. At least since
9/11, terrorism has come to dominate the practice and the language of geopolitics. Even before
9/11, terrorist acts have generated political tensions among states, and, in some instances, have led
to full-fledged wars. This practice is not confined to Al-Qaeda and ISIS but dates back to every
episode in which acts of violence were carried out by political organizations to bolster religious,
economic, or revolutionary objectives.
It is worth stressing that this definition of geopolitical risk is not exhaustive. That is, we cannot
uniquely rely on this definition to classify events and risks as being geopolitical or not, and some
judgment both in the construction of the index and in the auditing process is required. As an
example, political tensions that are initially confined within nations’ borders and not aimed at af-
10 See for instance Flint (2016). The Austro-Hungarian historian Emil Reich was one of the earliest scholars topropose a similar definition and is credited with first using the word “geopolitics” in the early 20th century (GoGwilt,2000).
6
fecting the normal course of international relations could potentially escalate and create geopolitical
instability. Occasionally, the classification of these events is not clear-cut. For instance, we view
the coup attempted in Turkey in July 2016 as falling within our definition. While the coup ended
up having mostly domestic consequences, there were significant spillovers to the Middle East and
to the fight against ISIS in Syria and Iraq. By contrast, we do not view Brexit as falling within
our definition, as it was the outcome of a democratic referendum. We match the need for judgment
with high standards of replicability, robustness, and transparency in the construction of the index
and in the audit process.
2.2 Measurement
We construct the GPR index by counting the number of occurrences in leading English-language
newspapers of articles discussing the geopolitical events and risks described by our definition. In
particular, we construct a monthly index—starting in 1985—by running automated text-searches
of the electronic archives of 11 newspapers: The Boston Globe, the Chicago Tribune, The Daily
Telegraph, the Financial Times, The Globe and Mail, The Guardian, the Los Angeles Times, The
New York Times, The Times, The Wall Street Journal, and the Washington Post. We also construct
a long-span historical index (GPRH) dating back to 1900. For the historical index, we restrict the
newspapers’ coverage to the only three journals for which we have electronic access to all articles
from 1900—namely The New York Times, the Chicago Tribune, and the Washington Post. The
index reflects, in each month, the number of articles discussing rising geopolitical risks divided by
the total number of published articles.11 The index is normalized to average a value of 100 in the
2000-09 decade, so that a reading of 200, for instance, indicates that newspaper mentions of rising
geopolitical risk in that month were twice as frequent as they were during the 2000s.12
We search for articles containing references to any of the six categories of words reported in
Table 1. As described in the next section, we arrive at this set of words after a pilot audit of news-
paper articles mentioning geopolitical tensions and after isolating the most common unigrams and
11 Our databases are ProQuest Historical Newspapers and ProQuest Newsstream.12 A monthly reading of 100 corresponds to about 350 articles per month containing terms related to geopolitical
risk. The companion dataset reports the total number of articles each month. The average number of articles isaround 70,000 over the sample. For one representative newspaper, this corresponds to about 200 articles per day.About one in 250 articles mentions, on average, terms related to geopolitical risk. As a comparison benchmark, onein 500 articles mentions the Beatles, and one in 300 articles mentions the Federal Reserve.
7
bigrams in geopolitics textbooks.13 In doing so, we verify that the defining elements of geopolitics
concern territory, countries, nations, and leadership, and that defining elements of geopolitical risk
center around the risk of wars and terrorism. Building on this characterization, we construct a set
of search terms that give us an index that is robust, sensible, and easily interpretable.
As shown in Table 1, the first four categories of words are related to geopolitical threats and
tensions, while the last two categories are related to geopolitical events and acts.14 Group 1 includes
words that explicitly mention geopolitical risk, as well as words describing military-related tensions
involving large regions of the world and the United States. The associated articles tend to describe
geopolitical risks with a direct intervention of the United States (e.g. the Gulf War and the Iraq
War), but also regional tensions among two or more countries with a U.S. diplomatic involvement.
Group 2 includes words describing nuclear tensions. Groups 3 and 4 include words that describe war
threats and terrorist threats, respectively. Lastly, groups 5 and 6 aim at capturing press coverage of
actual geopolitical events as opposed to just risks. Importantly, the words included in these groups
are meant to capture negative geopolitical events—for instance the start of a war—as opposed to
positive ones—for instance the end of a war or peace talks.
Searching directly for geopolitical events in groups 5 and 6 plays an important role in our
analysis, for two reasons. First, adverse geopolitical events often trigger an increase in geopolitical
risk. For instance, a terrorist attack may increase the risk of future attacks. Hence, searching
directly for events rather than risk can help obtain a more precise identification of the timing of
some risk-inducing shocks. Second, in assessing the impact of geopolitical risk, we want to control
for the direct impact that the event itself might have. For this reason, as described below, we create
two subindexes that measure geopolitical threats and acts separately.
Figure 1 presents the GPR index. The index is characterized by several spikes corresponding to
key geopolitical events. The first spike is recorded in April 1986 and corresponds to the terrorist
escalation that led to the U.S. bombing of Libya. The second spike happens around the Iraq invasion
13 For instance, the book Introduction to Geopolitics (Flint, 2016) contains 48,759 bigrams, of which the mostcommon ones are “geopolit code,” “world leader,” “unit[ed] states,” “world leadership,” “war [on] terror,” “modelskimodel,” “geopolit agent,” “cold war,” “soviet union,” “world war,” and “foreign polic[y].” The book The GeopoliticsReader (Dalby, Routledge, and Tuathail, 2003), which is a compendium of 39 geopolitics essays written by differentauthors, contains 91,210 bigrams, of which the most common ones are “unit[ed] states,” “cold war,” “foreign polic[y],”“nation secur[ity],” “world war,” “world order,” “nation[al] state,” “gulf war,” “war II,” and “nuclear weapon.”
14 We refrain from including proper nouns in the search words, except for “United States” and the names of thefour largest continents. We do so because we want to guard our search against the possibility that terms related togeopolitical risks may cease to be such for a limited period of time. For instance, although the name “Adolf Hitler”may have correctly identified geopolitical risks in the 1930s, it is far more often associated today with books, moviesand historical accounts of World War II, and it is best left out of the searches. The same is often true of manypolitical leaders or figures once they die, or are jailed, or retire from office.
8
of Kuwait and the subsequent Gulf War. The index spikes again at the beginning of 1998, during
a period of escalating tensions between the United States and Iraq. It then stays low until 9/11.
The index reaches its maximum during the 2003 invasion of Iraq. Since 2003, the index rises in
correspondence with major terrorist events in Europe, like the March 2004 Madrid bombing, the
July 2005 London bombing, and the November 2015 Paris terror attacks. The index also rises in
2014, during the Russian annexation of the Crimea peninsula and the escalation of ISIS military
operations in Iraq and Syria.
Figure A.1 in the Appendix elaborates further on the contribution of each of components of the
index, one topic at a time. Nuclear threats are disproportionately more important prior to the end
of the Cold War and gradually subside after 1989. By contrast, terror threats trend higher over the
sample period, spiking after 9/11, and remaining at elevated levels ever since. While “war threats”
and “war acts” appear to move somewhat in sync throughout the sample, mentions of “terrorist
threats” seem to increase proportionally relative to mentions of actual terrorist acts since 9/11.
Additionally, Figure A.2 in the Appendix shows the search results using one newspaper at a time,
highlighting a high degree of correlation across the newspaper-specific indexes.
Since spikes in risk often coincide with the realization of big events, the GPR index—as well
as many other uncertainty indexes—captures a convolution of shocks to first- and higher-order
moments. We attempt to isolate the effects of pure geopolitical risk by constructing two indexes:
the geopolitical threats index (GPT) and the geopolitical acts (GPA) index. The GPT index is
constructed by searching articles that include words in groups 1 to 4—the groups directly mention-
ing risks—while the GPA index searches only for groups 5 and 6—the groups directly mentioning
adverse events. Figure 3 plots the two indexes. The GPT and GPA indexes display a high degree of
comovement, with a correlation of about 0.6. In particular, nearly all spikes in the GPA index coin-
cide with spikes in the GPT index. Nonetheless, there is also a non-trivial amount of independent
variation. In particular, the GPT index rises in the months prior to major events—for instance the
Gulf War and the Iraq War—and in some cases remains elevated after the event has ended. We will
exploit this independent variation between the GPA and GPT indexes to disentangle the effects of
geopolitical acts and threats in the VAR analysis presented in Section 4.
Lastly, Figure 2 displays GPRH, the monthly long-span index. The long-span index closely
mimics the benchmark index for the period in which the coverage overlaps, with a monthly corre-
lation since 1985 of 0.95.15 As for the baseline GPR index, every major spike in the index can be
15 To capture shifts in the usage of particular words over time, we add to the search category “War Threats”: {(warOR military) N/3 (crisis OR uncertain*)}, and {(“war effort*” OR “military effort*”) AND (risk* OR threat* ORfear*)}. We add to the search category “War Acts”: {“state of war”}, and {“declaration of war”}.
9
associated with episodes of rising geopolitical tensions. The index stays elevated during World War
I and World War II and peaks at the onset of both. Figure A.3 in the Appendix further illustrates
how the subcomponents of historical geopolitical risk have evolved over the past 115 years. Early
in the sample, the index rises and stays high during World War I and World War II, and phrases
directly related to the conflict itself dominate the index. The index stays at high levels between
the 1950s and the 1980s—a time when the threat of a nuclear war and rising geopolitical tensions
between countries were more prevalent than wars themselves. Since the 2000s, terrorist events have
come to dominate the index, alongside rising bilateral tensions among countries. Indeed, the index
reaches the highest values at the start of World War I and World War II, and around 9/11.
2.3 Audit
The construction of any index based on automated text-searches raises concerns about accuracy
and bias. We explain how we address these concerns by describing our audit process. To preview
the results, human reading of 16, 000 newspapers articles as well as comparison to external proxies
confirms that the index accurately captures movements in geopolitical risk.
The sample of newspaper articles used to construct the index—denoted by U—contains about
70, 000 news articles, on average, each month. After an initial reading of a few hundred articles
selected at random from U , we concluded that the largest payoff to an audit study involved selecting
and evaluating articles that directly mentioned words such as geopolitics, war, or terrorism. In fact,
articles that mention these words cover a diverse set of events, from rising geopolitical risks, to
obituaries of famous generals, to war anniversaries and war movies, to declining geopolitical risks.
Accordingly, the audit was conducted from a subset of U—denoted by E—consisting of articles that
contain any of the following words: geopolitics, war, military, terrorism/t. This choice of words
reflects our definition of geopolitics and geopolitical risks, and is also supported by an analysis of
the most common unigrams found in books on the subject of geopolitics.16 The sample E contains
about 8, 000 articles per month, about 15 percent of the articles in U .
Pilot Audit
We conducted the pilot audit as follows. We randomly selected 50 months in the period from
1985:M1 to 2016:M12, and for each month, we randomly selected 50 articles from the sample E .
16 For instance, the most common word roots in Flint (2016) textbook Introduction to Geopolitics are “geopolit,”“war,” “nation,” “terror,” “polit,” and “countri,” and “global.” Similarly, the most common word roots in SamuelHuntington’s classic book on the “Clash of Civilizations” (Huntington, 1997) are “civil,” “war,” “cultur,” “polit,”“power,” “econom,” “societi,” and “conflict.”
10
Together with a team of research assistants, we read these 50 × 50 = 2, 500 articles. We assigned
to the set E1 the articles mentioning high geopolitical tensions or adverse geopolitical events, and
assigned to the set E0 articles not highlighting any recent risks or recent adverse events. We found
that slightly less than half of the articles in E discussed high or rising geopolitical risks. Additionally,
the error rate—the number of articles in the set E0 divided by the number of articles in the set
E—was very volatile, with a monthly standard deviation of 17 percent, thus indicating that a very
broad search is likely to be contaminated by a high noise-to-signal ratio. For instance, the error rate
averages around 80 percent in the months after the end of the Gulf War, when newspaper coverage
of the Gulf War is very extensive, but a substantial majority of articles cite declining tensions,
peace initiatives after Saddam Hussein’s withdrawal from Kuwait, and the importance of the UN
mandate to maintain peace and stability in the region.
The pilot audit served two purposes. The first purpose was to identify words that would allow
an automated search algorithm to differentiate between articles belonging to E1 and those belonging
to E0. In particular, we used text analytics techniques on the articles belonging to either set in
order to identify the bi-grams that appeared more frequently in articles belonging to the set E1 and
E0. Although our index includes words and phrases of various length as well as proximity searches,
uni-grams were not very informative, and tri-grams were too uncommon to derive or to guide our
search criteria.17 Using Bayes’ rule, we computed the odds ratio of an article belonging to E1 instead
of E0 given that it contains each bi-gram. We used the list of bi-grams with the highest odds ratio as
an input to choose the group of search words that are listed in Table 1. We also found the bi-grams
with the highest odds ratio of belonging to the set E0. Most articles in this set are written at times
of anniversaries, such as the centenary of World War I in 2014; upon death of historical figures;
at the time of books’ publication and movies’ releases,; and other art events that are connected to
wars, terrorism, and other episodes of important historical relevance. We used this list of bi-grams
to choose words that articles should not contain in order to be included in the index.18
The second purpose of the pilot audit was to create a detailed audit guide to be used during the
full scale audits, discussed next.19 To develop the audit guide and to identify coding difficulties,
we assigned 40 percent of the articles in the pilot sample to multiple auditors. Following the lead
17 Prior to selecting bi-grams, we filter out stop words and proper names, including names of countries, cities,and political organizations. For each bi-gram, we can calculate the probability that the bi-gram signals an articlebelonging to E1 using Bayes’ rule.
18 The set of words that are highly likely to signal false positives are “civil war,” “human rights,” “war” in closeproximity of the word “end” (end N/2 war), “air force,” “movie,” “film,” “museum,” “anniversary,” “memorial” and“art.”
19 The audit guide is available at https://www2.bc.edu/matteo-iacoviello/gpr_files/audit_guidelines_
GPR.pptx.
11
of Baker, Bloom, and Davis (2016), we met with the auditors on a weekly basis over the course
of more than two years, we discussed with them criteria that could lead to an improvement of the
audit process, and we reviewed with them “hard calls” and coding discrepancies. We continued
this process until coding discrepancies across auditors were reduced to 15 percent or less of the
articles sampled, a threshold that we consider reasonable given the vast range of articles and topics
included in our index.
Full-Scale Audit
The full-scale audit involved the construction of a human-generated GPR index and the evaluation
of the computer-generated GPR index. To construct a human-generated GPR index, we randomly
sampled 6,125 articles from E—on average about 50 articles per quarter. For each quarter, we
calculated the fraction of articles assigned to E1, multiplied this fraction by the quarterly rate
E/U , and normalized the resulting index to 100 over the 2000-09 period. Figure 4 shows that our
computer index lines up well with an index that could be constructed by humans. The correlation
between the two series is 0.837, a value that is remarkably high when one takes into account sampling
uncertainty. Figure A.4 shows a high correlation—0.86 when we aggregate the data at an annual
frequency, and 0.78 at a quarterly frequency—when we repeat the same exercise using historical
data, and a random sample of 7,416 articles, from 1899 through 2017.
To evaluate the computer-generated GPR index, we randomly sampled 50 articles from 50 differ-
ent months from the set of articles selected by the automated text-search algorithm, and classified
them as either discussing high or rising geopolitical tensions or not. About 87 percent of the ar-
ticles that constitute the computer-generated GPR mention high or rising geopolitical risks. For
the 50 months that we sample, the correlation between the human-audited GPR index and the
benchmark GPR index is 0.98. The error rate—the fraction of articles that do not discuss ris-
ing geopolitical risks—is essentially uncorrelated with the GPR index itself as well as with other
macroeconomic variables.
Finally, we construct three variants of the GPR index based on a broader and narrower set
of articles, as well as on a very parsimonious choice of search words. These indexes, which we
name broad, narrow, and simple, are discussed in Appendix A.2 and plotted in Figure A.5. As the
figure shows, the index is robust to the inclusion and exclusion of specific phrases and synonyms.
In addition, because we study the economic effects of higher geopolitical risk, we need to guard
against the possibility that words related to geopolitical tensions are more likely to be mechanically
used during recessions, even if recessions are caused by geopolitical tensions. Figure A.6 shows
12
a version of the GPR index that excludes the search terms “economy” OR “stock market*” OR
“financial market*” OR “stock price*.” Although 19 percent of articles in GPR are filtered out,
this alternative index is virtually indistinguishable from the benchmark index, with a correlation of
0.989.
One way of summarizing the outcome of our audit process is to link it to the work of Saiz
and Simonsohn (2013). These authors list a number of conditions that must hold to obtain useful
document frequency-based proxies for variables and concepts that are otherwise elusive to measure,
such as geopolitical risk. As described in Appendix A.3, our index satisfies these conditions with
flying colors. Accordingly, we can reasonably argue that the GPR index is a robust and reliable
measure of geopolitical risk.
3 Understanding the GPR Index
In this section, we first discuss the nature of the risks captured by the GPR index, and whether
biases in media coverage of some events can distort our measure. We then compare the GPR index
to alternative proxies for geopolitical risks. Finally, we relate the GPR index to popular measures
of economic uncertainty.
3.1 Risks Captured by the Index
Exposure to geopolitical risk varies both geographically and by sector of the economy. Our index
captures geopolitical risks as perceived and chronicled by the press in English-speaking countries,
particularly in the United States: to construct the index, we use six U.S., four British, and one
Canadian newspaper. Moreover, one of the search categories measures regional tensions with some
form of U.S. involvement. Thus, a narrow interpretation of the index is that it captures geopolitical
risks as perceived in the United States, the United Kingdom, and Canada. At the same time,
we search newspapers that have wide geographical coverage and routinely report on international
events. Furthermore, geopolitical events that involve these countries and their interests abroad—in
particular those of the United States—have global implications. Hence, a broader interpretation is
that the index is also a good proxy for global geopolitical risks that are relevant for major financial
investors, corporations, and policy-makers.
Figure 5 provides a window into the type of events captured by our index by presenting
the daily GPR—available at https://www2.bc.edu/matteo-iacoviello/gpr.htm—alongside the
main geopolitical risks covered by the press on days where the index either reached high levels, or
13
rose significantly. The daily GPR is obviously noisier than its monthly counterpart. Even so, it
nicely illustrates three frequent scenarios in which the daily unfolding of geopolitical tensions causes
elevated levels of the GPR at a monthly level. Figure A.12 in the Appendix provides additional
detail, using screenshots of the newspapers’ front pages.
In the first recurring scenario, a protracted build-up in tensions leads to a defining event causing
a big spike in the index, as in the case of the Gulf War—see panels (a) and (b) of Figure A.12. In
the second scenario, one climactic event causes a large spike in daily geopolitical risk and is followed
by readings that are persistently higher than the average, as in the aftermath of the 9/11 terrorist
attacks—see panels (c) and (d) of Figure A.12. In the third scenario, slow-moving geopolitical
tensions persistently remain in the news cycle, averaging out to elevated values of the monthly
GPR. Examples include the Syrian Civil War, the 2014 tensions between Ukraine and Russia, and
the 2017 tensions involving North Korea—see panels (e) and (f) of Figure A.12—featuring several
days where the GPR is high, but no single instance where the index reaches extraordinarily large
values.
In all these instances, spikes in the daily index correctly point to when particular events happened
or reached a climax, thus providing robust evidence on the large informative content of the index
even at frequencies such as days or weeks. Such frequencies can be useful to researchers wishing to
study the financial market effects of geopolitical tensions.
3.2 Media Attention and Political Slant
The use of press coverage has the potential to induce fluctuations in the GPR index even if the
underlying geopolitical risk factors remain constant, due to either changes in geopolitical-related
risk aversion of the public or to state-dependent bias in news coverage. For example, the high
levels of the index in the years following 9/11 may reflect public fear towards geopolitical tensions
more than actual risk. Additionally, geopolitical issues may receive more or less coverage in the
news depending on the attention of the press to other newsworthy events. Finally, the use of war
and terrorism-related words may reflect the issues that a newspaper likes to report on, rather than
objective geopolitical risks.
Figure 6 allays some of these concerns about measurement error and bias in the construction
of our index. In the top panel, we show that unpredictable newsworthy events do not crowd out
media coverage of geopolitical risk. We do so by highlighting the time-series comovement between
the GPR index and an alternative index constructed using media mentions of words related to
natural disasters. The largest spikes in the “Natural Disasters Index” correspond to well-known
14
events that are hard to predict and that attract significant media attention.20 On average, one in
70 newspaper articles mentions words related to natural disasters, a ratio that is about three times
higher than the ratio of articles mentioning geopolitical risks. If media coverage of geopolitical risk
were to systematically vary in response to natural disasters, one could find a (negative) correlation
between the GPR and the natural disasters indexes, and argue there is a quantitative difference
between objective geopolitical risks on the one hand, and media attention towards geopolitical risks
on the other. However, there appears to be virtually no relationship at monthly frequency between
the natural disasters index and our GPR index—their correlation coefficient is negative 0.02, and
is not significantly different from zero.
The middle panel confirms that the irrelevance of other newsworthy events still applies when
we replace the natural disaster index with an index capturing newspapers’ attention towards re-
curring and predictable sport events, such as the Olympics or the Super Bowl. The correlation
between the GPR index and the “Sport Events Index” is modest (0.07), thus suggesting that nei-
ther unpredictable (like most natural disasters) nor predictable (like most sports events) news have
a significant bearing on fluctuations in the geopolitical risk index.21
Finally, in the bottom panel we address the potential for political slant to skew newspaper
coverage of geopolitical risks. Following the approach in Baker, Bloom, and Davis (2016), we split
our 11 newspapers into seven left-leaning and four left-leaning newspapers.22 The “left” and “right”
versions of our GPR index move together closely, with a correlation of 0.94, again suggesting that
while different media outlets may vary the intensity with which they cover geopolitical events, the
broad time-series properties of the index are remarkably robust to the political slant of newspapers.
3.3 Relationship to Alternative Proxies for Geopolitical Risks
Several studies have constructed quantitative proxies of war intensity or terrorism-related events.
One widely used source is the International Crisis Behavior (ICB) database, which provides detailed
information on 476 major international crises that occurred during the period from 1918 to 2015.
20 The natural disasters index counts the share of articles mentioning “earthquakes,” “hurricanes,” “tornadoes,”“tsunamis,” or “wildfires.”
21 Predictable or unpredictable news could themselves cause geopolitical tensions if agents engaging in military orterrorist acts want more or less publicity in the media following their actions. Durante and Zhuravskaya (2016) arguethat Israeli attacks on Palestinians are more likely to occur when U.S. news on the following day are dominated byimportant predictable events. Jetter (2017) uses data on terrorist attacks in 201 countries to argue that increasedcoverage of The New York Times encourages further attacks in the same country.
22 The left-leaning newspapers are the Boston Globe, Chicago Tribune, The Globe and Mail, The Guardian, LosAngeles Times, The New York Times, and the Washington Post. The right-leaning newspapers are The DailyTelegraph, the Financial Times, the Times, and The Wall Street Journal
15
This database has been used in the political science literature as well as in studies on war and
economics. One example is the work by Berkman, Jacobsen, and Lee (2011), who use the ICB
database to construct a proxy for time-varying rare disaster risk.23 The proxy, which counts the
number of international crises per month, is plotted alongside the GPR index in the top panel of
Figure 7. The ICB crisis index and the GPR index display some degree of comovement in various
historical periods, such as the aftermath of World War I, the Cold War in the early 1960s and late
1970s, the Gulf War, and the Iraq War. But there are also some remarkable differences, such as
during World War II, when the ICB crisis index is remarkably low, or during the mid-1990s, when
the ICB crisis index is higher than the GPR index. Some differences are due to the different nature
of the indexes—the ICB index counts international crises, including those that might receive little
press coverage. Moreover, the GPR index displays substantially more high-frequency variation—a
feature that, as we show in Section 5, allows us to establish the importance of GPR for stock returns
over relatively short samples.
The second panel of Figure 7 compares our index to two alternative indicators that offer a
different perspective on the threats coming from geopolitical risk. The two indicators are (1) deaths
due to terrorism in the world, and (2) deaths due to terrorism in the United States and Europe
combined. The latter are likely to receive more press coverage in the English-speaking press.24 Both
series appear to be uninformative about overall movements in the GPR index. However, all indexes
spike around 9/11, and the somewhat elevated level of the GPR index in 2015 and 2016 appear
to reflect a rise in the worldwide number of deaths due to terrorism, alongside heightened media
attention to conflicts in the Middle East.
The third panel of Figure 7 compares the GPR index with the national security component
of the economic policy uncertainty index (EPU) constructed by Baker, Bloom, and Davis (2016).
Like our measure, the national security EPU spikes during the Gulf War, after 9/11, and during
the Iraq War. However, the GPR index seems to better capture other spikes in geopolitical risk
that are missed by the national security EPU. The correlation between the two measures is 0.69,
a plausible value because the national security component of the EPU captures uncertainty about
policy responses about events associated to national security (of which geopolitical events are a
23 Measures of political or geopolitical risk offer an alternative to proxies of disaster risk based on economic indi-cators, such as those based on asset prices—Watcher (2013)—or consumption—Barro and Ursua (2012).
24 The data on terrorism-related deaths largely exclude wars, but the distinction appears mostly semantic as thedividing line between wars and terrorism has been blurred at least since 9/11. The data are from the Global TerrorismDatabase (GTD), which is an open-source database including information on terrorist events around the world.
16
subset), which is not the same concept as the uncertainty generated by geopolitical events.25
Finally, the bottom panel of Figure 7 compares the GPR index with an outside measure of
political risk related to wars, the U.S. External Conflict Rating (ECR) constructed by the Interna-
tional Country Risk Guide (ICRG). The ratings constructed by the ICRG are largely subjective,
as they are based on the insights of various analysts following developments in a particular country
or region. The ECR measure moves only occasionally over the sample, changing on average once
a year, with more pronounced movements and more frequent changes around 9/11, when both the
GPR index and ICRG index spike. The correlation between the two series is 0.41.
3.4 Relation to Popular Measures of Economic Uncertainty
Figure 8 compares the benchmark index with two other popular measures of uncertainty: the VIX—
a measure of stock market volatility—and the EPU index of Baker, Bloom, and Davis (2016).26 All
indexes share two common spikes: in 1991, at the time of the Gulf War, and in 2001, after the
9/11 terrorist attacks. However, in both cases it seems plausible to argue that the correlation runs
from geopolitical events to stock market volatility and policy uncertainty. Similarly, the 2003 U.S.
invasion of Iraq seems to cause an increase in EPU, while it does not induce financial volatility.
The three indexes also feature a large amount of independent variation. The GPR index does
not move during periods of economic and financial distress, such as at the onset of the dot-com
bubble and during the Global Financial Crisis, when both the VIX and the EPU index rise sharply
and remain elevated. The GPR index also does not move around presidential elections, periods
characterized by elevated policy uncertainty. By contrast, rises in the EPU index and VIX do not
coincide with the Russian annexation of Crimea, the ISIS escalation in the Middle East, and various
terrorist attacks other than 9/11.
Summing up, compared to the VIX and the EPU index, the GPR index captures events that
(i) are more likely to be exogenous to the business and financial cycles, and (ii) could give rise to
heightened financial volatility and policy uncertainty. This comparison motivates the identification
assumptions used in the structural VAR analysis described in the next section.
25 Chadefaux (2014) uses news–searches from Google News Archive to construct an annual indicator that detectsearly warning signals for wars dating back to the early 20th century. Unfortunately, neither the Google News Archivenor Google Trends seem ready for systematic quantitative news searches over long periods of time. The searchalgorithms are not transparent, and change continuously over time thus making replication difficult. In the case ofGoogle News Archive, the searches seemed to yield a number of results that were two orders of magnitude smallerthan the results we obtained using the ProQuest databases.
26 Throughout the paper, our VIX measure is the “old” VIX (VXO) from the Chicago Board Options Exchange.We use the VXO that starts in 1986 instead of “new” VIX—that only starts in 1990—since it grants us more dataand since the two indexes have 0.99 correlation at monthly frequency.
17
4 Geopolitical Risk and the U.S. Economy
In this section we estimate the effects of rising geopolitical risk on the U.S. economy using structural
VAR models. We first track the macroeconomic and financial implications of an exogenous rise in
geopolitical risk. We then estimate the heterogeneous effects of geopolitical risk on industry-level
stock returns. Finally, we assess the separate role of shocks to geopolitical threats and shocks to
geopolitical acts.
4.1 Main Results
Our main VAR specification—which we estimate using data from 1985:M1 through 2016:M12—
aims to characterize the economic effects of high geopolitical risk on the U.S. economy. The model
consists of nine variables: (1) the GPR index; (2) the EPU index of Baker, Bloom, and Davis
(2016); (3) consumer sentiment from the University of Michigan Survey of Consumers; (4) the log
of U.S. industrial production; (5) the log of nonfarm payroll employment; (6) a measure of U.S.
gross trade—namely, the log of the sum of U.S. imports and exports in goods; (7) the Standard and
Poor’s 500 index; (8) the log of the West Texas Intermediate price of oil; (9) the yield on two-year
U.S. Treasuries.27 All VAR models presented in the paper are estimated using Bayesian techniques.
We impose a Minnesota prior on the reduced-form VAR parameters by using dummy observations
as in Del Negro and Schorfheide (2011). The resulting specification is estimated using a constant
and 12 lags of the endogenous variables.28
We identify the structural shocks by using a Cholesky decomposition of the covariance matrix of
the VAR reduced-form residuals, ordering the GPR index first. The ordering implies that the GPR
index reacts contemporaneously only to its own shock. Hence, any contemporaneous correlation
between the macro variables and the GPR index reflects the effect of the GPR index on the macro
variables. The characteristics of the GPR index discussed in Section 2—as well as the comparison
to the EPU index in Section 3—lend support to this assumption. For instance, Jackson and Morelli
(2011) list religion, revenge, ethnic cleansing, and bargaining failure over resources as the main
reasons for armed conflicts. Although recessions, lower commodity prices, or dismal economic
27 The U.S. trade series are from the OECD Monthly International Merchandise Trade database. The U.S. tradeseries, the stock market index, and the price of oil are expressed in real terms dividing by the U.S. Consumer PriceIndex for All Urban Consumers.
28 Following the notation in Del Negro and Schorfheide (2011), the vector of hyperparameters of the Minnesotaprior is λ = [1, 3, 1, 1, 1]. We use the first year of the sample as a training sample for the Minnesota prior. All theresults reported in the paper are based on 10,000 draws from the posterior distribution of the structural parameters,where the first 2,000 draws were used as a burn-in period.
18
performance might in some cases have exacerbated existing geopolitical tensions, it seems reasonable
to assume that movements in economic variables within a month have little bearing on geopolitical
risks. Nonetheless, in Section A.4 in the Appendix we explore robustness to an alternative Cholesky
ordering, as well as to alternative specifications of the baseline VAR model.
The solid lines in Figure 9 show the median impulse responses to an exogenous increase in
the GPR index of 167 points, while the light- and dark-shaded areas represent the corresponding
68 percent and 90 percent pointwise credible bands, respectively. The size of the shock equals the
average change in the index following the nine episodes of largest increases in the GPR index.29 The
rise in the GPR index induces a small and short-lived increase in the EPU index and a decline in
consumer sentiment. Intuitively, geopolitical risk can induce some economic policy uncertainty on
items such as national security and the fiscal budget and negatively weigh on consumer sentiment.
On the real side, IP declines quickly, bottoming out at negative 0.9 percent after about 6 months,
before reverting back to trend. The deterioration in labor market conditions is substantial but
more gradual, with payroll employment reaching a trough of negative 0.4 percent a year after the
shock. Gross trade also drops, with U.S. imports and exports falling nearly 2 percent relative
to the baseline. Figure A.7 in the Appendix plots the response of private investment to a GPR
shock, based on an extension of the baseline model estimated on quarterly data. The economically
significant decline in investment following a GPR shock, together with the decline in employment,
is consistent with models of investment under uncertainty a la Dixit and Pindyck (1994).30
On the financial side, the response of the stock market is economically and statistically sig-
nificant. Stock prices drop by almost 3 percent on impact and remain below baseline for a little
over three months. The increase in the GPR leads to a decrease in oil prices, which bottom out at
7 percent below baseline after three months. This result stands in contrast with much of the conven-
tionally held view that higher geopolitical risk drives up oil prices persistently—a view that might
reflect a selective memory that confounds all geopolitical tensions with oil supply shocks driven by
geopolitical tensions in the Middle East. Finally, the yield on two-year Treasuries declines by about
20 basis points, indicating both a worsening of the macroeconomic outlook and a loosening of the
29 These episodes are the U.S. bombing of Libya in 1986, the Kuwait Invasion, the Gulf War, the 1998 IraqDisarmament Crisis, 9/11, the risk of Iraq invasion in September 2002, the 2005 London bombings, the Russianannexation of Crimea, and the 2015 Paris terrorist attacks.
30 The quarterly VAR consists of the following variables: (1) the GPR index; (2) the EPU index; (3) consumersentiment; (4) the log of U.S. GDP; (5) the log of nonfarm payroll employment; (6) the Standard and Poor’s 500index; (7) the log of the West Texas Intermediate price of oil; (8) the yield on two-year U.S. treasuries; and (9) thelog of private investment, defined as the sum of private nonresidential investment and consumption of durable goods.The stock market index and the price of oil are expressed in real terms dividing by the U.S. Consumer Price Indexfor All Urban Consumers, while the GDP and investment series dividing by the GDP deflator.
19
monetary policy stance.
One useful way to assess the exposure to GPR of various sectors of the U.S. economy is depicted
in Figure 10. We add to the VAR model the cumulative excess return of firms in given industries
relative to the S&P 500.31 The solid lines show the excess return for 6 industries. The defense
industry, which is perhaps directly exposed to geopolitical risk, records a positive but short-lived
excess return; by contrast, industries that are exposed to the overall U.S. economy—such as aircraft,
steelworks, and mining—display somewhat persistent negative returns. The oil industry, which
some commentators argued could benefit from wars, especially in the Middle East, displays an
initial positive excess return followed by a persistent decline, a response that mimics the path of oil
prices. Finally, the insurance industry moves in sync with the overall U.S. stock market.
4.2 Threats versus Acts
Next, we evaluate the difference between innovations in the two broad components of the GPR
index, the GPA—geopolitical acts—index and the GPT—geopolitical threats—index, by replacing
the GPR index with the GPA and GPT indexes in the benchmark VAR. To achieve identification, we
use a Cholesky ordering, with the GPA index ordered first and the GPT index ordered second. We
interpret the first shock—the GPA shock—as the realization of some adverse geopolitical events that
could induce an increase in geopolitical threats; we interpret the second shock—the GPT shock—as
capturing geopolitical threats that are not contemporaneously associated with geopolitical acts,
such as tensions building up before wars or after terrorist attacks.
The impulse responses to the GPA and GPT shocks are shown for selected variables in Figure 11.
In presenting the results, we adopt the following exposition scheme, which is best viewed in color.
Specifically, the responses to the GPA shock are plotted using a green-based color motif, while the
responses to the GPT shock are plotted using a red-based color motif.
Starting from the responses of the three uncertainty proxies, a GPA shock of size 288—a shock
sized to be equal to the 7 largest spikes in GPA, shown in panel (a)—induces an initial increase
in the GPT and EPU indexes, followed by a period of below-average GPT and EPU that lasts
for about a year. Thus, these responses are consistent with the realization of acts leading to the
resolution of threats and uncertainty. By contrast, a GPT shock—shown in panel (b)—leads to a
persistent increase in GPT—which remains elevated for over a year—and in EPU. The GPA index,
which by assumption does not move on impact, increases for about one year, as in our sample many
31 We use data on 6 industry portfolios from the 48 Fama-French value-weighted industry portfolios available inKenneth Frenchs data library.
20
geopolitical threats precede geopolitical acts.
The responses of activity, trade, and the stock market show that the GPA and GPT shocks
have asymmetric effects on the U.S. economy. A shock to the GPA leads to a small but short-lived
decline in economic activity and trade, whereas the stock market rises sharply one month after the
shock. By contrast, a shock to the GPT induces large and protracted recessionary effects, as well
as a decline in stock prices. Incidentally, the response of the stock market lends support to the old
idea, attributed to London financier Nathan Rothschild, that one should buy stocks “on cannons,”
and sell them “on trumpets.”
Figure 12 further elaborates on the asymmetric response of the stock market by depicting the
response of cumulative excess returns in six industries to GPA and GPT shocks. Excess returns
in all industries feature an asymmetric response, albeit to a various degree. The defense industry
features the largest asymmetry: defense companies, on average, earn an excess return of about
5 percent for more than two years following a GPA shock, while they earn only a modest and short-
lived excess return following a GPT shock. Excess returns in the steel and mining industries are
also asymmetric—positive when geopolitical acts materialize and negative when threats are high.
By contrast, the asymmetry in excess returns for insurance companies is economically modest.
One possible interpretation of the asymmetric effects of shocks to acts and threats is that the
act component of GPR leads to a resolution of the uncertainty around a particular set of events,
as well as to a coordinated policy response that ends up giving protection on the worst possible
outcomes. By contrast, threat shocks depress asset prices and economic activity because they
increase uncertainty and send signals about future adverse events.32 The finding that the realization
of the event has only modest economic consequences compared to the threat echoes the findings of
theoretical models where agents form expectations using a worst case probability, as for instance in
Ilut and Schneider (2014).
5 International Effects of Higher Geopolitical Risk
This section characterizes the international effects of rising geopolitical tensions. We first estimate
a battery of structural VAR models, which we use to track the macroeconomic implications of an
exogenous rise in geopolitical risk on real activity. We then test whether global stock market returns
depend on geopolitical risk. Finally, we estimate panel regressions to unveil whether geopolitical
risk affects international capital flows.
32 See Pastor and Veronesi (2013) for a model of political uncertainty and risk premia.
21
5.1 Geopolitical Risk and Real Activity
We first study whether GPR shocks have adverse consequences on the real economy outside the
United States. We start by looking at the response of world IP and IP in advanced and emerging
economies. Importantly, the emerging economies’ IP index includes mostly Asian, European, and
Latin American countries. Reliable data on IP in major oil producing countries—which are likely
to be highly exposed to the geopolitical risks captured by our index—are not available.33 We then
estimate the response of real activity in three countries: Canada and the United Kingdom—as
we used newspapers from these two countries in the construction of the index—and Mexico, an
emerging economy selected for its large exposure to the U.S. economy.
We estimate a battery of VAR models consisting of the GPR index, the EPU index for the
United States, and IP.34 As for the U.S. model, we identify a GPR shock ordering the GPR index
first in a Cholesky decomposition of the covariance matrix of the VAR residuals. The black lines
in Figure 13 depict the median responses of IP for the six countries and regions listed above.
These impulse responses suggest that a GPR shock has global consequences—world IP declines by
about 0.5 percent one year after the shock—but its effects are mostly concentrated in advanced
economies. By contrast, the emerging economies included in our index, on average, do not respond
to geopolitical risks. Yet, Mexico—possibly through its large exposure to U.S. trade—experiences
a modest but persistent decline in real activity.
5.2 Geopolitical Risk and Stock Returns
We now turn to examining the reaction of stock market returns to changes in geopolitical risk. We
do so both for the sample covered by the historical GPR index and for the sample covered by the
benchmark GPR index.
The baseline econometric specification echoes the work of Berkman, Jacobsen, and Lee (2011).
These authors find that disaster risk depresses stock returns. They measure disaster risk by counting
the number of active crises recorded in the International Crisis Database discussed in Section 3 and
plotted in Figure 7. Since their measure of disaster risk is tightly linked to geopolitical events, in
this section we ask if our proxy, which displays only a weak correlation with their crisis index, can
33 These indexes aggregate IP across countries using GDP weights. Caldara, Cavallo, and Iacoviello (2016) providedetails on the construction of the IP indexes for advanced and emerging economies.
34 We estimate three-equation models as opposed to larger models, as the IP responses reported next are robustto the inclusion of various variables employed in the U.S. model. The lack of availability of long time series datafor some advanced and emerging economies made us opt for a simple specification. In addition, similar impulseresponses can be estimated by running simple local projections.
22
help us uncover a significant relationship between geopolitical risk and stock returns.
We obtain data on monthly stock returns based on general market price indexes from Global
Financial Data. Our sample ranges from 1900 to 2016, although data availability varies by country,
and the world stock price index is available starting in 1919. We select 17 countries—all countries
that are currently classified as advanced economies, with the exception of India, Peru, and South
Africa—for which data before World War II are available. The world stock price index is the Morgan
Stanley Capital International (MSCI) index from 1970. Prior to 1970, world returns are calculated
using the weighted average of country-specific returns.35 Nine countries have data starting before
World War I. Many countries included in our regressions have gaps in the coverage that range from
one month to over a year. Since these gaps partly coincide with World War II—as some stock
markets did not operate in those years—we follow Berkman, Jacobsen, and Lee (2011) and use all
available information.
We start by estimating the following regression:
rwld,t = µi + αwldGPRSHOCKt + βwldCRISESt + εwld,t, (1)
where rwld,t is the world stock market return in month t, GPRSHOCKt is the residual of an
autoregressive process of order one estimated for the GPR index, and CRISESt is the crisis index
constructed by Berkman, Jacobsen, and Lee (2011). In columns (1) and (3) of Table 2 we report
results for two samples, starting in 1919 and 1985, respectively. To compare the impact on the
GPR and on the crisis index, the coefficients measure the impact on stock returns of a one standard
deviation shock in the GPR, and of having 2.41 active crises per month, the average number of
crises over our sample.
For the historical sample, we find that a 1 standard deviation increase in the GPR induces a
statistically significant decline in monthly stock returns of 0.5 percent. The sensitivity of world
stock returns to geopolitical risk is larger after 1985, with an estimated drop of 0.75 percent.
Interestingly, the coefficient on the crisis variable is negative for the historical sample—albeit not
statistically significant—and becomes positive and not significant in the post-1985 sample. Thus,
the GPR index correlates with negative stock returns controlling for the realizations of international
35 The indexes were weighted in January 1919 as follows: North America 44 percent (USA 41 percent, Canada 3percent), Europe 44 percent (United Kingdom 12 percent, Germany 8 percent, France 8 percent, Italy 4 percent,Switzerland 2.5 percent, Netherlands 2.5 percent, Belgium 2 percent, Spain 2 percent, Denmark 1 percent, Norway1 percent and Sweden 1 percent), Asia and the Far East 12 percent (Japan 6 percent, India 2 percent, Australia2 percent, South Africa Gold 1 percent, South Africa Industrials 1 percent). Country weights do not change until1970. Capitalization weightings are used beginning in 1970 using the same countries that are included in the MSCIindexes.
23
crises. Moreover, the result over the post-1985 sample suggests that an advantage of the GPR index
over the crisis index is that, having substantially more time variation, allows for the estimation of
the impact of geopolitical events on stock returns over relatively short samples.
World stock returns react more to threats about geopolitical events than their realizations. This
result is based on a modified version of equation (1), where we replace GPRSHOCKt with the
residuals of AR(1) processes estimated for the GPR acts and threats indexes. As tabulated in
column (2) of Table 2, for the historical sample, world stock returns decline in response to both
GPA and GPT shocks, but the response to the former is small and not statistically significant. By
contrast, in the post-1985 sample, stock returns rise in response to a positive GPA shock, while
they experience a large and statistically significant decline in response to a GPT shock. Thus, as
in the United States, world stock returns respond asymmetrically to the threats and realizations of
geopolitical events.
We also estimate the following regression on country stock returns data:
ri,t = µi + αwldGPRSHOCKt + εi,t, (2)
where ri,t is the stock market return in country i and month t. We exclude the crisis index from the
country regressions because for the 11 countries we have stock returns data starting prior to 1919,
the first year the crisis index is available. Table 3 tabulates the results for the historical and the
post-1985 samples.
Three results emerge from this exercise. First, both in the historical and post-1985 sample,
geopolitical risk depresses stock returns in all but one of the countries included in our regressions—
the only positive coefficient is estimated for Japan and is close to zero. Second, on average, the
sensitivity of stock returns to geopolitical risk is larger in the post-1985 sample relative to the
historical sample, with countries like the Netherlands, Portugal, and Spain having a coefficient
about 3 times larger in the short sample. Third, the response of stock returns varies substantially
across countries. For the historical sample, the response ranges from about negative 0.9 for Italy
and South Africa, to 0 for countries like Japan and Germany. Similarly, for the post-1985 sample,
coefficients range from negative 1.50 for Italy and Germany, to negative 0.3 for Australia and Japan.
Furthermore, while stock returns in some countries have remained particularly responsive (such as
Italy or South Africa) or unresponsive (such as Japan) over time, stock returns have become more
sensitive in others—most notably in Germany.
24
5.3 Geopolitical Risk and Capital Flows
Finally, we present additional evidence on the global economic consequences of changes in geopoliti-
cal risk by showing how geopolitical risk affects capital inflows in a sample of advanced and emerging
economies. The procyclical and volatile nature of capital flows makes them a leading policy concern,
especially in economies that rely heavily on foreign sources of financing. We use country-level, quar-
terly data on capital inflows from the IMF’s Balance of Payments Statistics database. Our sample
consists of 22 advanced economies, 23 emerging economies, and the United States, and covers the
period from 1986:Q1 through 2015:Q4.36
Our baseline specification tests whether movements in geopolitical risk have explanatory power
for gross capital inflows. We choose gross inflows—net purchases of domestic assets by foreign
residents excluding official reserves—in line with a large and growing body of empirical evidence
that shows that gross capital flows respond systematically to changes in global conditions, and in
line with the notion that our measure of geopolitical risk is more likely to matter for the economic
decisions of global investors on where to allocate capital across countries.37 Our regression takes
the form:
yi,t = αi + ρyi,t−1 + βGPRt + ΓXt + ui,t, (3)
where yi,t = inflows i,t/GDPi,t are gross capital inflows divided by annualized GDP, αi are country
fixed effects, GPRt is our geopolitical risk index, and Xt is a vector of control variables. We
estimate equation (3) separately for emerging economies, for advanced economies excluding the
United States, and for the United States. Throughout, we assume that the effect of the GPR index
on capital inflows is equal within each group of countries. Following the work of Ahmed and Zlate
(2014), our model specification includes the VIX to control for global economic risk, lagged capital
flows to control for persistence in capital flows, as well as country-specific GDP growth to capture
36 The sample of advanced economies includes Japan, Germany, France, UK, Italy, Canada, Spain, Australia,Netherlands, Switzerland, Sweden, Belgium, Norway, Austria, Denmark, Greece. Finland, Portugal, New Zealand,Slovakia, Slovenia, and Estonia. The sample of emerging economies includes China, Brazil, India, Korea, Mexico,Indonesia, Turkey, Argentina, Venezuela, South Africa, Thailand, Colombia, Malaysia, Israel, Chile, Philippines,Peru, Ecuador, Jordan, El Salvador, Russia, Saudi Arabia, and Latvia. We drop from the sample countries witha standard deviation of inflows to GDP larger than 50 percent (Hong Kong, Ireland, Singapore, Luxembourg andIceland). The average number of observations per country is 106 for the advanced economies, and 93 for the emergingeconomies.
37 See Forbes and Warnock (2012) and Ahmed and Zlate (2014) for recent discussions of the focus on gross versusnet capital flows. As discussed in Ahmed and Zlate (2014), whether to look at net capital inflows or gross capitalinflows is an open question. Conceptually, global geopolitical risk should be more directly relevant for the investmentdecisions of foreign investors. For this reason, we focus on gross capital inflows.
25
demand-side factors that could drive capital flows towards one country.
Table 4 reports regressions coefficients scaled to denote the impact of a 1 standard deviation
increase in the GPR index and the VIX. Comparing columns (1) and (2) of the table, an increase
in GPR produces different effects on capital inflows in emerging versus advanced economies. In
emerging economies, high GPR reduces capital inflows by 0.23 percentage points, while an equally
sized increase in the VIX reduces capital inflows by more than one percentage point. By contrast,
in advanced economies, increases in GPR lead to a sizable increase in capital inflows—about one
percentage point—whereas increases in the VIX reduces capital inflows by 1.5 percentage points.
GPR and VIX also have opposite effects on inflows for the United States: as tabulated in column
(3), the effect of an increase in geopolitical risk is negative (albeit the coefficient is not statistically
different from zero) while the effect of an increase in the VIX is positive and statistically significant.
In all specifications, the coefficient on lagged GDP growth is positive, confirming the findings in
Broner, Didier, Erce, and Schmukler (2013) that a better investment climate (as proxied by GDP
growth) leads to larger inflows in both advanced and emerging economies.
In additional regressions results, we have verified that the asymmetric effect of geopolitical risk
on capital inflows for emerging and advanced economies is present for all three subcomponents
of capital inflows: portfolio flows, foreign direct investment, and other investments.38 However,
such effects are especially pronounced for portfolio flows and other investments compared to foreign
direct investment.
All told, the results suggest a marked difference between the effects on capital flows of global
economic risk (as measured by the VIX) and geopolitical risk. While higher economic uncertainty
leads to a repatriation of foreign capital across the board, increases in geopolitical risk appear to
shift purchases of foreign capital away from emerging and toward advanced economies, consistent
with a flight-to-safety hypothesis.39 However, the relatively small estimate of the effect of GPR on
emerging economies’ inflows suggests that adverse geopolitical events fall short of causing full-blown
sudden stops in these economies. This finding mirrors our international VAR evidence showing little
effects of higher geopolitical risk on activity in emerging economies.
38 Other investments include liabilities to official creditors, foreign bank loans, and other financial transactions notcovered in direct investment, portfolio investment, or reserve assets.
39 Fratzscher (2012) finds evidence of dynamics of capital flows driven by safe-haven flows during the crisis. Ourresults suggest that flight-to-safety flows can materialize also during periods of high geopolitical tensions.
26
6 Conclusions
We construct an index of geopolitical risk and examine its evolution and its effects over the past 120
years. This index captures an important dimension of uncertainty: the risk of events that disrupt
the normal, democratic, and peaceful course of relations across states, populations, and territories.
Compared to existing proxies for macroeconomic uncertainty, we argue that our index can be used
to isolate risks—such as risks of wars and terrorist attacks—that are more likely to be exogenous
to economic developments in the United States and other advanced economies.
A detailed audit and a comparison with existing proxies confirm that the GPR index accurately
captures the timing and the intensity of heightened geopolitical risk. Moreover, spikes in the GPR—
both at monthly and a daily frequency—correctly point to well-known historical episodes of rising
tensions.
Our results indicate that exogenous changes in geopolitical risks depress economic activity and
stock returns in advanced economies, most notably in the United States. Importantly, these adverse
effects are sparked by heightened threats of adverse geopolitical events, rather than their realization.
Thus, our findings provide support for theories where expectations about future negative events—
such as models of ambiguity aversion or disaster risks—and changes in macroeconomic uncertainty
can drive the business and financial cycles.
27
References
Aghion, P., X. Jaravel, T. Persson, and D. Rouzet (2017): “Education and Military
Rivalry,” Journal of the European Economic Association, forthcoming.
Ahmed, S., and A. Zlate (2014): “Capital flows to emerging market economies: a brave new
world?,” Journal of International Money and Finance, 48, 221–248.
Bachmann, R., S. Elstner, and E. R. Sims (2013): “Uncertainty and Economic Activity:
Evidence from Business Survey Data,” American Economic Journal: Macroeconomics, 5(2), 217–
249.
Baker, S. R., N. Bloom, and S. J. Davis (2016): “Measuring Economic Policy Uncertainty*,”
The Quarterly Journal of Economics, 131(4), 1593.
Barro, R. J. (2006): “Rare Disasters and Asset Markets in the Twentieth Century,” The Quarterly
Journal of Economics, 121(3), 823–866.
Barro, R. J., and J. F. Ursua (2012): “Rare Macroeconomic Disasters,” Annual Review of
Economics, 4(1), 83–109.
Berkman, H., B. Jacobsen, and J. B. Lee (2011): “Time-varying rare disaster risk and stock
returns,” Journal of Financial Economics, 101(2), 313–332.
Blomberg, S., G. D. Hess, and A. Orphanides (2004): “The macroeconomic consequences
of terrorism,” Journal of Monetary Economics, 51(5), 1007 – 1032.
Bloom, N. (2009): “The Impact of Uncertainty Shocks,” Econometrica, 77(3), 623–685.
Bloom, N., S. Bond, and J. Van Reenen (2007): “Uncertainty and investment dynamics,”
The review of economic studies, 74(2), 391–415.
Broner, F., T. Didier, A. Erce, and S. L. Schmukler (2013): “Gross capital flows: Dy-
namics and crises,” Journal of Monetary Economics, 60(1), 113–133.
Caldara, D., M. Cavallo, and M. Iacoviello (2016): “Oil Price Elasticities and Oil Price
Fluctuations,” Mimeo, Federal Reserve Board.
Caldara, D., C. Fuentes-Albero, S. Gilchrist, and E. Zakrajek (2016): “The macroeco-
nomic impact of financial and uncertainty shocks,” European Economic Review, 88(C), 185–207.
28
Carney, M. (2016): “Uncertainty, the economy and policy,” Bank of England.
Chadefaux, T. (2014): “Early warning signals for war in the news,” Journal of Peace Research,
51(1), 5–18.
Dalby, S., P. Routledge, and G. O. Tuathail (2003): The geopolitics reader. Routledge.
Del Negro, M., and F. Schorfheide (2011): “Bayesian Macroeconometrics,” in Handbook
of Bayesian Econometrics, ed. by H. van Dijk, G. Koop, and J. Geweke, pp. 293–389. Oxford
University Press.
Dixit, A. K., and R. S. Pindyck (1994): Investment under uncertainty. Princeton university
press.
Drautzburg, T., J. Fernandez-Villaverde, and P. Guerron-Quintana (2017): “Political
Distribution Risk and Aggregate Fluctuations,” .
Durante, R., and E. Zhuravskaya (2016): “Attack When the World Is Not Watching? US
News and the Israeli-Palestinian Conflict,” Journal of Political Economy, forthcoming.
Flint, C. (2016): Introduction to geopolitics. Routledge.
Forbes, K. J., and F. E. Warnock (2012): “Capital flow waves: Surges, stops, flight, and
retrenchment,” Journal of International Economics, 88(2), 235–251.
Fratzscher, M. (2012): “Capital flows, push versus pull factors and the global financial crisis,”
Journal of International Economics, 88(2), 341–356.
Gilchrist, S., J. W. Sim, and E. Zakrajek (2014): “Uncertainty, Financial Frictions, and
Investment Dynamics,” Working Paper 20038, National Bureau of Economic Research.
Glick, R., and A. M. Taylor (2010): “Collateral damage: Trade disruption and the economic
impact of war,” The Review of Economics and Statistics, 92(1), 102–127.
GoGwilt, C. L. (2000): The Fiction of Geopolitics: Afterimages of Culture, from Wilkie Collins
to Alfred Hitchcock. Stanford University Press.
Gourio, F. (2008): “Disasters and Recoveries,” American Economic Review, 98(2), 68–73.
Hassan, T. A., S. Hollander, A. Tahoun, and L. van Lent (2016): “Aggregate and Id-
iosyncratic Political Risk: Measurement and Effects,” Available at SSRN 2838644.
29
Huntington, S. P. (1997): The clash of civilizations and the remaking of world order. Penguin
Books India.
Ilut, C. L., and M. Schneider (2014): “Ambiguous Business Cycles,” American Economic
Review, 104(8), 2368–99.
Jackson, M. O., and M. Morelli (2011): “The reasons for wars: an updated survey,” The
handbook on the political economy of war, 34.
Jetter, M. (2017): “The effect of media attention on terrorism,” Journal of Public Economics,
153, 32 – 48.
Jurado, K., S. C. Ludvigson, and S. Ng (2015): “Measuring Uncertainty,” American Eco-
nomic Review, 105(3), 1177–1216.
Ludvigson, S. C., S. Ma, and S. Ng (2015): “Uncertainty and Business Cycles: Exogenous
Impulse or Endogenous Response?,” NBER Working Papers 21803, National Bureau of Economic
Research, Inc.
Moretti, E., C. Steinwender, and J. Van Reenen (2014): “The intellectual spoils of war?
Defense R&D, productivity and spillovers,” Discussion paper, Working Paper, London School of
Economics.
Pastor, L., and P. Veronesi (2013): “Political uncertainty and risk premia,” Journal of Finan-
cial Economics, 110(3), 520 – 545.
Saiz, A., and U. Simonsohn (2013): “Proxying for unobservable variables with internet
document-frequency,” Journal of the European Economic Association, 11(1), 137–165.
Scotti, C. (2016): “Surprise and uncertainty indexes: Real-time aggregation of real-activity
macro-surprises,” Journal of Monetary Economics, 82(C), 1–19.
Tavares, J. (2004): “The open society assesses its enemies: shocks, disasters and terrorist attacks,”
Journal of Monetary Economics, 51(5), 1039 – 1070.
Watcher, J. A. (2013): “Can Time-Varying Risk of Rare Disasters Explain Aggregate Stock
Market Volatility?,” The Journal of Finance, 68(3), 987–1035.
30
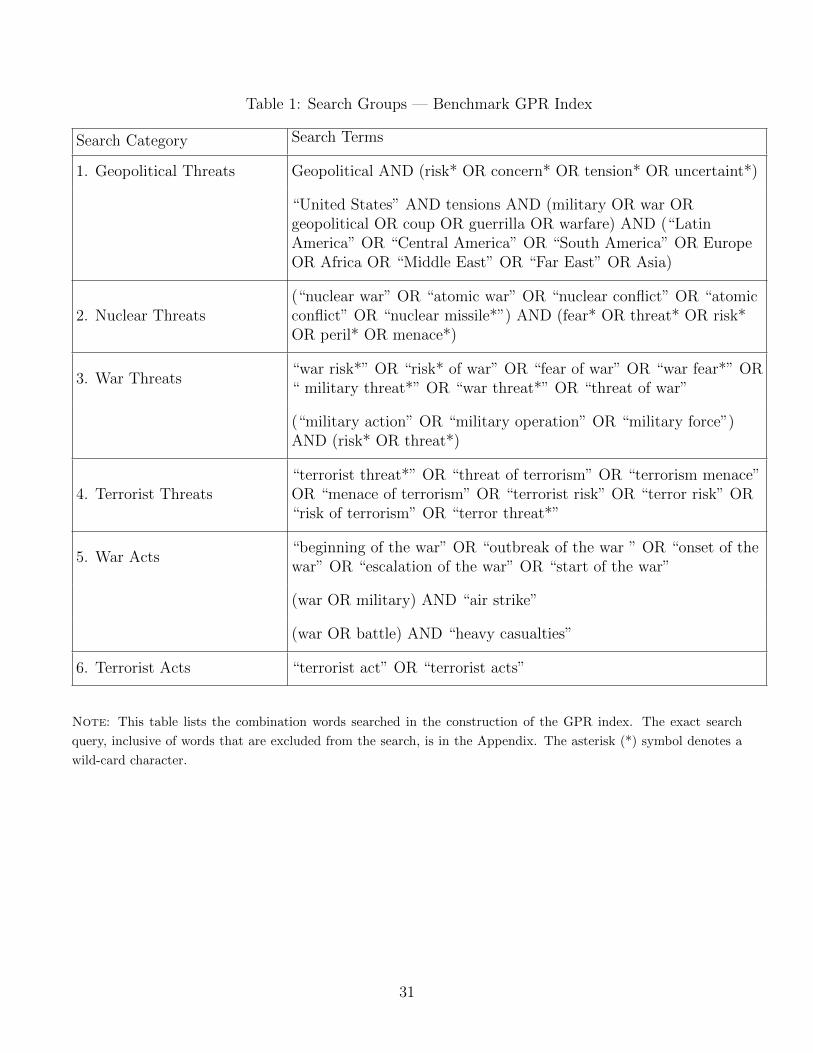
Table 1: Search Groups — Benchmark GPR Index
Search Category Search Terms
1. Geopolitical Threats Geopolitical AND (risk* OR concern* OR tension* OR uncertaint*)
“United States” AND tensions AND (military OR war ORgeopolitical OR coup OR guerrilla OR warfare) AND (“LatinAmerica” OR “Central America” OR “South America” OR EuropeOR Africa OR “Middle East” OR “Far East” OR Asia)
2. Nuclear Threats(“nuclear war” OR “atomic war” OR “nuclear conflict” OR “atomicconflict” OR “nuclear missile*”) AND (fear* OR threat* OR risk*OR peril* OR menace*)
3. War Threats“war risk*” OR “risk* of war” OR “fear of war” OR “war fear*” OR“ military threat*” OR “war threat*” OR “threat of war”
(“military action” OR “military operation” OR “military force”)AND (risk* OR threat*)
4. Terrorist Threats“terrorist threat*” OR “threat of terrorism” OR “terrorism menace”OR “menace of terrorism” OR “terrorist risk” OR “terror risk” OR“risk of terrorism” OR “terror threat*”
5. War Acts“beginning of the war” OR “outbreak of the war ” OR “onset of thewar” OR “escalation of the war” OR “start of the war”
(war OR military) AND “air strike”
(war OR battle) AND “heavy casualties”
6. Terrorist Acts “terrorist act” OR “terrorist acts”
Note: This table lists the combination words searched in the construction of the GPR index. The exact search
query, inclusive of words that are excluded from the search, is in the Appendix. The asterisk (*) symbol denotes a
wild-card character.
31
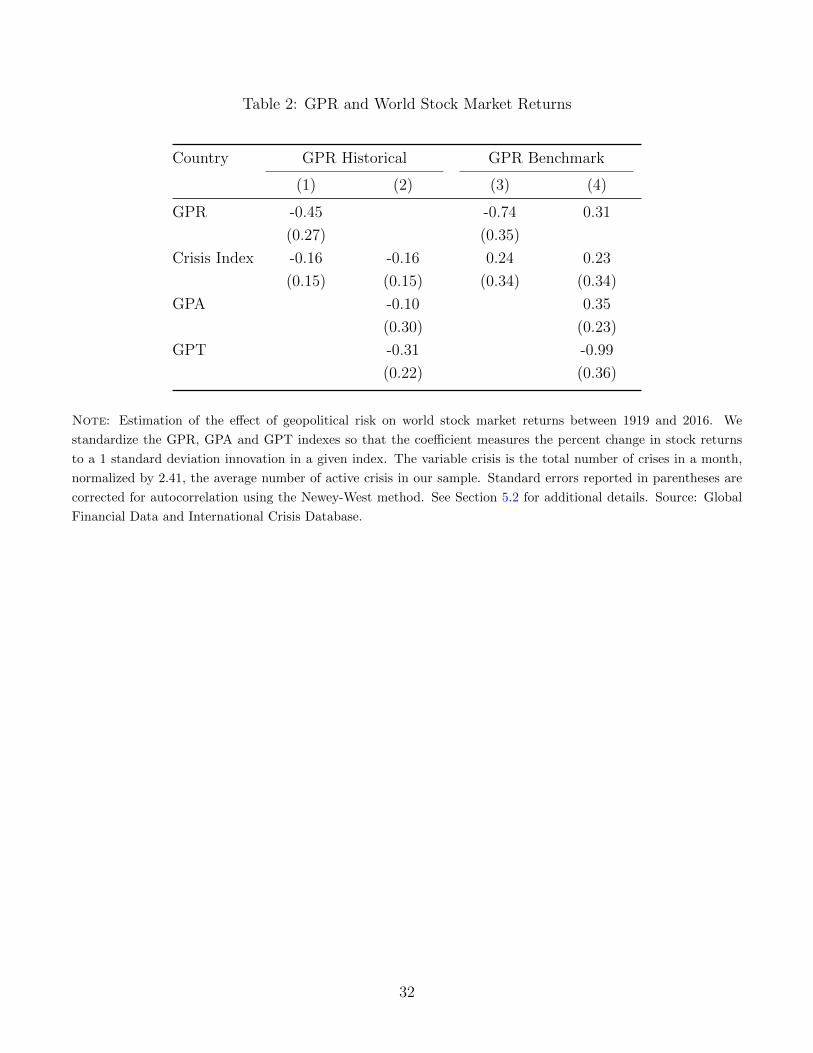
Table 2: GPR and World Stock Market Returns
Country GPR Historical GPR Benchmark
(1) (2) (3) (4)
GPR -0.45 -0.74 0.31
(0.27) (0.35)
Crisis Index -0.16 -0.16 0.24 0.23
(0.15) (0.15) (0.34) (0.34)
GPA -0.10 0.35
(0.30) (0.23)
GPT -0.31 -0.99
(0.22) (0.36)
Note: Estimation of the effect of geopolitical risk on world stock market returns between 1919 and 2016. We
standardize the GPR, GPA and GPT indexes so that the coefficient measures the percent change in stock returns
to a 1 standard deviation innovation in a given index. The variable crisis is the total number of crises in a month,
normalized by 2.41, the average number of active crisis in our sample. Standard errors reported in parentheses are
corrected for autocorrelation using the Newey-West method. See Section 5.2 for additional details. Source: Global
Financial Data and International Crisis Database.
32
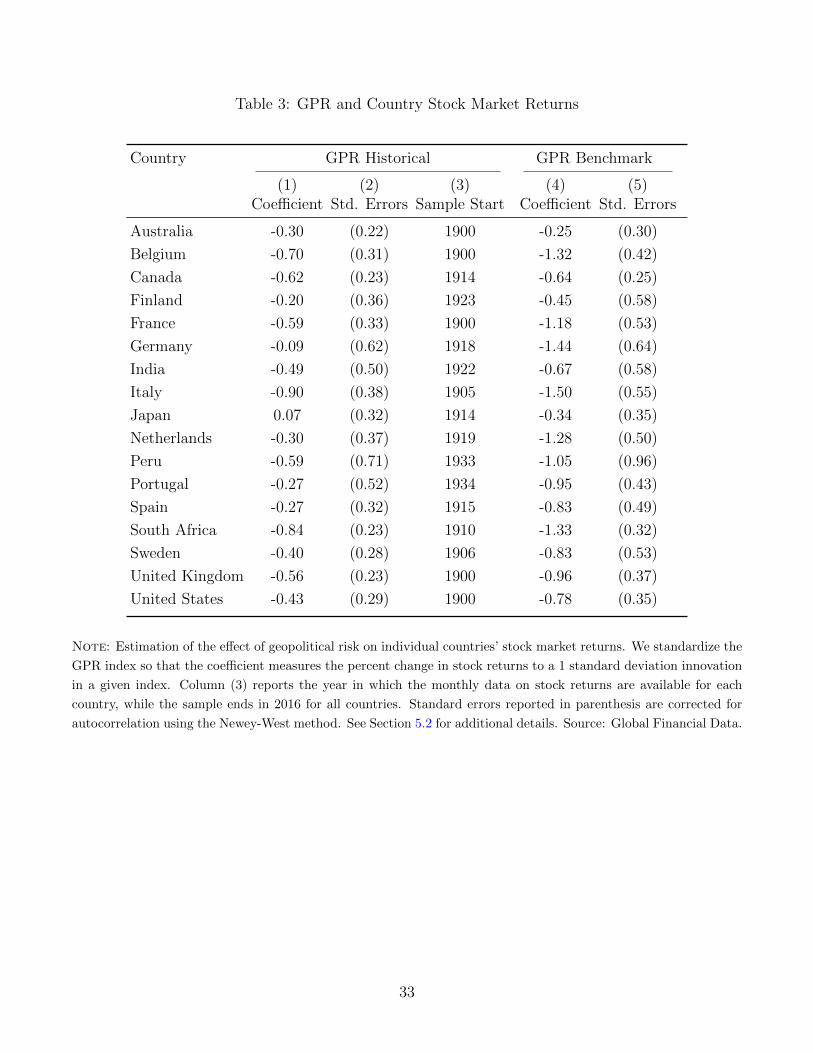
Table 3: GPR and Country Stock Market Returns
Country GPR Historical GPR Benchmark
(1) (2) (3) (4) (5)Coefficient Std. Errors Sample Start Coefficient Std. Errors
Australia -0.30 (0.22) 1900 -0.25 (0.30)
Belgium -0.70 (0.31) 1900 -1.32 (0.42)
Canada -0.62 (0.23) 1914 -0.64 (0.25)
Finland -0.20 (0.36) 1923 -0.45 (0.58)
France -0.59 (0.33) 1900 -1.18 (0.53)
Germany -0.09 (0.62) 1918 -1.44 (0.64)
India -0.49 (0.50) 1922 -0.67 (0.58)
Italy -0.90 (0.38) 1905 -1.50 (0.55)
Japan 0.07 (0.32) 1914 -0.34 (0.35)
Netherlands -0.30 (0.37) 1919 -1.28 (0.50)
Peru -0.59 (0.71) 1933 -1.05 (0.96)
Portugal -0.27 (0.52) 1934 -0.95 (0.43)
Spain -0.27 (0.32) 1915 -0.83 (0.49)
South Africa -0.84 (0.23) 1910 -1.33 (0.32)
Sweden -0.40 (0.28) 1906 -0.83 (0.53)
United Kingdom -0.56 (0.23) 1900 -0.96 (0.37)
United States -0.43 (0.29) 1900 -0.78 (0.35)
Note: Estimation of the effect of geopolitical risk on individual countries’ stock market returns. We standardize the
GPR index so that the coefficient measures the percent change in stock returns to a 1 standard deviation innovation
in a given index. Column (3) reports the year in which the monthly data on stock returns are available for each
country, while the sample ends in 2016 for all countries. Standard errors reported in parenthesis are corrected for
autocorrelation using the Newey-West method. See Section 5.2 for additional details. Source: Global Financial Data.
33
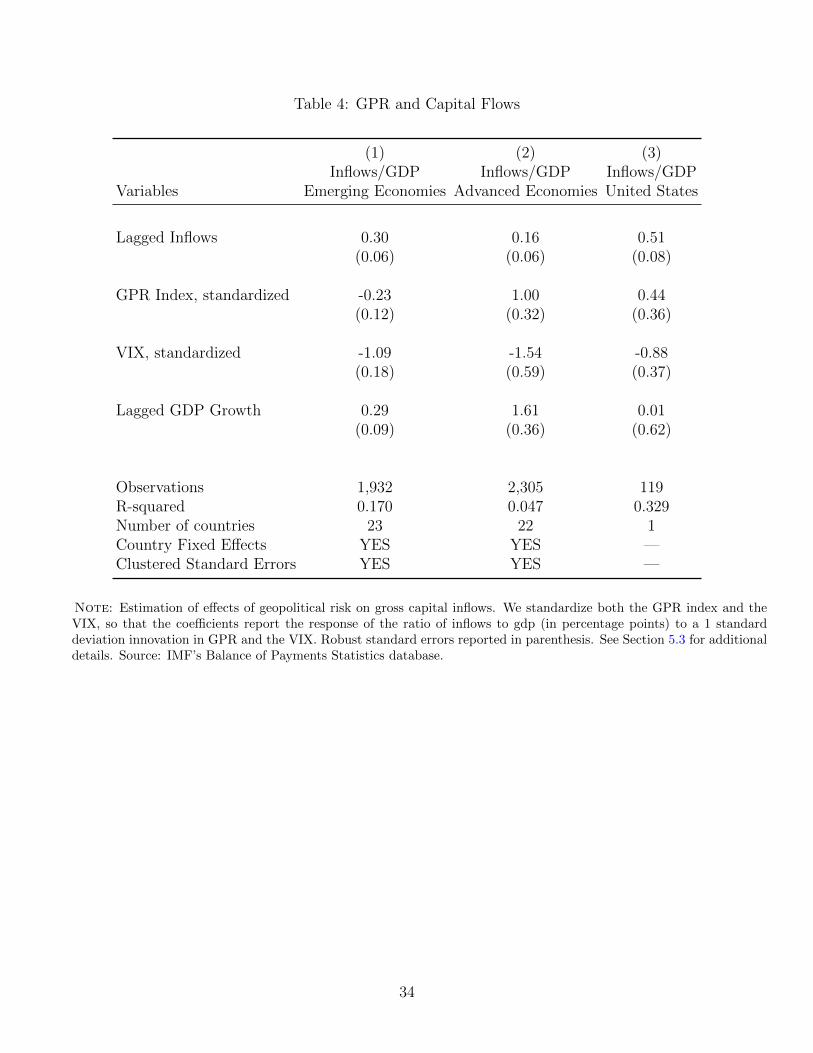
Table 4: GPR and Capital Flows
(1) (2) (3)Inflows/GDP Inflows/GDP Inflows/GDP
Variables Emerging Economies Advanced Economies United States
Lagged Inflows 0.30 0.16 0.51(0.06) (0.06) (0.08)
GPR Index, standardized -0.23 1.00 0.44(0.12) (0.32) (0.36)
VIX, standardized -1.09 -1.54 -0.88(0.18) (0.59) (0.37)
Lagged GDP Growth 0.29 1.61 0.01(0.09) (0.36) (0.62)
Observations 1,932 2,305 119R-squared 0.170 0.047 0.329Number of countries 23 22 1Country Fixed Effects YES YES —Clustered Standard Errors YES YES —
Note: Estimation of effects of geopolitical risk on gross capital inflows. We standardize both the GPR index and theVIX, so that the coefficients report the response of the ratio of inflows to gdp (in percentage points) to a 1 standarddeviation innovation in GPR and the VIX. Robust standard errors reported in parenthesis. See Section 5.3 for additionaldetails. Source: IMF’s Balance of Payments Statistics database.
34
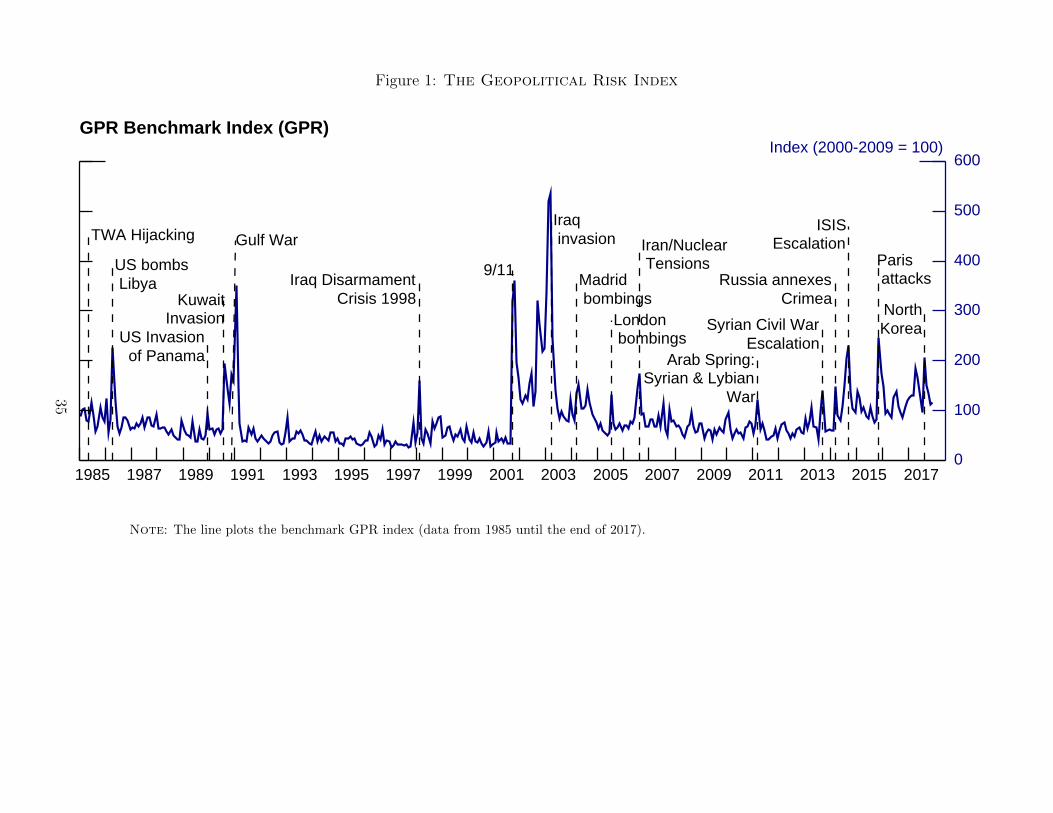
Figure 1: The Geopolitical Risk Index
0
100
200
300
400
500
600
1985 1987 1989 1991 1993 1995 1997 1999 2001 2003 2005 2007 2009 2011 2013 2015 2017
GPR Benchmark Index (GPR)Index (2000-2009 = 100)
TWA Hijacking
US bombs Libya
US Invasion of Panama
Kuwait Invasion
Gulf War
Iraq Disarmament Crisis 1998
9/11
Iraq invasion
Madrid bombings
London bombings
Iran/Nuclear Tensions
Arab Spring: Syrian & Lybian
War
Syrian Civil War Escalation
Russia annexes Crimea
ISIS Escalation
Paris attacks
North Korea
Note: The line plots the benchmark GPR index (data from 1985 until the end of 2017).
35
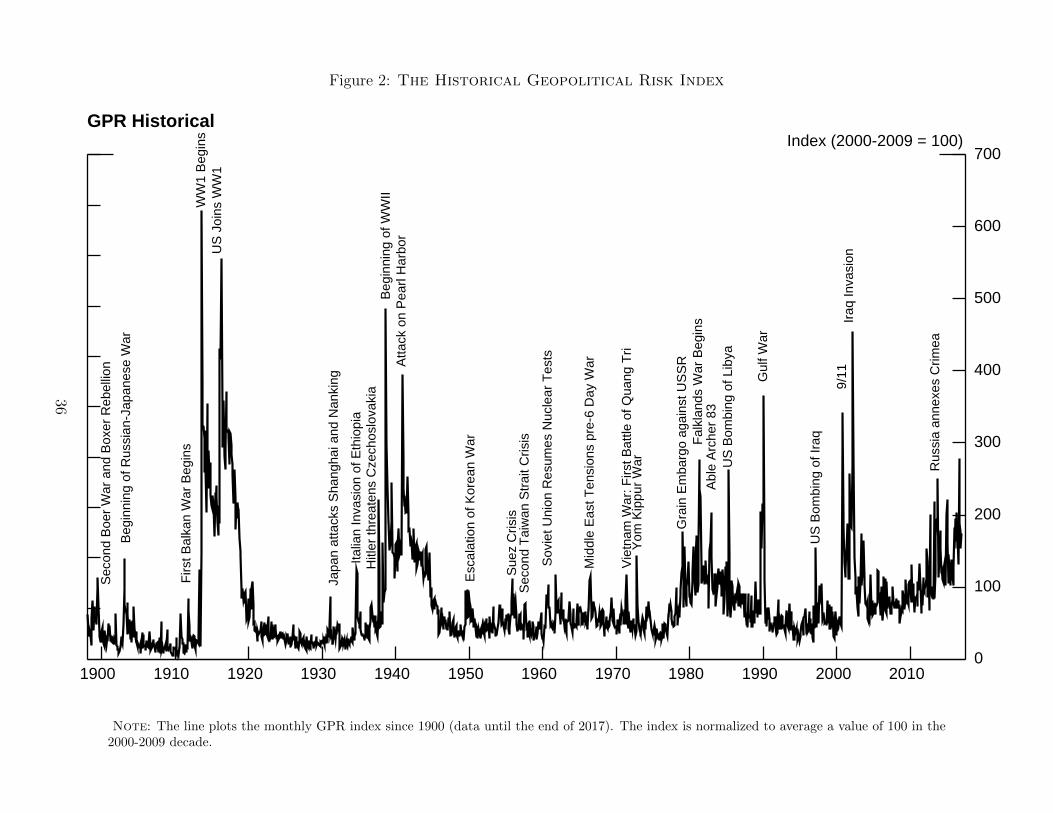
Figure 2: The Historical Geopolitical Risk Index
0
100
200
300
400
500
600
700
1900 1910 1920 1930 1940 1950 1960 1970 1980 1990 2000 2010
GPR HistoricalIndex (2000-2009 = 100)
Sec
ond
Boe
r W
ar a
nd B
oxer
Reb
ellio
n
Beg
inni
ng o
f Rus
sian
-Jap
anes
e W
ar
Firs
t Bal
kan
War
Beg
ins
WW
1 B
egin
sU
S J
oins
WW
1
Japa
n at
tack
s S
hang
hai a
nd N
anki
ng
Italia
n In
vasi
on o
f Eth
iopi
aH
itler
thre
aten
s C
zech
oslo
vaki
aB
egin
ning
of W
WII
Atta
ck o
n P
earl
Har
bor
Esc
alat
ion
of K
orea
n W
ar
Sue
z C
risis
Sec
ond
Tai
wan
Str
ait C
risis
Sov
iet U
nion
Res
umes
Nuc
lear
Tes
ts
Mid
dle
Eas
t Ten
sion
s pr
e-6
Day
War
Vie
tnam
War
: Firs
t Bat
tle o
f Qua
ng T
riY
om K
ippu
r W
ar
Gra
in E
mba
rgo
agai
nst U
SS
RF
alkl
ands
War
Beg
ins
Abl
e A
rche
r 83
US
Bom
bing
of L
ibya
Gul
f War
US
Bom
bing
of I
raq
9/11
Iraq
Inva
sion
Rus
sia
anne
xes
Crim
ea
Note: The line plots the monthly GPR index since 1900 (data until the end of 2017). The index is normalized to average a value of 100 in the2000-2009 decade.
36
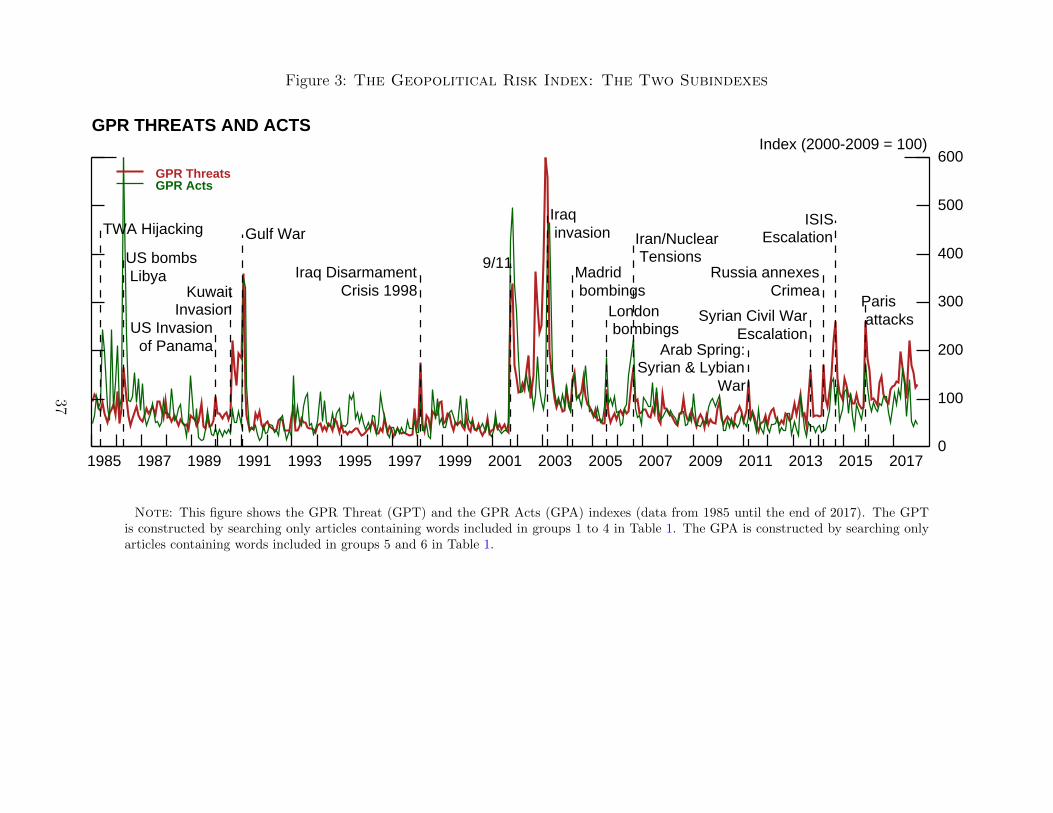
Figure 3: The Geopolitical Risk Index: The Two Subindexes
0
100
200
300
400
500
600
1985 1987 1989 1991 1993 1995 1997 1999 2001 2003 2005 2007 2009 2011 2013 2015 2017
GPR THREATS AND ACTSIndex (2000-2009 = 100)
GPR Threats GPR Acts
TWA Hijacking
US bombs Libya
US Invasion of Panama
Kuwait Invasion
Gulf War
Iraq Disarmament Crisis 1998
9/11
Iraq invasion
Madrid bombings
London bombings
Iran/Nuclear Tensions
Arab Spring: Syrian & Lybian
War
Syrian Civil War Escalation
Russia annexes Crimea
ISIS Escalation
Paris attacks
Note: This figure shows the GPR Threat (GPT) and the GPR Acts (GPA) indexes (data from 1985 until the end of 2017). The GPTis constructed by searching only articles containing words included in groups 1 to 4 in Table 1. The GPA is constructed by searching onlyarticles containing words included in groups 5 and 6 in Table 1.
37
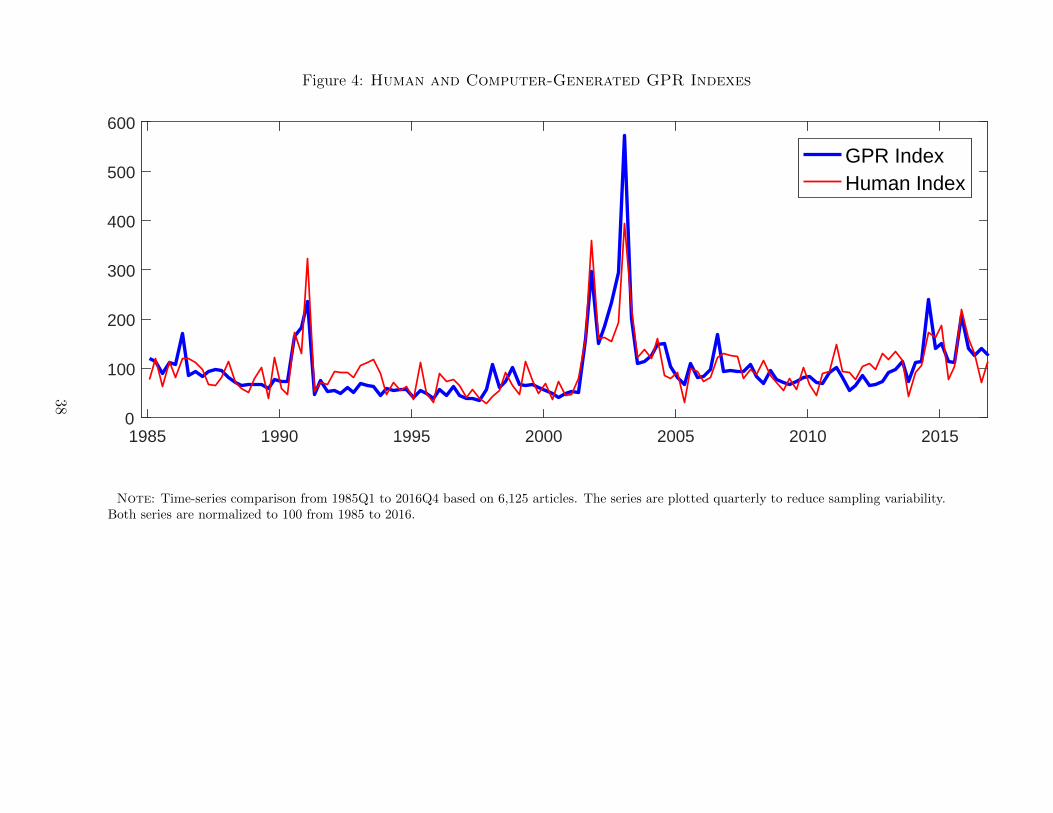
Figure 4: Human and Computer-Generated GPR Indexes
1985 1990 1995 2000 2005 2010 20150
100
200
300
400
500
600
GPR IndexHuman Index
Note: Time-series comparison from 1985Q1 to 2016Q4 based on 6,125 articles. The series are plotted quarterly to reduce sampling variability.Both series are normalized to 100 from 1985 to 2016.
38
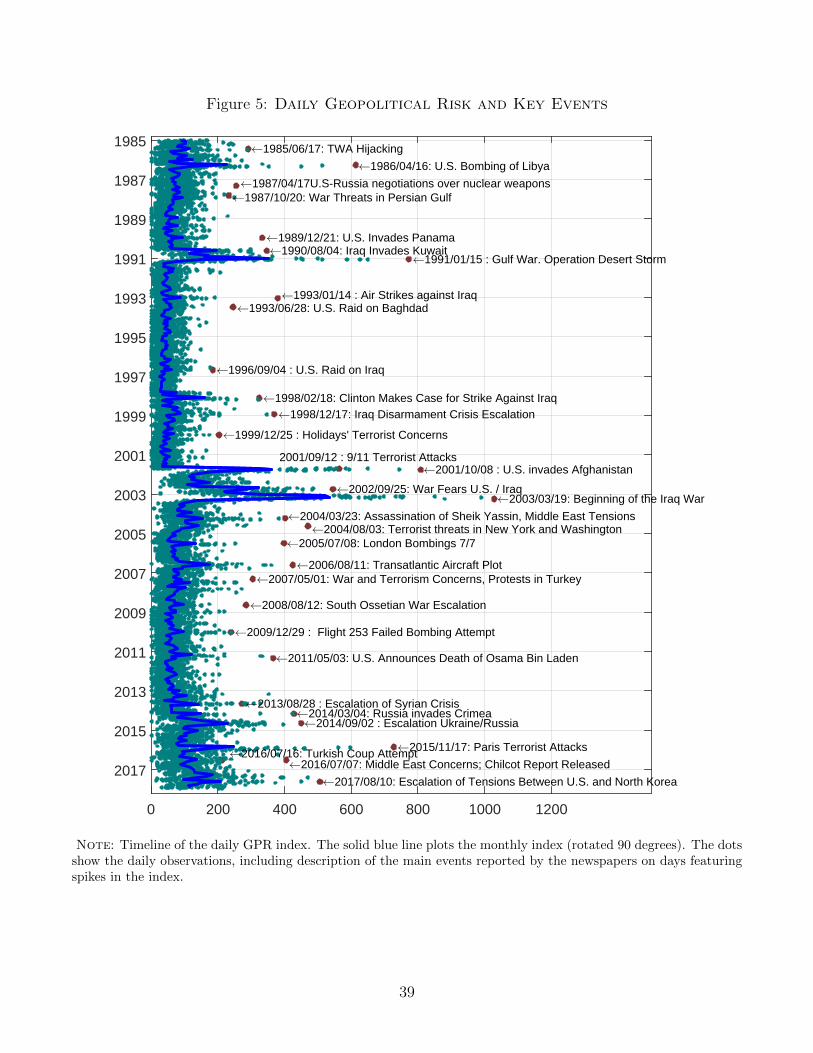
Figure 5: Daily Geopolitical Risk and Key Events
1985
1987
1989
1991
1993
1995
1997
1999
2001
2003
2005
2007
2009
2011
2013
2015
2017
0 200 400 600 800 1000 1200
A1985/06/17: TWA Hijacking
A1986/04/16: U.S. Bombing of Libya
A1987/04/17U.S-Russia negotiations over nuclear weaponsA1987/10/20: War Threats in Persian Gulf
A1989/12/21: U.S. Invades PanamaA1990/08/04: Iraq Invades Kuwait
A1991/01/15 : Gulf War. Operation Desert Storm
A1993/01/14 : Air Strikes against IraqA1993/06/28: U.S. Raid on Baghdad
A1996/09/04 : U.S. Raid on Iraq
A1998/02/18: Clinton Makes Case for Strike Against IraqA1998/12/17: Iraq Disarmament Crisis Escalation
A1999/12/25 : Holidays' Terrorist Concerns
2001/09/12 : 9/11 Terrorist AttacksA2001/10/08 : U.S. invades Afghanistan
A2002/09/25: War Fears U.S. / IraqA2003/03/19: Beginning of the Iraq War
A2004/03/23: Assassination of Sheik Yassin, Middle East TensionsA2004/08/03: Terrorist threats in New York and Washington
A2005/07/08: London Bombings 7/7
A2006/08/11: Transatlantic Aircraft PlotA2007/05/01: War and Terrorism Concerns, Protests in Turkey
A2008/08/12: South Ossetian War Escalation
A2009/12/29 : Flight 253 Failed Bombing Attempt
A2011/05/03: U.S. Announces Death of Osama Bin Laden
A2013/08/28 : Escalation of Syrian CrisisA2014/03/04: Russia invades CrimeaA2014/09/02 : Escalation Ukraine/Russia
A2015/11/17: Paris Terrorist Attacks
A2016/07/07: Middle East Concerns; Chilcot Report ReleasedA2016/07/16: Turkish Coup Attempt
A2017/08/10: Escalation of Tensions Between U.S. and North Korea
Note: Timeline of the daily GPR index. The solid blue line plots the monthly index (rotated 90 degrees). The dotsshow the daily observations, including description of the main events reported by the newspapers on days featuringspikes in the index.
39
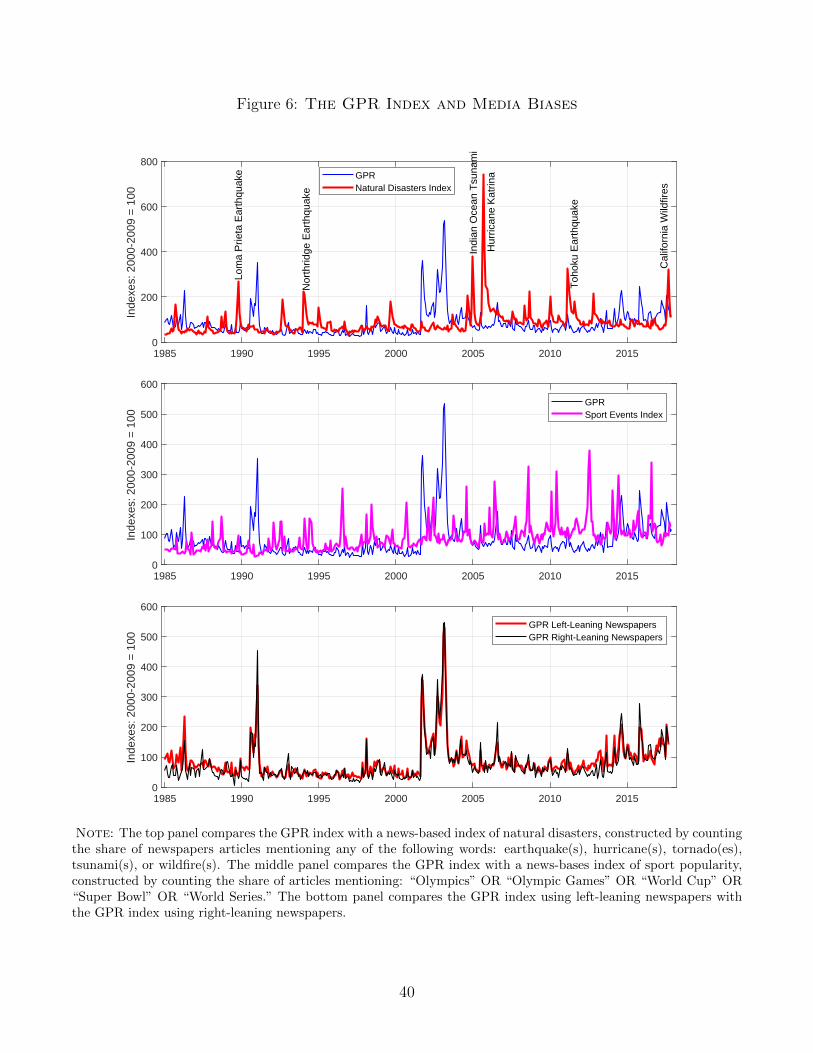
Figure 6: The GPR Index and Media Biases
1985 1990 1995 2000 2005 2010 20150
200
400
600
800
Inde
xes:
200
0-20
09 =
100
Hur
rican
e K
atrin
a
Lom
a P
rieta
Ear
thqu
ake
Nor
thrid
ge E
arth
quak
e
Indi
an O
cean
Tsu
nam
i
Toh
oku
Ear
thqu
ake
Cal
iforn
ia W
ildfir
es
GPRNatural Disasters Index
1985 1990 1995 2000 2005 2010 20150
100
200
300
400
500
600
Inde
xes:
200
0-20
09 =
100
GPRSport Events Index
1985 1990 1995 2000 2005 2010 20150
100
200
300
400
500
600
Inde
xes:
200
0-20
09 =
100
GPR Left-Leaning NewspapersGPR Right-Leaning Newspapers
Note: The top panel compares the GPR index with a news-based index of natural disasters, constructed by countingthe share of newspapers articles mentioning any of the following words: earthquake(s), hurricane(s), tornado(es),tsunami(s), or wildfire(s). The middle panel compares the GPR index with a news-bases index of sport popularity,constructed by counting the share of articles mentioning: “Olympics” OR “Olympic Games” OR “World Cup” OR“Super Bowl” OR “World Series.” The bottom panel compares the GPR index using left-leaning newspapers withthe GPR index using right-leaning newspapers.
40
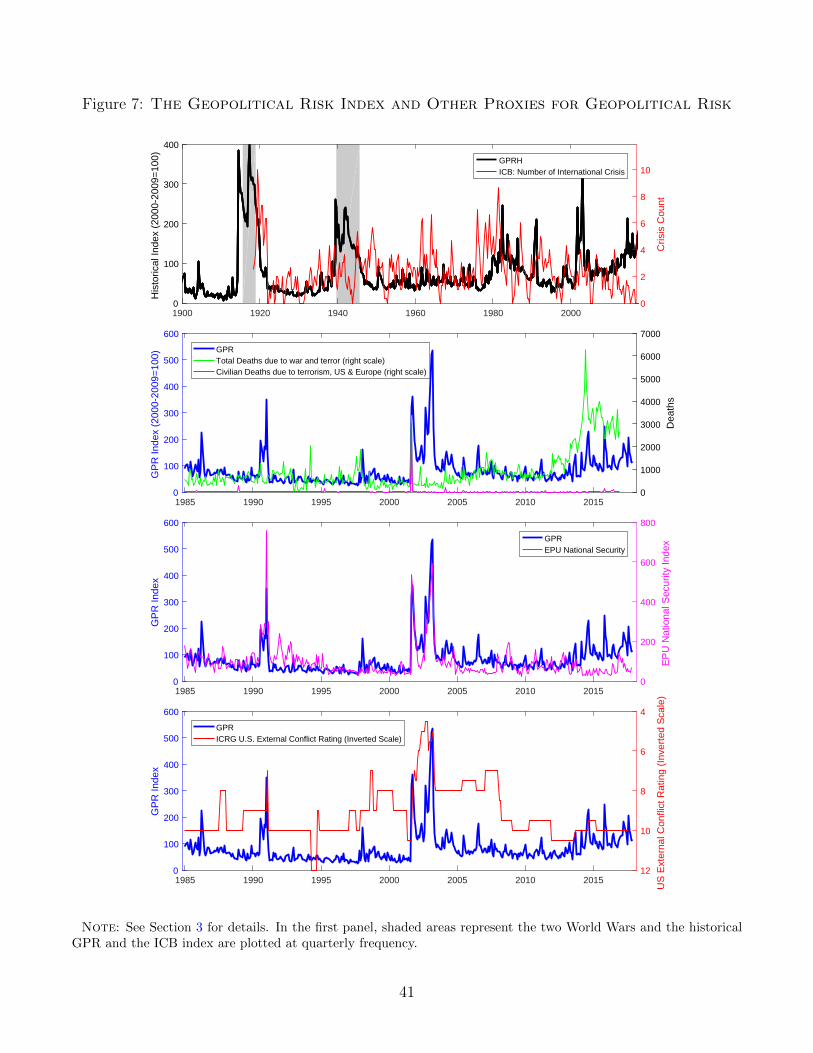
Figure 7: The Geopolitical Risk Index and Other Proxies for Geopolitical Risk
1900 1920 1940 1960 1980 20000
100
200
300
400H
isto
rical
Inde
x (2
000-
2009
=10
0)
0
2
4
6
8
10
Cris
is C
ount
GPRHICB: Number of International Crisis
1985 1990 1995 2000 2005 2010 20150
100
200
300
400
500
600
GP
R In
dex
(200
0-20
09=
100)
0
1000
2000
3000
4000
5000
6000
7000
Dea
ths
GPRTotal Deaths due to war and terror (right scale)Civilian Deaths due to terrorism, US & Europe (right scale)
1985 1990 1995 2000 2005 2010 20150
100
200
300
400
500
600
GP
R In
dex
0
200
400
600
800
EP
U N
atio
nal S
ecur
ity In
dexGPR
EPU National Security
1985 1990 1995 2000 2005 2010 20150
100
200
300
400
500
600
GP
R In
dex
4
6
8
10
12
US
Ext
erna
l Con
flict
Rat
ing
(Inv
erte
d S
cale
)
GPRICRG U.S. External Conflict Rating (Inverted Scale)
Note: See Section 3 for details. In the first panel, shaded areas represent the two World Wars and the historicalGPR and the ICB index are plotted at quarterly frequency.
41
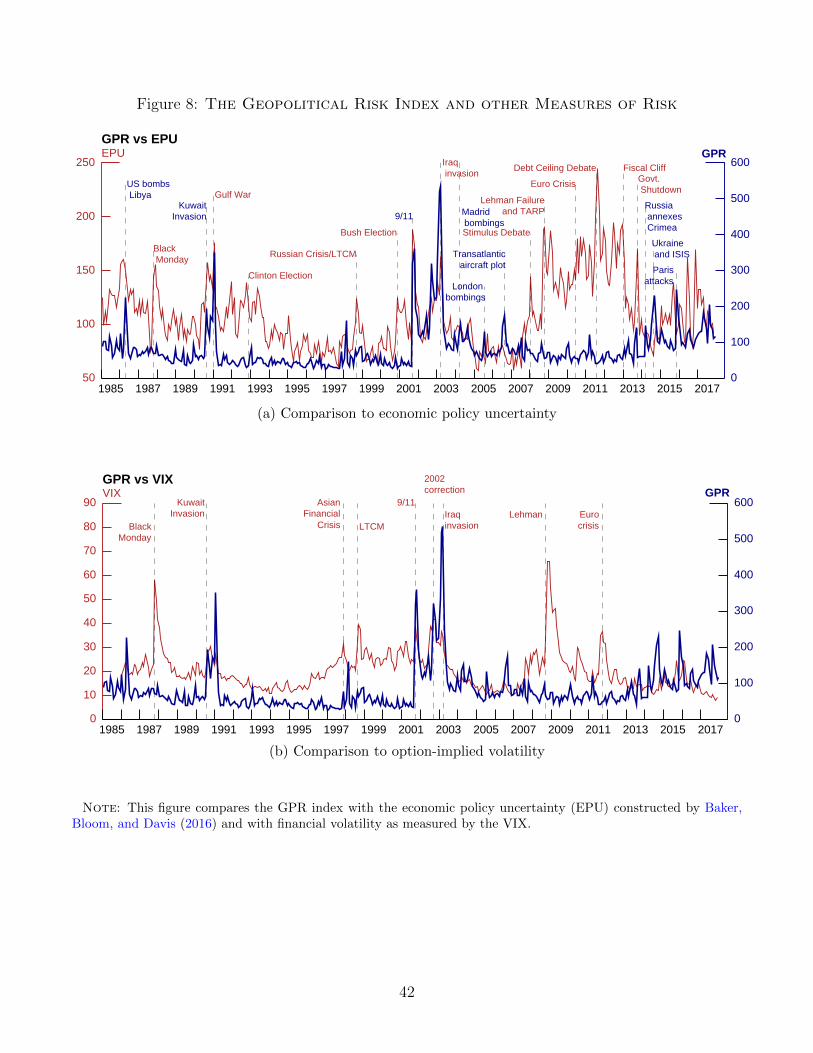
Figure 8: The Geopolitical Risk Index and other Measures of Risk
0
100
200
300
400
500
600
1985 1987 1989 1991 1993 1995 1997 1999 2001 2003 2005 2007 2009 2011 2013 2015 201750
100
150
200
250
GPR vs EPUEPU GPR
US bombs Libya
Kuwait Invasion Madrid
bombings
London bombings
Transatlanticaircraft plot
Russia annexes Crimea
Ukraine and ISIS
Paris attacks
Black Monday
Gulf War
Clinton Election
Russian Crisis/LTCM
Bush Election
9/11
Iraq invasion
Stimulus Debate
Lehman Failure and TARP
Euro Crisis
Debt Ceiling Debate Fiscal CliffGovt. Shutdown
0
100
200
300
400
500
600
1985 1987 1989 1991 1993 1995 1997 1999 2001 2003 2005 2007 2009 2011 2013 2015 20170
10
20
30
40
50
60
70
80
90
GPR vs VIXVIX GPR
BlackMonday
KuwaitInvasion
AsianFinancial
Crisis LTCM
9/11
2002correction
Iraqinvasion
Lehman Euro crisis
(a) Comparison to economic policy uncertainty
.
0
100
200
300
400
500
600
1985 1987 1989 1991 1993 1995 1997 1999 2001 2003 2005 2007 2009 2011 2013 2015 201750
100
150
200
250
GPR vs EPUEPU GPR
US bombs Libya
Kuwait Invasion Madrid
bombings
London bombings
Transatlanticaircraft plot
Russia annexes Crimea
Ukraine and ISIS
Paris attacks
Black Monday
Gulf War
Clinton Election
Russian Crisis/LTCM
Bush Election
9/11
Iraq invasion
Stimulus Debate
Lehman Failure and TARP
Euro Crisis
Debt Ceiling Debate Fiscal CliffGovt. Shutdown
0
100
200
300
400
500
600
1985 1987 1989 1991 1993 1995 1997 1999 2001 2003 2005 2007 2009 2011 2013 2015 20170
10
20
30
40
50
60
70
80
90
GPR vs VIXVIX GPR
BlackMonday
KuwaitInvasion
AsianFinancial
Crisis LTCM
9/11
2002correction
Iraqinvasion
Lehman Euro crisis
(b) Comparison to option-implied volatility
Note: This figure compares the GPR index with the economic policy uncertainty (EPU) constructed by Baker,Bloom, and Davis (2016) and with financial volatility as measured by the VIX.
42
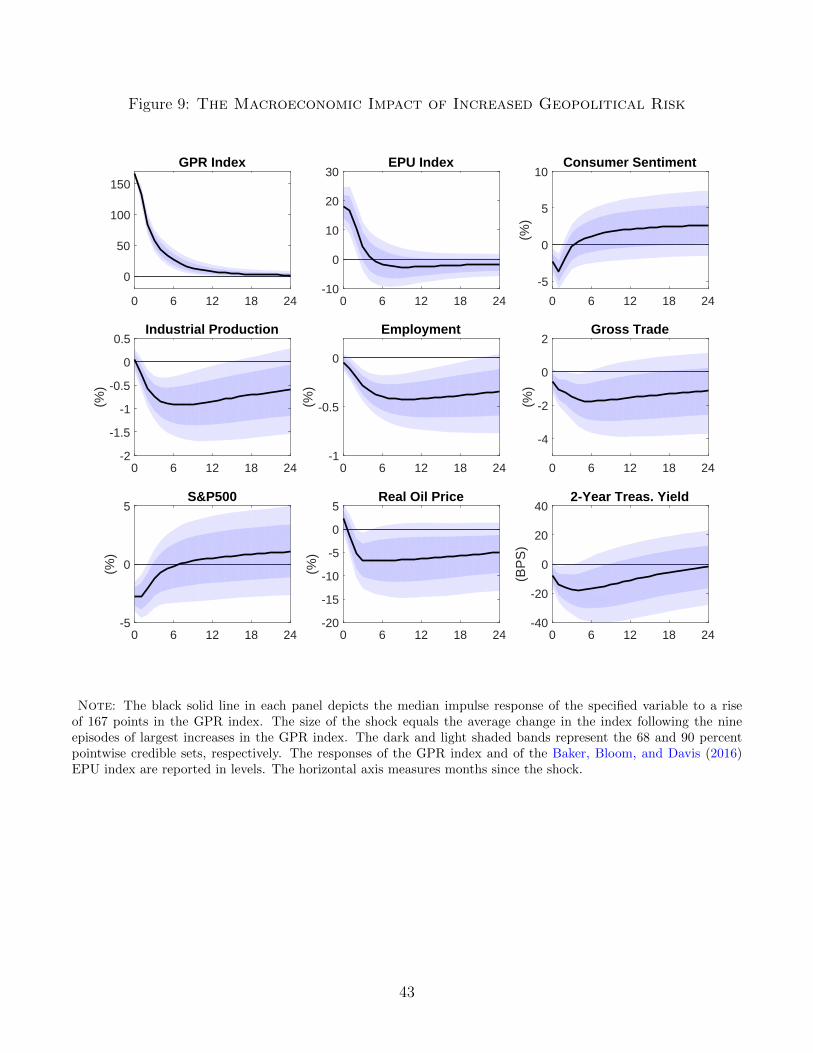
Figure 9: The Macroeconomic Impact of Increased Geopolitical Risk
0 6 12 18 24
0
50
100
150
GPR Index
0 6 12 18 24-10
0
10
20
30EPU Index
0 6 12 18 24
-5
0
5
10
(%)
Consumer Sentiment
0 6 12 18 24-2
-1.5
-1
-0.5
0
0.5
(%)
Industrial Production
0 6 12 18 24-1
-0.5
0
(%)
Employment
0 6 12 18 24
-4
-2
0
2
(%)
Gross Trade
0 6 12 18 24-5
0
5
(%)
S&P500
0 6 12 18 24-20
-15
-10
-5
0
5
(%)
Real Oil Price
0 6 12 18 24-40
-20
0
20
40(B
PS
)
2-Year Treas. Yield
Note: The black solid line in each panel depicts the median impulse response of the specified variable to a riseof 167 points in the GPR index. The size of the shock equals the average change in the index following the nineepisodes of largest increases in the GPR index. The dark and light shaded bands represent the 68 and 90 percentpointwise credible sets, respectively. The responses of the GPR index and of the Baker, Bloom, and Davis (2016)EPU index are reported in levels. The horizontal axis measures months since the shock.
43
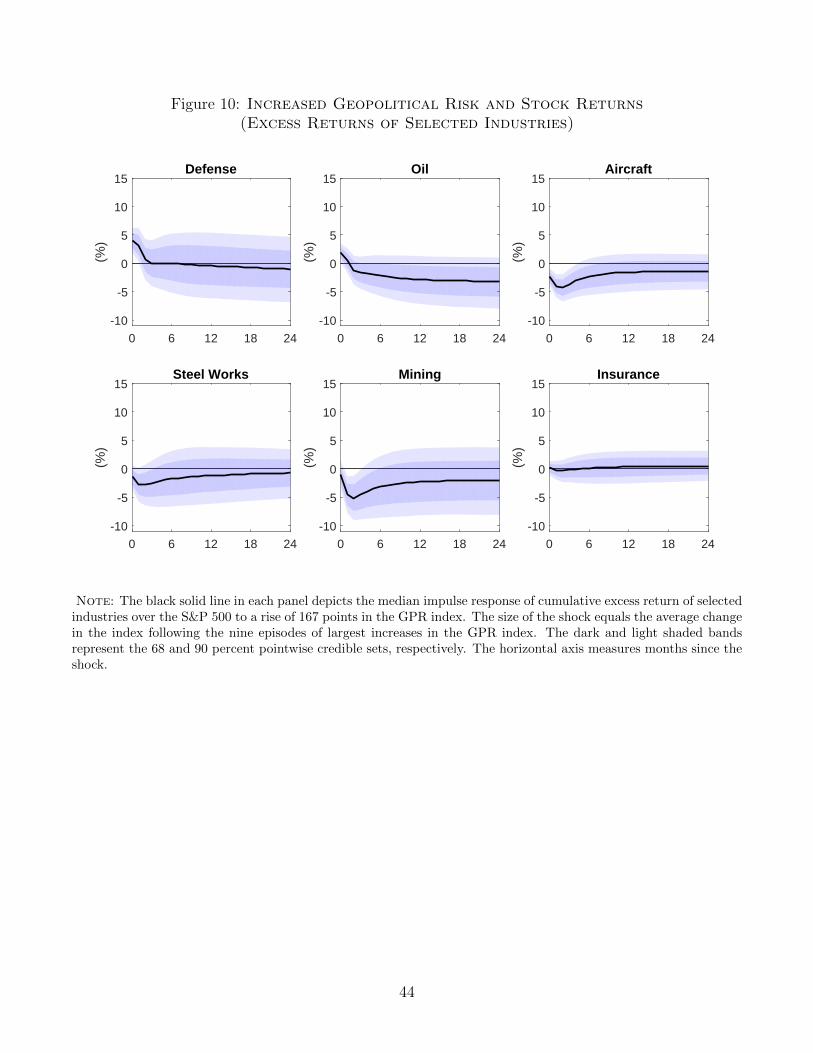
Figure 10: Increased Geopolitical Risk and Stock Returns(Excess Returns of Selected Industries)
0 6 12 18 24
-10
-5
0
5
10
15
(%)
Defense
0 6 12 18 24
-10
-5
0
5
10
15
(%)
Oil
0 6 12 18 24
-10
-5
0
5
10
15
(%)
Aircraft
0 6 12 18 24
-10
-5
0
5
10
15
(%)
Steel Works
0 6 12 18 24
-10
-5
0
5
10
15
(%)
Mining
0 6 12 18 24
-10
-5
0
5
10
15
(%)
Insurance
Note: The black solid line in each panel depicts the median impulse response of cumulative excess return of selectedindustries over the S&P 500 to a rise of 167 points in the GPR index. The size of the shock equals the average changein the index following the nine episodes of largest increases in the GPR index. The dark and light shaded bandsrepresent the 68 and 90 percent pointwise credible sets, respectively. The horizontal axis measures months since theshock.
44
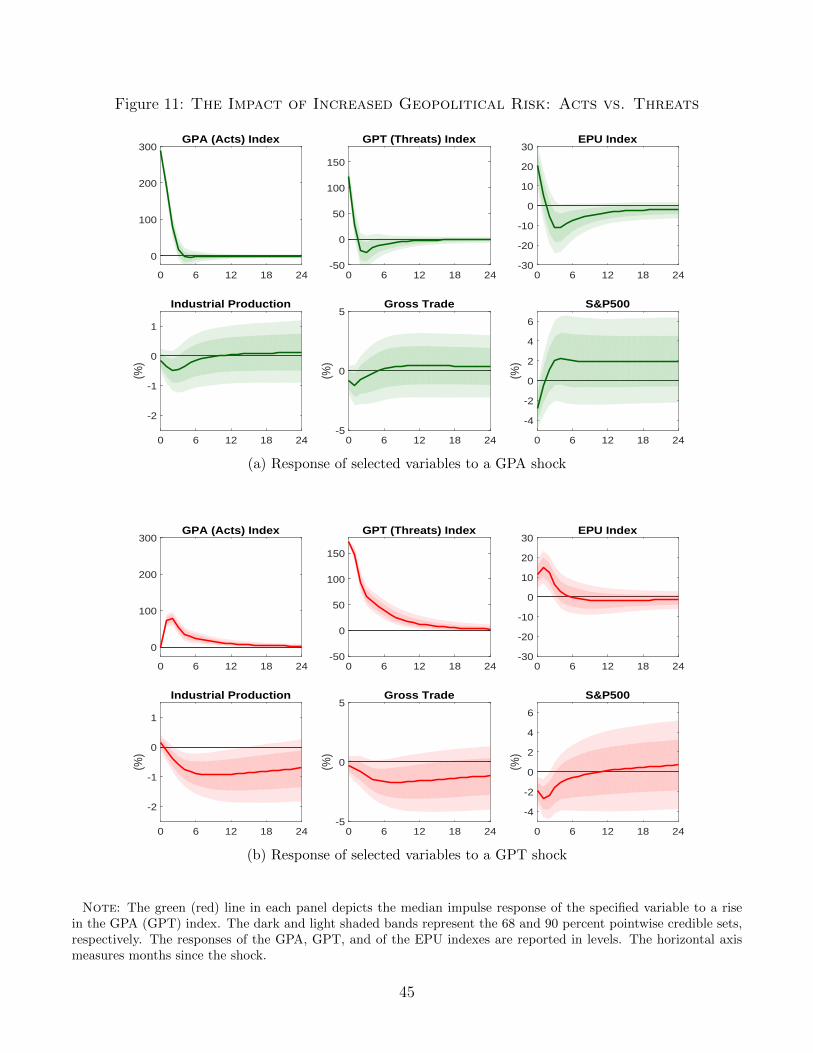
Figure 11: The Impact of Increased Geopolitical Risk: Acts vs. Threats
0 6 12 18 24
0
100
200
300GPA (Acts) Index
0 6 12 18 24-50
0
50
100
150
GPT (Threats) Index
0 6 12 18 24-30
-20
-10
0
10
20
30EPU Index
0 6 12 18 24
-2
-1
0
1
(%)
Industrial Production
0 6 12 18 24-5
0
5
(%)
Gross Trade
0 6 12 18 24
-4
-2
0
2
4
6
(%)
S&P500
(a) Response of selected variables to a GPA shock
.
0 6 12 18 24
0
100
200
300GPA (Acts) Index
0 6 12 18 24-50
0
50
100
150
GPT (Threats) Index
0 6 12 18 24-30
-20
-10
0
10
20
30EPU Index
0 6 12 18 24
-2
-1
0
1
(%)
Industrial Production
0 6 12 18 24-5
0
5
(%)
Gross Trade
0 6 12 18 24
-4
-2
0
2
4
6
(%)
S&P500
(b) Response of selected variables to a GPT shock
Note: The green (red) line in each panel depicts the median impulse response of the specified variable to a risein the GPA (GPT) index. The dark and light shaded bands represent the 68 and 90 percent pointwise credible sets,respectively. The responses of the GPA, GPT, and of the EPU indexes are reported in levels. The horizontal axismeasures months since the shock.
45
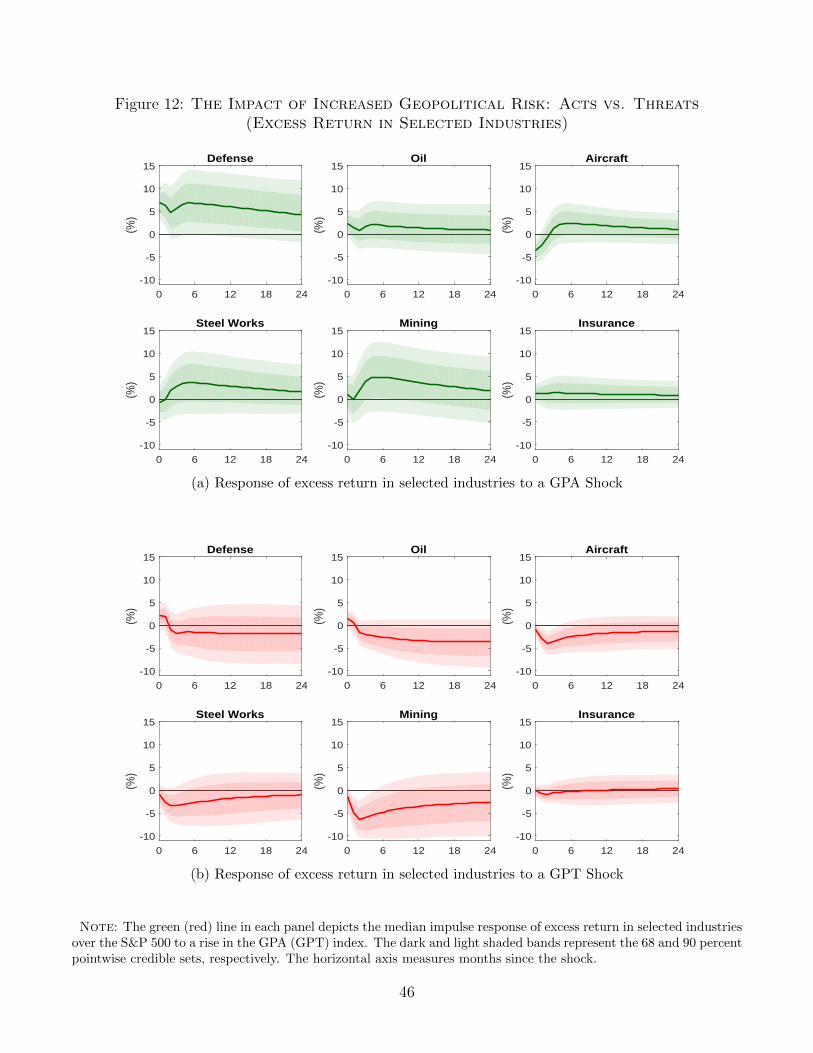
Figure 12: The Impact of Increased Geopolitical Risk: Acts vs. Threats(Excess Return in Selected Industries)
0 6 12 18 24
-10
-5
0
5
10
15
(%)
Defense
0 6 12 18 24
-10
-5
0
5
10
15
(%)
Oil
0 6 12 18 24
-10
-5
0
5
10
15
(%)
Aircraft
0 6 12 18 24
-10
-5
0
5
10
15
(%)
Steel Works
0 6 12 18 24
-10
-5
0
5
10
15(%
)Mining
0 6 12 18 24
-10
-5
0
5
10
15
(%)
Insurance
(a) Response of excess return in selected industries to a GPA Shock
.
0 6 12 18 24
-10
-5
0
5
10
15
(%)
Defense
0 6 12 18 24
-10
-5
0
5
10
15
(%)
Oil
0 6 12 18 24
-10
-5
0
5
10
15
(%)
Aircraft
0 6 12 18 24
-10
-5
0
5
10
15
(%)
Steel Works
0 6 12 18 24
-10
-5
0
5
10
15
(%)
Mining
0 6 12 18 24
-10
-5
0
5
10
15
(%)
Insurance
(b) Response of excess return in selected industries to a GPT Shock
Note: The green (red) line in each panel depicts the median impulse response of excess return in selected industriesover the S&P 500 to a rise in the GPA (GPT) index. The dark and light shaded bands represent the 68 and 90 percentpointwise credible sets, respectively. The horizontal axis measures months since the shock.
46
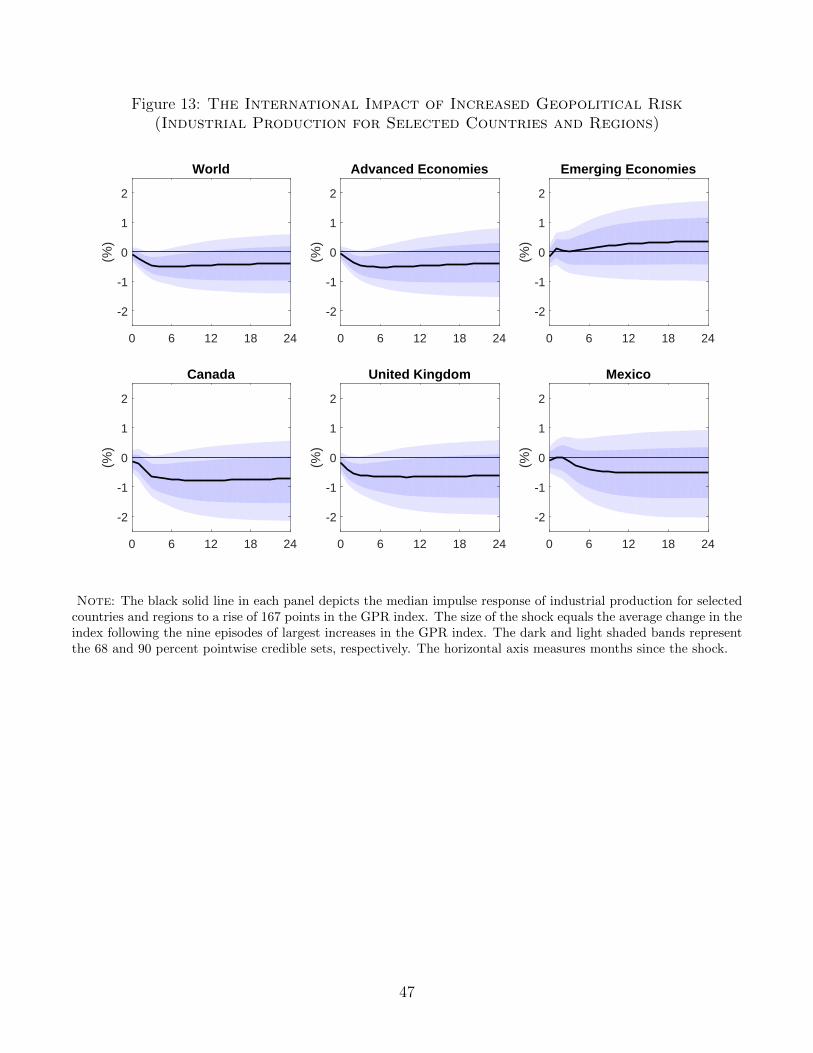
Figure 13: The International Impact of Increased Geopolitical Risk(Industrial Production for Selected Countries and Regions)
0 6 12 18 24
-2
-1
0
1
2
(%)
World
0 6 12 18 24
-2
-1
0
1
2
(%)
Advanced Economies
0 6 12 18 24
-2
-1
0
1
2
(%)
Emerging Economies
0 6 12 18 24
-2
-1
0
1
2
(%)
Canada
0 6 12 18 24
-2
-1
0
1
2
(%)
United Kingdom
0 6 12 18 24
-2
-1
0
1
2
(%)
Mexico
Note: The black solid line in each panel depicts the median impulse response of industrial production for selectedcountries and regions to a rise of 167 points in the GPR index. The size of the shock equals the average change in theindex following the nine episodes of largest increases in the GPR index. The dark and light shaded bands representthe 68 and 90 percent pointwise credible sets, respectively. The horizontal axis measures months since the shock.
47
Appendix
A.1 Additional Details on the Construction of the GPR
Index
The benchmark geopolitical risk (GPR) index is constructed by running a search query in the
ProQuest Newsstand Database. We search the archives of the following newspapers (start date
availability in parentheses): Boston Globe (1/1/1985); Chicago Tribune (1/1/1985); The Daily Tele-
graph (4/1/1991); Financial Times (5/31/1996); The Globe and Mail (1/1/1985); The Guardian
(8/18/1992); Los Angeles Times (1/1/1985); The New York Times (1/1/1985); The Times (4/18/1992);
The Wall Street Journal (1/1/1985); and the Washington Post (1/1/1985).
Newspaper-specific indexes are shown for robustness in Figure A.2, expressed as a share of news
articles for each of the newspapers.40 As the top left panel shows, coverage of geopolitical risks
aligns with the benchmark GPR index for the three general interest newspapers that we use in
the construction of the historical index. As the top right panel shows, coverage of geopolitical
risks is slightly higher than the average for the two business newspapers in the sample, The Wall
Street Journal and the Financial Times. Coverage also lines up with the average for the two U.S.
newspapers not included in the historical index (bottom left panel). Coverage of geopolitical events
by non-U.S. general interest newspapers lines up with the average, but is slightly more volatile
(bottom right panel).
To construct our benchmark index, we run the search query shown in Figure A.8.41 The index
is the aggregate number of articles returned by the search, divided by the total number of articles,
indexed to 100 in the 2000–09 decade.
A.2 Comparison with Broader and Narrower Measures
To evaluate how the choice of search terms impacts the construction of the index, we discuss three
alternative specifications of the search terms. We plot the three resulting indexes in Figure A.5.
The broad index in constructed by combining the search words in Table 1 with the 10 bi-grams
that have the highest odds of belonging to E1 instead of E0. While the resulting search criteria
double the number of articles mentioning geopolitical risks, the broad index is highly correlated
(0.92) with the benchmark one, suggesting that the index is robust to the exclusion of expressions
that are likely to be associated with rising geopolitical tensions. The broad index exhibits a slightly
lower correlation with the human index than the benchmark index does (0.82) when the data are
aggregated at a quarterly frequency.
40 The actual indexes are a simple normalization of the articles’ share.41 We use the search tips and wild cards discussed at https://proquest.libguides.com/proquestplatform/
tips.
A.1
The narrow index excludes articles containing search terms that—in the human audit of the
set E—were often correlated with false positives. As before, we identify bi-grams that are more
likely than not to appear in E0. We then exclude from the index all the articles containing any
of these bi-grams.42 The resulting search reduces the number of articles mentioning geopolitical
risks by approximately 15 percent, but the resulting index is virtually indistinguishable from the
benchmark one (correlation 0.997), suggesting that the index is sufficiently robust to the inclusion
of words that are likely to be associated with false positives. Like the broad index, the narrow
index also exhibits a slightly lower correlation with the human index than the benchmark index
does (0.76) when the data are aggregated at quarterly frequency.
Finally, the simple index economizes on search words and is close in spirit to the methodology
of Baker, Bloom, and Davis (2016). The simple index is based on articles that, instead of belonging
to any of the six potential search categories, contain at least one word from each of two sets
of terms: the set S1, including {war OR military OR terrorism OR geopolitical}, and the set
S2, containing {risk* OR concern* OR tension* OR uncertaint* OR threat*}. The correlation
between the benchmark index and the simple GPR index is sizable, at 0.89. Although the principle
of parsimony would make this index appealing (in particular, this index has the same quarterly
correlation with the human index, at 0.84), we prefer the benchmark index because, among other
things, it showed a lower error rate in pilot audits, and because it affords a natural decomposition
into several search subcategories that is not afforded by the simple index.
A.3 Saiz and Simonsohn (2013) Checks
Saiz and Simonsohn (2013) state a number of conditions that must hold to obtain useful document-
frequency based proxies for variables, such as geopolitical risk, that are otherwise difficult to mea-
sure. Our audit, among other things, makes sure that these conditions are indeed satisfied in our
application. We provide a point-by-point discussion on how we perform these data checks below.
1. We verify that our search terms are more likely to be used when geopolitical risk is high than
when it is low (Data check 1: Do the different queries maintain the phenomenon and keyword
constant?, and Data check 3: Is the keyword employed predominately to discuss the occurrence
rather than non-occurrence of phenomenon? ). Across all the documents in our human audit,
we found that 86 percent of articles measure high geopolitical risk, whereas only 4.3 percent
of these articles measure declining tensions. We therefore conclude that increases in GPR are
far more likely to lead to the use of our preferred search terms.
42 Our benchmark index already excludes expressions that in our first audit were often associated with false pos-itives, like “civil war” and “human rights” , as well as words like movie, museum, anniversary, memorial and art.The additional bigrams that exclude an article from the count in the narrow index are “air force,” “death penalty,”“national guard,” “supreme court,” “justice department,” “enemy combatant,” “military commission,” “militarytribunal,” “military civilian,” “military loss,” “defense department,” “chief of staff,” “law enforcement,” and “warcrime.” These bigrams were found to have odds of belonging to set E1 instead of set E0 of less than 40 percent.
A.2
2. The GPR index is a frequency, thus satisfying data check 2 (Data check 2. Is the variable
being proxied a frequency? ).
3. We verify that the average number of documents found is large enough for variation to be
driven by factors other than sampling error (Data check 4: Is the average number of documents
found large enough [...]? ). In particular, we verify that spikes in GPR are easily attributable
to well-defined historical events at both a monthly and at daily frequency. For instance,
the monthly data show that our index spikes in April 1986, mostly following the events
that culminated with U.S. air strikes against Libya on April 15. However, the index also
spikes, within the month, on April 8, when the United States accused Muammar el-Qaddafi
of sponsoring terrorist acts aimed at Americans (such as the Berlin discotheque bombing
which occurred on April 5). It also spikes on April 18, when British police found a bomb in
a bag that was taken onto an El Al aircraft.
4. We verify that measurement error is low enough (Data check 3, and Data check 5: Is the
expected variance in the occurrence-frequency of interest high enough to overcome the noise
associated with document-frequency proxying? ), by choosing combinations of search terms
that—unlike with a single keyword or a bi-gram—are unlikely to be used outside of the realm
of rising geopolitical risk. For instance, a naıve geopolitical risk index that merely counts the
share of articles containing geopolitics, war, military, or terrorism/t is nearly as high in March
1991 as in January 1991, whereas the benchmark GPR index is four times lower in March
1991 than in January 1991. This occurs because the naıve index fails to account for the fact
that many articles comment on the aftermath of the Gulf War, but do not explicitly mention
rising threats or risks, something that our index takes into account.
5. We construct and examine broad and narrow versions of the index around the benchmark
index, thus satisfying data check number 5.
6. Because our interest as economists is to look at the economic effects of higher geopolitical
risk, we need to guard against the possibility that words related to geopolitical tensions are
more likely to be mechanically used during, say, recessions, even if recessions are caused by
geopolitical tensions. To address this concern, we construct a version of the GPR index
that excludes the search terms “economy” OR “stock market*” OR “financial market*” OR
“stock price*.” Figure A.6 plots the resulting index. Although 19 percent of articles in GPR
are filtered out once this criterion is included, the resulting index is indistinguishable from the
benchmark index (their correlation is 0.989). Additionally, the share of articles in the GPR
index mentioning economic words is uncorrelated with real outcomes (the correlation with the
change in log industrial production is 0.03), thus allaying concerns that an omitted variable
biases the results both “geopolitical risk” and economic outcomes (Data check 6: [...] Does
the chosen keyword have as its primary or only meaning the occurrence of the phenomenon
of interest?, and Data check 7: [...] Does the chosen keyword also result in documents related
to the covariates of the occurrence of interest? ).
A.3
7. In robustness checks, we use the naıve index as a placebo document-frequency variable in
our vector autoregression (VAR) analysis. In particular, there is the possibility that it is not
geopolitical risks per se that are bad, but that the overall tendency to discuss geopolitical
events rises during recessions. We show that adding the naıve index to the VAR does not
change the predictive power of GPR in the VAR. (Data check 8: Are there plausible omitted
variables that may be correlated both with the document-frequency and its covariates? )
A.4 Robustness of VAR Results
The effects of the GPR shock are robust to a number of robustness checks. First, the 9/11 terrorist
attacks are the episode that induced the largest increase in the index (the index rose to its highest
level with the Iraq War two years later, but from already elevated levels). The 9/11 terrorist attacks
were not a typical geopolitical event, as they targeted the world financial capital. Additionally, the
9/11 attacks also had a great impact on news coverage of terrorism and more broadly of geopolitical
events outside the United States. Moreover, 9/11 is potentially associated with a structural break
in the index, which remained persistently elevated after the terrorist attack. Thus, it is important
to ask whether the bulk of our results come from this single episode.
Figure A.9 reports the impulse responses to a GPR shock estimated using a VAR model that
includes dummies for September and October 2001, and another VAR model that uses a censored
version of the GPR index.43 We construct the censored GPR index by setting to zero all observations
on the GPR where the residuals from an AR(1) regression of the GPR index increase by less than
1.68 standard deviations. The resulting index, which consists of 9 episodes, captures large increases
in geopolitical risk, and gives zero weight to small variations in the index.
The impulse responses to a GPR shock in the models with the 9/11 dummies and with the
censored GPR are very similar to those from the baseline model. By censoring the GPR index, a
GPR shock induces a very temporary increase in geopolitical risk, which is zero 3 months after the
shock. The lack of persistence translates into a more muted response of the stock market index and
of corporate spreads.
Second, in Figure A.10 we explore the robustness to an alternative Cholesky ordering where we
order the GPR index last. In this case, the impact response to a GPR shock of all other variables
in the VAR is restricted to be zero. These exclusion restrictions attenuate the recessionary effects
of the shock. Nonetheless, the drop in IP and employment is economically significant, and zero is
excluded from the 90 percent credible set at the six month horizon. Similarly, the response of oil
prices remains negative for the benchmark model specification. Not surprisingly, the response of
the other variables—all fast-moving variables that quickly respond to shocks—is different compared
to the baseline. In particular, consumer sentiment and the stock market no longer drop on impact,
and their dynamic response is positive. The response of trade and the two-year Treasury yield is
also attenuated. Yet, this identification is not our benchmark precisely because, given the nature
43 We include a dummy for both September and October because news coverage of the 9/11 terrorist attacks andespecially their geopolitical implications was higher in October than in September.
A.4
of geopolitical risks, our working hypothesis is that it is more likely that consumer confidence and
stock prices drop and that the EPU increases in response to a GPR shock rather than the reverse.
At the same time, this exercise highlights that GPR shocks have independent real effects on the
U.S. economy and on oil prices despite shutting down plausible transmission channels such as EPU
and the stock market.
Finally, in Figure A.11 we show that the results are robust to replacing the EPU with the
VIX. The impulse responses are somewhat attenuated, but all responses are highly significant,
economically and statistically.
A.5
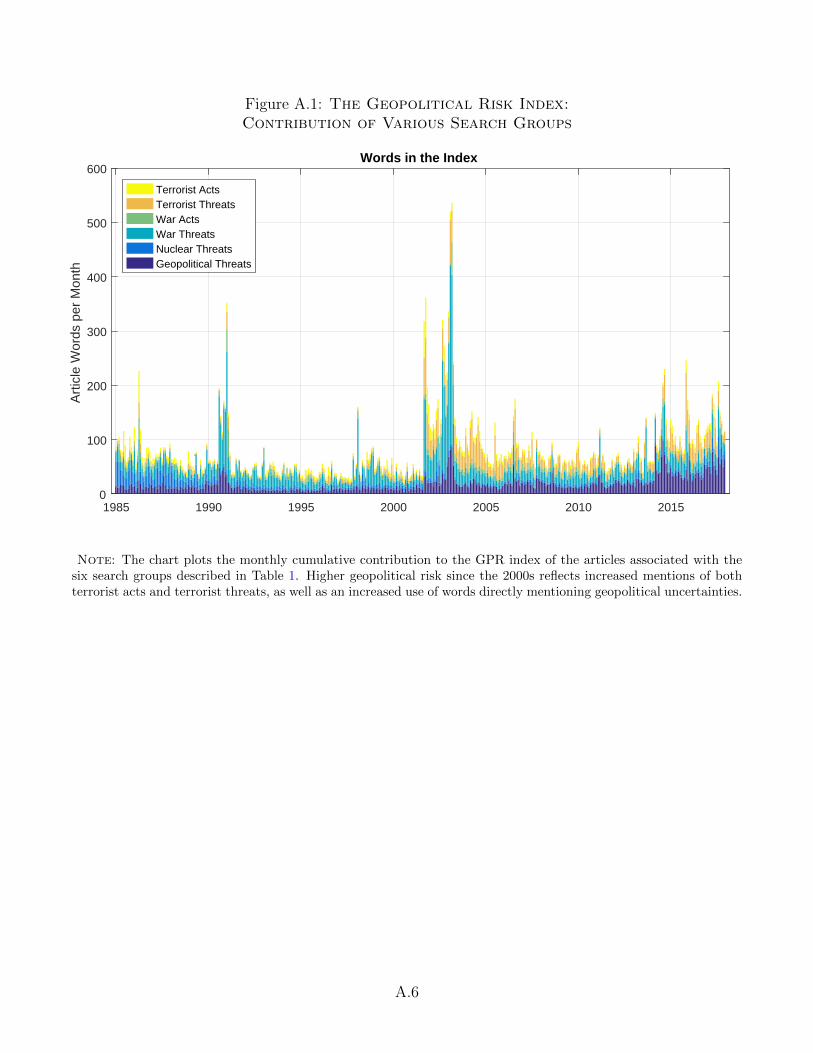
Figure A.1: The Geopolitical Risk Index:Contribution of Various Search Groups
1985 1990 1995 2000 2005 2010 20150
100
200
300
400
500
600
Art
icle
Wor
ds p
er M
onth
Words in the Index
Terrorist ActsTerrorist ThreatsWar ActsWar ThreatsNuclear ThreatsGeopolitical Threats
Note: The chart plots the monthly cumulative contribution to the GPR index of the articles associated with thesix search groups described in Table 1. Higher geopolitical risk since the 2000s reflects increased mentions of bothterrorist acts and terrorist threats, as well as an increased use of words directly mentioning geopolitical uncertainties.
A.6
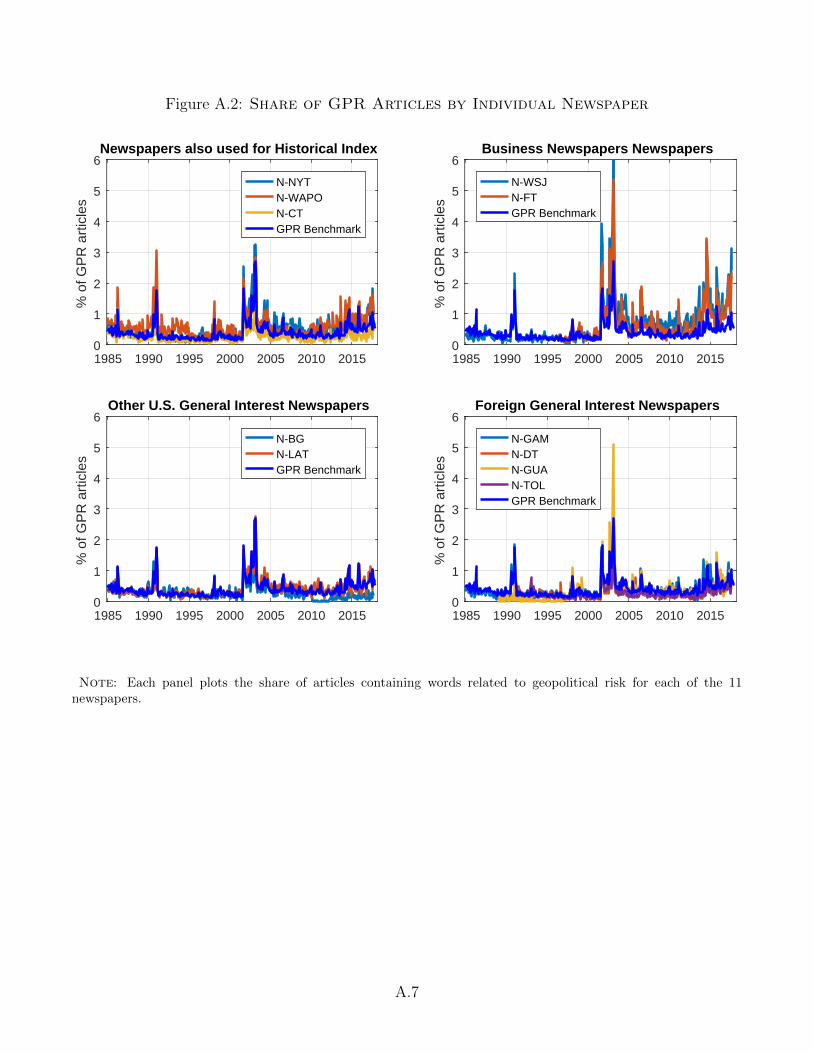
Figure A.2: Share of GPR Articles by Individual Newspaper
1985 1990 1995 2000 2005 2010 20150
1
2
3
4
5
6
% o
f GP
R a
rtic
les
Newspapers also used for Historical Index
N-NYTN-WAPON-CTGPR Benchmark
1985 1990 1995 2000 2005 2010 20150
1
2
3
4
5
6
% o
f GP
R a
rtic
les
Business Newspapers Newspapers
N-WSJN-FTGPR Benchmark
1985 1990 1995 2000 2005 2010 20150
1
2
3
4
5
6
% o
f GP
R a
rtic
les
Other U.S. General Interest Newspapers
N-BGN-LATGPR Benchmark
1985 1990 1995 2000 2005 2010 20150
1
2
3
4
5
6
% o
f GP
R a
rtic
les
Foreign General Interest Newspapers
N-GAMN-DTN-GUAN-TOLGPR Benchmark
Note: Each panel plots the share of articles containing words related to geopolitical risk for each of the 11newspapers.
A.7
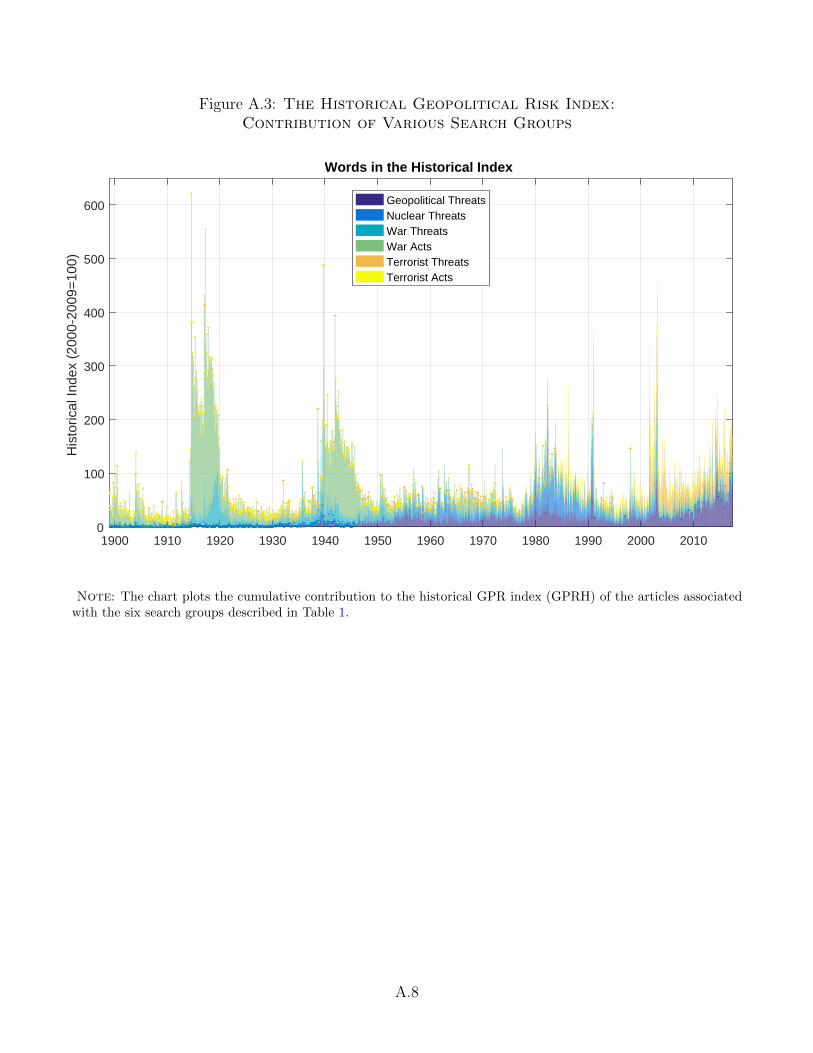
Figure A.3: The Historical Geopolitical Risk Index:Contribution of Various Search Groups
1900 1910 1920 1930 1940 1950 1960 1970 1980 1990 2000 20100
100
200
300
400
500
600
His
toric
al In
dex
(200
0-20
09=
100)
Words in the Historical Index
Geopolitical ThreatsNuclear ThreatsWar ThreatsWar ActsTerrorist ThreatsTerrorist Acts
Note: The chart plots the cumulative contribution to the historical GPR index (GPRH) of the articles associatedwith the six search groups described in Table 1.
A.8
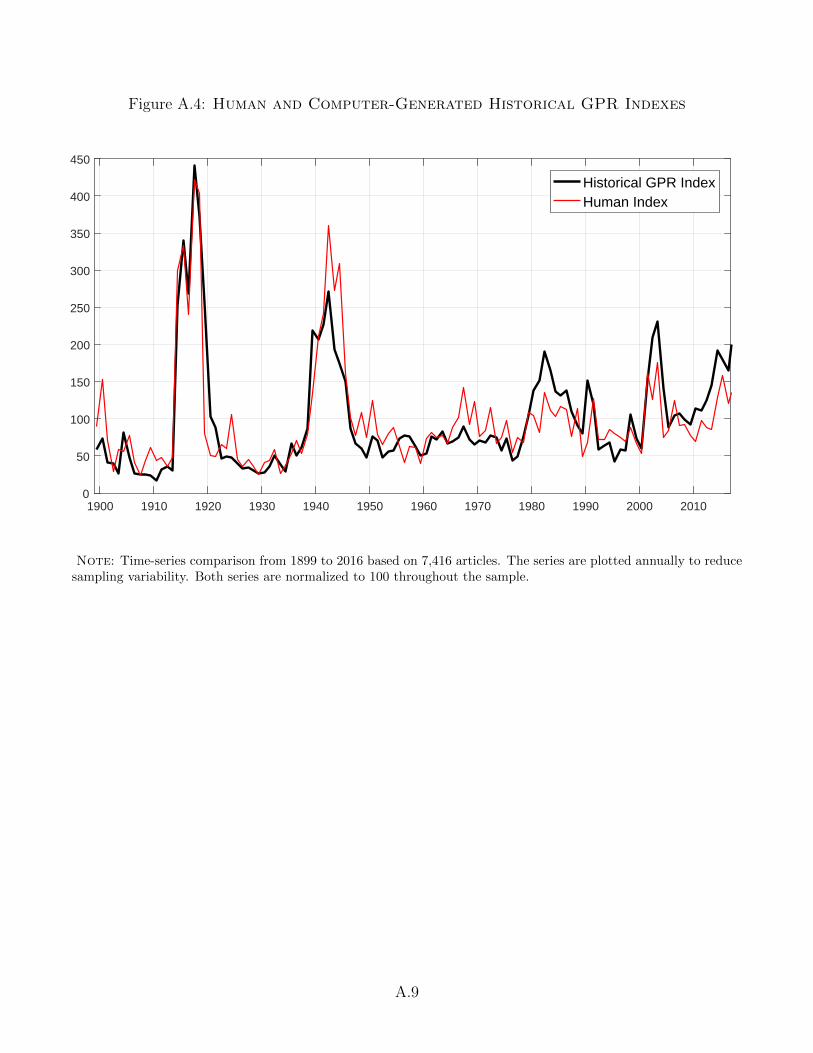
Figure A.4: Human and Computer-Generated Historical GPR Indexes
1900 1910 1920 1930 1940 1950 1960 1970 1980 1990 2000 20100
50
100
150
200
250
300
350
400
450
Historical GPR IndexHuman Index
Note: Time-series comparison from 1899 to 2016 based on 7,416 articles. The series are plotted annually to reducesampling variability. Both series are normalized to 100 throughout the sample.
A.9
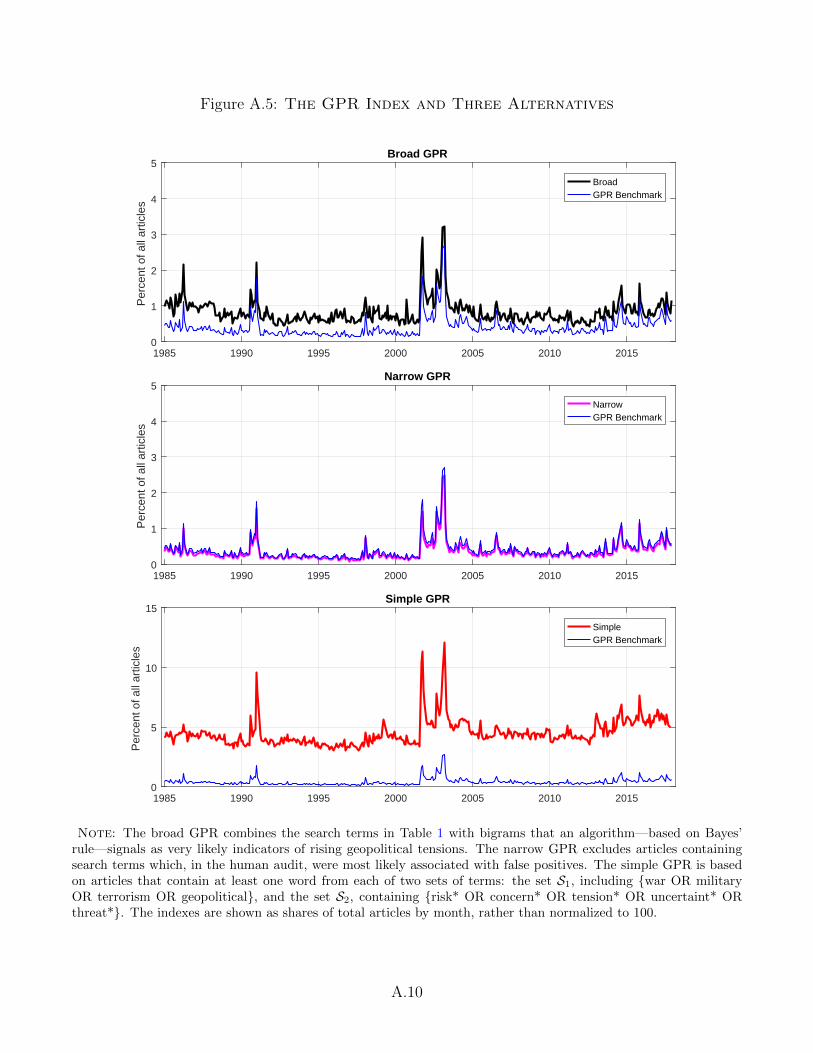
Figure A.5: The GPR Index and Three Alternatives
1985 1990 1995 2000 2005 2010 20150
1
2
3
4
5
Per
cent
of a
ll ar
ticle
sBroad GPR
BroadGPR Benchmark
1985 1990 1995 2000 2005 2010 20150
1
2
3
4
5
Per
cent
of a
ll ar
ticle
s
Narrow GPR
NarrowGPR Benchmark
1985 1990 1995 2000 2005 2010 20150
5
10
15
Per
cent
of a
ll ar
ticle
s
Simple GPR
SimpleGPR Benchmark
Note: The broad GPR combines the search terms in Table 1 with bigrams that an algorithm—based on Bayes’rule—signals as very likely indicators of rising geopolitical tensions. The narrow GPR excludes articles containingsearch terms which, in the human audit, were most likely associated with false positives. The simple GPR is basedon articles that contain at least one word from each of two sets of terms: the set S1, including {war OR militaryOR terrorism OR geopolitical}, and the set S2, containing {risk* OR concern* OR tension* OR uncertaint* ORthreat*}. The indexes are shown as shares of total articles by month, rather than normalized to 100.
A.10
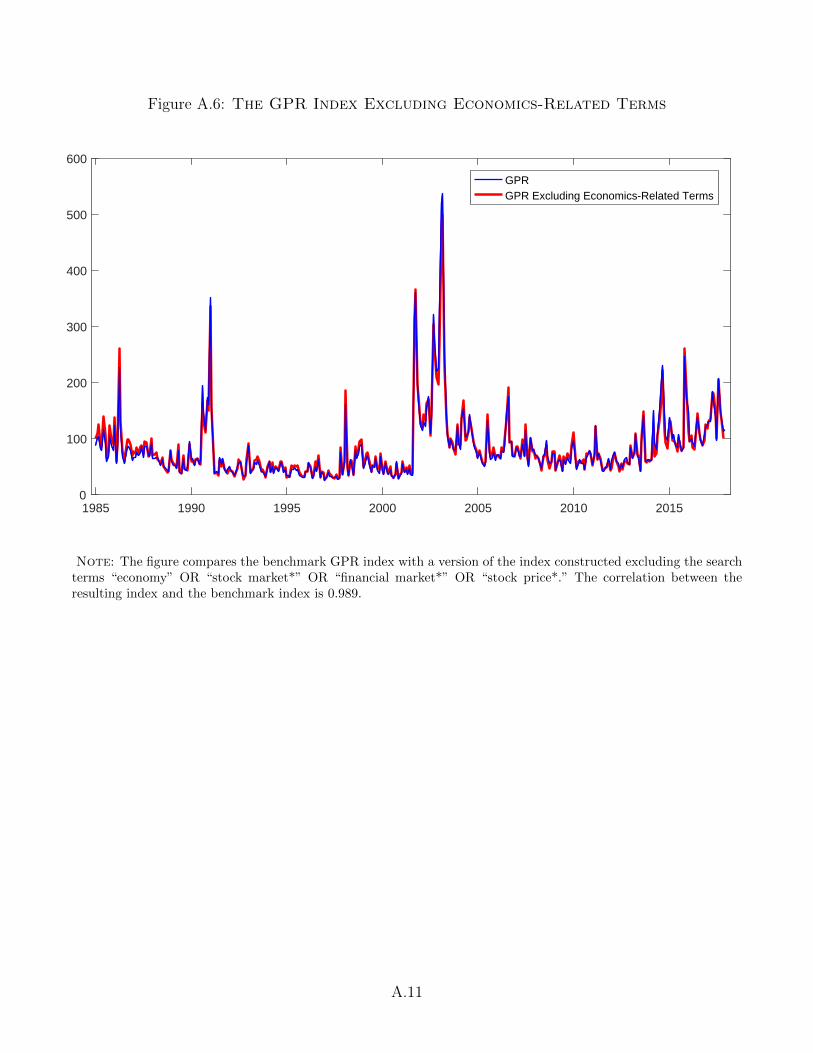
Figure A.6: The GPR Index Excluding Economics-Related Terms
1985 1990 1995 2000 2005 2010 20150
100
200
300
400
500
600
GPRGPR Excluding Economics-Related Terms
Note: The figure compares the benchmark GPR index with a version of the index constructed excluding the searchterms “economy” OR “stock market*” OR “financial market*” OR “stock price*.” The correlation between theresulting index and the benchmark index is 0.989.
A.11
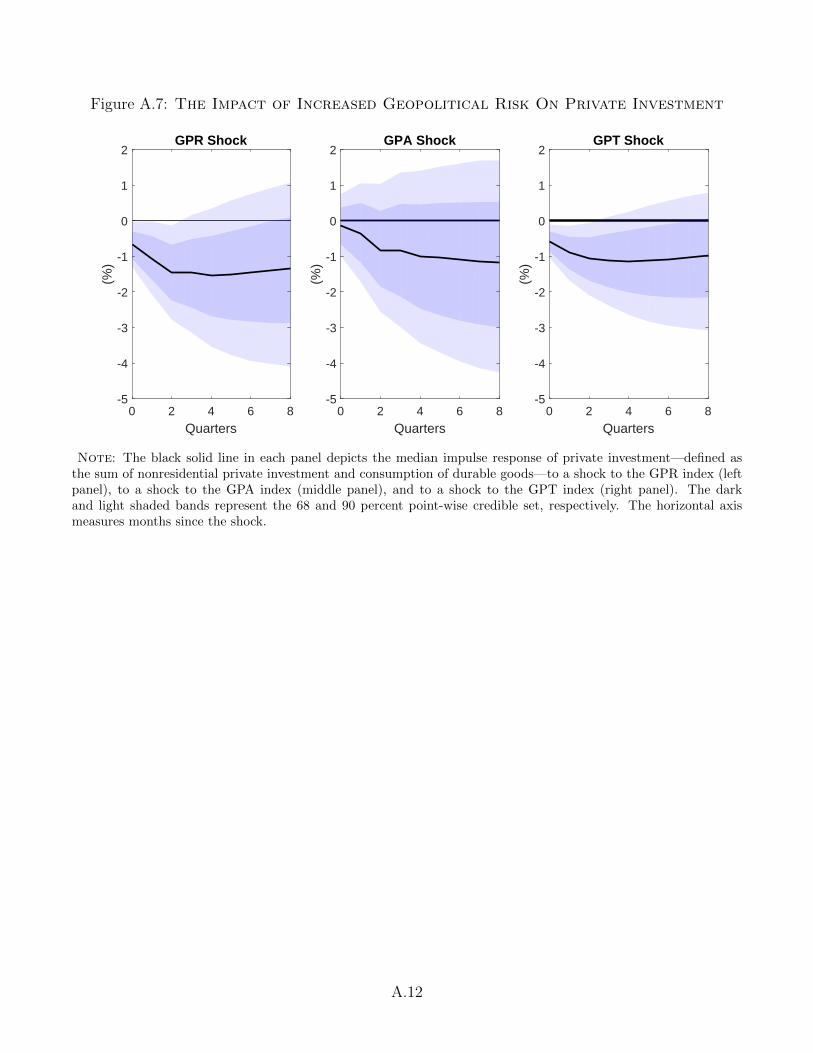
Figure A.7: The Impact of Increased Geopolitical Risk On Private Investment
0 2 4 6 8
Quarters
-5
-4
-3
-2
-1
0
1
2
(%)
GPR Shock
0 2 4 6 8
Quarters
-5
-4
-3
-2
-1
0
1
2
(%)
GPA Shock
0 2 4 6 8
Quarters
-5
-4
-3
-2
-1
0
1
2
(%)
GPT Shock
Note: The black solid line in each panel depicts the median impulse response of private investment—defined asthe sum of nonresidential private investment and consumption of durable goods—to a shock to the GPR index (leftpanel), to a shock to the GPA index (middle panel), and to a shock to the GPT index (right panel). The darkand light shaded bands represent the 68 and 90 percent point-wise credible set, respectively. The horizontal axismeasures months since the shock.
A.12
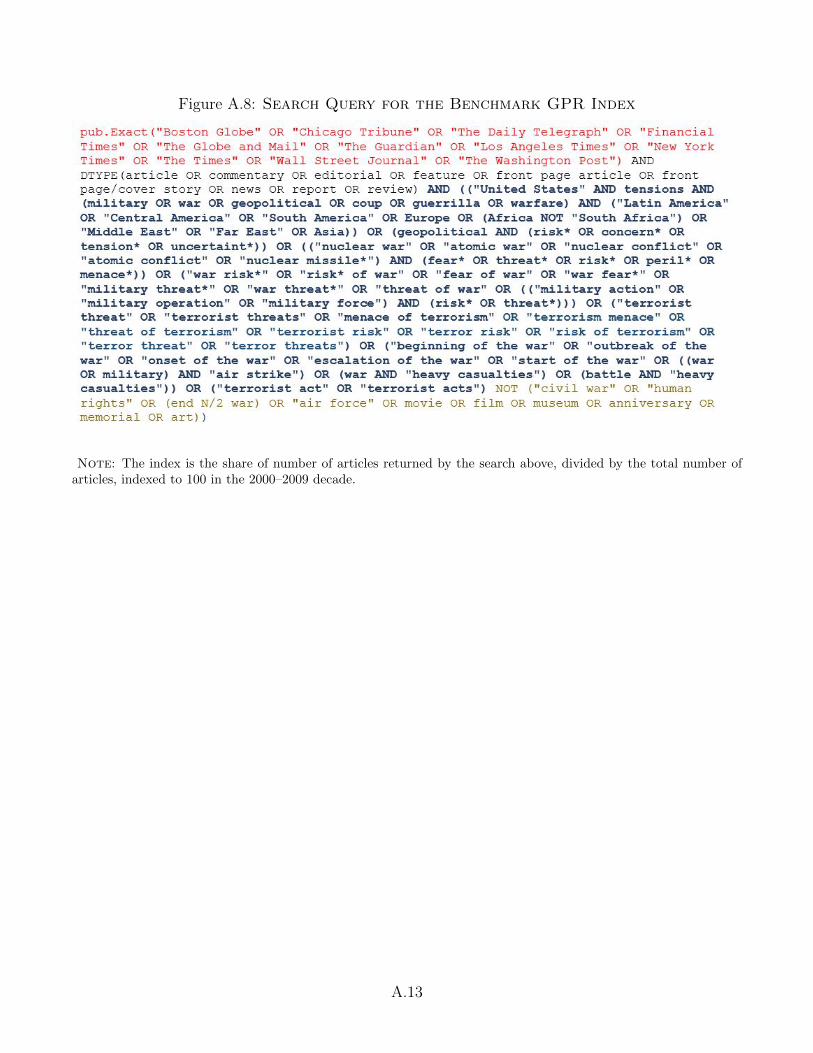
Figure A.8: Search Query for the Benchmark GPR Index
Note: The index is the share of number of articles returned by the search above, divided by the total number ofarticles, indexed to 100 in the 2000–2009 decade.
A.13
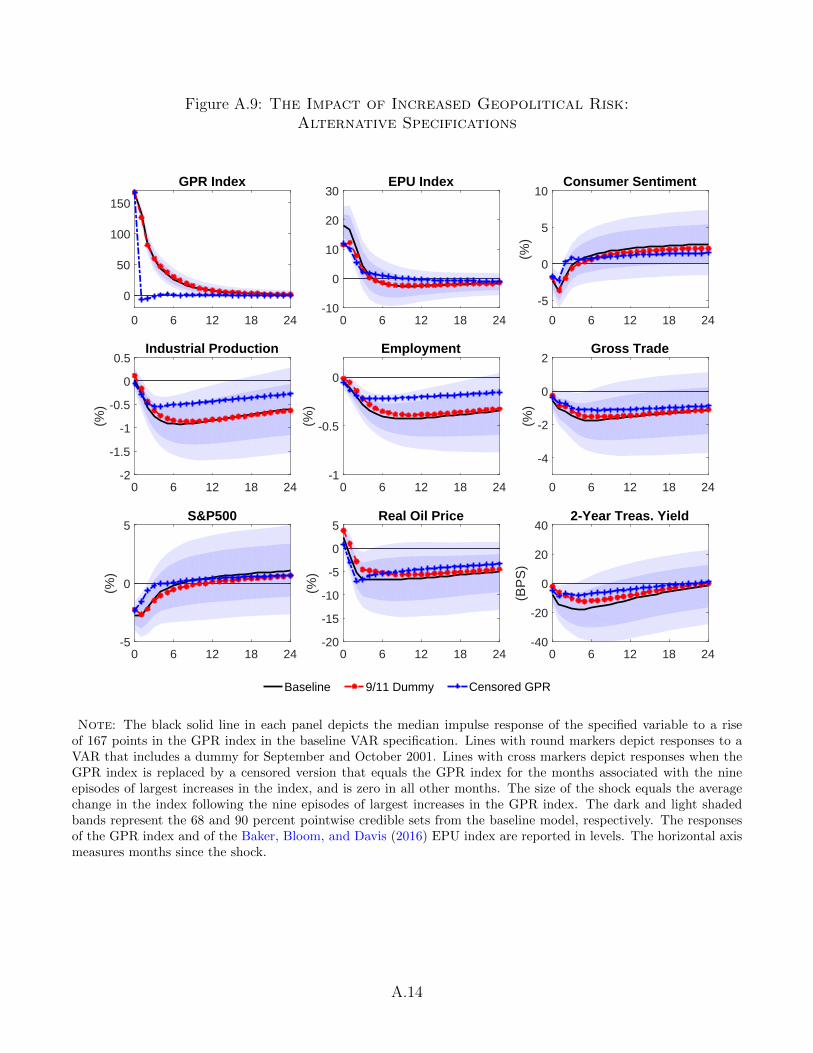
Figure A.9: The Impact of Increased Geopolitical Risk:Alternative Specifications
0 6 12 18 24
0
50
100
150
GPR Index
0 6 12 18 24-10
0
10
20
30EPU Index
0 6 12 18 24
-5
0
5
10
(%)
Consumer Sentiment
0 6 12 18 24-2
-1.5
-1
-0.5
0
0.5
(%)
Industrial Production
0 6 12 18 24-1
-0.5
0
(%)
Employment
0 6 12 18 24
-4
-2
0
2
(%)
Gross Trade
0 6 12 18 24-5
0
5
(%)
S&P500
0 6 12 18 24-20
-15
-10
-5
0
5
(%)
Real Oil Price
0 6 12 18 24-40
-20
0
20
40(B
PS
)2-Year Treas. Yield
Baseline 9/11 Dummy Censored GPR
Note: The black solid line in each panel depicts the median impulse response of the specified variable to a riseof 167 points in the GPR index in the baseline VAR specification. Lines with round markers depict responses to aVAR that includes a dummy for September and October 2001. Lines with cross markers depict responses when theGPR index is replaced by a censored version that equals the GPR index for the months associated with the nineepisodes of largest increases in the index, and is zero in all other months. The size of the shock equals the averagechange in the index following the nine episodes of largest increases in the GPR index. The dark and light shadedbands represent the 68 and 90 percent pointwise credible sets from the baseline model, respectively. The responsesof the GPR index and of the Baker, Bloom, and Davis (2016) EPU index are reported in levels. The horizontal axismeasures months since the shock.
A.14
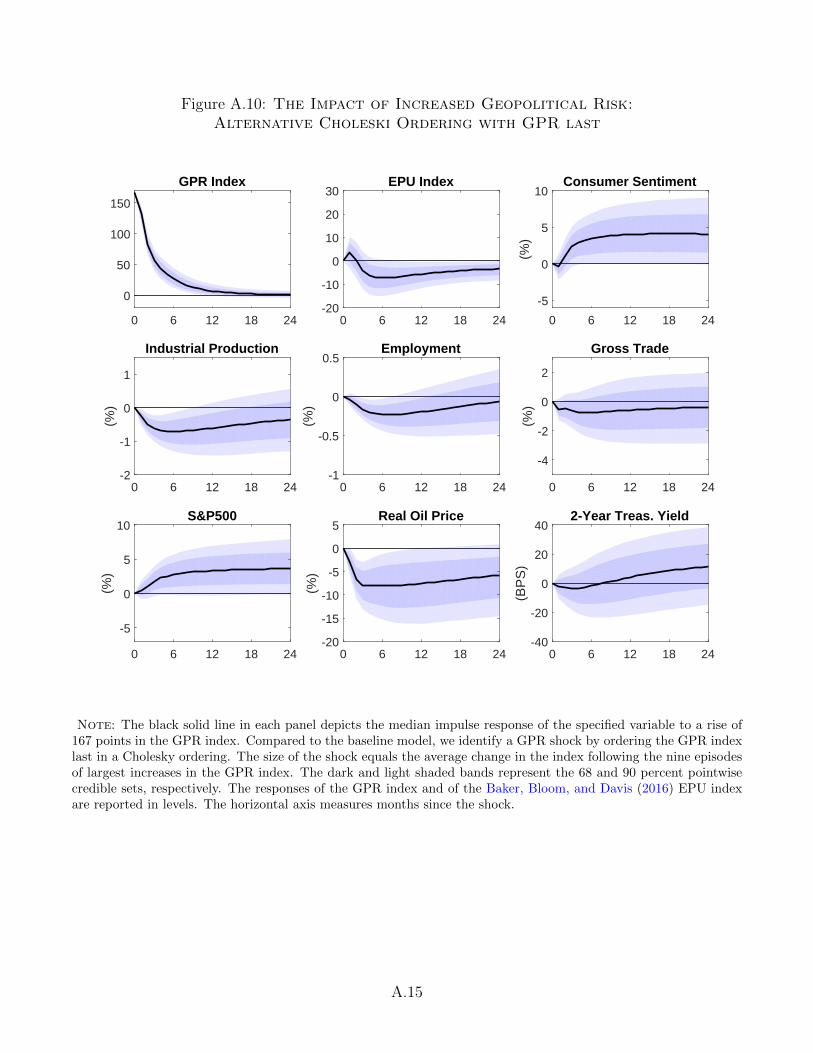
Figure A.10: The Impact of Increased Geopolitical Risk:Alternative Choleski Ordering with GPR last
0 6 12 18 24
0
50
100
150
GPR Index
0 6 12 18 24-20
-10
0
10
20
30EPU Index
0 6 12 18 24
-5
0
5
10
(%)
Consumer Sentiment
0 6 12 18 24-2
-1
0
1
(%)
Industrial Production
0 6 12 18 24-1
-0.5
0
0.5
(%)
Employment
0 6 12 18 24
-4
-2
0
2
(%)
Gross Trade
0 6 12 18 24
-5
0
5
10
(%)
S&P500
0 6 12 18 24-20
-15
-10
-5
0
5
(%)
Real Oil Price
0 6 12 18 24-40
-20
0
20
40(B
PS
)2-Year Treas. Yield
Note: The black solid line in each panel depicts the median impulse response of the specified variable to a rise of167 points in the GPR index. Compared to the baseline model, we identify a GPR shock by ordering the GPR indexlast in a Cholesky ordering. The size of the shock equals the average change in the index following the nine episodesof largest increases in the GPR index. The dark and light shaded bands represent the 68 and 90 percent pointwisecredible sets, respectively. The responses of the GPR index and of the Baker, Bloom, and Davis (2016) EPU indexare reported in levels. The horizontal axis measures months since the shock.
A.15
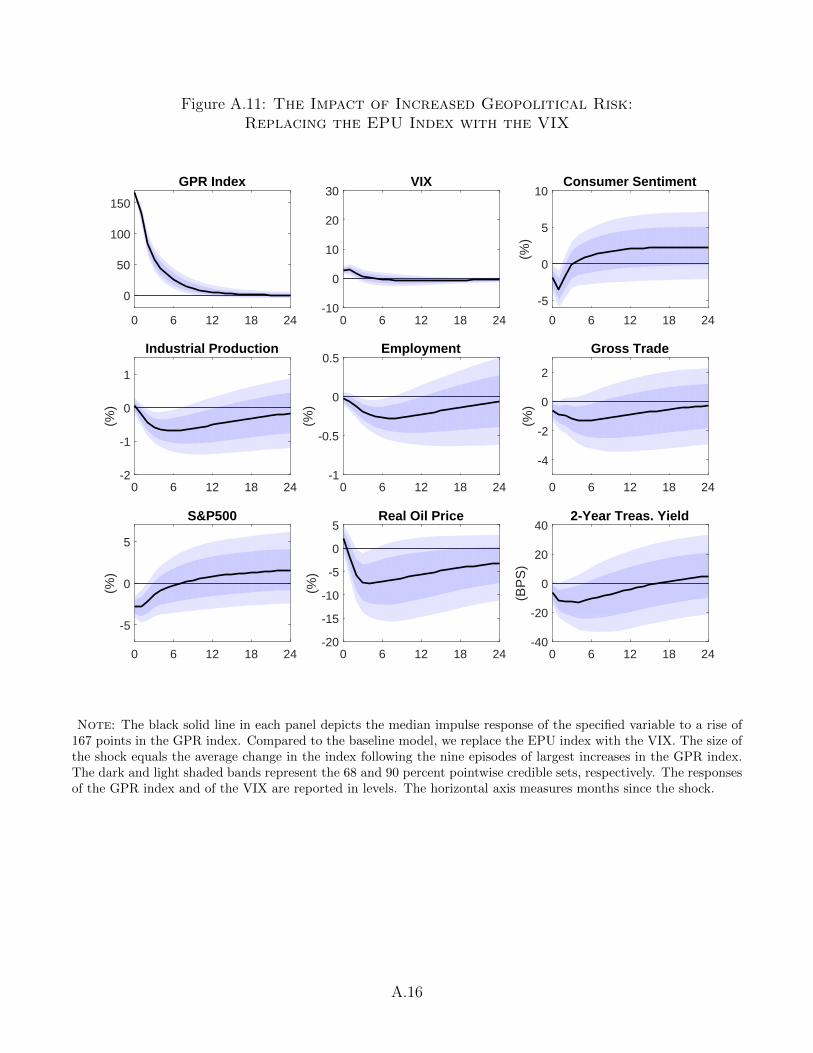
Figure A.11: The Impact of Increased Geopolitical Risk:Replacing the EPU Index with the VIX
0 6 12 18 24
0
50
100
150
GPR Index
0 6 12 18 24-10
0
10
20
30VIX
0 6 12 18 24
-5
0
5
10
(%)
Consumer Sentiment
0 6 12 18 24-2
-1
0
1
(%)
Industrial Production
0 6 12 18 24-1
-0.5
0
0.5
(%)
Employment
0 6 12 18 24
-4
-2
0
2
(%)
Gross Trade
0 6 12 18 24
-5
0
5
(%)
S&P500
0 6 12 18 24-20
-15
-10
-5
0
5
(%)
Real Oil Price
0 6 12 18 24-40
-20
0
20
40(B
PS
)2-Year Treas. Yield
Note: The black solid line in each panel depicts the median impulse response of the specified variable to a rise of167 points in the GPR index. Compared to the baseline model, we replace the EPU index with the VIX. The size ofthe shock equals the average change in the index following the nine episodes of largest increases in the GPR index.The dark and light shaded bands represent the 68 and 90 percent pointwise credible sets, respectively. The responsesof the GPR index and of the VIX are reported in levels. The horizontal axis measures months since the shock.
A.16
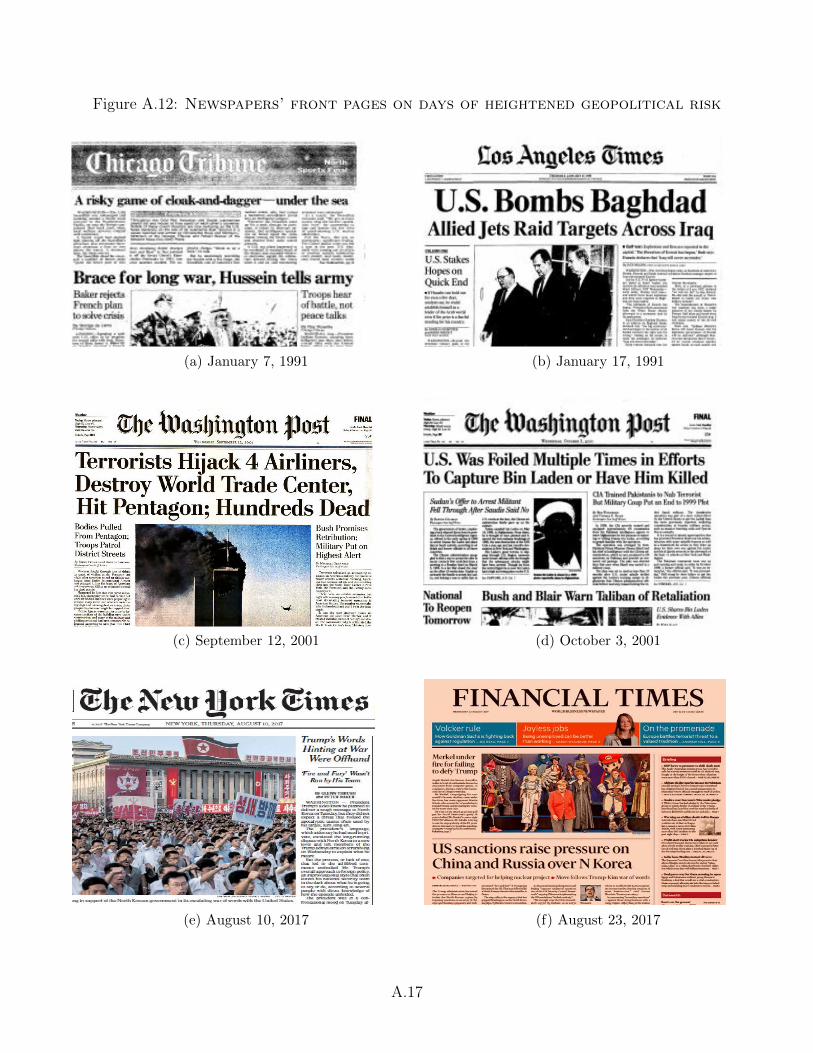
Figure A.12: Newspapers’ front pages on days of heightened geopolitical risk
(a) January 7, 1991 (b) January 17, 1991
.
(c) September 12, 2001 (d) October 3, 2001
.
(e) August 10, 2017 (f) August 23, 2017
A.17