measuring internal supply chain...
TRANSCRIPT

Measuring Internal Supply Chain Integration
Chuda Basnet Department of Management Systems
The University of Waikato Private Bag 3105
Hamilton, New Zealand 3216 [email protected]
Abstract
Internal supply chain refers to the chain of activities within a company that concludes
with providing a product to the customer. This process involves multiple functions within
companies – sales, production, and distribution. It is obvious that these functions need to be
integrated in order to provide good customer service. However, there is no consensus yet on
how integration is to be defined and measured. This paper presents research that was
conducted with the goal of developing an instrument for the measurement of internal supply
chain integration. Scale items were identified from current literature and the resulting survey
instrument was sent out to a sample of New Zealand manufacturers. Statistical analysis was
conducted to validate the instrument. We also identified three dimensions of integration
labelled coordination, communication, and affective relationship. This paper makes a
contribution towards developing a consensus in the understanding and measurement of the
integration construct.

1. Introduction
Internal supply chain refers to the chain of activities or functions (see Figure 1) within a
company that concludes with providing a product to the customer. Integration of these
functions involves holistic performance of activities across departmental boundaries. A well-
integrated internal supply chain should result in excellent customer service and company
performance.
Figure 1. Internal supply chain integration
While there is no dispute about the benefits of a well-integrated internal supply chain, there is
little consensus on what constitutes integration and how to measure integration. Some authors
have envisaged integration as coordination of functional activities, others view integration as
communication. Instruments that researchers have employed to measure integration reflect
their own definitions.
In the research reported in this paper, we identified scale items to measure internal supply
chain integration from existing research and used a survey to purify and validate the scale.
We also identified three dimensions within the integration construct – communication,
coordination, and affective relationship. The contribution of this paper is the development of
this scale for the measurement of integration, validating the instrument against a criterion,
and the identification of the three dimensions of integration. To the best of our knowledge,
this kind of investigation has not been done before in this area.
Production Sales Distribution

The next section presents a literature review, which is followed by a statement of research
objective. Then we describe our research methodology. The statistical analysis of collected
data is detailed next. In the final section, we discuss our findings and make some concluding
comments. Unless indicated otherwise by the context, the word “integration” is used to mean
internal supply chain integration throughout this paper.
2. Literature review
The advent of the concept of supply chain management has put great emphasis on supply
chain integration. It is generally accepted that supply chain integration evolves in stages
(Stevens, 1989):
Functional integration, whose focus is intra-functional, followed by
Internal supply chain integration, whose focus is inter-functional, and
External supply chain integration whose focus is inter-firm.
Giménez (2004) supported this evolution in her exploratory study of supply chain integration.
Stank et al., (2001b) also supported the link between internal and external integration. Even
though the study of internal supply chain integration is new and not numerous (Giménez,
2004; Gimenez & Ventura, 2003; Pagell, 2004), there have been many earlier studies in the
area of inter-functional integration particularly in the context of new product development
and production-marketing interface (e.g. Calantone et al., 2002; Kahn, 1996; Kahn &
Mentzer, 1996; Mollenkopf et al., 2000; Stank et al., 1999).

Most of the studies on internal integration have sought to determine the performance benefits
of integration. Chen et al. (2007) found that “marketing-logistics collaborative activities”
lead to “firm-wide integration”, which leads to “performance”. Ellinger (2000) investigated
marketing – logistics collaboration and posited that “Evaluation and reward system”, “Cross-
functional collaboration”, “Effective inter-departmental relations” and “Distribution service
performance” were serially linked. This linkage was supported by a survey and regression
analysis. Gimenez & Ventura (2003) tested the effect of internal integration and external
integration on performance, using structural equations modelling and a survey. They found
that both had positive effect on performance. Kahn & Mentzer (1998) sought to separately
identify the benefits of communication and collaboration on performance in the context of
marketing’s integration with other departments. They found significant benefits for
collaboration, but not for communication. O'Leary-Kelly & Flores (2002) studied the effect
of mediating variables on the relationship between integration and performance using survey
and regression analysis. Swimming against the current, they found that the benefit of
production – marketing integration is not always worth the cost of such integration. The costs
of integration could only be justified by examining the internal and external environment
faced by a firm.
Another stream of research on internal integration is focused on the antecedents of internal
integration. . Calantone et al. (2002) used a survey and structural equations modelling to find
that marketing’s knowledge of manufacturing and manufacturing’s evaluation of marketing
communication both had positive relationships with marketing-manufacturing integration.
Hausman et al. (2002) proposed a model linking antecedents to manufacturing-marketing
integration, and integration to profits. They found through a survey that the strategic
importance of both departments positively related to integration, and integration related to

profits. This suggested that top management should strive to view both marketing and
manufacturing as key contributors to a firm’s competitive strategy in order to boost
integration (and profits). Pagell (2004) conducted case studies to determine the factors that
foster or inhibit internal (supply chain) integration in firms. His focus was on the integration
of production, logistics, and purchasing functions. He identified the constructs influencing
integration as structure, culture, facility layout, job rotation and cross-functional teams.
Mollenkopf et al. (2000) carried out a survey in New Zealand to verify their model that
linked antecedents to inter-functional integration. Regression analysis showed that including
integration in strategic plans helps in fostering integration. Cross - training helps too, but
rewards did not prove significant in this research.
As discussed above, significant amount of research has been conducted on the performance
benefits of integration, which by and large has shown that integration is beneficial for
customer service and a company’s bottom line. A complementary theme of research, which is
less voluminous, seeks to identify antecedents of integration. This stream of research has the
ultimate goal of normatively suggesting top management what it can do to foster integration.
Many such suggestions have been made including changing the culture, job rotation,
knowledge of each other, numeration schemes, top management attitude, etc.
Even as this research on integration continues, there is no clear consensus on the definition of
integration and on the measurement of integration. Researchers have posited various
dimensions within the construct of integration, such as: communication, interaction,
coordination, collaboration, harmony, adherence to the “integrated logistics” concept,
cooperation, interfacing, and consultation.

Table 1 is a compilation of definitions of integration found in the literature. There is a wide
divergence in how authors see integration. It appears that interaction or exchange of
information is seen as a minimum part of integration. Another element is the coordination of
activities, which involves the orchestration of inter-departmental activities. A third common
element is collaboration, which involves departments working jointly.
Table 1. Definitions of integration
Reference Context Definition of integration
Adler (1995) Production & Design Coordination of design manufacturing relationship. They did not provide a definition, but they considered only coordination.
Calantone et al. (2002)
Marketing–manufacturing in new product development
Cross functional harmony; cooperation and relationship quality.
Chen et al. (2007)
Firmwide Interaction and collaboration
Crittenden (1992)
Marketing / manufacturing
Communication
Daugherty et al. (1996)
Logistics/General Adherence to the “integrated logistics” concept
Ellinger et al. (1997)
Logistics/General Integration = close coordination and central programming
Ellinger et al. (2000)
Marketing/Logistics Integration = information interchange, consultation, collaboration
Giménez (2004) Wider supply chain Coordination, collaboration, and integration
Gimenez & Ventura (2003)
Internal (purchasing, manufacturing, sales and distribution) / External integration
Interaction
Gimenez & Ventura (2005)
Wider supply chain Interaction
Griffin & Hauser (1996)
Marketing/R&D Integration = communication & cooperation
Hausman et al. (2002)
Marketing/Manufacturing Marketing/Manufacturing interface harmony—the functions’ ability to work together
Hsu & Chen (2004)
Marketing/Manufacturing Interaction ‐ congruence
Kahn (1996) Marketing/Others (Product development)
Multi‐dimensional process that subsumes interaction and collaboration. Interaction = structural, formal, routine coordinated activities like meetings, calls, documents. Collaboration = Unstructured, affective, volitional, shared process of working together.
Kahn & Mentzer (1996)
Logistics function and other functions
A process of interdepartmental interaction and interdepartmental collaboration that brings departments together into a cohesive organization; interaction = communication, collaboration = work together.
Kahn & Marketing/Others Integration = interaction = information interchange; or, Integration =

Mentzer (1998) (Product development) collaboration = high degrees of shared values, mutual goals and collaborative behaviours; or integration = composite of both
Lunn (1997) General Teamwork
Mollenkopf et al. (2000)
Marketing/Logistics Integration = dissemination of information and coordination of activities
Murphy & Poist (1992)
Logistics / Marketing Integration = cooperation, used synonymously with coordination; but cooperation was not defined.
O'Leary‐Kelly & Flores (2002)
Marketing/Manufacturing the extent to which separate parties work together in a cooperative manner to arrive at mutually acceptable outcomes
Orsini & Karagozoglu (1988)
Marketing/Service Integration = coordination = interfacing
Pagell (2004) Production/Logistics/Purchasing
Integration is a process of interaction and collaboration in which manufacturing, purchasing and logistics work together in a cooperative manner to arrive at mutually acceptable outcomes for their organization.
Sawhney & Piper (2002)
Marketing/Manufacturing Integration = interface
Stank et al. (1999)
Marketing/Logistics integration = melding together disparate areas, achieved through information sharing or collaboration or both
Stank et al. (2001a)
SCM Linking internal activities to best support customer requirements at the total system cost
Swink & Song (2007)
Marketing/Manufacturing Coordination of timing and substance of functional strategies and development activities. Communication + Cooperation
Van Hoek & Mitchell (2006)
Interdepartmental Integration = Agreement on goals and objectives
The context of our research is internal supply chain – in particular the functions of
production, sales, and distribution. A basic requirement for integration would be that these
independent functions work together. This has been emphasised by many authors in Table 1.
In arriving at a consensus definition of integration, one should also consider that supply chain
integration is often justified on the basis that the entities of a supply chain should work
holistically, trying to optimise a common outcome rather than each entity optimising its own
well-being. Thus unity of purpose is essential for any definition of integration. We adopt a
simple minimal definition of integration for our research – working together for the benefit
of the company.
It is inevitable that as the definitions of integration are divergent, the scale items to measure
integration are also diverse. Table 2 presents scale items for measuring integration found in

the literature. The scale items reflect the concept of integration from the authors’ perspectives
and the context of integration considered by them. The variety of measures in the table
clearly makes the case that there is a need to work towards a consensus in the measurement
of the integration construct.
Table 2. Scale items for the measurement of integration
Scale item Included in this research? (Reason for exclusion)
Reference
Within my firm, employees from different functional areas are encouraged to share resources
Antecedent Chen et al. (2007)
My firm extensively utilizes cross-functional work teams for managing day-to-day operations
Yes Chen et al. (2007)
The orientation of my firm has shifted from managing functions to managing processes
Explanation Chen et al. (2007)
Mutual understanding of technical knowledge about NPD Different context Calantone et al. (2002)
Cooperation between MKT and MFG in NPD Different context Calantone et al. (2002)
Informally working together Summative Chen et al. (2007); Ellinger (2000); Ellinger et al. (2000); Kahn & Mentzer (1998)
Sharing ideas, information, and/or resources Yes Chen et al. (2007); Ellinger (2000); Ellinger et al. (2000); Gimenez & Ventura (2003 and 2005); Kahn & Mentzer (1998)
Working together as a team Summative Chen et al. (2007); Ellinger (2000); Ellinger et al. (2000); Kahn & Mentzer (1998)
Conducting joint planning to anticipate and resolve operational problems
Yes Chen et al. (2007); Ellinger (2000); Ellinger et al. (2000); Gimenez & Ventura (2003 and 2005)
Achieving goals collectively Summative Chen et al. (2007); Ellinger (2000); Ellinger et al. (2000); Kahn & Mentzer (1998)
Developing a mutual understanding of responsibilities Yes Chen et al. (2007); Ellinger (2000); Ellinger et al. (2000); Gimenez & Ventura (2003 and 2005); Kahn & Mentzer (1998)
Making joint decisions about ways to improve overall cost efficiency
Yes Chen et al. (2007); Ellinger (2000); Ellinger et al. (2000); Gimenez & Ventura (2003 and 2005)
Information Exchange through Exchange of reports Yes Ellinger et al. (2000)
Information Exchange through Exchange of memorandums Yes Ellinger et al. (2000)
Information Exchange through Exchange of fax materials Yes Ellinger et al. (2000)
Consultation through Committees / task forces Yes Ellinger et al. (2000)
Consultation through Phone conversations Yes Ellinger et al. (2000)
Consultation through Phone mail Yes Ellinger et al. (2000)
Consultation through Electronic mail Yes Ellinger et al. (2000)
Linkage between functions Explanation Giménez (2004)

Consideration of the effect of own actions on other functions Yes Giménez (2004)
Organisational structure (presence of a customer service department responsible for complete order fulfilment process)
Different context Giménez (2004)
How well marketing and manufacturing work together Summative Hausman et al. (2002)
Working closely with manufacturing often helps your department achieve its goals
Summative Kahn & Mentzer (1994)
Working closely with manufacturing often improves the quality of decisions made by your department
Summative Kahn & Mentzer (1994)
Your department strives to maintain a good working relationship with manufacturing
Yes Kahn & Mentzer (1994)
Interaction through: I. Meetings: (1) Meetings 2) Committees/Task Forces 3) Phone Conversations, 4) Phone Mail 5) Electronic Mail.
Yes Kahn & Mentzer (1998)
Interaction through Documented Information Exchange: 1) Exchange of forms 2) Exchange of reports 3) Exchange of memorandums 4) Exchange of FAX materials;
Yes Kahn & Mentzer (1998)
Share the same vision for the company Yes Kahn & Mentzer (1998)
Informal teamwork Yes Gimenez & Ventura (2003 (2005)
Established teamwork Yes Gimenez & Ventura (2003 (2005)
Joint establishment of objectives Yes Gimenez & Ventura (2003 (2005)
Information is communicated between marketing and logistics Yes Mollenkopf et al. (2000)
Information regarding customers is given to logistics people Yes Mollenkopf et al. (2000)
Information regarding products is given to logistics Yes Mollenkopf et al. (2000)
Information regarding warehousing / transportation is given to marketing
Yes Mollenkopf et al. (2000)
Marketing and logistics people don't discuss with each other the issues affecting marketing and logistics
Yes Mollenkopf et al. (2000)
Marketing and logistics don't coordinate their activities Yes Mollenkopf et al. (2000)
Marketing and logistics don't spend time discussing future customer needs
Yes Mollenkopf et al. (2000)
Level of cooperation Summative, Explanation
Murphy & Poist (1992)
Data integration among internal functions through information network
Antecedent Narasimhan & Kim (2002)
System-wide information system integration among internal functions
Antecedent Narasimhan & Kim (2002)
Real-time searching of the level of inventory Different context Narasimhan & Kim (2002)
Real-time searching of logistics-related operating data Different context Narasimhan & Kim (2002)
Data integration in production process Antecedent Narasimhan & Kim (2002)
Integrative inventory management Explanation Narasimhan & Kim (2002)
The construction of system-wide interaction system between production and sales
Antecedent Narasimhan & Kim (2002)
The utilization of periodic interdepartmental meetings among internal function
Yes Narasimhan & Kim (2002)
Extent of integration of decisions in product development Summative O'Leary-Kelly & Flores (2002)
Extent of integration of decisions in marketing/sales planning Summative O'Leary-Kelly & Flores (2002)
Extent of integration of decisions in process development Summative O'Leary-Kelly & Flores (2002)
Extent of integration of decisions in manufacturing planning Summative O'Leary-Kelly & Flores (2002)
In this business unit, it is easy to talk virtually with anyone you need to regardless of rank or position
Yes Parente et al. (2002)
In this business unit, I feel comfortable calling people in the manufacturing unit when the need arises.
Yes Parente et al. (2002)
Managers here discourage employees from discussing work-related Antecedent Parente et al. (2002)

matters with those who are not their immediate superiors or subordinates People in our sales department are quite accessible to those in the manufacturing units.
Yes Parente et al. (2002)
Managers in manufacturing can easily schedule meetings with sales personnel.
Yes Parente et al. (2002)
Salespeople can easily schedule meetings with manufacturing Yes Parente et al. (2002)
Most departments in this business unit get along well with each other.
Yes Parente et al. (2002)
When members from sales and the production units get together, tensions frequently runs high.
Yes Parente et al. (2002)
Employees from sales and the production units feel that the goals in their respective departments are in harmony with each other.
Summative Parente et al. (2002)
The objectives pursued by the sales department are incompatible with those of the manufacturing departments.
Yes Parente et al. (2002)
There is little / no sales/ production conflict in this business unit. Summative Parente et al. (2002)
Both functions share information. Yes Parente et al. (2002)
Both functions integrate strategy. Explanation Parente et al. (2002)
Both functions contribute to customer value. Summative, Explanation
Parente et al. (2002)
Operations consults marketing before making process changes Yes Sawhney & Piper (2002)
Marketing consults operations before accepting early delivery requests
Yes Sawhney & Piper (2002)
Marketing consults operations before accepting special feature requests
Yes Sawhney & Piper (2002)
Order entry system provides information on existing orders, their completion time and available capacity
Different context Sawhney & Piper (2002)
Numeric estimate of the time taken by marketing to pass order information to production
Different context Sawhney & Piper (2002)
My firm maintains an integrated database and access method to facilitate information sharing
Antecedent, Different context
Stank et al. (2001b)
My firm effectively shares operational information between departments
Yes Stank et al. (2001b)
My firm has adequate ability to share both standardised and customised information internally
Yes Stank et al. (2001b)
My firm provides objective feedback to employees regarding integrated logistics performance
Antecedent Stank et al. (2001b)
My firm's compensation, incentive, and reward systems encourage integration
Antecedent Stank et al. (2001b)
3. Research objective
This research is focused on the measurement of the integration construct, in the context of
internal supply chains. Our goal was to identify a parsimonious set of scale items from
previous literature that will capture the domain of this concept, as defined succinctly in the
above section – working together for the benefit of the company. Another goal was to explore

the structure of this construct, that is, to see if it makes sense to break this construct into
further dimensions.
4. Research methodology
The list of scale items in Table 2 was scrutinised with a view to severely reduce the number
of items in the scale, the ultimate goal being the development of a parsimonious measurement
instrument, at the same time capturing the domain of the construct. Items were excluded for
one or more of the following reasons (see Table 2):
Summative – Summative items were not suitable, since the goal was to capture the
domain of the construct
Antecedent – The item appears to be antecedent to integration
Different context – The item appears to apply to a different context other than internal
supply chain considered in this research
Explanation – Further explanations would be needed for use in a survey questionnaire
Many of the remaining items were similar in meaning. These similar items were reworded to
construct a single item. Two academics and two practitioners vetted the items for clarity. This
process led to the following 16 items for the measurement of integration. The items asked the
respondents to answer each of these questions with the preface: “In my company the
departments involved in production, sales and distribution of products ...”
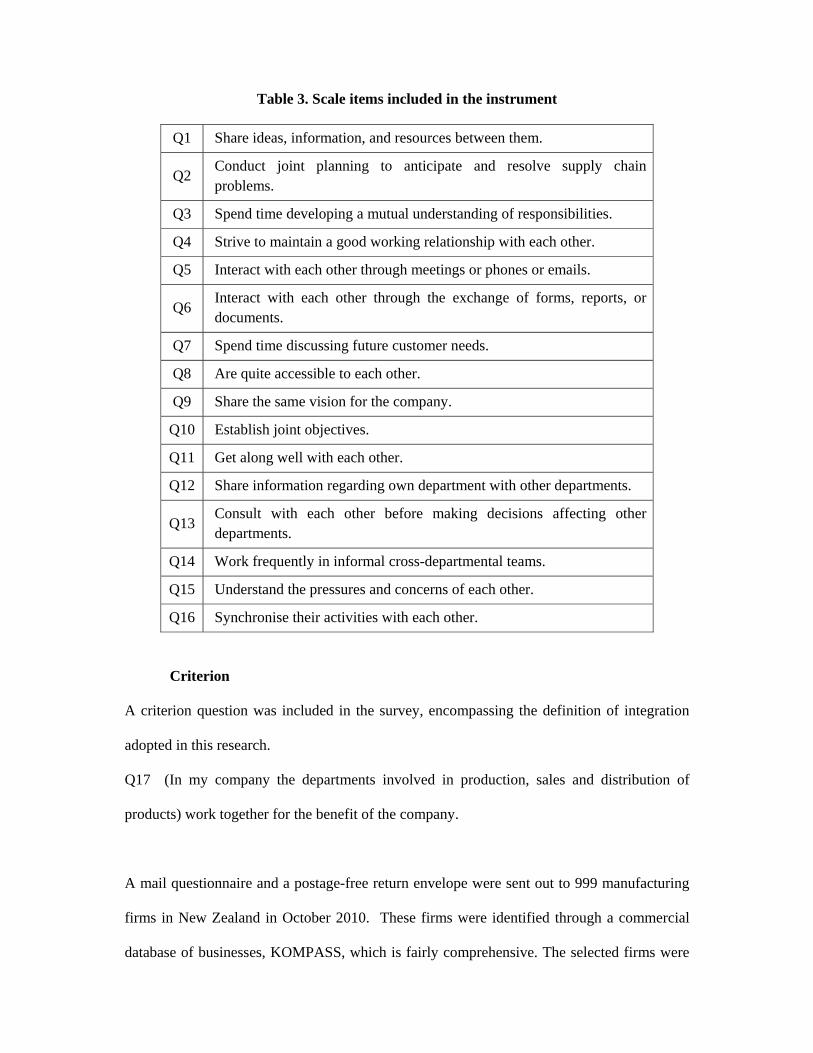
Table 3. Scale items included in the instrument
Q1 Share ideas, information, and resources between them.
Q2 Conduct joint planning to anticipate and resolve supply chain problems.
Q3 Spend time developing a mutual understanding of responsibilities.
Q4 Strive to maintain a good working relationship with each other.
Q5 Interact with each other through meetings or phones or emails.
Q6 Interact with each other through the exchange of forms, reports, or documents.
Q7 Spend time discussing future customer needs.
Q8 Are quite accessible to each other.
Q9 Share the same vision for the company.
Q10 Establish joint objectives.
Q11 Get along well with each other.
Q12 Share information regarding own department with other departments.
Q13 Consult with each other before making decisions affecting other departments.
Q14 Work frequently in informal cross-departmental teams.
Q15 Understand the pressures and concerns of each other.
Q16 Synchronise their activities with each other.
Criterion
A criterion question was included in the survey, encompassing the definition of integration
adopted in this research.
Q17 (In my company the departments involved in production, sales and distribution of
products) work together for the benefit of the company.
A mail questionnaire and a postage-free return envelope were sent out to 999 manufacturing
firms in New Zealand in October 2010. These firms were identified through a commercial
database of businesses, KOMPASS, which is fairly comprehensive. The selected firms were

the largest in New Zealand with respect to number of employees, the rationale being that the
larger firms are likely to have distinct departments in their internal supply chain in need of
integration. After all, a firm with one employee can be assumed to be highly integrated!
The survey was sent out to either the general managers (or equivalent) or to the top executive
in production, sales, or distribution in order to ensure that the respondents were
knowledgeable about the state of integration in their company. All the items in the survey had
a 7-point Likert scale (1 = Strongly disagree, 4 = Neutral, 7 = Strongly agree).
The questionnaire was accompanied by a cover letter highlighting the objectives of the
research, assuring confidentiality, and promising a summary of the research report. A serial
number was included for follow-up. After a month, when the flow of responses had started to
dwindle, a reminder was sent with another copy of the questionnaire and a postage-free return
envelope. When the responses had stopped, there was a tally of 273 usable responses. This is
a response rate of 27%, which is quite high for this kind of survey.
The number of employees of the respondents is shown in Table 4. There is a clear
preponderance of larger firms within New Zealand, but by international standards, most of
our respondents are small to medium sized firms.
Table 4. Demographics of the sample
Number of employees Frequency
Up to 20 6 21-50 74 51-100 85 101-150 45 151-200 12 More than 200 50
The usable 273 responses were analysed using commercial SPSS software, as detailed in the
next section.
5. Analysis
Non-response bias
Even though our response rate was high, the question of non-response bias still arises. The
possibility exists that the firms who did not respond are different from the respondents, and
our sample does not represent the non-responders. Assuming that the late responders are
similar to the non-responders, we compared early responders with the late responders. The
first 25% of the sample was compared against the last 25% of the sample. The hypothesis
could not be rejected that the mean of each of the 17 item-responses was the same for the two
groups, using 2-tailed t-test at p = 0.05. The lowest p was 0.193. Similarly, a Pearson Chi
square test on an organisational characteristic (number of workers) rejected the null
hypothesis that there was an association between organisation size and tardiness in response
(p = 0.848). These tests give confidence that the non-response bias in our study is minimal.
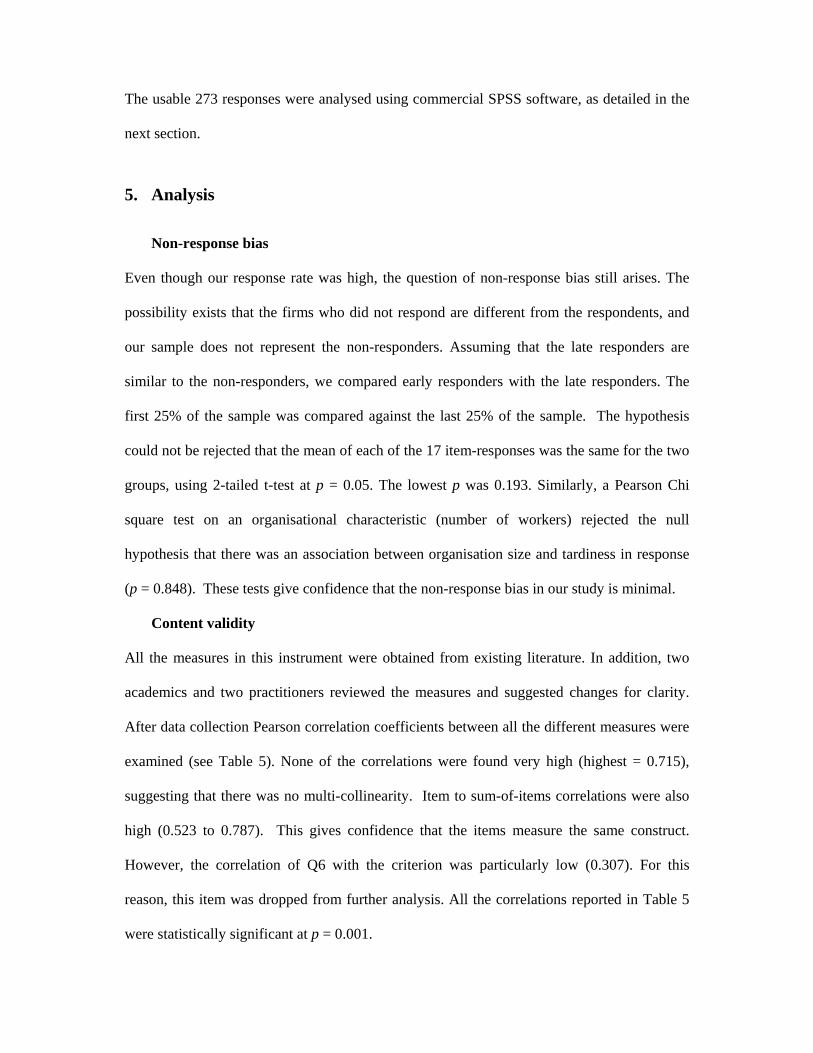
Content validity
All the measures in this instrument were obtained from existing literature. In addition, two
academics and two practitioners reviewed the measures and suggested changes for clarity.
After data collection Pearson correlation coefficients between all the different measures were
examined (see Table 5). None of the correlations were found very high (highest = 0.715),
suggesting that there was no multi-collinearity. Item to sum-of-items correlations were also
high (0.523 to 0.787). This gives confidence that the items measure the same construct.
However, the correlation of Q6 with the criterion was particularly low (0.307). For this
reason, this item was dropped from further analysis. All the correlations reported in Table 5
were statistically significant at p = 0.001.

Table 5. Coorelation Matrix
Q1 Q2 Q3 Q4 Q5 Q6 Q7 Q8 Q9 Q10 Q11 Q12 Q13 Q14 Q15 Q16 SUM
Q1
Q2 0.656
Q3 0.648 0.714
Q4 0.604 0.561 0.600
Q5 0.614 0.546 0.545 0.605
Q6 0.340 0.387 0.361 0.313 0.458
Q7 0.573 0.544 0.620 0.511 0.508 0.374
Q8 0.590 0.393 0.465 0.516 0.557 0.269 0.463
Q9 0.590 0.443 0.524 0.494 0.528 0.331 0.523 0.596
Q10 0.574 0.542 0.589 0.497 0.495 0.368 0.650 0.513 0.662
Q11 0.529 0.415 0.418 0.542 0.511 0.276 0.397 0.511 0.528 0.445
Q12 0.561 0.497 0.537 0.511 0.565 0.334 0.544 0.549 0.566 0.582 0.577
Q13 0.511 0.477 0.556 0.478 0.455 0.285 0.529 0.421 0.469 0.608 0.472 0.645
Q14 0.477 0.428 0.444 0.419 0.430 0.333 0.433 0.417 0.431 0.456 0.427 0.496 0.453
Q15 0.476 0.454 0.530 0.471 0.421 0.293 0.458 0.429 0.492 0.502 0.418 0.567 0.624 0.521
Q16 0.568 0.518 0.586 0.494 0.532 0.344 0.509 0.497 0.533 0.611 0.496 0.622 0.640 0.451 0.691
SUM 0.785 0.731 0.787 0.729 0.738 0.523 0.747 0.692 0.747 0.787 0.666 0.785 0.746 0.661 0.720 0.784
Criterion 0.650 0.535 0.569 0.558 0.553 0.307 0.546 0.570 0.697 0.629 0.536 0.585 0.580 0.440 0.629 0.684 0.771

Factor Analysis
Factor analysis was carried out on the data (after removing Q6) using the principal
components (PCA) method of extraction. The determinant of the correlation matrix was
calculated as 0.0000697, which is more than 0.00001, indicating that the correlation matrix is
suitable for factor analysis. The scree plot is shown in Figure 2, which shows an elbow at
component number 2. This justifies a single general factor, which has an eigenvalue of 8.309.
However, this factor explains only 55.39% of the total variance in the data. The scree plot also
has a less pronounced elbow at component number 4, which justifies three factors. The third
component is associated with an eigenvalue of 0.876, which is higher than 0.7, regarded
generally as the lowest acceptable value. The three-factor solution will also explain 67.55%
of the total variance. Thus SPSS was directed to find a three-factor solution, and to rotate the
vectors using the varimax procedure for interpretability.
Figure 2. Scree plot

Table 6 displays the rotated component matrix produced by SPSS. Factor loadings less
than 0.4 have been suppressed.
Table 6. Rotated component matrix
Integration measures Component 1 2 3
Q1 Share ideas, information, and resources between them.
0.634 0.503
Q2 Conduct joint planning to anticipate and resolve supply chain problems.
0.824
Q3 Spend time developing a mutual understanding of responsibilities.
0.775
Q4 Strive to maintain a good working relationship with each other.
0.579 0.510
Q5 Interact with each other through meetings or phones or emails.
0.508 0.607
Q7 Spend time discussing future customer needs. 0.401 0.619
Q8 Are quite accessible to each other. 0.759
Q9 Share the same vision for the company. 0.629
Q10 Establish joint objectives. 0.542 0.461
Q11 Get along well with each other. 0.746
Q12 Share information regarding own department with other departments.
0.596 0.513
Q13 Consult with each other before making decisions affecting other departments.
0.768
Q14 Work frequently in informal cross-departmental teams.
0.52
Q15 Understand the pressures and concerns of each other. 0.804
Q16 Synchronise their activities with each other. 0.732

Factor 1 loads heavily on Q13 (Consult with each other before making decisions affecting
other departments), Q15 (Understand the pressures and concerns of each other), and Q16
(Synchronise their activities with each other). This factor seems to capture the coordination
dimension of internal supply chain integration. Factor 2 loads heavily on Q1 (Share ideas,
information, and resources between them), Q2 (Conduct joint planning to anticipate and
resolve supply chain problems), and Q3 (Spend time developing a mutual understanding of
responsibilities). This factor seems to capture the communication dimension of internal
supply chain integration. The third factor loads heavily on Q8 (Are quite accessible to each
other), Q9 (Share the same vision for the company), and Q11 (Get along well with each
other). This factor appears to capture the affective relationship dimension of internal supply
chain integration.
Reliability
Sample size.
Sample size is an important factor in the reliability of factor analysis. A ratio of 10-15 cases
per variable is commonly suggested. With 16 items in our questionnaire, the number of cases
should be 160-240. This criterion is comfortably met by our sample size of 273. Another
measure of sampling adequacy is the Kaiser-Meyer-Olkin (KMO) statistic, which is
calculated by SPSS. The KMO statistics for our data is 0.949. This confirms that the data is
highly suitable for factor analysis. Still other measures for sampling adequacy are the
diagonal elements of the anti-image correlation matrix, which should be at least 0.5 for a
satisfactory factor analysis. The lowest diagonal element in the SPSS results is 0.922,
ensuring sampling adequacy.

Correlation matrix
Individual item-total and item – criterion correlations were checked as mentioned earlier to
ensure that the items belonged to the same construct. One item (Q6) was excluded on this
account. Another measure to ensure that the items are not independent, is the Barlett’s test of
sphericity, whose null hypothesis is that the correlation matrix is an identity matrix (no
correlation at all). SPSS results show that the set of our remaining variables pass Barlett’s test
at p < 0.001.
Degree of fit
The degree of fit of the hypothesised 3-factor model to the data can be assessed by the
reproduced correlations matrix. For a perfect fit, this matrix should be identical to the original
correlation matrix of the variables. The ideal value of the diagonal elements (the
communalities) is 1. With the exception of variable Q14, which has a communality of 0.449,
all of our variables have a communality of more than 0.6, the average communality being
0.676. This indicates a satisfactory fit. A good fit is also indicated when the residual
correlations (difference between the original correlations and the reproduced correlations) are
small. A commonly used criterion is to have less than 50% of the residuals less than 0.05 in
absolute value. SPSS output shows that for our three-factor solution, 68% of residuals have an
absolute value of less than 0.05.
Scale reliability
A common measure for testing whether the different items of the scale measure the same
construct is the Cronbach’s alpha. This measure for our scale of remaining 15 items and for
the three factors is given in Table 7 below.

Table 7. Cronbach’s alpha statistic
Scale Cronbach’s alpha 15 – item scale 0.940 Communications factor 0.900 Coordination factor 0.895 Affective relationship factor
0.858
All of these statistics are above the acceptable range of 0.7-0.8, indicating high scale
reliability.
Test-retest reliability
Test – retest reliability can only be ultimately tested by carrying out the data collection
exercise again. A split sample factor analysis can give an indication of the test-retest
reliability of factor analysis. Our survey respondents were asked whether company’s
production is mainly based on make-to-order or make-to-stock policies. There were 143
responses indicating mainly make-to-order production; 91 respondents indicated mainly
make-to-stock production (many respondents wrote “both”; some responses were missing).
We extracted three-factor models for both of these sub-samples. Table 8 shows the factor
loadings obtained, comparing the subsamples against the entire sample.
Table 8. Split sample factor analysis
Variable Coordination Communication Affective relationship
Entire sample
Make to order
Make to stock
Entire sample
Make to order
Make to stock
Entire sample
Make to order
Make to stock
Q1 0.535 0.634 0.614 0.582 0.503 0.566 Q2 0.824 0.793 0.799 Q3 0.449 0.775 0.777 0.757 Q4 0.579 0.527 0.679 0.510 0.526 0.422

Q5 0.508 0.470 0.577 0.607 0.594 0.552 Q7 0.401 0.581 0.619 0.785 0.406 Q8 0.410 0.759 0.825 0.534 Q9 0.431 0.629 0.637 0.560 Q10 0.542 0.646 0.461 0.686 Q11 0.746 0.699 0.831 Q12 0.596 0.464 0.667 0.513 0.641 0.406 Q13 0.768 0.712 0.810 Q14 0.520 0.517 0.460 0.487 Q15 0.804 0.850 0.746 Q16 0.732 0.679 0.843
Table 8 shows that the same three factors are obtained, even though factor loadings are a
bit different, particularly for those variables that load on more than one factor. The variables
in the core of the coordination dimension are Q13, Q15, and Q16. Similarly high loadings for
communication are on Q2 and Q3. High loadings for affective relationship are on Q8 and
Q11. It should be stated here that although the measures of sampling adequacy mentioned
earlier were satisfactory for both the subsamples, the sizes of the split samples are small,
particularly for the “make to stock” group.
Predictive validity
Even though as discussed above, each of the factors appear to measure a different dimension,
and the entire scale measures a common construct, this does not confirm that they measure
what one would understand as internal supply chain integration. We had included a criterion
question in our survey instrument (Q 17: Work together for the benefit of the company) to test
this. This criterion, in our opinion, is a summary measure for the latent variable of internal
supply chain integration. The correlation of the criterion with the item totals in the factors and
the entire scale is given in Table 9 below.
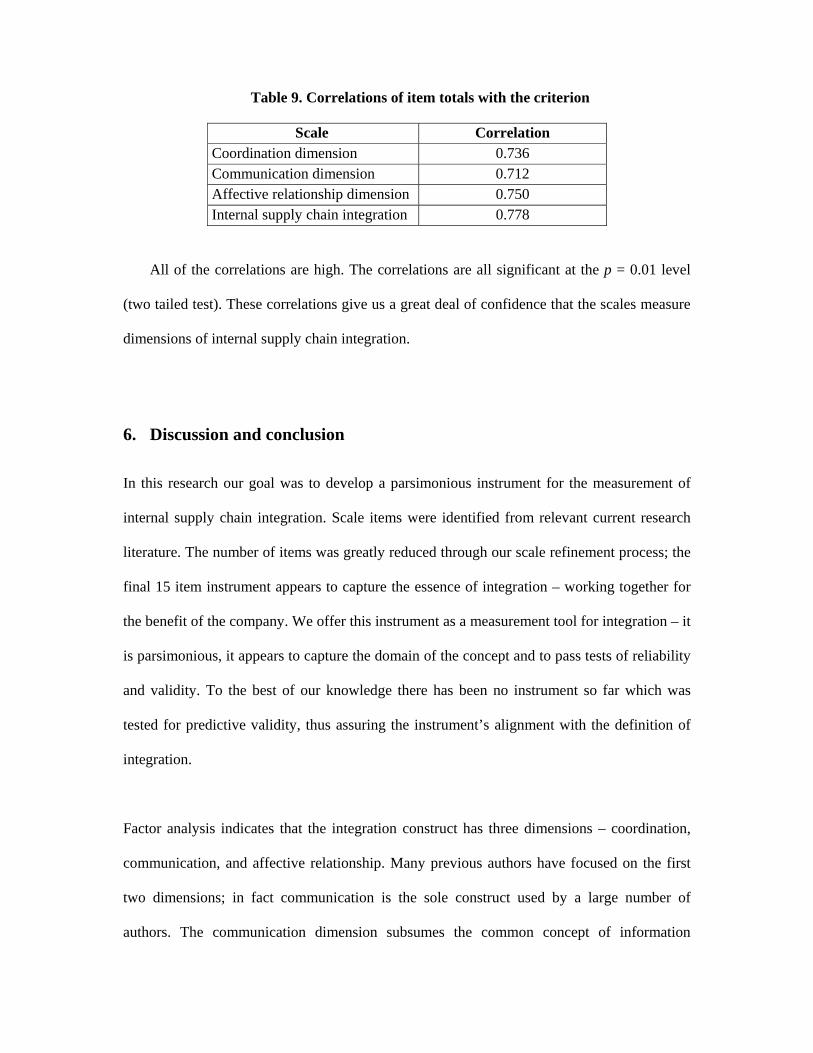
Table 9. Correlations of item totals with the criterion
Scale Correlation Coordination dimension 0.736 Communication dimension 0.712 Affective relationship dimension 0.750 Internal supply chain integration 0.778
All of the correlations are high. The correlations are all significant at the p = 0.01 level
(two tailed test). These correlations give us a great deal of confidence that the scales measure
dimensions of internal supply chain integration.
6. Discussion and conclusion
In this research our goal was to develop a parsimonious instrument for the measurement of
internal supply chain integration. Scale items were identified from relevant current research
literature. The number of items was greatly reduced through our scale refinement process; the
final 15 item instrument appears to capture the essence of integration – working together for
the benefit of the company. We offer this instrument as a measurement tool for integration – it
is parsimonious, it appears to capture the domain of the concept and to pass tests of reliability
and validity. To the best of our knowledge there has been no instrument so far which was
tested for predictive validity, thus assuring the instrument’s alignment with the definition of
integration.
Factor analysis indicates that the integration construct has three dimensions – coordination,
communication, and affective relationship. Many previous authors have focused on the first
two dimensions; in fact communication is the sole construct used by a large number of
authors. The communication dimension subsumes the common concept of information
exchange, consultation, and interaction as presented by many authors. Similarly the
coordination dimension covers the concepts of cooperation and synchronisation, The finding
of the affective relationship dimension is a bit of surprise in this research. The core items for
this factor are Q8 (Are quite accessible to each other), Q9 (Share the same vision for the
company), and Q11 (Get along well with each other), which clearly emphasises the affective
aspect of integration. Calantone et al. (2002) have presented a relationship construct, but they
see this construct as separate from the integration construct. Ellinger et al. (2000) envisage
integration having the components of collaboration, consultation, and information exchange.
Relationship is seen as a consequence of integration. Kahn & Mentzer (1998) and others have
posited that integration consist of two dimensions (communication or interaction, and
collaboration). This collaboration concept has some aspects of affective relationship
embedded in it. However, affective relationship as a separate factor of integration concept is
something new brought out by this research. It is hard to imagine supply chain functions
within a company working together to the highest extent without harmonious relationship
within these functions. Thus this dimension of integration is worthy of further studies.
We hope we have made a contribution here towards building a consensus among practitioners
and researchers in defining and measuring internal supply chain integration. For practitioners,
our measurement instrument offers a self-assessment tool for internal supply chain
integration.
Future work prompted by this research are: a confirmatory research on the instrument
presented here and on the dimensions of integration, further exploration of the domain of the
affective relationship dimension in integration, and an exploration of how the concept of
integration changes with its context.

References
Adler, P. S. (1995). Interdepartmental interdependence and coordination: The case of the design/manufacturing interface. Organization Science, 6(2), 147.
Calantone, R., Droge, C., & Vickery, S. (2002). Investigating the manufacturing-marketing interface in new product development: Does context affect the strength of relationships? Journal of Operations Management, 20(3), 273.
Chen, H., Mattioda, D. D. M., & Daugherty, P. J. (2007). Firm-wide integration and firm performance. International Journal of Logistics Management, 18(1), 5.
Crittenden, V. L. (1992). Close the Marketing/Manufacturing Gap. Sloan Management Review, 33(3), 41-52.
Daugherty, P. J., Ellinger, A. E., & Gustin, C. M. (1996). Integrated logistics: achieving logistics performance improvements. Supply Chain Management, 1(3), 25.
Ellinger, A. E. (2000). Improving marketing/logistics cross-functional collaborations in the supply chain. Industrial Marketing Management, 29(1), 85.
Ellinger, A. E., Daugherty, P. J., & Gustin, C. M. (1997). The relationship between integrated logistics and customer service. Transportation Research. Part E, Logistics & Transportation Review, 33, 129.
Ellinger, A. E., Daugherty, P. J., & Keller, S. B. (2000). The relationship between marketing/logistics interdepartmental integration and performance in U.S. manufacturing firms: An empirical study. Journal of Business Logistics, 21(1), 1.
Giménez, C. (2004). Supply Chain Management Implementation in the Spanish Grocery Sector: An Exploratory Study. UPF Economics & Business Working Paper (No. 668 ). Barcelona: Universitat Pomepu Fabra.
Gimenez, C., & Ventura, E. (2003). Supply chain management as a competitive advantage in the Spanish grocery sector. International Journal of Logistics Management, 14(1), 77.
Gimenez, C., & Ventura, E. (2005). Logistics-production, logistics-marketing and external

integration: Their impact on performance. International Journal of Operations & Production Management, 25(1), 20.
Griffin, A., & Hauser, J. R. (1996). Integrating R&D and marketing: A review and analysis of the literature. The Journal of Product Innovation Management, 13(3), 191.
Hausman, W. H., Montgomery, D. B., & Roth, A. V. (2002). Why should marketing and manufacturing work together? Some exploratory empirical results. Journal of Operations Management, 20(3), 241.
Hsu, L.-L., & Chen, M. (2004). Impacts of ERP systems on the integrated-interaction performance of manufacturing and marketing. Industrial Management + Data Systems, 104(1/2), 42.
Kahn, K. B. (1996). Interdepartmental integration: A definition with implications for product development performance. The Journal of Product Innovation Management, 13(2), 137.
Kahn, K. B., & Mentzer, J. T. (1994). Norms that distinguish between marketing and manufacturing. Journal of Business Research, 30(2), 111.
Kahn, K. B., & Mentzer, J. T. (1996). Logistics and interdepartmental integration. International Journal of Physical Distribution & Logistics Management, 26(8), 6.
Kahn, K. B., & Mentzer, J. T. (1998). Marketing's integration with other departments. Journal of Business Research, 42(1), 53.
Lunn, T. (1997). Breaking down silos and building teamwork. Hospital Materiel Management Quarterly, 19(2), 9.
Mollenkopf, D., Gibson, A., & Ozanne, L. (2000). The integration of marketing and logistics functions: An empirical examination of New Zealand firms. Journal of Business Logistics, 21(2), 89.
Murphy, P. R., & Poist, R. F. (1992). The logistics-marketing interface: Techniques for enhancing cooperation. Transportation Journal, 32(2), 14.
Narasimhan, R., & Kim, S. W. (2002). Effect of supply chain integration on the relationship between diversification and performance: Evidence from Japanese and Korean firms. Journal of Operations Management, 20(3), 303.
O'Leary-Kelly, S. W., & Flores, B. E. (2002). The integration of manufacturing and marketing/sales decisions: Impact on organizational performance. Journal of Operations Management, 20(3), 221.
Orsini, J. L., & Karagozoglu, N. (1988). Marketing,Production Interfaces In Services Industries. S.A.M. Advanced Management Journal, 53(3), 34.
Pagell, M. (2004). Understanding the factors that enable and inhibit the integration of operations, purchasing and logistics. Journal of Operations Management, 22(5), 459.
Parente, D. H., Pegels, C. C., & Suresh, N. (2002). An exploratory study of the sales-production relationship and customer satisfaction. International Journal of Operations & Production Management, 22(9/10), 997.
Sawhney, R., & Piper, C. (2002). Value creation through enriched marketing-operations interfaces: An empirical study in the printed circuit board industry. Journal of Operations Management, 20(3), 259.
Stank, T. P., Daugherty, P. J., & Ellinger, A. E. (1999). Marketing/logistics integration and firm performance. International Journal of Logistics Management, 10(1), 11.
Stank, T. P., Keller, S. B., & Closs, D. J. (2001a). Performance benefits of supply chain logistical integration. Transportation Journal, 41(2/3), 32.
Stank, T. P., Keller, S. B., & Daugherty, P. J. (2001b). Supply chain collaboration and logistical service performance. Journal of Business Logistics, 22(1), 29.
Stevens, G. C. (1989). Integrating the Supply Chain. International Journal of Physical Distribution & Materials Management, 19(8), 3.
Swink, M., & Song, M. (2007). Effects of marketing-manufacturing integration on new product development time and competitive advantage. Journal of Operations Management, 25(1), 203.
Van Hoek, R. I., & Mitchell, A. J. (2006). The challenge of internal misalignment. International Journal of Logistics Research and Applications: A Leading Journal of Supply Chain Management, 9(3), 269 - 281.