measuring leadership potential: lessons and - ipacannex.ipacweb.org/library/conf/11/allen.pdf ·...
TRANSCRIPT

Measuring Leadership Potential: Lessons and
Challenges from the Army’s Officer Candidate
School (OCS)
Presented: Tuesday July 19th, 2011 IPAC Conference
Matthew T. Allen
Joy T. Oliver
Teresa L. Russell
Human Resources Research Organization (HumRRO)
Nehama E. Babin
Mark C. Young
U.S. Army Research Institute for the Behavioral and Social Sciences (ARI)
The views, opinions, and/or findings contained in this paper are solely those of the authors and should not be construed as an official Department of the Army or Department of Defense position, policy, or decision, unless so designated by other documentation.

Overview
1. Introduction to OCS
2. Objectives
3. Study Methodology
4. Results
– Reliability/validity of ratings of leadership potential
– Predictors of leadership potential ratings
5. Implications

The U.S. Army’s Officer Candidate School (OCS)
• What is OCS? – A source for commissioning officers into the Army
– Other main sources are ROTC and West Point
• Overview and Recent History – OCS considered the “flexible backup” source for commissioning
officers • Role expanded in response to increase in force requirements
• Can commission officers in 12 weeks
– Little research has been conducted on OCS in the last 30 years
• Training curricula contains aspects of: – Academic (e.g., military history)
– Physical (e.g., runs with and without gear)
– Leadership (e.g., performance on field leadership exercises)
The U.S. Army’s Officer Candidate School (OCS)
• Two primary avenues for entering OCS: 1. In-service option – Open to enlisted Soldiers who want to
become officers and have a college degree.
2. Enlistment option – Civilians with a college degree who enter OCS after completion of Basic Combat Training
• Began in 1998
• Officers are “leadership generalists” (as opposed to technical specialists)
• Interest in developing leaders for both: – Company-grade positions – Lieutenants and Captains
– Field-grade positions – Major, Lieutenant Colonel, Colonel, General Officer
Objectives of Presentation
• Big picture challenge – Assessment of leadership performance and potential critical
to the Army
– Difficult because company and field-grade positions/ responsibilities very different
• Research (e.g., Mumford et al., 2000) and commentaries (Kane, 2011) back up this claim
– Most extant research comes from selection/promotion perspectives
• Current purpose 1. Evaluate whether officer candidates’ peers can reliably
evaluate leadership potential
2. Examine what factors predict ratings of leadership potential
The Study
• 745 officer candidates in five classes surveyed at the end of
the 12-week OCS course
• Asked to complete:
1. Attitudes – Affective Commitment and Career Intentions
2. Peer ratings – Rate leadership potential of squad members
3. Leader roles – Rate importance of five roles
• From administrative records, we also obtained scores on:
– Academic performance
– Physical fitness
– Leadership performance
Peer Ratings of Leadership
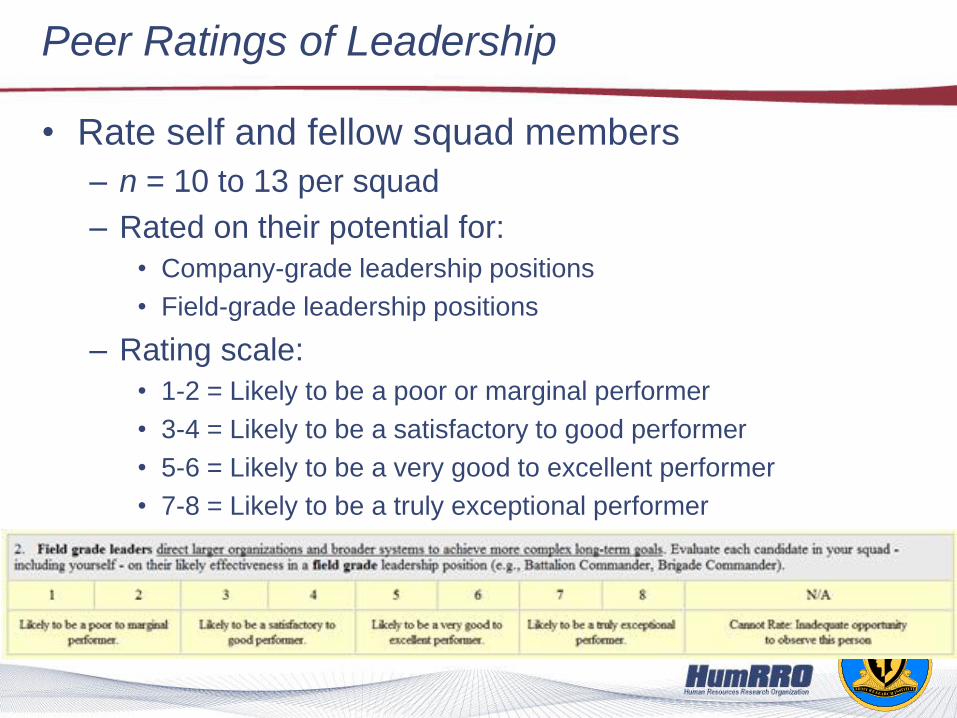
• Rate self and fellow squad members
– n = 10 to 13 per squad
– Rated on their potential for:
• Company-grade leadership positions
• Field-grade leadership positions
– Rating scale:
• 1-2 = Likely to be a poor or marginal performer
• 3-4 = Likely to be a satisfactory to good performer
• 5-6 = Likely to be a very good to excellent performer
• 7-8 = Likely to be a truly exceptional performer

Leader Roles
• Asked to rate the importance of the following roles for “junior” and “senior” officers (Moskos, 2001) 1. Combat Leader
2. Technician (e.g., expert knowledge of weapon systems)
3. Manager (e.g., administrator, supervisor)
4. Statesman/Diplomat (e.g., negotiator)
5. Scholar
• Scale – 1 = “Not at all important”
– 7 = “Extremely important”
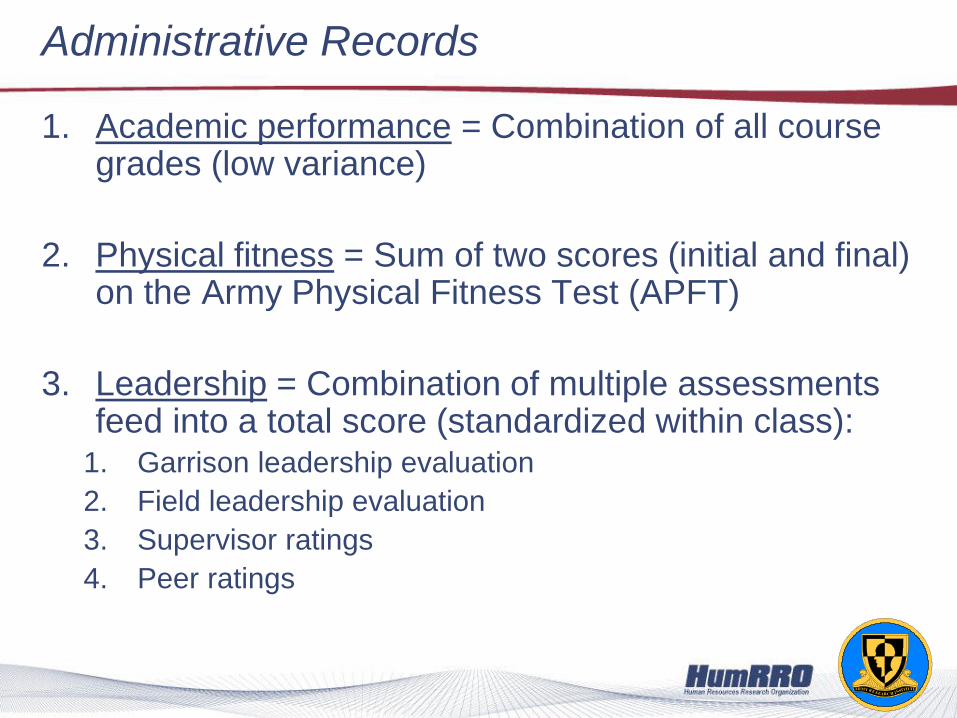
Administrative Records
1. Academic performance = Combination of all course grades (low variance)
2. Physical fitness = Sum of two scores (initial and final) on the Army Physical Fitness Test (APFT)
3. Leadership = Combination of multiple assessments feed into a total score (standardized within class):
1. Garrison leadership evaluation
2. Field leadership evaluation
3. Supervisor ratings
4. Peer ratings
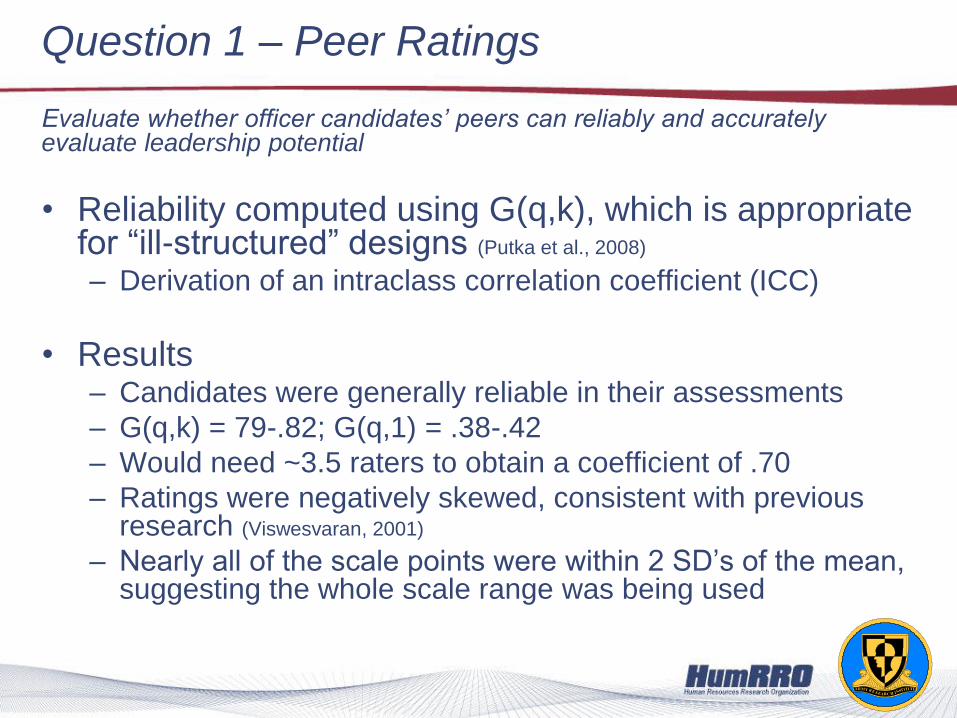
Question 1 – Peer Ratings
Evaluate whether officer candidates’ peers can reliably and accurately evaluate leadership potential
• Reliability computed using G(q,k), which is appropriate for “ill-structured” designs (Putka et al., 2008)
– Derivation of an intraclass correlation coefficient (ICC)
• Results – Candidates were generally reliable in their assessments
– G(q,k) = 79-.82; G(q,1) = .38-.42
– Would need ~3.5 raters to obtain a coefficient of .70
– Ratings were negatively skewed, consistent with previous research (Viswesvaran, 2001)
– Nearly all of the scale points were within 2 SD’s of the mean, suggesting the whole scale range was being used
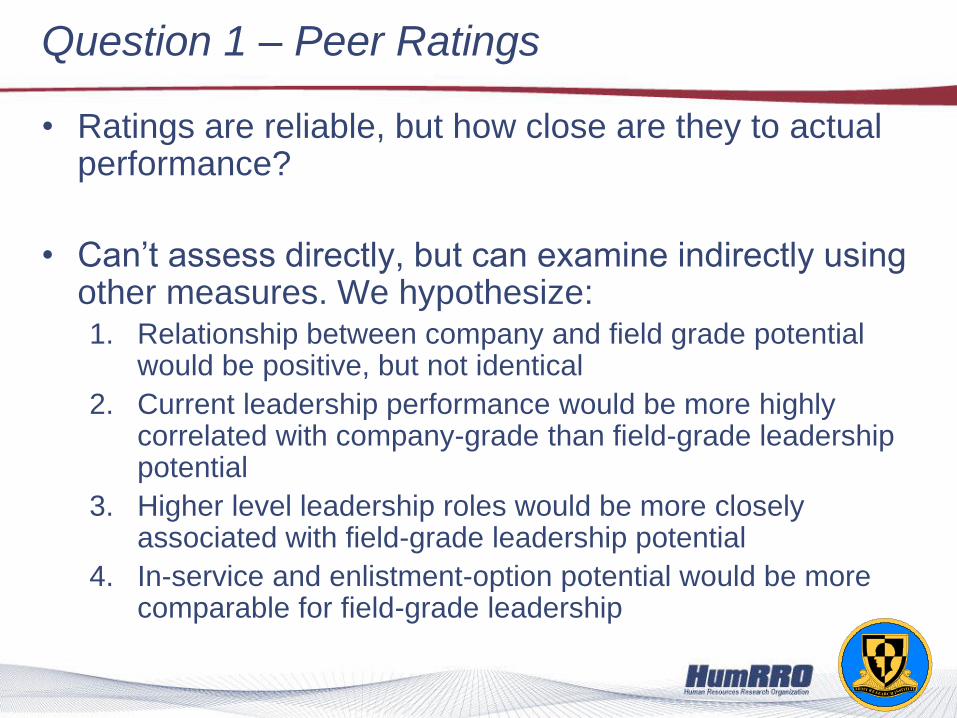
Question 1 – Peer Ratings
• Ratings are reliable, but how close are they to actual performance?
• Can’t assess directly, but can examine indirectly using other measures. We hypothesize: 1. Relationship between company and field grade potential
would be positive, but not identical
2. Current leadership performance would be more highly correlated with company-grade than field-grade leadership potential
3. Higher level leadership roles would be more closely associated with field-grade leadership potential
4. In-service and enlistment-option potential would be more comparable for field-grade leadership

Question 1 – Peer Ratings
• Findings – Relationship between company-grade (CG) and field-grade
(FG) leadership very high (r = .98, d = -.10)
– Both CG (r = .57) and FG (r = .55) scales significantly related to leadership performance; not different from one another (Z = 0.67, p = ns)
– Third hypothesis also not supported; patterns of correlations the same for both CG and FG ratings
– In-service rated higher for both CG (d = 0.26, p = .01) and FG (d = .21, p = .03) leadership potential, though difference is lower for FG leadership
• Conclusion – Ratings of leadership potential reliable
– Results suggest ratings more accurate immediate potential than for higher level positions

Question 2 – Predicting Leadership Potential
Examine what factors predict ratings of leadership potential.
• Regressed CG and FG potential on the following: 1. In-service versus enlistment-option
2. Affective commitment
3. Role “accuracy” – Correlated each individuals rating profile with that of 116 Captains who
completed the same assessment
4. Academic performance
5. Physical fitness
6. Garrison evaluation
7. Field leadership evaluations
8. Supervisor evaluations
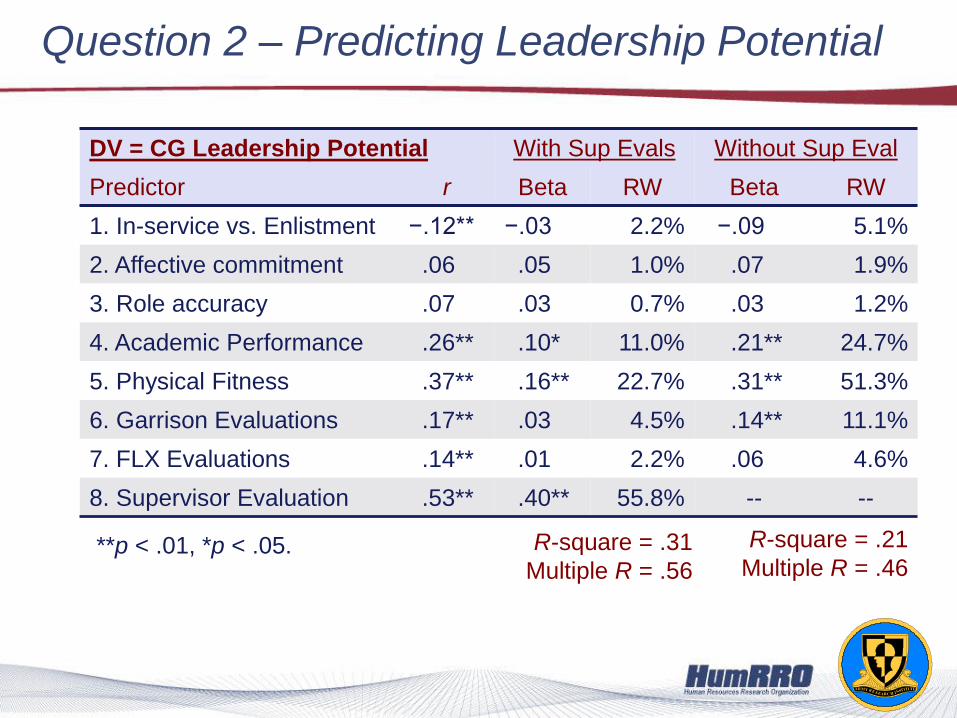
Question 2 – Predicting Leadership Potential
DV = CG Leadership Potential With Sup Evals Without Sup Eval
Predictor r Beta RW Beta RW
1. In-service vs. Enlistment −.12** −.03 2.2% −.09 5.1%
2. Affective commitment .06 .05 1.0% .07 1.9%
3. Role accuracy .07 .03 0.7% .03 1.2%
4. Academic Performance .26** .10* 11.0% .21** 24.7%
5. Physical Fitness .37** .16** 22.7% .31** 51.3%
6. Garrison Evaluations .17** .03 4.5% .14** 11.1%
7. FLX Evaluations .14** .01 2.2% .06 4.6%
8. Supervisor Evaluation .53** .40** 55.8% -- --
**p < .01, *p < .05. R-square = .31
Multiple R = .56
R-square = .21
Multiple R = .46
Question 2 – Predicting Leadership Potential
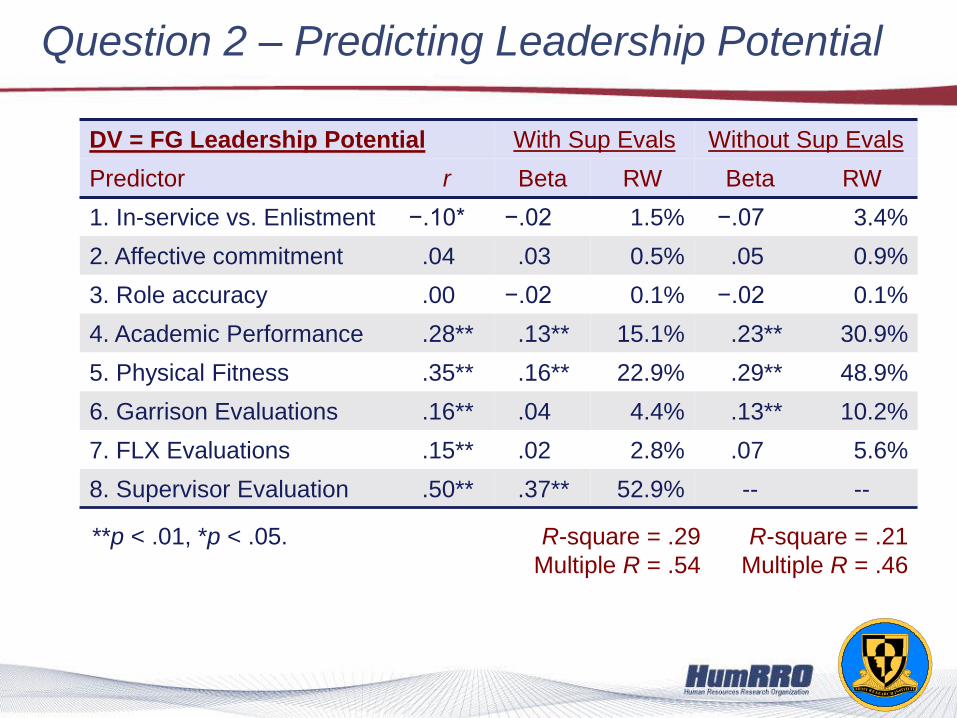
DV = FG Leadership Potential With Sup Evals Without Sup Evals
Predictor r Beta RW Beta RW
1. In-service vs. Enlistment −.10* −.02 1.5% −.07 3.4%
2. Affective commitment .04 .03 0.5% .05 0.9%
3. Role accuracy .00 −.02 0.1% −.02 0.1%
4. Academic Performance .28** .13** 15.1% .23** 30.9%
5. Physical Fitness .35** .16** 22.9% .29** 48.9%
6. Garrison Evaluations .16** .04 4.4% .13** 10.2%
7. FLX Evaluations .15** .02 2.8% .07 5.6%
8. Supervisor Evaluation .50** .37** 52.9% -- --
**p < .01, *p < .05. R-square = .29
Multiple R = .54
R-square = .21
Multiple R = .46
Question 2 – Predicting Leadership Potential
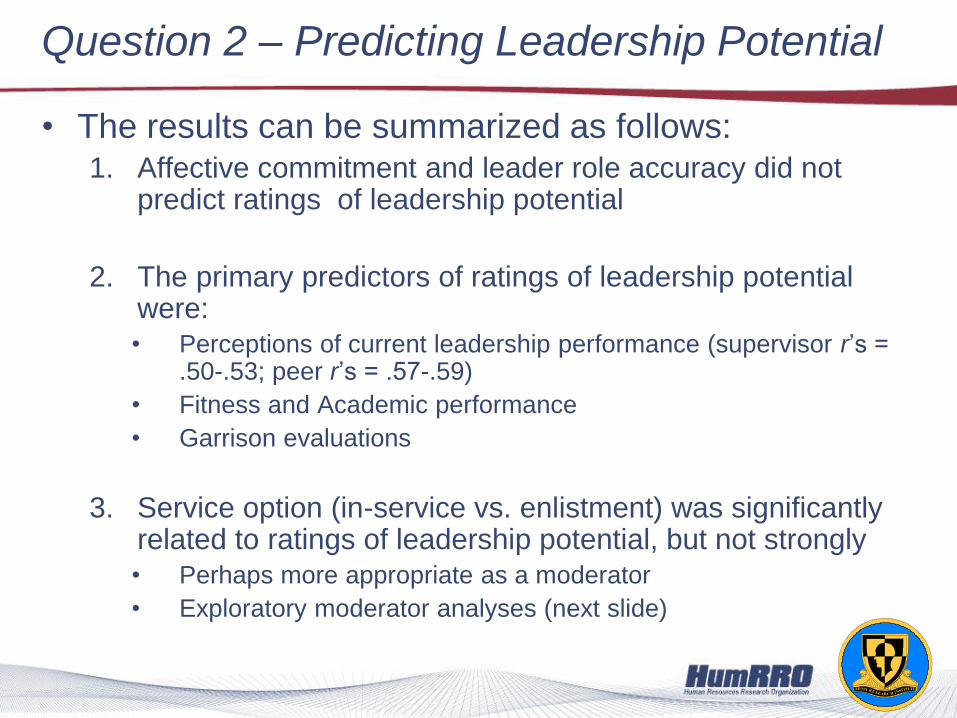
• The results can be summarized as follows: 1. Affective commitment and leader role accuracy did not
predict ratings of leadership potential
2. The primary predictors of ratings of leadership potential were:
• Perceptions of current leadership performance (supervisor r’s = .50-.53; peer r’s = .57-.59)
• Fitness and Academic performance
• Garrison evaluations
3. Service option (in-service vs. enlistment) was significantly related to ratings of leadership potential, but not strongly
• Perhaps more appropriate as a moderator
• Exploratory moderator analyses (next slide)

Service Option as a Moderator
• Significant interactions for three of
the predictive variables
• Some steeper slopes for the in-
service option, but overall, the
interactive effects are pretty small
• Service option is not a consistent
moderator between leadership
performance variables and ratings
of potential

Implications
• Implications for Leader Assessment in the workplace
• Peer ratings of leadership potential could potentially be used for short-term forecasting – e.g., succession planning
– Ratings of CG leadership potential in line with expectations
– Interrater reliability high
• However, peer ratings of leadership potential should not be used for long-term forecasting – Ratings of FG leadership potential nearly identical to CG ratings
– Assessments for different levels should be completed independently
• Physical fitness and academic performance contribute most to rating of leadership potential, followed by performance on leadership tasks – Because ratings are consolidated across many dimensions, still somewhat of
a black box
– However, about half the variance in ratings of leadership potential is still unexplained

References
Kane, T. (2011). Why our best officers are leaving. The Atlantic. Retrieved January 24, 2011,
from http://www.theatlantic.com/magazine/archive/2011/01/why-our-best-officers-are-
leaving/8346/1/
Moskos, C. C. (2001). What ails the all-volunteer force: An institutional perspective.
Parameters, 31(2), 29-47.
Mumford, M. D., Marks, M. A., Connelly, M. S., Zaccaro, S. J., & Reiter-Palmon, R. (2000).
Development of leadership skills: Experience and timing. Leadership Quarterly, 11(1), 87-
114.
Putka, D. J., Le, H., McCloy, R. A., & Diaz, T. (2008). Ill-structured measurement designs in
organizational research: Implications for estimating interrater reliability. Journal of Applied
Psychology, 93, 959-981.