measuring mathematics self efficacy of students at the ... · pdf filemeasuring mathematics...
TRANSCRIPT

Joubert, M. and Andrews, P. (Eds.) Proceedings of the British Congress for Mathematics Education April 2010
159
Measuring Mathematics Self Efficacy of students at the beginning of their Higher Education Studies
Maria Pampaka and Julian Williams1
The University of Manchester
We report on the construction and validation of a self-report ‘Mathematics self-efficacy (MSE)’ instrument designed to measure this construct as a learning outcome of students entering their Higher Education (HE) studies. The sample of 1630 students ranged across different programmes with different levels of mathematical demand. The validation of the measure was performed using the Rating Scale Rasch model. Results include measures and fit statistics illustrating the construct validity, and a comparative analysis of sub-groups in the sample (i.e. gender and courses) ensuring validity across different groups. The comparison between the courses indicated the possibility of a two dimensional structure of the construct, which is explored here by performing separated analyses. The paper concludes with methodological implications and substantial considerations regarding the use of this instrument.
Keywords: Mathematics self efficacy, Higher Education, Rasch Analysis
Background
This paper is concerned with the widely known ‘mathematics problem’ (Smith 2004), which sees very few students to be well prepared to continue their studies from schools and colleges into mathematically demanding courses in Higher Education (HE). These courses include Mathematics, Science, Technology and Engineering (hereafter STEM). We particularly report here on the preliminary results of our ESRC funded research project “Mathematics learning, identity and educational practice: the transition into Higher Education” regarding the developed measures of mathematics self-efficacy.
The self-efficacy construct was initially described and contextualised by Bandura who distinguished two cognitive dimensions in this construct, i.e. personal self-efficacy and outcome expectancy. Self-efficacy (SE) beliefs “involve peoples’ capabilities to organise and execute courses of action required to produce given attainments” and perceived self-efficacy “is a judgment of one’s ability to organise and execute given types of performances…” (Bandura 1997, p. 3. Perceived self-efficacy beliefs have been explored in a wide range of disciplines and settings including educational research where they have been investigated in relation to progression to further study and career choices and in relation to affective and motivational domains and their influence on students’ performance and achievement. Most important and relevant to our study are research findings that suggest that 1 As author(s) of this paper we recognise the contribution made by the TransMaths team in collection of data, design of instruments and project, and discussions involving analyses and interpretations of the results: we would also like to acknowledge the support of the ESRC-TLRP award RES-139-25-0241, and continuing support from ESRC-TransMaths award RES-062-23-1213.
Joubert, M. and Andrews, P. (Eds.) Proceedings of the British Congress for Mathematics Education April 2010
160
perceived self-efficacy in mathematics is more predictive of students’ choices of mathematically related courses in programmes of further study than prior attainment or outcome expectations (e.g. Hackett and Betz 1989; Pajares and Miller 1994), hence the importance of the construct for the STEM agenda.
In previous work we have shown how this measure was developed and validated for post-compulsory, pre-university students. In particular we presented how we measured mathematics self-efficacy with an overall measure and two additional measures for two distinct aspects of mathematical task: the pure and more applied. Measurement results led to a hypothesis that there may need to be these two sub-dimensions in the construct of MSE at this level (Pampaka et al. under review; Pampaka et al. 2007). Our aim in this paper is to report on the extension of this work for use of a revised version of this instrument with HE students. Hence, some description of the revisions made to our earlier instruments is presented next.
Instrumentation and Analysis
The development of the instrument
Taking an individual’s self-efficacy to be their belief in their capability to successfully complete an identified range of actions in a given field, during our earlier work (see above) we devised an instrument that measures students’ self-efficacy in the use (or application) of AS level mathematics. 24 items (mathematical tasks) were constructed based on seven mathematical competences (Williams et al. 1999) including costing a project and handling experimental data graphically. These were complemented with six purely symbolic mathematical items (e.g. solving an equation in x). From this initial instrument (with 30 items) which was used with students at AS level (pre-university), the seven most difficult items (i.e. corresponding to post ‘AS study level’) were employed for the current version of the instrument for use with students beginning their HE studies. Three more advanced items were also added, to make the total 10 tasks that constitute the instrument measuring students’ confidence in the following mathematical areas: (1) calculating/estimating, (2) using ratio and proportion, (3) manipulating algebraic expressions, (4) proofs/proving, (5) problem solving, (6) modelling real situations, (7) using basic calculus (differentiation/integration), (8) using complex calculus (differential equations / multiple integrals), (9) using statistics, and (10) using complex numbers. Items were chosen so as to be relevant not only to students studying for Mathematics programmes but for a wider range of subjects, hence the ‘use of maths’ elements.
As usual in SE studies (e.g. Zimmerman and Martinez-Pons 1990; Hackett and Betz 1989), items were presented in the form of a 4-point Likert type scale where students were asked to choose the level of their confidence in solving them (but it was stressed they were not to solve the problems).
Analytical Considerations
Validation refers to the accumulation of evidence to support validity arguments. Our psychometric analysis for this purpose will be conducted within the Rasch measurement framework and therefore we follow the guidelines summarised by Wolfe and Smith Jr, (2007) based on Messick’s (1989) validity ‘definitions’. The Rasch rating scale is the most appropriate for scaling problems with Likert type items like ours. Analysis was performed with the FACETS software (Linacre 2003; Bond and Fox 2001) and the following statistics will guide our exploration for this paper

Joubert, M. and Andrews, P. (Eds.) Proceedings of the British Congress for Mathematics Education April 2010
161
under our validation framework: (a) Item fit statistics to check fulfilment of the unidimensionality assumption and ensure construct validity, (b) Category Statistics to justify communication validity (Lopez 1996), (c) Person – item maps and the item difficulty hierarchy to provide evidence for substantive, content and external validity, and (d) Differential Item Functioning (DIF) to suggest gender and course group differentiation of the constructed measures.
Results
Sample description
The preliminary results presented in this paper come from the analysis of the first data point out of three in our project. This happened before, and at the beginning of academic year 2008-2009, just when students were in their induction phase to university. The sample includes 1630 students, mainly coming from five UK HE institutions, split by gender and course as shown in Table 1: Table 1: Sample Description (by gender and course)
Gender Course Classification Female Male Total (%) Mathematically Demanding 311 731 1042 (64%) Non Mathematically Demanding 340 248 588 (36%) Total (%) 651(40%) 979(60%) 1630
It should be noted that under the “Mathematically demanding’ course classification there were students from Mathematic courses (including combined degrees), Electrical and Electronic, and Mechanical Engineering courses, Physics and Chemistry. The Non Mathematically demanding courses include Medicine and some educationally-related degrees.
Construct Validity: Checking for Unidensionality
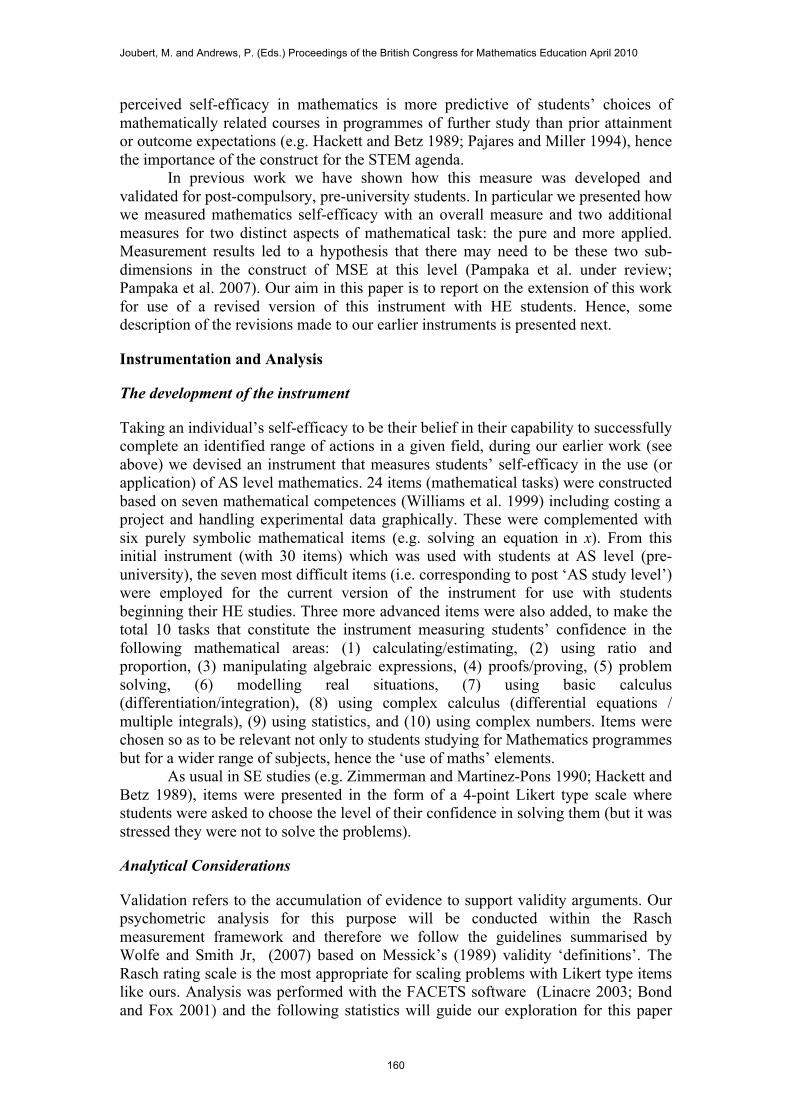
In the Rasch context fit statistics indicate how accurately the data fit the model. Fit statistics are local indicators of the degree to which the data is cooperating with the model’s requirements. Inconsistent data (e.g. misfit items or persons, i.e. with infit and outfit meansquare departing from the ideal of 1) may become a source of further inquiry. Fit statistics may also flag items to which responses are overly predictable (overfits), an indication that, in some way, they are over-dependent on the other items and might be the first choices for deletion (Wright 1994). For the purposes of this paper we take any number above 1.2 (of infit MnSq) as possible cause of concern, whereas infit values below 1 are considered as overfits and are not discussed. The results for our MSE measure are shown in Table 2 and indicate acceptable fit of almost all the items suggesting that they could constitute a scale, i.e. they measure what we call ‘students Mathematics Self efficacy at University’ (MSE@Uni). The only exception to this is the ‘statistics’ item which presents an Infit meansquare of 1.3 (highlighted) which indicates a possible mis-behaviour of this area of mathematics under our constructed measure. Further exploration of this aspect of mathematics can be justified with interview data from students; however this goes beyond the scope of this paper. We will seek however, more psychometric justification and explanation of this misfit through further analysis (i.e. DIF).
Joubert, M. and Andrews, P. (Eds.) Proceedings of the British Congress for Mathematics Education April 2010
162
Table 2: Measures and fit statistics for the items of the scale -------------------------------------------------------------------------------------------------- | Obsvd Obsvd Obsvd Fair-M| Model | Infit Outfit | | | | Score Count Average Avrage|Measure S.E. |MnSq ZStd MnSq ZStd | PtBis | Nu Items | -------------------------------------------------------------------------------------------------- | 3182 1328 2.4 2.41| 1.28 .04 | 1.0 0 1.0 0 | .53 | 1 modeling | | 4225 1331 3.2 3.25| -.56 .05 | 0.9 -3 0.9 -3 | .56 | 2 calculating | | 4055 1323 3.1 3.13| -.26 .04 | 1.0 -1 1.0 -1 | .54 | 3 ratio_proportion | | 4568 1326 3.4 3.54| -1.39 .05 | 1.0 0 0.9 -2 | .69 | 4 algebra | | 3770 1320 2.9 2.91| .25 .04 | 1.0 0 1.0 0 | .65 | 5 proof | | 3691 1318 2.8 2.85| .38 .04 | 0.9 -2 0.9 -2 | .55 | 6 problem_solving | | 4239 1309 3.2 3.31| -.74 .05 | 1.0 1 0.9 -1 | .71 | 7 Basic_calculus | | 3633 1313 2.8 2.82| .46 .04 | 0.9 -2 0.9 -2 | .65 | 8 complex_calc | | 3683 1309 2.8 2.86| .36 .04 | 1.3 7 1.4 8 | .39 | 9 statistics | | 3764 1308 2.9 2.93| .20 .04 | 1.2 4 1.1 3 | .63 | 10 complex_num | -------------------------------------------------------------------------------------------------- | 3881.0 1318.5 2.9 3.00| .00 .04 | 1.0 0.3 1.0 -0.1| .59 | Mean (Count: 10) | | 374.2 8.0 0.3 0.30| .71 .00 | 0.1 3.2 0.1 3.3| .09 | S.D. | -------------------------------------------------------------------------------------------------- RMSE (Model) .04 Adj S.D. .71 Separation 16.15 Reliability 1.00 Fixed (all same) chi-square: 2476.3 d.f.: 9 significance: .00 Random (normal) chi-square: 9.0 d.f.: 8 significance: .34 --------------------------------------------------------------------------------------------------
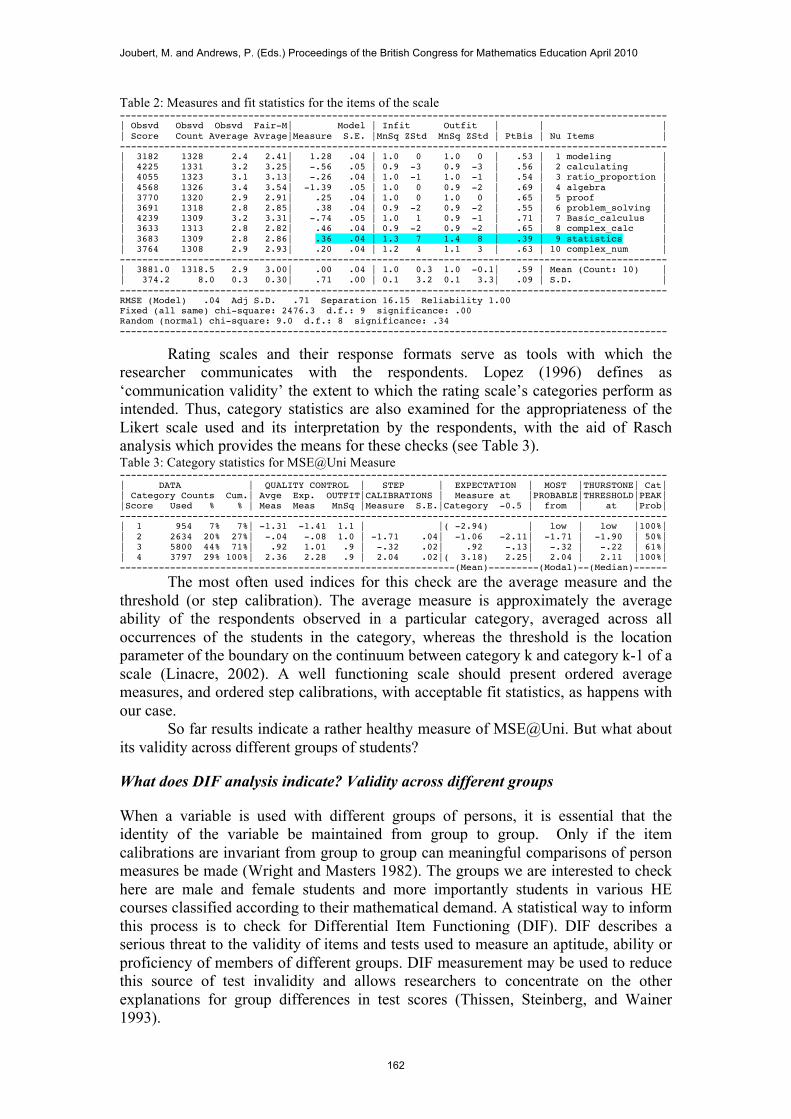
Rating scales and their response formats serve as tools with which the researcher communicates with the respondents. Lopez (1996) defines as ‘communication validity’ the extent to which the rating scale’s categories perform as intended. Thus, category statistics are also examined for the appropriateness of the Likert scale used and its interpretation by the respondents, with the aid of Rasch analysis which provides the means for these checks (see Table 3). Table 3: Category statistics for MSE@Uni Measure -------------------------------------------------------------------------------------------------- | DATA | QUALITY CONTROL | STEP | EXPECTATION | MOST |THURSTONE| Cat| | Category Counts Cum.| Avge Exp. OUTFIT|CALIBRATIONS | Measure at |PROBABLE|THRESHOLD|PEAK| |Score Used % % | Meas Meas MnSq |Measure S.E.|Category -0.5 | from | at |Prob| -------------------------------------------------------------------------------------------------- | 1 954 7% 7%| -1.31 -1.41 1.1 | |( -2.94) | low | low |100%| | 2 2634 20% 27%| -.04 -.08 1.0 | -1.71 .04| -1.06 -2.11| -1.71 | -1.90 | 50%| | 3 5800 44% 71%| .92 1.01 .9 | -.32 .02| .92 -.13| -.32 | -.22 | 61%| | 4 3797 29% 100%| 2.36 2.28 .9 | 2.04 .02|( 3.18) 2.25| 2.04 | 2.11 |100%| ------------------------------------------------------------(Mean)---------(Modal)--(Median)------
The most often used indices for this check are the average measure and the threshold (or step calibration). The average measure is approximately the average ability of the respondents observed in a particular category, averaged across all occurrences of the students in the category, whereas the threshold is the location parameter of the boundary on the continuum between category k and category k-1 of a scale (Linacre, 2002). A well functioning scale should present ordered average measures, and ordered step calibrations, with acceptable fit statistics, as happens with our case.
So far results indicate a rather healthy measure of MSE@Uni. But what about its validity across different groups of students?
What does DIF analysis indicate? Validity across different groups
When a variable is used with different groups of persons, it is essential that the identity of the variable be maintained from group to group. Only if the item calibrations are invariant from group to group can meaningful comparisons of person measures be made (Wright and Masters 1982). The groups we are interested to check here are male and female students and more importantly students in various HE courses classified according to their mathematical demand. A statistical way to inform this process is to check for Differential Item Functioning (DIF). DIF describes a serious threat to the validity of items and tests used to measure an aptitude, ability or proficiency of members of different groups. DIF measurement may be used to reduce this source of test invalidity and allows researchers to concentrate on the other explanations for group differences in test scores (Thissen, Steinberg, and Wainer 1993).

Joubert, M. and Andrews, P. (Eds.) Proceedings of the British Congress for Mathematics Education April 2010
163
There are different methods to check for DIF. In our case a t-test on the two estimates of difficulty parameters based on the two groups of students was performed (see Figure 1, with the lines indicating the 95% confidence intervals in item estimates). The points that are outside the confidence intervals in Figure 1 denote the items with high DIF when comparing students of mathematically demanding subjects with the rest of the students1.
Figure 1: Comparison of item estimates for the two student groups
In this case, it appears that only two items are within the acceptable confidence intervals (these are advanced calculus and proof). Figure 1 indicates a ‘bad’ measure in psychometric terms, with the items on the top favoring the students of mathematically demanding subjects and those on the bottom the rest of the students. However, this picture should be given a closer and more careful insight, in respect to the underlying construct it measures (i.e. students’ self efficacy) and its implications for mathematics education.
The 10 items of MSE@Uni seem to be clustering into two groups based on DIF results. The circled items denote areas of mathematics which form part of the AS/A2 mathematics syllabus; hence students who (successfully) completed this course will be at an advantage, in regards to their self efficacy. In contrast, the other items denote more applied mathematical areas. Hence the results point to the possibility of a second underlying dimension in the construct of MSE@Uni.
Two possible dimensions: Investigation of Subscales of MSE@Uni
In order to further explore the possibility of a two dimensional structure of the MSE@Uni measure, the two groups of items defined above based on the results of DIF analysis are analysed separately to check whether they could define two sub-measures. The results of this analysis are shown in Table 4 and indicate two measures 1 Similar analysis for gender indicated smaller differences: the Statistics item is favoring female students, whereas modeling and ratio/proportion items are favoring male students. Due to limitations of the length of this paper, however, focus will be placed on the course classification.

Joubert, M. and Andrews, P. (Eds.) Proceedings of the British Congress for Mathematics Education April 2010
164
of MSE with acceptable fit statistics and good reliability and separation indices. Category statistics are also acceptable but omitted from this presentation. Table 4: Measures and fit statistics for the items of the two subscales of MSE@Uni construct (AS-related topics on the top, and Applied MSE at the bottom) -------------------------------------------------------------------------------------------------- | Obsvd Obsvd Obsvd Fair-M| Model | Infit Outfit | | | | Score Count Average Avrage|Measure S.E. |MnSq ZStd MnSq ZStd | PtBis | N Items | -------------------------------------------------------------------------------------------------- | 3206 1192 2.7 2.71| .93 .05 | 1.0 0 1.1 1 | .65 | 4 complex_calc | | 3339 1198 2.8 2.82| .65 .05 | 1.0 1 1.0 1 | .67 | 2 proof | | 3337 1187 2.8 2.84| .58 .05 | 1.2 4 1.2 3 | .65 | 5 complex_num | | 3812 1188 3.2 3.29| -.65 .05 | 0.9 -3 0.8 -4 | .76 | 3 Basic_calculus | | 4127 1201 3.4 3.56| -1.51 .06 | 0.9 -1 0.8 -2 | .72 | 1 algebra | -------------------------------------------------------------------------------------------------- | 3564.2 1193.2 3.0 3.05| .00 .05 | 1.0 0.2 1.0 -0.1| .69 | Mean (Count: 5) | | 348.9 5.5 0.3 0.33| .93 .00 | 0.1 2.8 0.1 3.1| .04 | S.D. | -------------------------------------------------------------------------------------------------- RMSE (Model) .05 Adj S.D. .93 Separation 17.84 Reliability 1.00 Fixed (all same) chi-square: 1457.7 d.f.: 4 significance: .00 Random (normal) chi-square: 4.0 d.f.: 3 significance: .26 -------------------------------------------------------------------------------------------------- | Obsvd Obsvd Obsvd Fair-M| Model | Infit Outfit | | | | Score Count Average Avrage|Measure S.E. |MnSq ZStd MnSq ZStd | PtBis | N Items | -------------------------------------------------------------------------------------------------- | 3137 1313 2.4 2.44| 1.35 .05 | 1.1 2 1.1 2 | .46 | 1 model | | 4180 1316 3.2 3.20| -1.05 .05 | 0.8 -3 0.8 -4 | .57 | 2 calculating | | 4011 1309 3.1 3.09| -.65 .05 | 1.0 -1 0.9 -1 | .55 | 3 ratio_proportion | | 3646 1303 2.8 2.85| .19 .05 | 0.9 -2 0.9 -2 | .54 | 4 problem_solving | | 3638 1294 2.8 2.86| .16 .05 | 1.2 4 1.2 4 | .44 | 5 statistics | -------------------------------------------------------------------------------------------------- | 3722.4 1307.0 2.8 2.89| .00 .05 | 1.0 -0.1 1.0 -0.2| .51 | Mean (Count: 5) | | 360.1 7.8 0.3 0.26| .83 .00 | 0.1 3.2 0.1 3.2| .05 | S.D. | -------------------------------------------------------------------------------------------------- RMSE (Model) .05 Adj S.D. .83 Separation 16.82 Reliability 1.00 Fixed (all same) chi-square: 1466.8 d.f.: 4 significance: .00 Random (normal) chi-square: 4.0 d.f.: 3 significance: .26
The results of DIF analysis of these two new measures are also shown in
Figure 2. It is obvious that the differences between the two groups of students are now smaller; it should be noted that none of the DIF values is bigger than 0.5 logits, and hence they could be considered as a smaller problem (Linacre 1994) which may be ignored in some analyses.
2a. AS-related MSE@Uni 2b. Applied MSE@Uni Figure 2: DIF Analysis for the two subscales of MSE@Uni
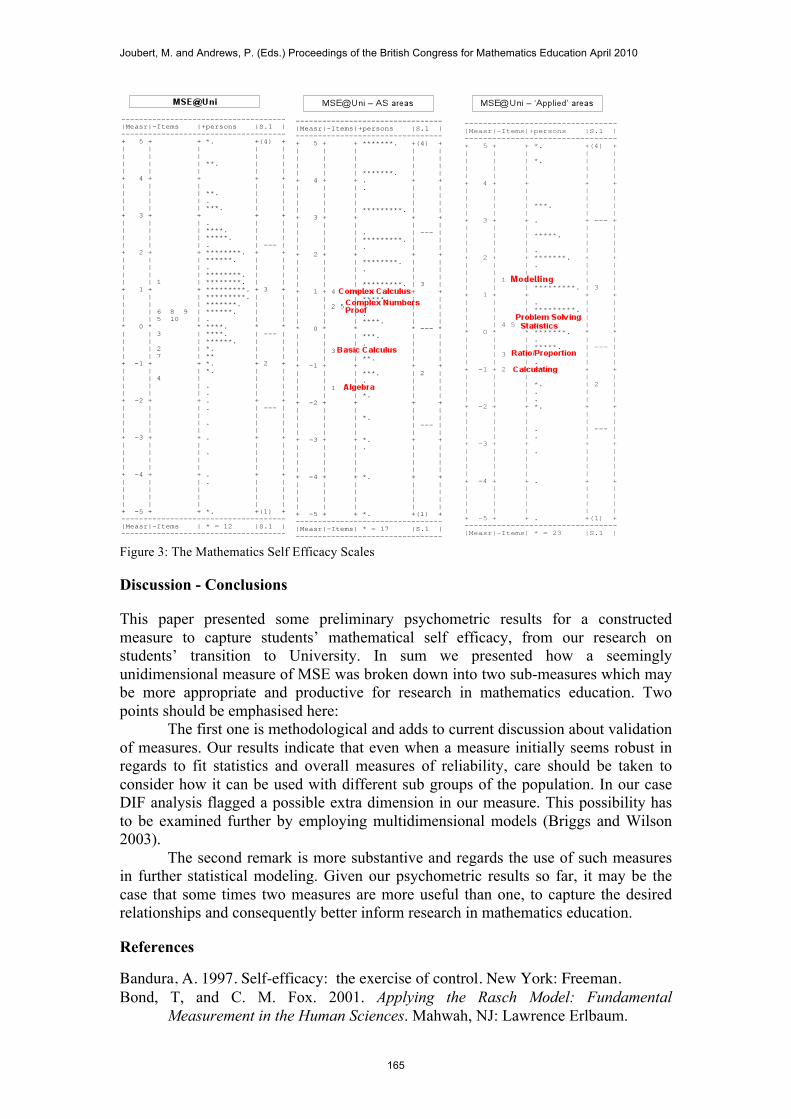
Figure 3 finally shows the three resulting measurement scales (MSE@Uni and the two subscales, namely MSE@Uni-AS_areas and MSE@Uni-Applied_areas). The right side of each scale shows the distribution of students (the higher the student’s position the more self-efficacious they are); Numbers under the ‘item’ column indicate the item and its location on the same logit scale (For MSE@Uni these numbers are defined in Table 2). More difficult items are located higher on the scale. Observation of the scales, based on the spread of items and students can justify the split into the two subscales: It appears that items for the MSE@Uni are centred in a small area and do not cover the whole ability range of students, hence they do not discriminate enough for this group of students.
Joubert, M. and Andrews, P. (Eds.) Proceedings of the British Congress for Mathematics Education April 2010
165
Figure 3: The Mathematics Self Efficacy Scales
Discussion - Conclusions
This paper presented some preliminary psychometric results for a constructed measure to capture students’ mathematical self efficacy, from our research on students’ transition to University. In sum we presented how a seemingly unidimensional measure of MSE was broken down into two sub-measures which may be more appropriate and productive for research in mathematics education. Two points should be emphasised here:
The first one is methodological and adds to current discussion about validation of measures. Our results indicate that even when a measure initially seems robust in regards to fit statistics and overall measures of reliability, care should be taken to consider how it can be used with different sub groups of the population. In our case DIF analysis flagged a possible extra dimension in our measure. This possibility has to be examined further by employing multidimensional models (Briggs and Wilson 2003).
The second remark is more substantive and regards the use of such measures in further statistical modeling. Given our psychometric results so far, it may be the case that some times two measures are more useful than one, to capture the desired relationships and consequently better inform research in mathematics education.
References
Bandura, A. 1997. Self-efficacy: the exercise of control. New York: Freeman. Bond, T, and C. M. Fox. 2001. Applying the Rasch Model: Fundamental
Measurement in the Human Sciences. Mahwah, NJ: Lawrence Erlbaum.

Joubert, M. and Andrews, P. (Eds.) Proceedings of the British Congress for Mathematics Education April 2010
166
Briggs, D. C. , and M. Wilson. 2003. An Introduction to Multidimensional Measurement using Rasch Models. Journal of Applied Measurement 4 (1):87-100.
Hackett, G. , and N.E. Betz. 1989. An exploration of the mathematics self-efficacy/mathematics performance correspondence. Journal for Research in Mathematics Education 20 (3):261-273.
Linacre, J. M. 1994. Sample Size and Item Calibration Stability. Rasch Measurement Transactions 7 (4):328.
———. 2002. Optimizing Rating Scale Category Effectiveness Journal of Applied Measurement 3 (1):85-106.
———. 2003. A user’s guide to FACETS: Rasch-Model Computer programs [software manual]. Chicago: Winsteps.com.
Lopez, W. A. 1996. Communication Validity and Rating Scales. Rasch Measurement Transactions 10 (1):482-483.
Messick, S. 1989. Validity. In Educational Measurement edited by R. L. Linn. USA: American Council of Education and the Oryx Press.
Pajares, F., and M. D. Miller. 1994. Role of self-efficacy and self-concept beliefs in mathematical problem solving: A path analysis. Journal of Educational Psychology 86 (2):193-203.
Pampaka, M., L. Black, P. David, P. Hernandez-Martinez, G. Hutcheson, S. Nicholson, G. Wake, and J.S. Williams. 2007. Multi-dimensional structure of a (use of) Mathematics self efficacy instrument. In American Educational Research Association annual conference (AERA). Chigago.
Pampaka, M., I. Kleanthous, J. Williams, Graeme Hutchenson, and G. Wake. under review. Measuring mathematics self efficacy as a learning outcome. Research in Mathematics Education.
Smith, A. 2004. Making mathematics count – the report of Professor Adrian Smith’s Inquiry into Post-14 Mathematics Education. London: DfES.
Thissen, D., L. Steinberg, and H. Wainer. 1993. Detection of Differential Item Functioning Using the Parameters of Item Response Models. In Differential Item Functioning, edited by P. W. Holland and H. Wainer. London Lawrence Erlbaum Associates, Publishers.
Williams, J.S., G. Wake, and A. Jervis. 1999. General Mathematical Competence: A New Way of Describing and Assessing a Mathematics Curriculum. In Rethinking the Mathematics Curriculum, edited by C. Hoyles, C. Morgan and G. Woodhouse. London: Falmer Press.
Wolfe, E. W., and E. V. Smith Jr. 2007. Instrument Development Tools and Activities for Measure Validation Using Rasch Models: Part II - Validation Activities. Journal of Applied Measurement 8 (2):204-234.
Wright, B. D. 1994. Data Analysis and Fit. Rasch Measurement Transactions 7 (4):324.
Wright, B. D., and G. N. Masters. 1982. Rating Scale Analysis. Chicago: MESA Press.
Zimmerman, B. J., and M. Martinez-Pons. 1990. Student Differences in Self-Regulated learning: Relating Grade, Sex, and Giftedness to Self-Efficacy and Strategy Use. . Journal of Educational Psychology 82 (1):51-59.