measuring meritocracy in the public sector … · measuring meritocracy in the public sector in ......
TRANSCRIPT
MEASURING MERITOCRACY IN THE PUBLIC SECTOR IN EUROPE:
A New National and Sub-National Indicator
Nicholas Charron
Carl Dahlström
Victor Lapuente
WORKING PAPER SERIES 2015:8 QOG THE QUALITY OF GOVERNMENT INSTITUTE
Department of Political Science University of Gothenburg Box 711, SE 405 30 GÖTEBORG June 2015 ISSN 1653-8919 © 2015 by Nicholas Charron, Carl Dahlström & Victor Lapuente. All rights reserved.
2
Measuring Meritocracy in the Public Sector in Europe: a New National and Sub-National Indicator Nicholas Charron Carl Dahlström Victor Lapuente QoG Working Paper Series 2015:8 June 2015 ISSN 1653-8919
Nicholas Charron The Quality of Government Institute Department of Political Science University of Gothenburg [email protected]
Carl Dahlström The Quality of Government Institute Department of Political Science University of Gothenburg [email protected]
Victor Lapuente The Quality of Government Institute Department of Political Science University of Gothenburg [email protected]
3
Introduction
Since the late 19th century, the presence of an independent and meritocratic bureaucracy has been
posited as an advantage for effective bureaucratic behavior and a means of limiting patrimonial
networks and corruption, among other benefits (Northcote and Trevelyan 1853; Wilson 1887). In
his influential writings, Max Weber (1978 [1922]) argued that the bureaucratic organization, based
on merit principles, was a superior form of organization which, in addition to other things, contrib-
utes to economic development. These suggestions have informed debates in political science, soci-
ology and economics ever since, and modern day studies have often confirmed the original ideas
(Dahlström, Lapuente and Teorell 2012; Evans and Rauch 1999; Krause, Lewis, and Douglas 2006;
Horn 1995; Miller 2000; Peters and Pierre 2001).
There is little consensus on how the features of an independent and meritocratic bureaucracy
should be measured across countries, however, and broad empirical studies are therefore rare. The
few such studies that exist have advanced measures that focus on certain aspects of meritocratic
practices such as hiring, predictable long-term employment, time horizons and relatively high sala-
ries, always on the country level. They are also constructed exclusively on expert surveys (Dahl-
ström et al. 2015; Evans and Rauch 1999; Teorell, Dahlström and Dahlberg 2011). Although these
have indeed contributed to the knowledge in the field, the data on which they are built come with
some problems. First, even though expert assessments are sometimes the only way to learn about
complex variables, and are therefore valuable tools, they are far from perfect. Probably everyone
would agree that more direct, experienced based measures are preferable. Second, even when we
talk about national bureaucracies in centralized countries, there are remarkable differences within
countries in how institutions perform de facto and in policy outcomes (Charron and Lapuente
2013; Charron, Dijsktra and Lapuente 2014; Tabellini 2008). Country means naturally miss this
variation and therefore introduce what Stein Rokkan (1970) called a “whole-nation-bias” into com-
parative studies. Third, as Olsen (2005) remarks, there are many aspects of a Weberian bureaucracy
that do not pull in the same direction. Aggregating different aspects of it—for example into a “We-
berianess scale” (Evans and Rauch 1999, 755)—might therefore bias conclusions.
Here we propose a set of novel measures that complement existing measures in all these three as-
pects and thus fill important gaps in this burgeoning literature. The measures we present are not
4
based on expert assessments but on public sector employees’ experience and citizens’ perceptions.
We create two measures—that can be combined into one—from a recent survey (2013) of over
85,000 citizens in 24 European countries. One taps directly into public sector employees’ experi-
ences and asks whether they think success in the public sector is based on merit or on connections
and luck. The other is based on perceptions of citizens working outside the public sector. In order
not to have to trust country means, we follow Snyder’s (2001) suggestion and explore within coun-
try variation at the sub-national level that allows scholars to test causal inferences within countries,
which constitutes a new level of analysis in this field. To capture this, the survey offers a sample of
over 400 respondents in 212 regions in the 24 European countries included, which makes it possi-
ble for us also to explore spatial variations in bureaucratic meritocracy within countries. We are
therefore able to offer the first indicator of regional level experiences and perceptions of the extent
to which the public sector is meritocratic, together with aggregated cross-country measures. Finally,
we follow Evans and Rauch (1999) and study the personnel side, because it is arguably the most
important side of an independent and meritocratic bureaucracy. However, in contrast to previous
measures that focus on the de jure rules (salaries, hiring practices etc.), we capture more closely the
de facto side—whether success in the public sector is based on merit, according to current employees
(experiences) and citizens who are both potential employees and users (perceptions).
The rest of this paper discusses the survey in general and the questions employed to build our two
measures. We use the experienced based measure to map meritocracy in Europe. Later, we explore
the external validity of the measures provided here, showing correlations with alternative measures
based on expert opinions, as well as standard variables from the literature that we would expect to
correlate highly with a meritocratic bureaucracy, such as GDP per capita, corruption, bureaucratic
effectiveness, rule of law, human development (HDI), measures of inequality (income and gender)
and social trust. We find that when we aggregate the measures to the national level, they correlate
strikingly highly with alternative, expert-based survey data, along with measures of economic and
social development, which lends credibility to the sub-national indicator. The measure at the sub-
national level correlates highly with past measures of petty corruption (percentage of reported brib-
ery), the European Quality of Government Index (EQI) (Charron, Dijkstra and Lapuente 2014)
and several similar indices of social and economic development and social trust. Thus, despite cap-
turing this concept from a different direction, previous measures based on formal/expert assess-
ments are in strong agreement with our informal/citizen experience-based measure. We finally look
at the extent to which meritocracy varies spatially within countries. We ask whether this variation is

5
meaningful and try to answer by means of correlating it with Kuznets’ curve of economic devel-
opment (1956), openness to trade, length of European Union membership and political and fiscal
decentralization. Our measure correlates as expected, which is an indication that the variation it is
picking up is not only random.
Measuring Meritocracy in the Public Sector: a Review of Existing
Measures
Contrary to the case in economics and political science, for example, public administration has seen
few broad comparisons because the lack of data. While we know relatively much about the impact
of political regimes, types of elites, openness and media freedom on for example corruption
(Treisman 2007) and economic growth (Person and Tabellini 2003), the lack of data on bureaucra-
cies has hampered our understanding of the effects of bureaucratic structures, although there is
good reason to believe that how bureaucracies are organized is very important. There are indeed
several case comparisons (e.g. Silberman 1993), edited volumes with comparable case studies (e.g.
Peters and Pierre 2004) and studies on single countries (e.g. Lewis 2008) that make it safe to con-
clude that how the bureaucracy is organized, generally, and the level of meritocracy, specifically, are
central to bureaucratic efficiency and effectiveness, but we don’t know how important it is com-
pared to other factors, or whether effects are similar across the globe. For that we would need data
that are difficult to find.
To our knowledge there are only two datasets where the structure of bureaucracy is measured in a
broad set of countries. The first is Peter Evans and James Rauch’s pioneering work (Evans and
Rauch 1999; Rauch and Evans 2000) that covers 35 developing or semi-industrialized countries and
focuses on the period from 1970-1990. While it provides important insight into the bureaucratic
structures of a particular group of countries that experienced unprecedented growth rates with the
help of autonomous bureaucracies (such as Spain, South Korea and other Asian “Tigers”), it re-
mains unclear whether the same results hold for other parts of the world. The second broad dataset
is newer, includes more countries, and is collected by the Quality of Government Institute on two
different occasions (Dahlström et al. 2015; Teorell, Dahlström and Dahlberg 2011). Based on these
two datasets, the impact of bureaucratic structures, such as meritocratic recruitment to the public
sector, is shown to have a surprisingly large impact on corruption (Dahlström, Lapuente and Te-

6
orell 2012; Rauch and Evans 2000), economic growth (Evans and Rauch 1999), poverty reduction
(Henderson et al. 2007) and effectiveness and reform capacity (Dahlström and Lapuente 2014).
As mentioned in the introduction, these datasets are limited as they are based on expert assess-
ments, are thus perception based, and are only available on the national level, even though there
might be a great deal of sub-national variation. Although both datasets have produced valuable
results, there is very much room for improvement.
Measuring Public Sector Meritocracy ‘from Below’: A Citizen Experi-
ence Index
Meritocracy in the public sector
According to Evans and Rauch (1999), meritocracy in the public sector is mostly a product of two
factors. The first is the weight put on education and examination when a public employee is hired,
and the basic question of the grounds on which the employee is hired is a powerful signal of whom
she owes her loyalty: to her peers, the Corps or the ruling party. The dividing line goes between
systems that appreciate education and talent, on the one hand, and systems in which strong ties
with the hiring part are pivotal, on the other.
However, although the signal given when recruiting public employees is important, it is not the only
way that public employees learn what is appreciated. The second factor, claimed by Evans and
Rauch (1999), therefore concerns what makes the rest of the career successful for a public employ-
ee. In a Weberian understanding of meritocracy (Weber [1922] 1978), predictable careers and long-
term employment are important for creating a working environment in which meritocracy is re-
warded. Appreciating hard work or appreciating connections gives rise to two rather different sys-
tems of governance.
We will try in this paper to measure the de facto level of meritocracy in a bureaucracy. As we will
describe in more detail below, we use a different strategy than previous studies: we will not try to
observe institutions and routines that are supposed to contribute to meritocracy but rather try to
measure it directly.

7
The European Quality of Government Survey 2013
Our measure uses several survey questions from the latest round of the survey, which is funded by
the European Commission’s Seventh Annual Framework (Charron, Lapuente and Rothstein 2013)
and is intended to track citizen experiences and perceptions of “quality of government” (QoG) in
the public sector. The survey was started in February, 2013, and was conducted in the local majority
language in each country/region. It included 24 questions on the quality of institutions as well as
demographic questions about the respondents. The results were returned to the Quality of Gov-
ernment Institute (Sweden) in April, 2013.
The large international survey was conducted via telephone interviews, each of approximately ten
minutes in length, during which 32 questions were posed. The total sample of respondents was
over 85,000 individuals across Europe. The focus of the data is the regional level and the survey
selectively sampled over 400 respondents per region. The sample size per country thus varies de-
pending on the number of regions. The regional level for each country in the survey is based on the
European Union’s NUTS statistical regional level1. The NUTS level for each country was selected
according to two factors—the extent to which elected political authorities have administrative,
fiscal or political control over one or more of the public services in either health, education or law
enforcement, and the price for conducting the survey. In direct consultation with the EU Commis-
sion, the NUTS 1 and 2 regions were selected on these bases2.
As a consequence of this dissension, one issue that must be dealt with is that the regions we are
targeting in some countries—such as Germany, Belgium, Italy or Spain—are both politically and
administratively meaningful, while others are less so. This is to say that their local constituents elect
these regional governments, have their own autonomous revenues (either from directly taxing citi-
zens or central government transfers or both) and a degree of autonomy with which to redistribute
resources in the form of public services. In more politically centralized countries, such as Bulgaria,
Romania, Slovakia or Portugal, this issue becomes more challenging. The regions of our focus
(NUTS 1 or NUTS 2), while meaningful in the sense that EU development funds are targeted di-
rectly to them and that Eurostat reports annual data on them, have in some cases been mainly an
1 NUTS stands for ‘Nomenclature of territorial units for statistics’ and is made up of statistical regions for the EU and
other European countries. For further information, see: http://ec.europa.eu/eurostat/web/nuts/overview 2 The sample of countries and corresponding NUTs level and regions is reported in Appendix 1.

8
invention for EU statistical purposes, and are not politically meaningful. For this reason, asking a
respondent in some cases whether most people in the public sector “can succeed if they are willing
to work hard” in your region might be a bit confusing, since respondents from countries such as
Hungary or Romania might not recognize that they are even living in that region.
It can therefore be argued that the administrative and political responsibility of the NUTS regions
varies too much in different countries and thus poses a problem in analysing these data. We recog-
nise this problem and therefore include a variable identifying the politically relevant regions, which
makes it possible for anyone to take this issue into account. We would however argue against gen-
erally dropping the regions from the centralized countries as we attempt to capture all regional
variation within a country and, as several other scholars have noted (e.g. Tabellini 2008), there are
numerous empirical indications and anecdotal evidence pointing out that provision, quality of pub-
lic services, and informal rules in countries with powerful central governments can nonetheless vary
greatly across different regions.
Thus, to synthesize the survey and make the results as comparable between and within countries as
possible, we ask respondents questions that focus on de facto meritocracy and other concepts that
the survey is trying to capture in their area.
In order to build the indictor of meritocracy discussed in this paper, we employ the following sur-
vey question:
“Which statement comes closer to your own views? 1 means you agree completely with the
statement on the left; 10 means you agree completely with the statement on the right; if your
views fall somewhere in between, you can choose any number between 1 and 10:
1 (In the public sector most people can succeed if they are willing to work hard)
10 (Hard work is no guarantee of success in the public sector for most people—it’s more a
matter of luck and connections)”
As we have indicated, we build two different measures from this question. The first is more experi-
ence based, and the second is based on perceptions. To separate between experience- based and
perception-based responses, we thus take a second step and draw from the following question:

9
“As far as your current occupation is concerned, would you say you work in the public sec-
tor (a public sector organization is either wholly owned by the public authorities or they have
a majority share), the private sector or would you say that you are without a professional ac-
tivity?
PUBLIC SECTOR (Military / Soldier; Law enforcement/ police/ fire-fighter; Health care
worker/ doctor; Teacher, Academic, researcher; Other government agency)
PRIVATE SECTOR (Self-employed / small business owner/ Freelancer; Other private sec-
tor employee)
WITHOUT A PROFESSIONAL ACTIVITY (Currently unemployed; Housewife /
Houseman; Pensioner, retired; Pupil / Student / Trainee; Other)”
We record whether respondents answered that they were employed in the first five categories
(“public sector”) as an answer based on experiences, while all other professions fell under percep-
tions of public sector meritocracy. Of the over 85,000 respondents, roughly 30 percent work in the
public sector in some capacity while, consequently, 70 percent do not.
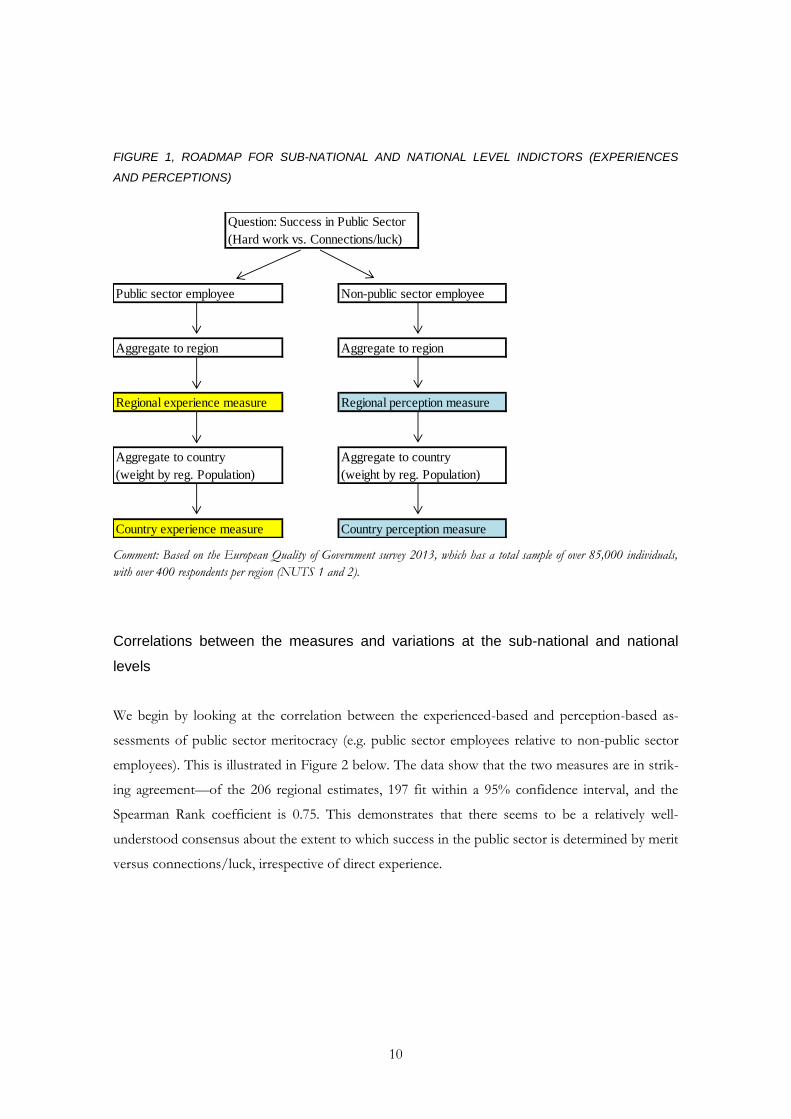
This gives us two different measures of meritocracy in the public sector. In the final step, we aggre-
gate these answers, either to the regional (NUTS 1 or 2) or to the national level. Figure 1 shows the
roadmap used in this paper to build the sub-national and national level indictors from the survey
data.
10
FIGURE 1, ROADMAP FOR SUB-NATIONAL AND NATIONAL LEVEL INDICTORS (EXPERIENCES
AND PERCEPTIONS)
Comment: Based on the European Quality of Government survey 2013, which has a total sample of over 85,000 individuals,
with over 400 respondents per region (NUTS 1 and 2).
Correlations between the measures and variations at the sub-national and national
levels
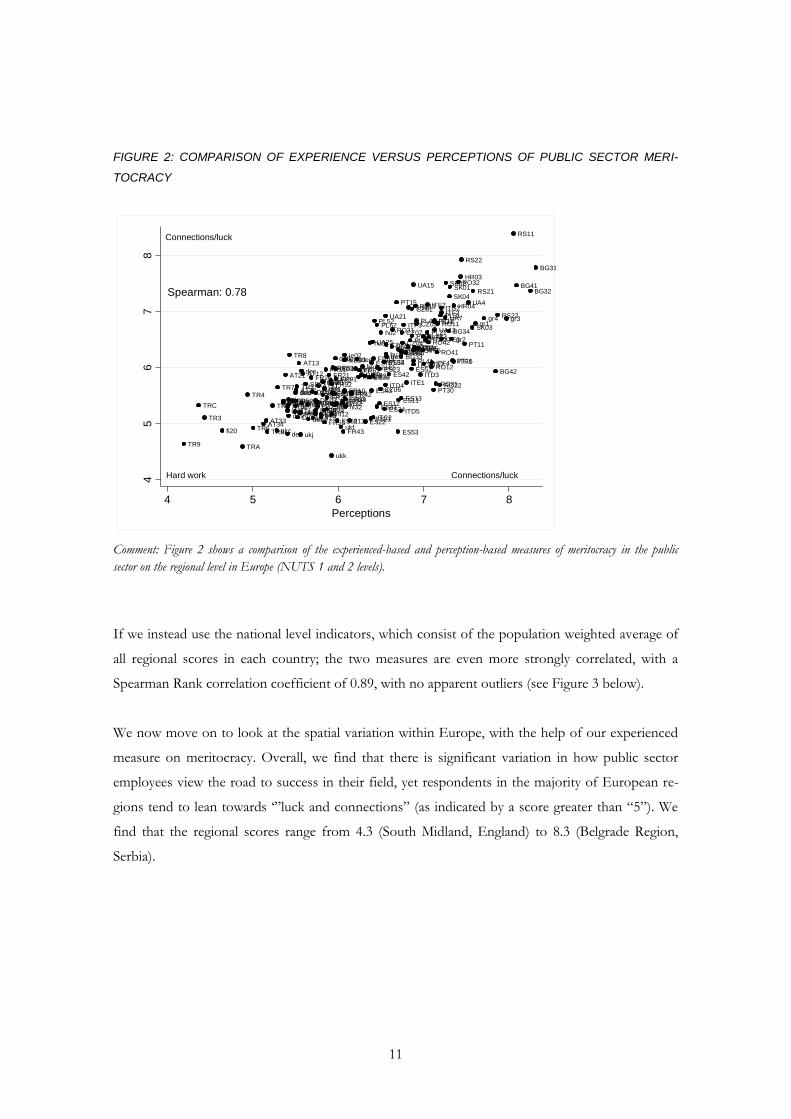
We begin by looking at the correlation between the experienced-based and perception-based as-
sessments of public sector meritocracy (e.g. public sector employees relative to non-public sector
employees). This is illustrated in Figure 2 below. The data show that the two measures are in strik-
ing agreement—of the 206 regional estimates, 197 fit within a 95% confidence interval, and the
Spearman Rank coefficient is 0.75. This demonstrates that there seems to be a relatively well-
understood consensus about the extent to which success in the public sector is determined by merit
versus connections/luck, irrespective of direct experience.
Question: Success in Public Sector
(Hard work vs. Connections/luck)
Public sector employee Non-public sector employee
Aggregate to region Aggregate to region
Regional experience measure Regional perception measure
Aggregate to country Aggregate to country
(weight by reg. Population) (weight by reg. Population)
Country experience measure Country perception measure
11
FIGURE 2: COMPARISON OF EXPERIENCE VERSUS PERCEPTIONS OF PUBLIC SECTOR MERI-
TOCRACY
Comment: Figure 2 shows a comparison of the experienced-based and perception-based measures of meritocracy in the public
sector on the regional level in Europe (NUTS 1 and 2 levels).
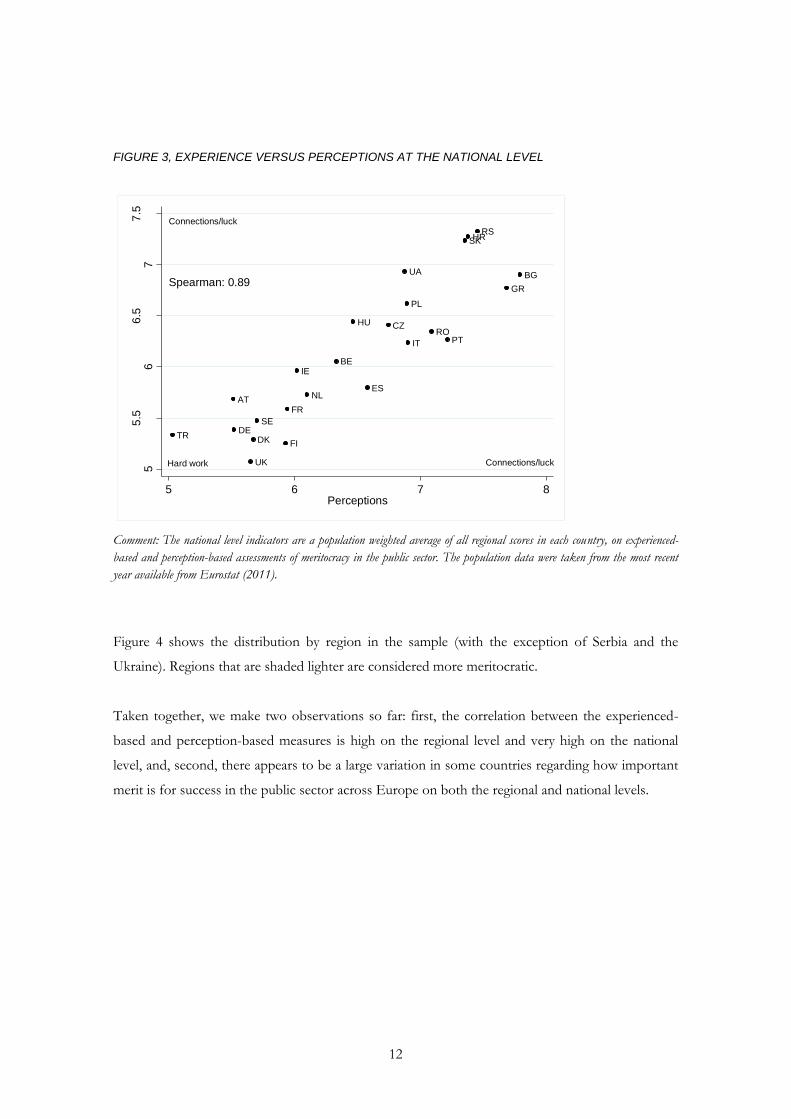
If we instead use the national level indicators, which consist of the population weighted average of
all regional scores in each country; the two measures are even more strongly correlated, with a
Spearman Rank correlation coefficient of 0.89, with no apparent outliers (see Figure 3 below).
We now move on to look at the spatial variation within Europe, with the help of our experienced
measure on meritocracy. Overall, we find that there is significant variation in how public sector
employees view the road to success in their field, yet respondents in the majority of European re-
gions tend to lean towards ‘”luck and connections” (as indicated by a score greater than “5”). We
find that the regional scores range from 4.3 (South Midland, England) to 8.3 (Belgrade Region,
Serbia).
AT11
AT12
AT13
AT21
AT22AT31
AT32
AT33AT34
be1be2
be3
BG31
BG32
BG33
BG34
BG41
BG42
CZ01
CZ02
CZ03
CZ04CZ05
CZ06
CZ07
CZ08
de1
de2de3
de4
de5
de6
de7
de8
de9
deadeb
dec
ded dee
def
deg
DK01
DK02
DK03
DK04
DK05 ES11ES12
ES13
ES21ES22
ES23
ES24
ES30
ES41
ES42
ES43
ES51ES52
ES53
ES61
ES62
ES70
fi13
fi18
fi19
fi1a
fi20
FR10
FR21
FR22FR23FR24
FR25
FR26
FR30FR41 FR42
FR43
FR51
FR52
FR53
FR61
FR62
FR63FR71
FR72
FR81
FR82
FR83
FR91FR92
FR93
FR94
gr1
gr2
gr3gr4
HR03
HR04
hu1
hu2
hu3
ie01
ie02
ITC1
ITC2
ITC3ITC4
ITD1
ITD2
ITD3
ITD4
ITD5
ITE1
ITE2
ITE3ITE4
ITF1
ITF2
ITF3
ITF4
ITF5ITF6
ITG1
ITG2
nl11
nl12
nl13nl21nl22
nl23nl31
nl32
nl33
nl34
nl41
nl42
PL11
PL12
PL21
PL22PL31
PL32
PL33
PL34 PL41
PL42
PL43
PL51PL52
PL61
PL62
PL63PT11
PT15
PT16PT17
PT18
PT20
PT30
RO11
RO12
RO21RO22
RO31
RO32
RO41
RO42
SE1
SE2
SE3
SK01SK02
SK03
SK04
ukc
ukduke
ukf
ukg
ukh uki
ukj
ukk
uklukm
ukn
RS11
RS21
RS22
RS22
RS23
TR1
TR2
TR3
TR4
TR5
TR6
TR7
TR8
TR9 TRA
TRB
TRC
UA13
UA15
UA21
UA25
UA4
UA7
Spearman: 0.78
Connections/luck
Connections/luckHard work45
67
8
Exp
eri
en
ce
4 5 6 7 8
Perceptions
12
FIGURE 3, EXPERIENCE VERSUS PERCEPTIONS AT THE NATIONAL LEVEL
Comment: The national level indicators are a population weighted average of all regional scores in each country, on experienced-
based and perception-based assessments of meritocracy in the public sector. The population data were taken from the most recent
year available from Eurostat (2011).
Figure 4 shows the distribution by region in the sample (with the exception of Serbia and the
Ukraine). Regions that are shaded lighter are considered more meritocratic.
Taken together, we make two observations so far: first, the correlation between the experienced-
based and perception-based measures is high on the regional level and very high on the national
level, and, second, there appears to be a large variation in some countries regarding how important
merit is for success in the public sector across Europe on both the regional and national levels.
AT
BE
BG
CZ
DEDK
ES
FI
FR
GR
HR
HU
IE
IT
NL
PL
PTRO
RS
SE
SK
TR
UA
UK
Connections/luck
Hard work Connections/luck
Spearman: 0.89
55
.56
6.5
77
.5
Exp
eri
en
ce
5 6 7 8Perceptions

13
FIGURE 4, PUBLIC SECTOR MERITOCRACY IN 212 EUROPEAN REGIONS
Comment: The distribution shown in the figure comes from the experienced-based measure on meritocracy. Regions that are
shaded lighter are considered more meritocratic by public sector employees.
Validity of the Meritocracy Measures on the National and Sub-
National levels
As Adock and Collier note, “Measurement validity is specifically concerned with whether opera-
tionalization and the scoring of cases adequately reflect the concept the researcher seeks to meas-
ure” (Adock and Collier 2001: 529). Although there are numerous ways in which validity can be
assessed, we evaluate in this section what Adock and Collier (2001: 530) call ‘criterion validity’ (the
extent to which our indicator relates to other, similar measures of our concept) and ‘construct validity’
(the extent to which our measure correlates with indicators of related concepts where we would

14
theoretically expect a relationship from the relevant literature), or what might broadly be referred to
as ‘external validity’ by some scholars.
The National Level
In this section we compare the measures presented in the previous section with other measures of
meritocracy in the public sector, as well as indicators of institutional quality such as measures of
public sector impartiality, corruption and rule of law, along with several correlates that have been
elucidated in the literature. Although we would not expect the measure in this study to correlate
exactly with alternative measures (we rely on citizens, not experts, etc.), a strong correlation with
other related factors and established measures would demonstrate that the meritocracy measure in
this study actually captures the underlying concept in question. As already noted, most existing
measures are on the national, and not on the sub-national, level. We therefore start with the nation-
al level, for which Table 1 provides the correlates3.
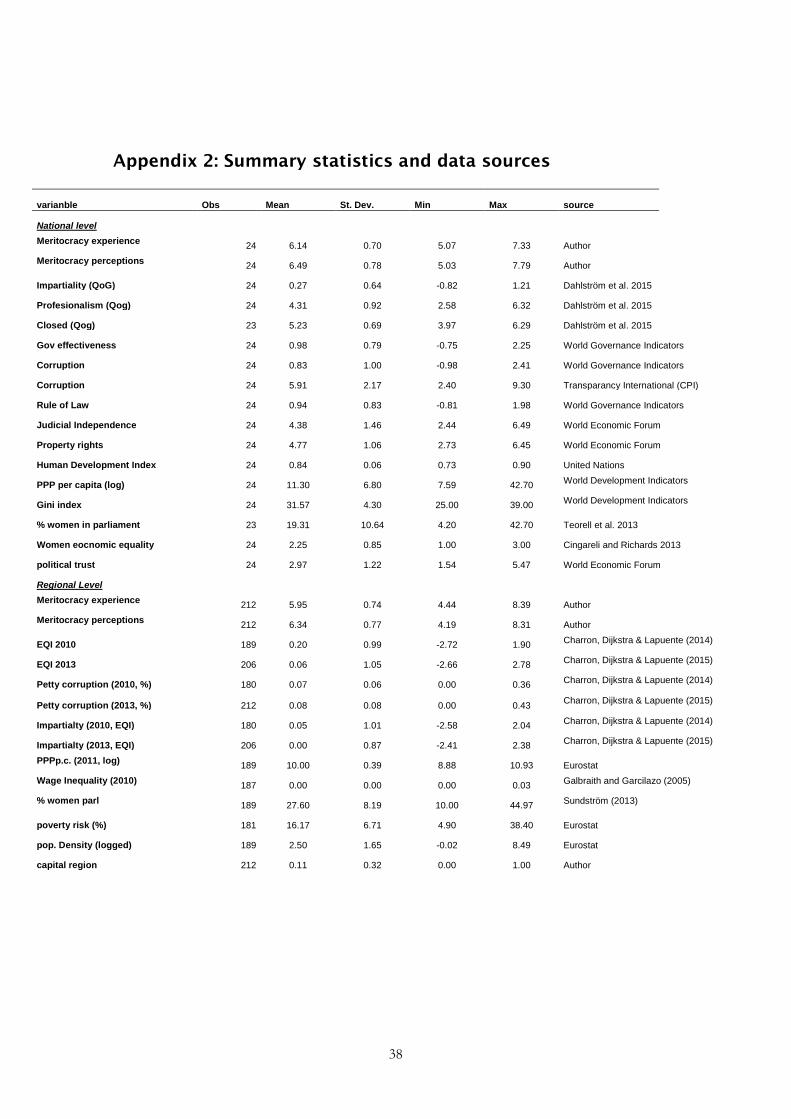
3 Summary statistics and sources for data used throughout this section are found in Appendix 2

15
TABLE 1: CORRELATIONS WITH MERITOCRACY EXPERIENCE MEASURE
Meritocracy Experience
Pearson's P-value obs
QoG Impartilaity 0.74 0.000 24
QoG Professional 0.75 0.000 24
QoG Closed -0.03 0.870 23
Government Effectiveness (WGI) 0.72 0.000 24
Corruption (WGI) 0.78 0.000 24
Corruption (CPI) 0.80 0.000 24
Rule of Law (WGI) 0.77 0.000 24
Judicial Independence (WEF) 0.83 0.000 24
Property Rights (WEF) 0.86 0.000 24
Human Development Index 0.62 0.013 24
PPP per capita (WDI, logged) 0.58 0.002 24
Income Inequality (Gini index) 0.12 0.59 23
Gender Inequality (% women in lower house) 0.39 0.10 24
24 Gender Equality (economic rights, CIRI) 0.52 0.09
Political Trust (WEF) 0.76 0.001 24
Comment: Correlations reported with the merit experience indicator inverted (higher scores imply more meritocracy) in order to
match the other variables. ‘WGI’ is World Governance Indicators; ‘CPI’ is Transparency International’s Corruption Perception
Index, ‘WEF’ is the World Economic Forum, WDI is the World Development Indicators, and the three QoG measures come
from Teorell, Dahlström and Dahlberg (2011). The data are taken from the QoG institute’s database (Teorell et al. 2013).
Assessing the criterion validity of the measure with other measures of different ways of organizing
the public sector (Dahlström, Lapuente and Teorell 2012; Teorell and Rothstein 2012), we find that
the citizen experience measure is highly correlated with two of the three dimensions (“impartiality”
and “professionalism”) while it is unrelated to “closedness”. The “professionalism” index picks up
the personnel side, including independence from politics, and meritocratic recruitment, and the
“impartiality” index taps into neutral service delivery, while the “closedness” index measures the
extent to which the bureaucracy is protected by, for example, special labor market laws. That the de
facto measurement we are presenting here correlated with the two former but not with the latter is
in fact exactly what one would expect, and underlines the point made earlier with reference to Ol-
sen (2005). It is also in line with observations of cases in Southern Europe, such as Spain and
16
Greece, with extensive protection for the bureaucracy, combined with high levels of politicization
(Parrado 2000; Sotiropoulos 2004).
In addition, we find that the correlations with similar indicators of institutional capacity, impartiali-
ty, rule of law and corruption are also in the expected direction, and fairly strong, with various
measures of state capacity—corruption, rule of law and government effectiveness. All correlate
with our measure at 0.72 or higher, and the correlations are significant at the 99.9% level of confi-
dence.
In testing for construct validity, the measures of economic and social development, such as the
HDI and per capita income, are also significant in pairwise correlations. On the basis of previous
research we would predict that a meritocratic public sector is one that is highly related with impar-
tiality—and thus more equal outcome across social groups on average—and we find that the meas-
ure is highly correlated with three measures of inequality (Henderson et al. 2007; Rauch and Evans
2000).
The two measures of gender inequality—political and economic—correlate at 0.38 and 0.52 respec-
tively. Finally, the measure presented here is strongly correlated with political trust, at 0.76, which is
also expected (Rothstein 2011).4 The Gini index is in the expected direction, but non-significant,
mostly due to several post-socialist countries, such as the Ukraine, Serbia and Slovakia, still having
relatively low levels of income inequality (and low meritocracy) while England and Ireland demon-
strate the reverse pattern.
4 In general, Turkey is an outlier in our sample, and its exclusion noticeably increases almost all correlations in Table 1.

17
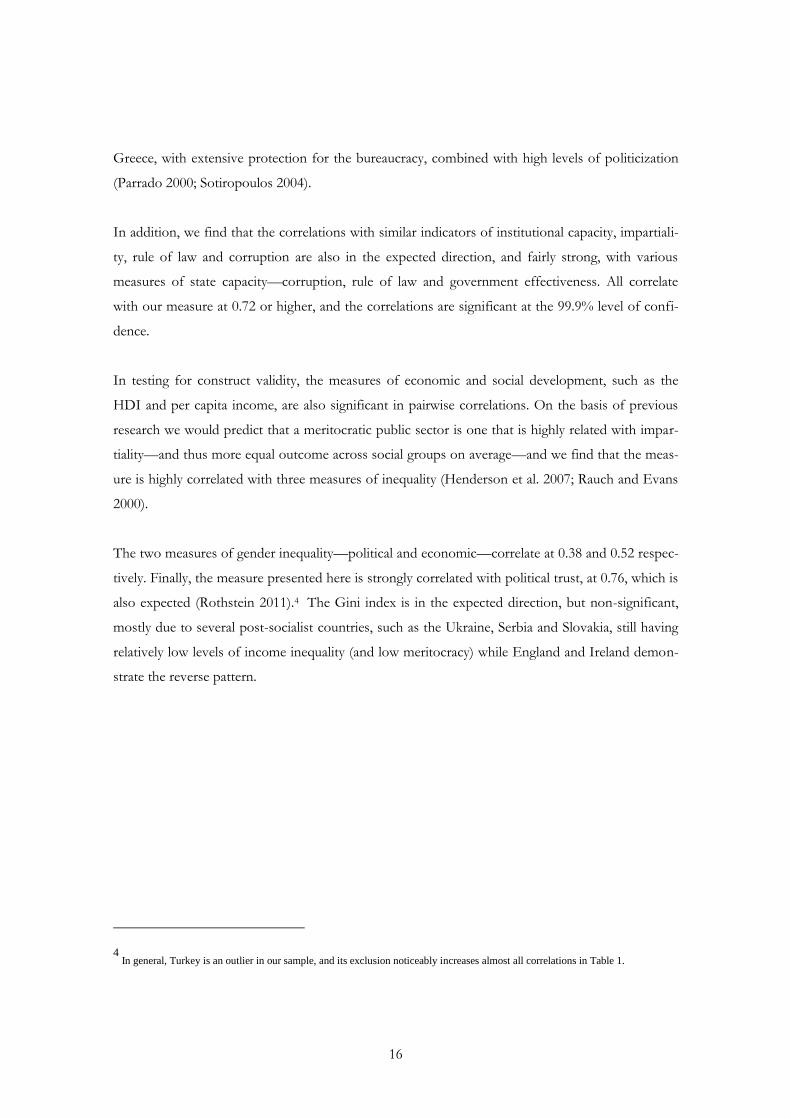
FIGURE 5, EXPERT VERSUS CITIZEN MEASURES OF MERITOCRACY (IMPARTIALITY)
FIGURE 6, EXPERT VERSUS CITIZEN MEASURES OF MERITOCRACY (PROFESSIONALISM)
AT
BE
BG
CZ
DEDK
ES
FI
FR
GR
HR
HU
IE
IT
NL
PL
PTRO
RS
SE
SK
TR
UA
UK
Spearman: 0.75
2.5
33
.54
4.5
5
Exp
eri
en
ce (
reve
rse
d)
-1 -.5 0 .5 1Impartial Public Administration (QoG)
AT
BE
BG
CZ
DEDK
ES
FI
FR
GR
HR
HU
IE
IT
NL
PL
PTRO
RS
SE
SK
TR
UA
UK
Spearman: 0.80
2.5
33
.54
4.5
5
Exp
eri
en
ce (
reve
rse
d)
3 4 5 6 7Professional Public Administration (QoG)

18
Figures 5 and 6 are graphs of our experienced-based measure with the “impartiality” and “profes-
sionalism” indices from the QoG expert survey data (Teorell, Dahlström and Dahlberg 2011) in-
cluded in Table 1. We highlight the two significant factors in the two above figures, whereby we
find that our citizen-based, informal measure correlated remarkably strongly with the expert-based
more formal rules measures. Some outliers, such as Turkey and Croatia in Figure 5 and Ireland,
Croatia and Turkey in Figure 6, warrant further investigation.
All in all, the correlations on the national level are in the expected direction, showing a high degree
of both criterion (with the QoG variables) and content (with the development, equality and trust
variables) validity, and therefore strengthen our confidence in the measure presented here.
The Sub-National Level
Table 2 highlights simple pairwise correlations with outside measures that we would expect to cor-
relate with our measure of meritocracy on the sub-national level. Data availability at the sub-
national level is not as good as the national level, but we start with comparing the meritocracy
measure with our index of regional-level quality of government from the EQI (Charron, Dijkstra
and Lapuente 2014; 2015). The data are available in two rounds, 2010 and 2013 (the latter is based
on the same survey as the meritocracy measure).

19
TABLE 2, SUB-NATIONAL LEVEL EXTERNAL VALIDITY CHECK
Meritocracy (citizen experience)
Pearson's P-value obs
EQI 2010 0.72 0.000 189
EQI 2013 0.60 0.000 206
Petty Corruption 2010 -0.55 0.000 180
Petty Corruption 2013 -0.56 0.000 212
Impartiality 2010 0.56 0.000 180
Impartiality 2013 0.54 0.000 206
PPP Per capita 0.47 0.000 189
Income Inequality (Theil) 0.29 0.000 187
Gender Inequality (% women in regional parliament) 0.43 0.000 182
% Poverty risk 0.21 0.006 181
Economic Satisfaction 0.35 0.000 212
Pop. Density (log) -0.23 0.001 189
Capital region -0.17 0.011 212
We find that the 2010 EQI correlates with our meritocracy measure at 0.72, while this is at 0.60 in
2013. The drop in the strength of the correlation is due to the inclusion of the Turkish regions,
which are ranked much higher on the meritocracy measure than the EQI.
We then take two sub-components from the EQI—a measure of direct experience with corruption
(reported petty corruption) and the perceived level of impartiality in several regional public services
(education, health service, law enforcement). The correlations are negative as expected, relatively
strong—between -0.54 and -0.56—and significant at the 99.9% level of confidence for both 2010
and 2013.
Next we look at the meritocracy measure in relation to other factors, again reported in Table 3, and
find that PPP per capita, income inequality and the gender gap in political representation correlate
at 0.47, 0.29 and 0.43, respectively. Capital regions are recorded as (slightly) less meritocratic on
average. We also find that the aggregate levels of economic satisfaction (from the same survey) are
correlated with meritocracy. Whether a region is autonomous and the size of the region (in terms of
population density) is unrelated to the level of meritocracy, even when controlling for the level of
PPP per capita.

20
In Figure 7, we highlight the bivariate relationship between our meritocracy measure and the past
value of the EQI measure (from 2010), which are highly correlated, with a Spearman Rank measure
of 0.71.
FIGURE 7, MERITOCRACY AND THE EQI 2010
Comment: The figure shows the correlation between the experienced-based meritocracy measure in the 2010 EQI (Charron,
Lapuente and Rothstein 2013).
In our view, the correlations presented here demonstrate strong external validity for the measure
presented. Without exception, the new measurement correlates as expected with other measures on
the sub-national level.
Spatial Variations of Public Sector Meritocracy within Countries
Next we examine the level of within-country variation in public sector meritocracy. Figure 8 shows
the distribution of meritocracy scores for each country in rank order (triangles) with all respective
AT11
AT12
AT13
AT21
AT22AT31
AT32
AT33AT34
be1 be2
be3
BG31
BG32
BG33
BG34
BG41
BG42
CZ01
CZ02
CZ03
CZ04CZ05
CZ06
CZ07
CZ08
de1
de2de3
de4
de5
de6
de7
de8
de9
deadeb
dec
deddee
def
deg
DK01
DK02DK03
DK04
DK05ES11ES12ES13
ES21ES22
ES23
ES24
ES30
ES41
ES42
ES43
ES51ES52
ES53
ES61
ES62
ES70
fi13
fi18
fi19
fi1a
fi20
FR10
FR21
FR22FR23 FR24
FR25
FR26
FR30FR41FR42
FR43
FR51
FR52
FR53
FR61
FR62
FR63FR71FR72
FR81
FR82FR83
FR91FR92
FR93
FR94
gr1
gr2
gr3gr4
HR03
HR04
hu1
hu2
hu3
ie01
ie02ITC1
ITC2
ITC3ITC4
ITD1
ITD2
ITD3
ITD4
ITD5
ITE1
ITE2
ITE3ITE4
ITF1
ITF2
ITF3
ITF4
ITF5ITF6
ITG1
ITG2
nl11nl12
nl13nl21nl22
nl23nl31
nl32
nl33
nl34
nl41
nl42
PL11
PL12
PL21
PL22PL31
PL32
PL33
PL34PL41
PL42
PL43
PL51PL52
PL61
PL62
PL63PT11
PT15
PT16PT17
PT18
PT20
PT30
RO11
RO12
RO21RO22
RO31
RO32
RO41RO42
SE1
SE2
SE3
SK01SK02
SK03
SK04
ukc
ukdukeukf
ukgukhuki
ukj
ukk
uklukm
ukn
Spearman: 0.71
23
45
6
expe
rie
nce
(re
ve
rsed
)
-3 -2 -1 0 1 2EQI 2010

21
regional estimates around the country estimates (circles). The regional data are not centered in any
way, and thus we see that the country context is highly salient in the assessments of meritocracy on
which we base our measure, as the regional distribution is far from random. However, it does ap-
pear that, in several cases, the regional distribution is highly relevant and worth further exploration.
FIGURE 8, WITHIN-COUNTY VARIATION IN MERITOCRACY IN THE PUBLIC SECTOR
Comment: The figure shows the distribution of meritocracy scores for each country in rank order (triangles) with all respective
regional estimates around the country estimates (circles).
To compare the extent to which regional estimates vary in a country, we calculate a population
weighted regional Gini index measure for each country, in which lower scores indicate less regional
variation. Figure 9 shows the results. We see that Serbia (which includes Kosovo), Bulgaria, Roma-
nia, Italy and Turkey demonstrate the widest regional variation, while regions in Belgium, Greece,
Hungary, Finland and Denmark are much more evenly distributed.
AT
BE
BG
CZ
DEDK
ES
FI
FR
GR
HR
HU
IE
IT
NL
PL
PTRO
RS
SE
SK
TR
UA
UK
Hard Work
Luck/connections Belgrade
S.W. England
45
67
8
Exp
eri
en
ce w
ith
me
rito
cra
cy
0 5 10 15 20 25
Rank by Country

22
FIGURE 9, POPULATION WEIGHTED WITHIN-COUNTRY VARIATION INDEX IN MERITOCRACY
Comment: The figure presents a population weighted regional Gini index measure for each country, in which lower scores indicate
less regional variation. Country abbreviations are given in Appendix 1.
To further explore the validity of the measure presented here, we would like to make sure that the
variation is meaningful, and not only random. The question is thus what factors could explain why
citizens in certain regions of some countries assess public sector meritocracy so differently, while,
in other cases, there are relatively small spatial variations, and the within-country variation in the
measure presented here correlates with the explanations in an expected way. For this, we rely on
several explanations from the literature on regional inequalities in wealth within countries.
Scholars of a host of disciplines have been interested in the question of regional inequality for dec-
ades, and empirical and theoretical analyses focusing on regional inequalities began many years ago
(Myrdal 1957; Williamson 1865). Moreover, it should be stressed that the literature on differences
in economic divergences between countries is theoretically and empirically distinct from that on
regional divergences within them. While space does not permit an entirely compressive review of
this literature, we summarize several relevant strands in this section.
0 .01 .02 .03 .04 .05 .06 .07
Gini index of regional variation in meritocracy (pop. weighted)
RSBGRO
ITTR
ESCZATIE
NL
UAUKFRPLDE
SESKPTDKHRHU
FIGRBE

23
First, building on Kuznet’s (1955) curve hypothesis, the neoclassical explanations postulate that
regional divergence/convergence is a natural function of a country’s development. Scholarship in
this model tends to stress the non-linear bell curve pattern of regional inequalities, highlighting fac-
tors such as competitive advantage and constant returns to scale as key mechanisms behind chang-
es in regional inequalities. The essence of the theory here implies a non-linear inverted U-shaped
relationship—that regional inequalities are small at low levels of development (all regions are more
or less equally poor), then, at moderate levels of development, regional divergence occurs, while, at
high levels of development, regions are more harmonized.
Second, while some studies show the benefits of increases in trade for overall growth (Dollar 1992;
Frankel and Romer 1999), other scholars have posited that one consequence is that which is posi-
tively linked with regional inequality. Based on the work of Krugman (1991), several studies have
developed models of the “New Economic Geography” (NEG), which elucidates the effects of how
globalization and openness to trade produce tensions for regional balances, via centrifugal and cen-
tripetal forces. Thus we would expect divergences in the spatial distribution of meritocracy across
regions within countries to be related to the level of economic openness at the country level.
Third, political institutions, such as the extent to which a country is decentralized, could allow for
regional variations in public sector practices that would impact the level of meritocracy—although
the literature and empirical evidence are largely divided on this point. For example, Prud'homme
(1995) argues that the greater the level of decentralization in the public sector, the less power the
central government has to harmonize levels of development among its regions via redistribution.
Regions that are more endowed with human capital, natural resources or beneficial geographic
positions are more likely to grow faster than less endowed regions when a country decentralizes, at
least in the short to medium run. We thus look at the level of political and fiscal centralization
compared with the spatial distribution of meritocracy.
Fourth, and finally, one of the cornerstone policies of the EU is regional cohesion—and thus coun-
tries and regions that have been member states for a longer period of time may have benefited
from the numerous public sector investments made by the Commission to aid less developed re-
gions in catching up. We would thus expect that time as an EU member would be negatively corre-
lated with the level of regional variation in meritocracy.

24
TABLE 3, CORRELATES OF SUB-NATIONAL VARIATION IN PUBLIC SECTOR MERITOCRACY
Pearson's P-value obs
PPP per capita (log) -0.49 0.010 24
Income Inequality (GINI) 0.03 0.890 24
Rule of Law (WGI) -0.48 0.011 24
Corruption (CPI) -0.39 0.060 24
Impartial Bureaucracy (QoG) -0.44 0.033 24
Economic Openness (KOF) -0.52 0.010 22
Decentralization (RAI) -0.11 0.640 22
Yrs. EU Membership -0.43 0.038 24
Population (log) 0.00 0.970 24
Unemployment % (WDI) 0.29 0.190 22
Comment: The Ukraine, with only six of 24 regions, is not included in the analysis.
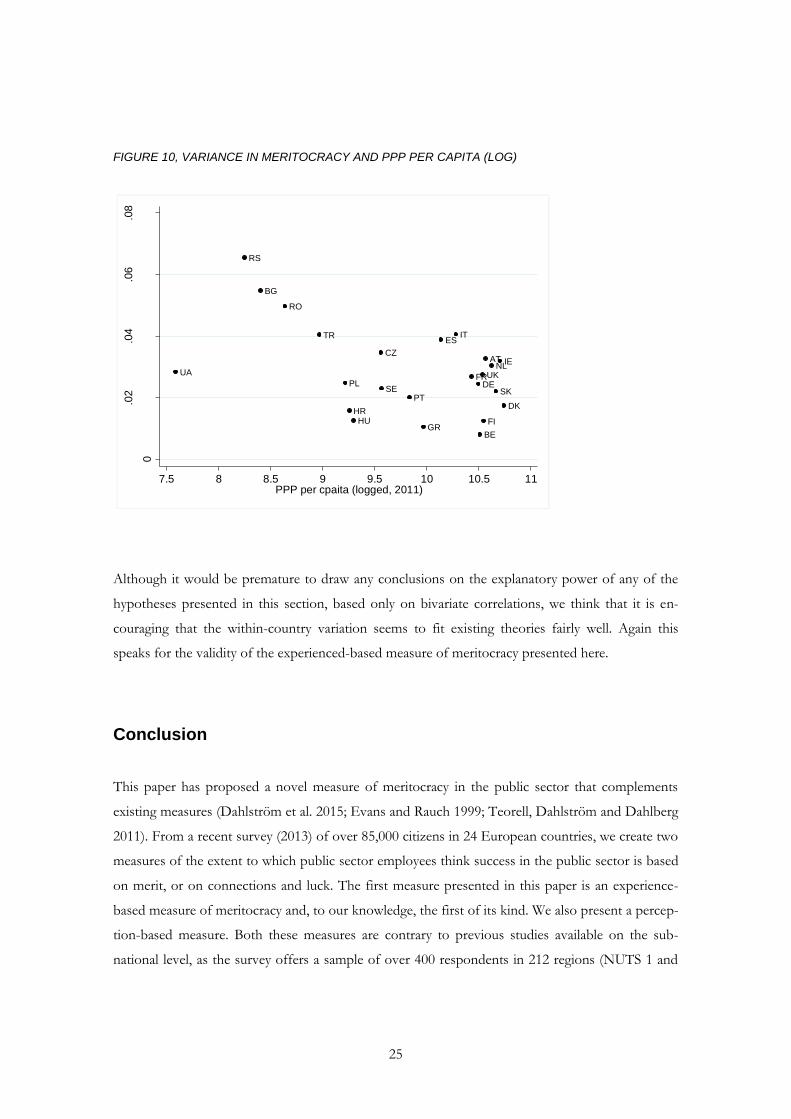
Table 3 shows bivariate correlations based on these various hypotheses. We find that, despite a
relatively small number of observations, that spatial variation in public sector meritocracy within
countries is related to the level of economic development and to several governance measures,
including rule of law, corruption perceptions and the overall level of impartiality in the public sec-
tor. We find also that economic openness is negatively correlated with regional inequalities, which is
probably due to the fact that all countries in the sample are mid to highly developed. Thus we see
only the right side of a somewhat inverted U-shaped curve, with Ukraine standing out as an outlier.
Length of membership in the EU is significant at the 04% level of confidence, which possibly sug-
gests the effect of convergence policy harmonizing regions within countries. Population, unem-
ployment and decentralization appear to have no relation with spatial differences in public sector
meritocracy.
We highlight the bivariate relationship between the regional variation in meritocracy and economic
development in Figure 10.
25
FIGURE 10, VARIANCE IN MERITOCRACY AND PPP PER CAPITA (LOG)
Although it would be premature to draw any conclusions on the explanatory power of any of the
hypotheses presented in this section, based only on bivariate correlations, we think that it is en-
couraging that the within-country variation seems to fit existing theories fairly well. Again this
speaks for the validity of the experienced-based measure of meritocracy presented here.
Conclusion
This paper has proposed a novel measure of meritocracy in the public sector that complements
existing measures (Dahlström et al. 2015; Evans and Rauch 1999; Teorell, Dahlström and Dahlberg
2011). From a recent survey (2013) of over 85,000 citizens in 24 European countries, we create two
measures of the extent to which public sector employees think success in the public sector is based
on merit, or on connections and luck. The first measure presented in this paper is an experience-
based measure of meritocracy and, to our knowledge, the first of its kind. We also present a percep-
tion-based measure. Both these measures are contrary to previous studies available on the sub-
national level, as the survey offers a sample of over 400 respondents in 212 regions (NUTS 1 and
AT
BE
BG
CZ
DE
DK
ES
FI
FR
GR
HRHU
IE
IT
NL
PL
PT
RO
RS
SE SK
TR
UA UK
0
.02
.04
.06
.08
Gin
i in
de
x o
f re
gio
nal m
erito
cra
cy v
ari
atio
n
7.5 8 8.5 9 9.5 10 10.5 11PPP per cpaita (logged, 2011)
26
NUTS 2 level) in the 24 countries included. Both are listed fully by region and country in Appen-
dix 1, free for scholarly use.
The purpose of this paper has been to present and validate the data, and we think we can draw
three conclusions from the analysis. First, after an external and internal validation that consistently
points in the expected direction, we think that the measure presented there actually captures the de
facto meritocracy in the public sector. Second, we conclude that regions within countries vary in
terms of meritocracy in the public sector to a fairly large extent. Third, we conduct a very prelimi-
nary analysis of why there are regional differences, looking only at bivariate correlations. We find
that, despite a relatively small number of observations, spatial variation in public sector meritocracy
within countries is related to level of economic development, and to several ‘governance’ measures,
including rule of law, corruption perceptions and the overall level of impartiality in the public sec-
tor. And, at least weakly, it is related to the length of membership in the EU, while population,
unemployment and decentralization appear to have no relation with spatial differences in public
sector meritocracy.
Taken together, we think that the measure presented holds water and that the regional differences
merit more thorough investigations.

27
REFERENCES
Adcock, Robert and David Collier. 2001 "Measurement validity: A shared standard for qualitative
and quantitative research." American Political Science Review. Vol. 95. (3): 529-546.
Charron, Nicholas, Lewis Dijkstra and Victor Lapuente. 2015. ‘Mapping the Regional Divide in
Europe: A Measure for Assessing Quality of Government in 206 European Regions’. Social
Indicators Research. vol 122 (2): 315-346.
Charron, Nicholas, Lewis Dijkstra & Victor Lapuente. 2014. ‘Regional Governance Matters:
Quality of Government within European Union Member States’, Regional Studies, 48(1): 68-90.
Charron, Nicholas, Victor Lapuente and Bo Rothstein. 2013. Quality of Government and Corruption from
a European Perspective: A Comparative Study of Good Government in EU Regions. Cheltenham: Edward
Elgar Publishing.
Dahlström, Carl and Victor Lapuente. 2014. “Organizing Leviathan”. Paper presented at the 72nd
annual Midwest Political Science Association Conference, Chicago, USA, April 3-6, 2014.
Dahlström, Carl, Victor Lapuente, and Jan Teorell. 2012. “The Merit of Meritocratization Politics,
Bureaucracy, and the Institutional Deterrents of Corruption”. Political Research Quarterly, 65(3), 656-
668.
Dahlström, Carl, Jan Teorell, Stefan Dahlberg, Felix Hartmann, and Annika Lindberg. 2015. The
QoG Expert Survey Dataset II. University of Gothenburg: The Quality of Government Institute.
Evans, Peter and James Rauch. 1999. “Bureaucracy and Growth: A Cross-National Analysis of the
Effects of ‘Weberian’ State Structures on Economic Growth.” American Sociological Review 64(5):
748-65.
Henderson, Jeffrey, David Hulme, Hossein Jalilian, and Richard Phillips. 2007. “Bureaucratic
Effects: ‘Weberian’ State Agenciesand Poverty Reduction”. Sociology 41(3): 515–532.
Hooghe, Liesbet, Gary Marks and Arjan Schakel. 2010. The Rise of Regional Authority: A Comparative
Study of 42 Democracies. London: Routledge.

28
Horn, Murray. 1995. The Political Economy of Public Administration: Institutional Choice in the Public Sector.
New York: Cambridge University Press.
Krause, George, David Lewis, and James Douglas. 2006. “Political Appointments, Civil Service
Systems, and Bureaucratic Competence: Organizational Balancing and Executive Branch Revenue
Forecasts in the American States.” American Journal of Political Science 50(3): 770–787.
Krugman Paul. 1991. Geography and Trade. Cambridge, Mass: MIT Press.
Kuznets, Simon. 1955. “Economic growth and income inequality”. American Economic Review, 45(1):
1–28.
Lewis, David. 2008. The Politics of Presidential Appointments: Political Control and Bureaucratic Performance.
Princeton, NJ: Princeton University Press.
Miller, Gary. 2000. “Above Politics: Credible Commitment and Efficiency in the Design of Public
Agencies.” Journal of Public Administration Research and Theory 10 (2): 289-3.
Myrdal, Gunnar. 1957. Economic Theory and Underdeveloped Regions. London: University Paperbacks,
Methuen.
Northcote, Stafford, and Charles Trevelyan. 1853. Report on the Organization of the Permanent Civil
Service. London: House of Commons.
Olsen, Johan. P. 2005. “Maybe it is Time to Rediscover Bureaucracy.” Journal of Public
Administration Research and Theory 16 (1): 1-24.
Parrado, Salvador. 2000. “The Development and Current Features of the Spanish Civil Service
System”. In Bekke, Hans and Frits van der Meer (eds.). Civil Service Systems in Western Europe.
Bodmin, Corwall: MPG Books Ltd.
Persson, Torsten and Gidio Tabellini. 2005. The Economic Effects of Constitutions. Munich Lectures in
Economics. Cambridge, Mass: The MIT Press.
Peters, B. Guy and Jon Pierre (eds.). 2004. Politicization of the Civil Service in Comparative Perspective.
London: Routledge.
29
Prud'homme, Rémy. 1995. “The dangers of decentralization”. The World Bank Observer 10(2): 201-
220.
Rauch, James, and Peter Evans. 2000. "Bureaucratic structure and bureaucratic performance in less
developed countries." Journal of Public Economics 75(1): 49-71.
Rokkan, Stein. 1970. Citizens, Elections, Parties: Approaches to the Comparative Study of the Process of
Development. New York: David McKay.
Rothstein, Bo. 2011. The Quality of Government: Corruption, Social Trust and Inequality in
International Perspective. Chicago: University of Chicago Press.
Silberman, Bernad. 1993. Cages of Reason: The Rise of the Rational State in France, Japan, the United States,
and Great Britain. Chicago: Chicago University Press.
Snyder, Richard. 2001. “Scaling down: The subnational comparative method”. Studies in comparative
international development 36(1): 93-110.
Sotiropoulos, Dimitrios. 2004. “Two Faces of Politicization of the Civil Service: The Case of
Contemporary Greece”. In Peters, Guy and Jon Pierre (eds.). Politicization of the Civil Service in
Comparative Perspective. The Quest for Control. London: Routledge.
Tabellini, Guido. 2008. “Institutions and Culture”. Journal of the European Economic Association 6: 255–
294.
Teorell, Jan, Nicholas Charron, Stefan Dahlberg, Sören Holmberg, Bo Rothstein, Petrus Sundin &
Richard Svensson. 2013. The Quality of Government Dataset, version 15May13. University of
Gothenburg: The Quality of Government Institute, http://www.qog.pol.gu.se.
Teorell, Jan, Carl Dahlström and Stefan Dahlberg. 2011. The QoG Expert Survey Dataset. University
of Gothenburg: The Quality of Government Institute.
Treisman, Daniel. 2007. “What Have We Learned About the Causes of Corruption from Ten Years
of Cross-National Empirical Research?” Annual Review of Political Science 10: 211–44.
Weber, Max 1978[1922]. Economy and Society. Berkeley: University of California Press.
Wilson, Woodrow. 1887. “Study of Administration.” Political Science Quarterly 2: 197-222.

30
Williamson, Jeffrey. 1965. “Regional Inequality and the Process of National Development: A
Description of the Patterns”. Economic Development and Cultural Change 13(4): 3-45.

31
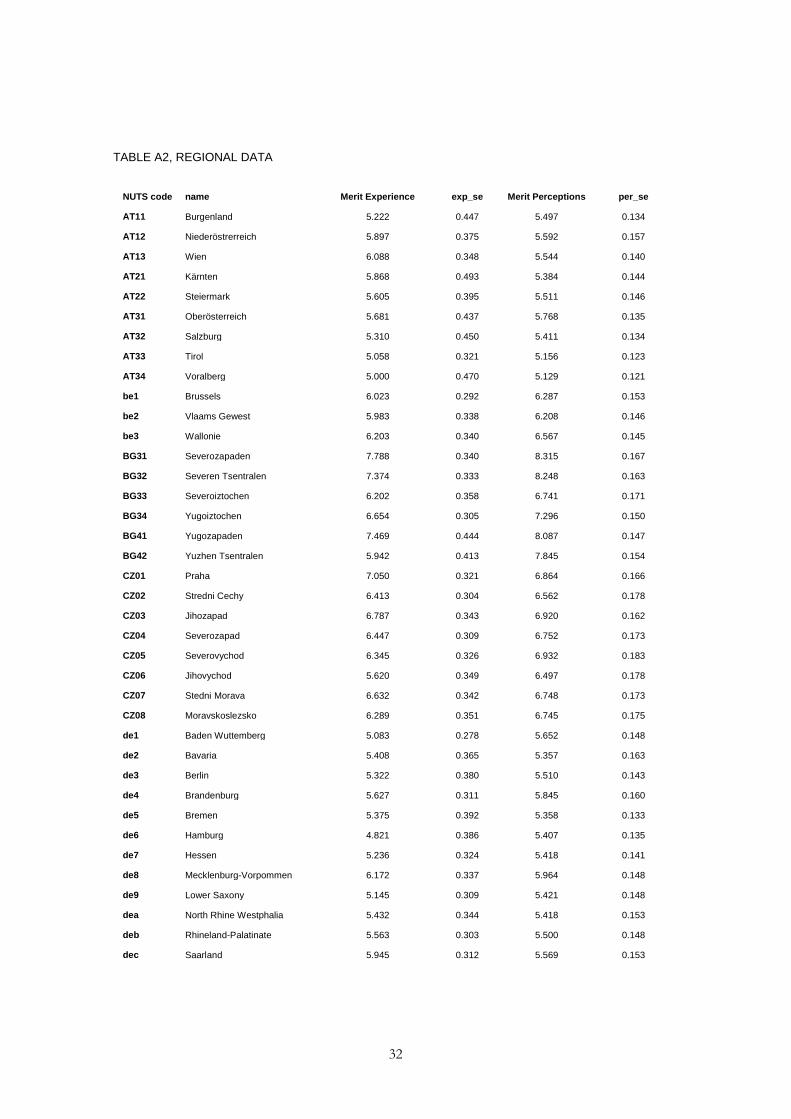
Appendix 1: Sample and full data by country and region
TABLE A1, COUNTRY DATA, ABBREVIATIONS AND NUTS LEVEL
country NUTS code regional NUTS level Merit Experi-ence
Merit Percept-ions
Austria AT 2 5.685 5.515
Belgium BE 1 6.058 6.332
Bulgaria BG 2 6.902 7.794
Croatia HR 1 7.279 7.383
Czech Republic CZ 2 6.410 6.746
Denmark DK 2 5.292 5.672
Finland FI 2 5.256 5.931
France FR 1 5.587 5.943
Germany DE 2 5.384 5.522
Greece GR 1 6.772 7.688
Hungary HU 2 6.442 6.469
Ireland IE 2 5.963 6.021
Italy IT 2 6.236 6.904
Netherlands NL 2 5.727 6.101
Poland PL 2 6.623 6.894
Portugal PT 2 6.268 7.217
Romania RO 2 6.348 7.091
Serbia RS 2 7.330 7.454
Slovakia SK 1 7.240 7.355
Spain ES 2 5.796 6.580
Sweden SE 2 5.471 5.704
Turkey TR 1 5.334 5.032
Ukraine UA 2 6.937 6.879
United Kingdom UK 1 5.071 5.654
32
TABLE A2, REGIONAL DATA
NUTS code name Merit Experience exp_se Merit Perceptions per_se
AT11 Burgenland 5.222 0.447 5.497 0.134
AT12 Niederöstrerreich 5.897 0.375 5.592 0.157
AT13 Wien 6.088 0.348 5.544 0.140
AT21 Kärnten 5.868 0.493 5.384 0.144
AT22 Steiermark 5.605 0.395 5.511 0.146
AT31 Oberösterreich 5.681 0.437 5.768 0.135
AT32 Salzburg 5.310 0.450 5.411 0.134
AT33 Tirol 5.058 0.321 5.156 0.123
AT34 Voralberg 5.000 0.470 5.129 0.121
be1 Brussels 6.023 0.292 6.287 0.153
be2 Vlaams Gewest 5.983 0.338 6.208 0.146
be3 Wallonie 6.203 0.340 6.567 0.145
BG31 Severozapaden 7.788 0.340 8.315 0.167
BG32 Severen Tsentralen 7.374 0.333 8.248 0.163
BG33 Severoiztochen 6.202 0.358 6.741 0.171
BG34 Yugoiztochen 6.654 0.305 7.296 0.150
BG41 Yugozapaden 7.469 0.444 8.087 0.147
BG42 Yuzhen Tsentralen 5.942 0.413 7.845 0.154
CZ01 Praha 7.050 0.321 6.864 0.166
CZ02 Stredni Cechy 6.413 0.304 6.562 0.178
CZ03 Jihozapad 6.787 0.343 6.920 0.162
CZ04 Severozapad 6.447 0.309 6.752 0.173
CZ05 Severovychod 6.345 0.326 6.932 0.183
CZ06 Jihovychod 5.620 0.349 6.497 0.178
CZ07 Stedni Morava 6.632 0.342 6.748 0.173
CZ08 Moravskoslezsko 6.289 0.351 6.745 0.175
de1 Baden Wuttemberg 5.083 0.278 5.652 0.148
de2 Bavaria 5.408 0.365 5.357 0.163
de3 Berlin 5.322 0.380 5.510 0.143
de4 Brandenburg 5.627 0.311 5.845 0.160
de5 Bremen 5.375 0.392 5.358 0.133
de6 Hamburg 4.821 0.386 5.407 0.135
de7 Hessen 5.236 0.324 5.418 0.141
de8 Mecklenburg-Vorpommen 6.172 0.337 5.964 0.148
de9 Lower Saxony 5.145 0.309 5.421 0.148
dea North Rhine Westphalia 5.432 0.344 5.418 0.153
deb Rhineland-Palatinate 5.563 0.303 5.500 0.148
dec Saarland 5.945 0.312 5.569 0.153

33
ded Saxony 5.561 0.389 5.510 0.144
dee Saxony-Anhalt 5.569 0.418 6.161 0.143
def Schleswig-Holstein 5.346 0.285 5.421 0.152
deg Thuringia 6.152 0.378 6.225 0.157
DK01 Hovedstaden 5.114 0.233 5.529 0.142
DK02 Sjaelland 5.570 0.230 5.698 0.150
DK03 Syddanmark 5.424 0.262 5.739 0.148
DK04 Midtylland 5.179 0.233 5.739 0.145
DK05 Nordjylland 5.378 0.199 5.767 0.159
ES11 Galicia 5.426 0.458 6.709 0.161
ES12 Principado de Asturias 5.366 0.455 6.484 0.158
ES13 Cantabria 5.460 0.412 6.742 0.159
ES21 Pais Vasco 5.091 0.399 6.385 0.162
ES22 Comunidad Foral de Navarra 5.038 0.378 6.320 0.157
ES23 La Rioja 5.978 0.394 6.485 0.157
ES24 Aragón 5.264 0.389 6.544 0.151
ES30 Comunidad de Madrid 5.833 0.450 6.366 0.161
ES41 Castilla y León 5.308 0.401 6.454 0.167
ES42 Castilla-La Mancha 5.885 0.419 6.595 0.165
ES43 Extremadura 5.594 0.357 6.394 0.170
ES51 Cataluña 5.978 0.404 6.859 0.153
ES52 Comunidad Valenciana 6.102 0.444 6.538 0.166
ES53 Illes Balears 4.860 0.337 6.703 0.161
ES61 Andalucia 6.276 0.376 6.751 0.162
ES62 Región de Murcia 5.053 0.367 5.991 0.165
ES70 Canarias (ES) 6.091 0.419 6.393 0.172
fi13 Itä-Suomi 5.053 0.336 6.135 0.158
fi18 Etelä-Suomi 5.353 0.289 5.948 0.166
fi19 Länsi-Suomi 5.118 0.304 5.800 0.163
fi1a Pohjois-Suomi 5.367 0.283 5.986 0.157
fi20 Åland 4.879 0.226 4.641 0.159
FR10 Ile-de-France 5.595 0.322 6.079 0.151
FR21 Champagne-Ardenne 5.872 0.304 5.895 0.154
FR22 Picardie 5.244 0.280 5.836 0.163
FR23 Haute-Normandie 5.314 0.291 5.760 0.159
FR24 Centre 5.245 0.279 5.739 0.162
FR25 Basse-Normandie 5.472 0.334 5.870 0.142
FR26 Bourgogne 5.830 0.293 5.684 0.156
FR30 Nord - Pas-de-Calais 5.436 0.279 6.089 0.151
FR41 Lorraine 5.553 0.332 5.740 0.154
FR42 Alsace 5.525 0.316 6.154 0.143

34
FR43 Franche-Comte 4.867 0.306 6.061 0.155
FR51 Pays de la Loire 5.968 0.339 5.856 0.143
FR52 Bretagne 5.413 0.309 5.467 0.148
FR53 Poitou-Charentes 5.028 0.312 5.842 0.158
FR61 Aquitaine 5.956 0.280 6.248 0.143
FR62 Midi-Pyrenees 5.776 0.316 5.917 0.152
FR63 Limousin 5.453 0.268 6.079 0.147
FR71 Rhone-Alpes 5.397 0.340 6.055 0.146
FR72 Auvergne 5.549 0.300 5.937 0.149
FR81 Languedoc-Roussillon 5.750 0.308 5.829 0.155
FR82 Provence-Alpes-Cote d'Azur 6.000 0.344 5.940 0.155
FR83 Corse 6.165 0.293 6.415 0.158
FR91 Guadeloupe 5.805 0.281 5.977 0.165
FR92 Martinique 5.708 0.295 5.919 0.176
FR93 Guyane 6.145 0.210 6.084 0.192
FR94 Reunion 5.371 0.283 5.746 0.173
gr1 Voreia Ellada 6.792 0.361 7.607 0.148
gr2 Kentriki Ellada 6.509 0.385 7.330 0.154
gr3 Attica 6.881 0.454 7.969 0.136
gr4 Nisia Aigaiou-Kriti 6.887 0.384 7.709 0.145
HR03 Jadranska 7.627 0.315 7.436 0.165
HR04 Kontinent 7.107 0.349 7.356 0.169
hu1 Közép-Magyarország 6.242 0.365 6.562 0.169
hu2 Dunántúl 6.630 0.330 6.503 0.174
hu3 Észak és Alföld 6.446 0.375 6.375 0.173
ie01 Border, Midland and Western 5.259 0.396 5.870 0.168
ie02 Southern and Eastern 6.224 0.390 6.076 0.163
ITC1 Piemonte 6.061 0.584 6.882 0.164
ITC2 Valle d'Acosta 5.115 0.423 6.410 0.175
ITC3 Ligura 6.273 0.530 6.789 0.172
ITC4 Lombardia 6.313 0.659 6.879 0.169
ITD1 Bolzano 5.988 0.345 5.968 0.187
ITD2 Trento 5.368 0.359 6.053 0.185
ITD3 Veneto 5.881 0.534 6.961 0.163
ITD4 Friuli-Venezia Giulia 5.689 0.434 6.552 0.172
ITD5 Emilia-Romagna 5.231 0.443 6.736 0.173
ITE1 Toscana 5.738 0.564 6.799 0.166
ITE2 Umbria 7.125 0.469 7.048 0.164
ITE3 Marche 6.510 0.485 7.213 0.159
ITE4 Lazio 6.545 0.433 7.064 0.170
ITF1 Abruzzo 6.118 0.401 7.355 0.166

35
ITF2 Molise 6.985 0.378 7.208 0.175
ITF3 Campania 6.768 0.363 6.768 0.183
ITF4 Puglia 6.088 0.414 7.097 0.169
ITF5 Basilicata 6.317 0.427 6.991 0.171
ITF6 Calabria 6.358 0.419 6.943 0.179
ITG1 Sicilia 6.829 0.388 7.124 0.177
ITG2 Sardegna 7.071 0.392 7.206 0.169
nl11 Groningen 5.352 0.282 5.938 0.195
nl12 Friesland (NL) 5.181 0.257 5.927 0.200
nl13 Drenthe 5.752 0.311 5.816 0.189
nl21 Overijssel 5.857 0.270 6.313 0.189
nl22 Gelderland 5.860 0.293 6.411 0.178
nl23 Flevoland 5.573 0.302 6.073 0.187
nl31 Utrecht 5.540 0.254 5.963 0.192
nl32 Noord-Holland 5.307 0.290 6.084 0.190
nl33 Zuid-Holland 6.141 0.290 6.072 0.197
nl34 Zeeland 5.839 0.297 6.242 0.186
nl41 Noord-Brabant 5.621 0.278 5.836 0.186
nl42 Limburg (NL) 6.007 0.285 6.465 0.196
PL11 Lodzkie 7.078 0.338 6.826 0.172
PL12 Mazowieckie 6.842 0.363 7.127 0.173
PL21 Malopolskie 6.378 0.300 6.629 0.180
PL22 Slaskie 6.634 0.329 7.042 0.170
PL31 Lubelskie 6.566 0.356 6.866 0.168
PL32 Podkarpackie 6.375 0.350 6.818 0.175
PL33 Swietokrzyskie 7.105 0.290 6.906 0.180
PL34 Podlaskie 6.105 0.336 6.545 0.180
PL41 Wielkopolskie 6.123 0.367 6.883 0.172
PL42 Zachodniopomorskie 6.843 0.301 6.914 0.179
PL43 Lubuskie 6.562 0.331 6.997 0.172
PL51 Dolnoslaskie 6.933 0.301 7.201 0.169
PL52 Opolskie 6.838 0.318 6.426 0.182
PL61 Kujawsko-Pomorskie 6.368 0.332 6.892 0.172
PL62 Warminsko-Mazurskie 6.766 0.366 6.457 0.178
PL63 Pomorskie 6.493 0.339 6.844 0.165
PT11 Norte 6.420 0.490 7.480 0.144
PT15 Algarve 7.171 0.315 6.686 0.152
PT16 Centro 6.129 0.368 7.340 0.142
PT17 Lisboa 6.067 0.478 7.005 0.146
PT18 Alentejo 6.328 0.367 6.707 0.153
PT20 Região Autónoma dos Açores 6.508 0.407 7.026 0.158

36
PT30 Região Autónoma da Madeira 5.605 0.372 7.119 0.169
RO11 Nord-Vest 6.792 0.389 7.166 0.183
RO12 Centru 6.020 0.505 7.095 0.179
RO21 Nord-Est 5.716 0.395 7.147 0.192
RO22 Sud-Est 5.692 0.455 7.192 0.174
RO31 Sud-Muntenia 6.679 0.433 6.639 0.186
RO32 Bucuresti-Ilfov 7.526 0.522 7.406 0.169
RO41 Sud-Vest Oltenia 6.283 0.356 7.156 0.190
RO42 Vest 6.459 0.451 7.056 0.177
SE1 Östra Sverige 5.181 0.232 5.740 0.127
SE2 Södra Sverige 5.706 0.206 5.621 0.126
SE3 Norra Sverige 5.517 0.220 5.822 0.143
SK01 Bratislavský kraj 7.439 0.350 7.308 0.139
SK02 Západné Slovensko 7.515 0.315 7.261 0.152
SK03 Stredné Slovensko 6.726 0.353 7.568 0.156
SK04 Východné Slovensko 7.276 0.353 7.304 0.161
ukc Northeast England 4.885 0.383 5.282 0.161
ukd Northwest England 5.161 0.379 5.799 0.155
uke Yorkshire-Humber 5.102 0.322 5.706 0.167
ukf East Midland England 4.948 0.363 6.033 0.158
ukg West Midland England 5.410 0.363 5.503 0.153
ukh East of England 5.236 0.373 5.405 0.163
uki London 5.200 0.345 5.550 0.168
ukj South East England 4.810 0.329 5.559 0.161
ukk South West England 4.438 0.376 5.926 0.165
ukl Wales 5.333 0.436 5.957 0.162
ukm Scotland 5.204 0.438 5.559 0.161
ukn N. Ireland 5.343 0.387 5.642 0.150
RS11 Belgrade 8.393 0.329 8.052 0.160
RS21 Šumadija and Western Serbia 7.367 0.374 7.581 0.166
RS22 Vojvodina 7.929 0.426 7.442 0.173
RS22 Southern and Eastern Serbia 6.939 0.400 7.867 0.159
RS23 Kosovo and Metohija 5.875 0.651 6.273 0.213
TR1 Istanbul 5.667 0.594 5.520 0.162
TR2 Bati Marmara 5.326 0.484 5.234 0.181
TR3 Ege 5.111 0.433 4.436 0.178
TR4 Dogu Marmara 5.521 0.388 4.943 0.169
TR5 Bati Anadolu 5.367 0.317 5.572 0.161
TR6 Akdeniz 4.927 0.567 5.003 0.177
TR7 Orta Anadolu 5.655 0.315 5.292 0.151
TR8 Bati Karadeniz 6.226 0.647 5.433 0.166

37
TR9 Dogu Karadeniz 4.643 0.505 4.194 0.154
TRA Kuzeydogu Anadolu 4.595 0.409 4.881 0.150
TRB Ortadogu Anadolu 4.860 0.440 5.169 0.155
TRC Güneydogu Anadolu 5.333 0.623 4.369 0.175
UA13 Kharkov 6.677 0.354 7.132 0.198
UA15 Zakarpatt 7.480 0.307 6.881 0.189
UA21 Odessa 6.922 0.320 6.556 0.207
UA25 Crimea 6.462 0.396 6.401 0.194
UA4 Kiev 7.169 0.339 7.521 0.167
UA7 Lviv 6.892 0.340 7.255 0.194
38
Appendix 2: Summary statistics and data sources
varianble Obs Mean St. Dev. Min Max source
National level
Meritocracy experience 24 6.14 0.70 5.07 7.33 Author
Meritocracy perceptions 24 6.49 0.78 5.03 7.79 Author
Impartiality (QoG) 24 0.27 0.64 -0.82 1.21 Dahlström et al. 2015
Profesionalism (Qog) 24 4.31 0.92 2.58 6.32 Dahlström et al. 2015
Closed (Qog) 23 5.23 0.69 3.97 6.29 Dahlström et al. 2015
Gov effectiveness 24 0.98 0.79 -0.75 2.25 World Governance Indicators
Corruption 24 0.83 1.00 -0.98 2.41 World Governance Indicators
Corruption 24 5.91 2.17 2.40 9.30 Transparancy International (CPI)
Rule of Law 24 0.94 0.83 -0.81 1.98 World Governance Indicators
Judicial Independence 24 4.38 1.46 2.44 6.49 World Economic Forum
Property rights 24 4.77 1.06 2.73 6.45 World Economic Forum
Human Development Index 24 0.84 0.06 0.73 0.90 United Nations
PPP per capita (log) 24 11.30 6.80 7.59 42.70 World Development Indicators
Gini index 24 31.57 4.30 25.00 39.00 World Development Indicators
% women in parliament 23 19.31 10.64 4.20 42.70 Teorell et al. 2013
Women eocnomic equality 24 2.25 0.85 1.00 3.00 Cingareli and Richards 2013
political trust 24 2.97 1.22 1.54 5.47 World Economic Forum
Regional Level
Meritocracy experience 212 5.95 0.74 4.44 8.39 Author
Meritocracy perceptions 212 6.34 0.77 4.19 8.31 Author
EQI 2010 189 0.20 0.99 -2.72 1.90 Charron, Dijkstra & Lapuente (2014)
EQI 2013 206 0.06 1.05 -2.66 2.78 Charron, Dijkstra & Lapuente (2015)
Petty corruption (2010, %) 180 0.07 0.06 0.00 0.36 Charron, Dijkstra & Lapuente (2014)
Petty corruption (2013, %) 212 0.08 0.08 0.00 0.43 Charron, Dijkstra & Lapuente (2015)
Impartialty (2010, EQI) 180 0.05 1.01 -2.58 2.04 Charron, Dijkstra & Lapuente (2014)
Impartialty (2013, EQI) 206 0.00 0.87 -2.41 2.38 Charron, Dijkstra & Lapuente (2015)
PPPp.c. (2011, log) 189 10.00 0.39 8.88 10.93 Eurostat
Wage Inequality (2010) 187 0.00 0.00 0.00 0.03
Galbraith and Garcilazo (2005)
% women parl 189 27.60 8.19 10.00 44.97
Sundström (2013)
poverty risk (%) 181 16.17 6.71 4.90 38.40 Eurostat
pop. Density (logged) 189 2.50 1.65 -0.02 8.49 Eurostat
capital region 212 0.11 0.32 0.00 1.00 Author