measuring our success - health.gov.bc.ca
TRANSCRIPT

MeasuringOur Success
Baseline Document

Message from the Minister of State: Honourable Gordon Hogg
Measuring Our Success: Baseline Document is our province’s starting point for British Columbians’ journey to simple, easy ways to better health.
Significant research has been done on the prevalence of specific health risk factors and lifestyle behaviours throughout the province. Many of the chronic diseases British Columbians face are preventable with improvements in lifestyle choices such as becoming more physically active, making healthier eating choices, eliminating tobacco use, and making healthy choices during pregnancy. This rigorous analysis of British Columbians provides a base line of our province’s current health challenges and provides a better understanding of regional variations of particular risks.
The good news is that British Columbia ranks the best in Canada with the lowest smoking prevalence and obesity rate of any province, and here in the west we are the most physically active in the nation.
The reality however is that improvements are needed and action is necessary to decrease our province’s preventable health care costs that result from chronic disease and poor lifestyle choices.
When ActNow BC was launched in March 2005, as a multi-year health promotion focused initiative, cross-ministry programs and community partnerships were developed to support one of Government’s Five Great Goals – to lead the way in North America in healthy living and physical fitness.
As ActNow BC and its partners implement the current initiatives to meet its goals, and develop new programs, this document is intended to be the first in a series of annual reports that will continue to reveal the picture of our province’s health behaviours, and the impacts in various regions.
It is hoped that the data presented in this Baseline Document can be used as a resource tool and baseline for program planners and health authorities in the monitoring and evaluation of our province’s progress on our healthy living goals and partnered programs.
I look forward to receiving our province’s report card each year, and striving to make the grade to become the active and healthy province we aim to be. The final test is set for 2010, with the aim of ActNow BC to showcase British Columbia as the healthiest jurisdiction ever to host an Olympic and Paralympic Winter Games. The inspiration won’t stop there however – the promotion of physical activity and encouragement of active living throughout the province intends to be a deliverable that British Columbians can keep for life.
Actively yours,
Honourable Gordon Hogg Minister of State for ActNow BC
November 2006

ActNowBC | Measuring Our Success �
Introduction
Section 1. Lifestyle Behaviours of British Columbiansa. Where do people in British Columbia live?b. Does the birth rate differ in differing parts of the province?c. Do the rates of obesity and/or overweight among adults (aged 18+) differ in the province?d. Does the percent of British Columbians who consume the daily recommended number of fruits and vegetables differ in the province?e. Does the percent of British Columbians who engage in physical activity differ in the province?f. Do the rates of tobacco use differ in province?
Section 2. Act Now BC Planning Models and Indicatorsa. ActNow BC Planning Modelb. Healthy Eating Component Planning Modelc. Physical Activity Component Planning Modeld. Tobacco Control Component Planning Modele. Key ActNow BC Indicators and Performance Measuresf. Healthy Choices in Pregnancy Component Planning Model
Section 3. Baseline information On Outputs and Outcome Measuresa. Physical Activity outputs and outcomes
Active CommunitiesAction Schools!BC
b. Healthy Eating outputs and outcomesDial-A-DietitianFood and Beverage Sales in BC SchoolsBC School Fruit and Vegetable Snack ProgramShapedown BCCommunity Food Action Initiative (CFAI)
c. Tobacco Control outputs and outcomesQuitNowMunicipal Smoking BylawsSecond Hand SmokeTobacco Free Sports ProgramHonour Your Health
d. Healthy Choices in Pregnancy outputs and outcomesHealth Authority FASD Prevention PlansService Provider Awareness and EducationKnowledge of Risks Associated with Alcohol Consumption In Pregnancy
Section 4. Next Steps
Table of Contents
5
9911
12
16
2127
31323436383840
4545454649495050515151515354555556565656
57

� ActNowBC | Measuring Our Success

ActNowBC | Measuring Our Success �
Chronic diseases are among the most prevalent and costly health issues in British Columbia, and they are among the most preventable. The major chronic diseases are frequently the direct result, often over time, of health compromising behaviours or risk factors. The risk factors that contribute most to the burden of disease are relatively few and comprise behaviours that are generally modifiable1. These risk factors are:
• Tobacco use
• Physical inactivity
• Unhealthy eating
• Obesity
• Alcohol misuse
• Occupational risks
ActNow BC is a health and wellness initiative launched by the British Columbia Provincial Government in March 2005. It is a multi-year initiative involving several ministries, 2010 Legacies Now, the British Columbia Healthy Living Alliance (BCHLA), community organizations, and businesses throughout the province. The aim of ActNow BC is to make British Columbia the healthiest jurisdiction to host an Olympic and Paralympic Winter Games by targeting risk factors for chronic disease and taking integrated action to reducing these risk factors. Specifically, ActNow BC promotes physical activity, healthy eating, living tobacco free, and making healthy choices during pregnancy.
British Columbia is fortunate that it already has some of the best outcomes for the common underlying risk factors. It has the lowest smoking prevalence in Canada, which at 15 per cent2 (in 2005) is second only to Utah (10.5 per cent among adults)3 in North America. It has the lowest rate of obesity4 in Canada and British Columbians are among the most physically active in Canada5.
Like most jurisdictions, however, improvements are needed and possible. Not only is health being adversely affected, the financial costs are substantial:
• In 2003, 42.3% of British Columbians (aged 18+) were overweight or obese6. Overweight and obesity costs the province $730-830 million annually7.
• In 2003, only 58.0% of British Columbians (aged 12+) were physically or moderately active8. Physical inactivity costs more than $570 million a year9.
1 Evaluation of Burden of Disease in BC. Strategic Policy and Research Branch, BC Ministry of Health Services, January 20012 Health Canada, Annual Results, 1999-2004, http://www.hc-sc.gc.ca/hl-vs/tobac-tabac/research-recherche/stat/ctums-
esutc/2005/ann-table2_e.html3 American Lung Association (2005). State of Tobacco Control. http://lungaction.org/reports/state-narrative05.
tcl?geo_area_id=494 CCHS (2004) Statistics Canada. http://www.statcan.ca/english/research/82-620-MIE/2005001/tables/t002_en.pdf5 CCHS (2003) Statistics Canada. http://www.statcan.ca/english/freepub/82-221-XIE/2005002/tables/html/2168_03.htm6 Statistics Canada, Canadian Community Health Survey, Table 105-0209, 20037 Coleman, R., S. (2001). The cost of obesity in British Columbia. GPI Atlantic. http://www.gpiatlantic.org/publications/
summaries/bc-obesitysumm.pdf8 Statistics Canada, Canadian Community Health Survey, Table 105-0233, 20039 Colman, R. & Walker, S (2004) The cost of physical inactivity in British Columbia. GPI Atlantic.
ActNowBC provides a coordinated government platform for facilitating multi-sectoral planning and investments in prevention and health promotion.
Introduction

� ActNowBC | Measuring Our Success
• In 2005, 15.0% of British Columbians (aged 15+) used tobacco10. In 2002, costs of tobacco use in British Columbia were estimated to be about $2.3 billion11.
• In 2001, approximately one in ten pregnant Canadian women drank alcohol while pregnant12. Estimates are that full FAS occurs in the range of 0.9 to 4.8/live births (approximately 1 in 500) and the spectrum affects up to 9.1/1000 (approximately 1%) of the population13. A recent study indicated that for each child diagnosed with FASD, the associated, total adjusted annual costs were $14,34214.
In addition, the majority of the British Columbia population does not consume the recommended minimum five fruits and vegetables each day15 and about 25 per cent of the daily calories for adults in British Columbia come from “other foods”, primarily high in fat and/or sugar16.
ActNow BC aims to address these risk factors. The BC Government has established ambitious targets for ActNow BC. Specifically, the ActNow BC 2010 targets are17.
• Physical Activity – To increase by 20% the proportion of the B.C. population (aged 12+) who are physically active or moderately active during their leisure time from the current level (2003) of 58.1%18 to 69.7% of the B.C. population by 2010.
• Healthy Eating – To increase by 20% the proportion of the B.C. population (aged 12+) who eat the daily recommended level of fruits and vegetables from the current level (2003) of 40.1%19 to 48.1% of the population by 2010.
• Tobacco Use – To reduce by 10% the proportion of the BC population (aged 15+) that use tobacco from the current prevalence rate (2003) of 16.0%20 to 14.4% of the BC population by 2010.
• Overweight/Obesity – To reduce by 20% the proportion of the B.C. population (aged 18+) currently classified as overweight or obese from the current prevalence rate (2003) of 42.3%21 to 33.8% of the B.C. population by 2010.
ActNow BC is a strategic cross-
government and cross-sectoral initiative
with the overarching goal of creating
healthy communities. It provides a unifying
brand for everyone to use in their efforts
to produce a healthy British Columbia.
10 Health Canada, Annual Results, 1999-2004, http://www.hc-sc.gc.ca/hl-vs/tobac-tabac/research-recherche/stat /ctums-esutc/prevalence/prevalence_e.html
11 Rehm, J. (2006). The costs of substance abuse in Canada 2002. Canadian Centre on Substance Abuse. p. 10. http://www.ccsa.ca/NR/rdonlyres/18F3415E-2CAC-4D21-86E2-CEE549EC47A9/0/ccsa0113322006.pdf
12 BCRCP (2005). Guidelines for alcohol use in the perinatal period and FASD. As cited in Healthy Choices in Pregnancy: a focus on prenatal alcohol use (2005), BC Ministry of Health, p. 6.
13 BCRCP (2005). Guidelines for alcohol use in the perinatal period and FASD. As cited in Healthy Choices in Pregnancy: a focus on prenatal alcohol use (2005), BC Ministry of Health, pp 3.
14 Stade, B. et al., Feb. 2006). The burden of Perinatal Exposure to Alcohol: Measurement of Cost, Journal of FAS International, 4:e5, http://www.motherisk.org/JFAS/econtent_commonDetail.jsp?econtent_id=101
15 British Columbia Nutrition Survey – Report on Food Group Use, p. 8, March 2004, http://www.healthservices.gov .bc.ca/prevent/nutrition/index.html
16 British Columbia Nutrition Survey – Report on Food Group Use, p. 6, March 2004, http://www.healthservices.gov .bc.ca/prevent/nutrition/index.html
17 ActNow BC, May 24, 2006, http://www.hlth.gov.bc.ca/cpa/mediasite/actnow.html18 Statistics Canada, Canadian Community Health Survey, Table 105-0233 , 200319 Statistics Canada, Canadian Community Health Survey, Table 105-0249, 200320 Canadian Tobacco Use Monitoring Survey (CTUMS), Annual Results 1999-2004, http://www.hc-sc.gc.ca/hl-vs
/tobac-tabac/research-recherche/stat/ctums-esutc/prevalence/prevalence_e.html21 Statistics Canada, Canadian Community Health Survey, Table 105-0209, 2003
“Lead the way in North America in healthy living and
physical fitness”
Goal #2 of the Five Great Goals for BC

ActNowBC | Measuring Our Success �
Information helps to identify need, choose or develop specific products, and choose where and how to deliver products
• Healthy Choices in Pregnancy – • To increase by 50.0% the number of women counseled regarding alcohol use during pregnancy • By September 2006, for all health authority areas to have focused strategies for FASD prevention
To effectively and efficiently design, target and implement the numerous ActNow BC initiatives that have been planned, mechanisms need to be in place to identify provincial variation in health and behavioural factors. This document provides the first in a series of documents that visually present the major ActNow BC health behaviour status of British Columbians both provincially and in most cases by health region or health services delivery area (HSDA) where available.

� ActNowBC | Measuring Our Success
ActNowBC | Measuring Our Success �
Section 1 | Lifestyle Behaviours of British Columbians
These data provide a baseline by which information in future documents can be compared. As well, program planners and decision-makers can utilize these maps and accompanying tables to monitor progress toward achieving the ActNow BC targets and modify their programs and services to maximize impacts.
Each map is accompanied by a table that provides more precise, numeric comparisons of the information collected. As well, a brief interpretation of the maps and tables is provided. While attempts were made to interpret these data as accurately as possible, a note of caution is advised as interpreting data always requires a caveat – other interpretations are possible.
In some cases data may be lacking as it pertains to certain populations and if it does exist, some information may need to be interpreted with caution. For example, weight in children and adolescents is complicated because height and body composition are continually changing. These changes in adolescents occur at different rates in different populations and therefore are more variable compared to adult populations and are subject to different types of error (different validity concerns).
Another cautionary note pertains to the identification of greatest need. While certain parts of the province (e.g. the north) may exhibit high prevalence rates of a particular phenomenon (e.g. rates of obesity), this geographic location may consist of fewer people than are located in a different, but more populated part of the province where the rates of obesity may be lower. In other words the actual number of people who are overweight may be higher in the latter location. Therefore when determining greatest need, and how to maximize program effect, program planners need to consider not only the rate (or percent) of a particular health status indicator but also the actual number of persons this percentage actually represents.
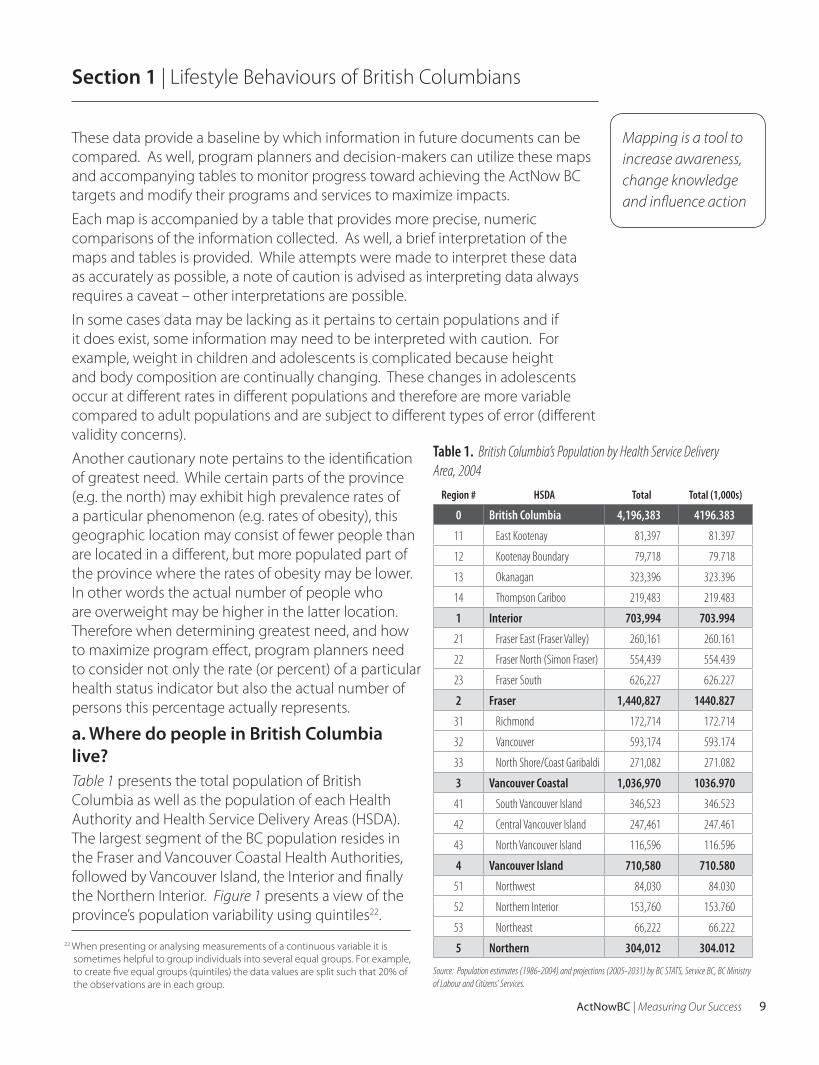
a. Where do people in British Columbia live?Table 1 presents the total population of British Columbia as well as the population of each Health Authority and Health Service Delivery Areas (HSDA). The largest segment of the BC population resides in the Fraser and Vancouver Coastal Health Authorities, followed by Vancouver Island, the Interior and finally the Northern Interior. Figure 1 presents a view of the province’s population variability using quintiles22.
Mapping is a tool to increase awareness, change knowledge and influence action
22 When presenting or analysing measurements of a continuous variable it is sometimes helpful to group individuals into several equal groups. For example, to create five equal groups (quintiles) the data values are split such that 20% of the observations are in each group.
Region # HSDA Total Total (1,000s)
0 British Columbia 4,196,383 4196.383
11 East Kootenay 81,397 81.397
12 Kootenay Boundary 79,718 79.718
13 Okanagan 323,396 323.396
14 Thompson Cariboo 219,483 219.483
1 Interior 703,994 703.994
21 Fraser East (Fraser Valley) 260,161 260.161
22 Fraser North (Simon Fraser) 554,439 554.439
23 Fraser South 626,227 626.227
2 Fraser 1,440,827 1440.827
31 Richmond 172,714 172.714
32 Vancouver 593,174 593.174
33 North Shore/Coast Garibaldi 271,082 271.082
3 Vancouver Coastal 1,036,970 1036.970
41 South Vancouver Island 346,523 346.523
42 Central Vancouver Island 247,461 247.461
43 North Vancouver Island 116,596 116.596
4 Vancouver Island 710,580 710.580
51 Northwest 84,030 84.030
52 Northern Interior 153,760 153.760
53 Northeast 66,222 66.222
5 Northern 304,012 304.012
Table 1. British Columbia’s Population by Health Service Delivery Area, 2004
Source: Population estimates (1986-2004) and projections (2005-2031) by BC STATS, Service BC, BC Ministry of Labour and Citizens’ Services.

N
14
52
5351
2122
41
42
43
43
2331
32
33
22
33
33
21
41
42
23
33
Population (1,000’s)
271.08 - 346.52 172.71 - 260.16 84.03 - 153.76
13
12
11
66.22 - 81.40
554.44 - 626.23
300 kms0 100 200
see inset 2
10 kms0Inset 2
see inset 1
50 kms0
Inset 1
Health Service Delivery Areas11 East Kootenay12 Kootenay Boundary13 Okanagan14 Thompson Cariboo Shuswap21 Fraser East22 Fraser North23 Fraser South31 Richmond32 Vancouver33 North Shore/Coast Garibaldi41 South Vancouver Island42 Central Vancouver Island43 North Vancouver Island51 Northwest52 Northern Interior53 Northeast
10 ActNowBC | Measuring Our Success
Figure 1. British Columbia’s Population by Health Service Delivery Area, 2004
Source: Population estimates (1986-2004) and projections (2005-2031) by BC STATS, Service BC, BC Ministry of Labour and Citizens’ Services, map compiled by BC Vital Statistics.
ActNowBC | Measuring Our Success 11
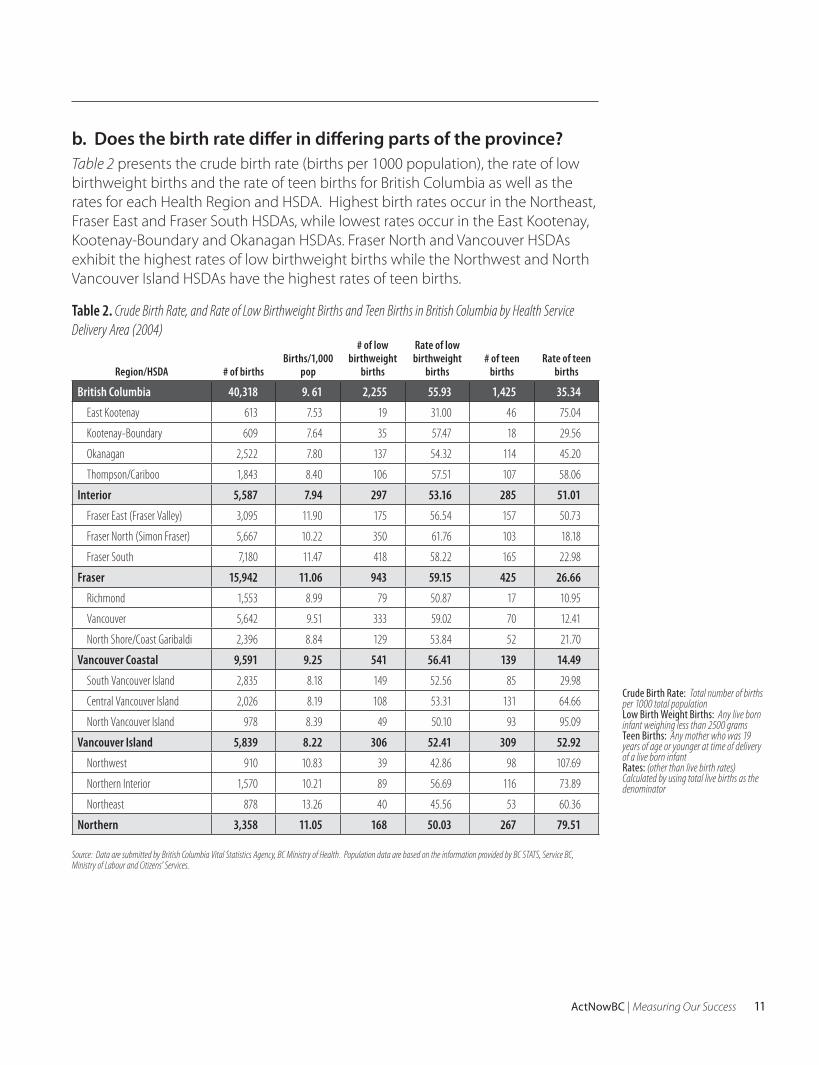
b. Does the birth rate differ in differing parts of the province?Table 2 presents the crude birth rate (births per 1000 population), the rate of low birthweight births and the rate of teen births for British Columbia as well as the rates for each Health Region and HSDA. Highest birth rates occur in the Northeast, Fraser East and Fraser South HSDAs, while lowest rates occur in the East Kootenay, Kootenay-Boundary and Okanagan HSDAs. Fraser North and Vancouver HSDAs exhibit the highest rates of low birthweight births while the Northwest and North Vancouver Island HSDAs have the highest rates of teen births.
Table 2. Crude Birth Rate, and Rate of Low Birthweight Births and Teen Births in British Columbia by Health Service Delivery Area (2004)
Region/HSDA # of birthsBirths/1,000
pop
# of low birthweight
births
Rate of low birthweight
births# of teen
birthsRate of teen
births
British Columbia 40,318 9. 61 2,255 55.93 1,425 35.34
East Kootenay 613 7.53 19 31.00 46 75.04
Kootenay-Boundary 609 7.64 35 57.47 18 29.56
Okanagan 2,522 7.80 137 54.32 114 45.20
Thompson/Cariboo 1,843 8.40 106 57.51 107 58.06
Interior 5,587 7.94 297 53.16 285 51.01
Fraser East (Fraser Valley) 3,095 11.90 175 56.54 157 50.73
Fraser North (Simon Fraser) 5,667 10.22 350 61.76 103 18.18
Fraser South 7,180 11.47 418 58.22 165 22.98
Fraser 15,942 11.06 943 59.15 425 26.66
Richmond 1,553 8.99 79 50.87 17 10.95
Vancouver 5,642 9.51 333 59.02 70 12.41
North Shore/Coast Garibaldi 2,396 8.84 129 53.84 52 21.70
Vancouver Coastal 9,591 9.25 541 56.41 139 14.49
South Vancouver Island 2,835 8.18 149 52.56 85 29.98
Central Vancouver Island 2,026 8.19 108 53.31 131 64.66
North Vancouver Island 978 8.39 49 50.10 93 95.09
Vancouver Island 5,839 8.22 306 52.41 309 52.92
Northwest 910 10.83 39 42.86 98 107.69
Northern Interior 1,570 10.21 89 56.69 116 73.89
Northeast 878 13.26 40 45.56 53 60.36
Northern 3,358 11.05 168 50.03 267 79.51
Source: Data are submitted by British Columbia Vital Statistics Agency, BC Ministry of Health. Population data are based on the information provided by BC STATS, Service BC, Ministry of Labour and Citizens’ Services.
Crude Birth Rate: Total number of births per 1000 total population Low Birth Weight Births: Any live born infant weighing less than 2500 grams Teen Births: Any mother who was 19 years of age or younger at time of delivery of a live born infant Rates: (other than live birth rates) Calculated by using total live births as the denominator

12 ActNowBC | Measuring Our Success
c. Do the rates of obesity and/or overweight among adults (aged 18+) differ in the province?The next few tables and figures present the prevalence of obesity and/or overweight among BC adults and the differences that exist among Health Regions and by HSDA.
Table 3 presents the rates of overweight and obesity combined. Approximately 42.3% (51.7% males and 33.6% females23) of the BC population is either overweight or obese with the percentages ranging from 32.8% in the Vancouver Coastal Health Region to 53.5% in the Northern Health Region24. The prevalence of overweight/obesity in the province based on quintiles is presented in Figure 2. Rates are highest in the northern and eastern parts of the province and lowest in the lower mainland and south Vancouver Island area.
23 CCHS Share file, 2003, cycle 2.1. Not stated have been included to mirror the CANSIM data 24 Statistics Canada, Canadian Community Health Survey, Table 105-0209, 2003 Note: Percentages that appear in the CANSIM tables may differ slightly from those obtained from the Share file since the latter include only participants in the survey who agreed to sharing their PHN (Personal Health Number).
Table 3. Overweight and obesity combined by Health Region and Health Service Delivery Area for population (Aged 18+), 2003 (Based on self-reported height and weight)
Region/HSDA Tot. Pop. Obese/Overweight Per Cent Obese/Overweight
British Columbia 3,166,740 1,339,627 42.3
East Kootenay 60,750 32,394 53.3
Kootenay-Boundary 63,138 28,980 45.9
Okanagan 235,909 118,183 50.1
Thompson/Cariboo 158,437 76,065 48.0
Interior 518,234 255,622 49.3
Fraser East (Fraser Valley) 182,635 89,615 49.1
Fraser North (Simon Fraser) 439,485 174,040 39.6
Fraser South 467,969 198,941 42.5
Fraser 1,090,089 462,596 42.4
Richmond 139,698 45,356 32.5
Vancouver 478,148 143,888 30.1
North Shore/Coast Garibaldi 206,602 81,125 39.3
Vancouver Coastal 824,448 270,369 32.8
South Vancouver Island 266,201 108,683 40.8
Central Vancouver Island 183,806 90,992 49.5
North Vancouver Island 82,770 43,653 52.7
Vancouver Island 532,777 243,328 45.7
Northwest 50,604 25,232 49.9
Northern Interior 107,180 57,626 53.8
Northeast 43,408 24,852 57.3
Northern 201,192 107,710 53.5
Source: Statistics Canada, Canadian Community Health Survey, Table 105-0209, 2003 (CANSIM Tables)
BMI: Weight (Kg)/Height 2(meters) Question: How tall are you without shoes? Select the exact height. Question: How much do you weigh? Was that in pounds or kilograms? Survey covers: Population aged 18+, excluding pregnant women and persons less than 3 feet (0.914 metres) tall or greater than 6 feet 11 inches (2.108 metres) Index: less than 18.5 (underweight) 18-24.9 (normal weight), 25.0-29.9 (overweight); more than 30.0 (obese) Note: Although the BMI is not recom-mended for women who are lactating, the index is reported for women who report that they are breast-feeding.

N
14
52
5351
2122
41
42
43
43
2331
32
33
22
33
33
21
41
42
23
33
Per Cent ofPopulation (aged 18+)
49.8 - 52.7 45.9 - 49.5 39.6 - 42.5
13
12
11
30.1 - 39.2
53.4 - 57.3
300 kms0 100 200
see inset 2
10 kms0Inset 2
see inset 1
50 kms0
Inset 1
Health Service Delivery Areas11 East Kootenay12 Kootenay Boundary13 Okanagan14 Thompson Cariboo Shuswap21 Fraser East22 Fraser North23 Fraser South31 Richmond32 Vancouver33 North Shore/Coast Garibaldi41 South Vancouver Island42 Central Vancouver Island43 North Vancouver Island51 Northwest52 Northern Interior53 Northeast
ActNowBC | Measuring Our Success 1�
Figure 2. Per Cent of Population (Aged 18+) Who Are Overweight or Obese by Health Service Delivery Area (Quintiles), 2003
Source: Statistics Canada, Canadian Community Health Survey, Table 105-0209, 2003, map compiled by BC Vital Statistics.

59.156.354.551.951.651.150.450.448.846.444.543.641.141.141.031.6
70605040302010
0
33.2
Perce
ntag
e
1� ActNowBC | Measuring Our Success
Table 4. Prevalence of Overweight and Obesity by Health Service Delivery Area (95% Confidence Interval) for population aged 18+ (2003)
HSDA% Obese/
Overweight95% Confidence
Interval
Vancouver 31.62 28.08 35.16
Richmond 33.19 28.04 38.33
Fraser North (Simon Fraser) 41.02 37.26 44.78
North Shore/Coast Garibaldi 41.06 36.92 45.20
South Vancouver Island 41.14 37.52 44.76
British Columbia 43.63 42.39 44.86
Fraser South 44.51 40.45 48.57
Kootenay-Boundary 46.44 41.22 51.67
Thompson/Cariboo 48.76 44.86 52.67
Central Vancouver Island 50.39 45.90 54.87
Fraser East (Fraser Valley) 50.41 46.63 54.19
Northwest 51.13 45.80 56.46
Okanagan 51.64 47.24 56.04
East Kootenay 51.85 45.61 58.09
North Vancouver Island 54.45 47.66 61.25
Northern Interior 56.33 50.88 61.79
Northeast 59.10 54.77 63.43
Source: Statistics Canada, Canadian Community Health Survey 2003 Share File (Cycle 2.1)
Note: Percentages that appear in the CANSIM tables may differ slightly from those obtained from the Share file since the latter include only participants in the survey who agreed to sharing their PHN (Personal Health Number).
Table 4 presents in ascending order the percent of obese or overweight adults by HSDA. Sampling introduces the possibility of random error and therefore the table includes 95% Confidence Intervals for each HSDA’s estimated rate of overweight/obesity. Richmond and Vancouver exhibited significantly lower (p<.05) levels of overweight and obesity than the province while North Shore/Coast Garibaldi, Fraser North, Fraser South, South Vancouver Island and Kootenay Boundary did not differ from the provincial average. All other HSDAs in the province exhibited significantly higher (p < .05) overweight/obesity levels than the provincial average.
Figure 3 presents information on the prevalence of obesity or overweight with corresponding 95% confidence intervals for each HSDA in comparison to the provincial average (noted as a red line). Green bars illustrate HSDAs that were significantly below the provincial average, blue connotes those not significantly different from the provincial average, while brown identifies those with obesity/overweight rates that are significantly higher than the provincial average.
Figure 4 presents where these significant differences exist on a map of the province. Brown areas signify those parts of the province with significantly higher (p<.05) overweight/obesity levels than the provincial average. The figure also takes into consideration the population differences that exist across the province. The size of the circle in the legend denotes a population of 170,000 persons, while the red or white illustrate the proportion who are overweight/obese or neither, respectively. Most overweight/obese people (as denoted by the area of the red shading in the circles) are located in the lower mainland and on Vancouver Island.
Figure 3. Obese or Overweight by Health Service Delivery Area (95% Confidence Interval) for Population (Aged 18+), 2003

N
14
52
5351
2122
41
42
43
43
2331
32
3322
33
33
21
41
42
23
23
33
13
1211
300 kms0 100 200
see inset 2
10 kms0Inset 2
see inset 1
50 kms0
Inset 1
Health Service Delivery Areas11 East Kootenay12 Kootenay Boundary13 Okanagan14 Thompson Cariboo Shuswap21 Fraser East22 Fraser North23 Fraser South31 Richmond32 Vancouver33 North Shore/Coast Garibaldi41 South Vancouver Island42 Central Vancouver Island43 North Vancouver Island51 Northwest52 Northern Interior53 Northeast
Statistical SignificanceCompared to B.C.Average (42.3%)
Obesity or Overweight(Aged 18+)
Significant High
Significant Low
No Difference
Obese or Overweight
Neither Obese orOverweight
Equivalent to170,000 Pop.
ActNowBC | Measuring Our Success 1�
Figure 4. Percentage of Overweight or Obesity by Health Service Delivery Area Population (Aged 18+), 2003
Source: HSDA boundary - BC Stats; HSDA population - PEOPLE 30; Obesity or Overweight - CCHS Cycle 2.1

1� ActNowBC | Measuring Our Success
d. Does the percent of British Columbians who consume the daily recommended number of fruits and vegetables differ in the province?Canada’s Food Guide to Healthy Eating25 recommends a pattern of eating for achieving adequate intakes of essential nutrients and calories. According to the BC Nutrition Survey26:
• Approximately 25% of women and 40% of men ate the recommended 5-10 servings of vegetables and fruit per day27.
• Approximately 15% of women and 25% of men met the daily recommendation of 2-4 servings of milk products28.
• Approximately 40% percent of British Columbians did not meet the minimum recommendations of five grain servings a day, with three times as many women as men falling below the minimum (61.3% versus 19.3%)29.
Table 5 presents the prevalence of British Columbians (aged 12+) by health region and HSDA who consume the daily recommended levels of fruit and vegetables (5+/ day).
The prevalence of persons (aged 12+) consuming recommended daily amounts of fruits and vegetables in the province based on quintiles is presented in Figure 5. The highest fruit and vegetable consumption ranges occurred in North Shore/Coast Garibaldi, East Kootenay, and Kootenay Boundary Health Service Delivery Areas, while the lowest ranges occurred in Richmond, North East, and Fraser North Health Service Delivery Areas.
Canada’s Food Guide to Healthy Eating recommends the following number of servings each day
• Grain products: 5-12
• Vegetables and fruit: 5-10
• Milk products: 2-4
• Meat and alternatives: 2-3
25 Canada’s Food Guide to Healthy Eating (2004) Health Canada. http://www.hc-sc.gc.ca/fn-an/alt_formats/hpfb-dgpsa/pdf/food-guide-aliment/fg_rainbow-arc_en_ciel_ga_e.pdf
26 BC Nutrition Survey, Ministry of Health Services (2004) http://www.healthservices.gov.bc.ca/prevent/nutrition/index.html27 British Columbia Nutrition Survey – Report on Food Group Use, p.9, March 2004, http://www.healthservices.gov.
bc.ca/prevent/nutrition/index.html28 British Columbia Nutrition Survey – Report on Food Group Use, p.11, March 2004, http://www.healthservices.gov.
bc.ca/prevent/nutrition/index.html29 British Columbia Nutrition Survey – Report on Food Group Use, p.8, March 2004, http://www.health.gov.bc.ca/prevent/
nutrition/pdf/fgreport.pdf

ActNowBC | Measuring Our Success 1�
Table 5. Recommended Fruit and Vegetable Consumption (5 or More Servings per Day) by Health Region and Health Service Delivery Area for Population (Aged 12+)30, 2003
Region # Region/HSDA Tot Pop. Cons. Fruit/Veg Per Cent
0 All BC 3,521,971 1,410,578 40.1
11 East Kootenay 68,707 30,818 44.9
12 Kootenay-Boundary 70,143 31,049 44.3
13 Okanagan 264,878 104,555 39.5
14 Thompson/Cariboo 178,653 74,996 42.0
1 Interior 582,381 241,418 41.5
21 Fraser East (Fraser Valley) 208,731 82,475 39.5
22 Fraser North (Simon Fraser) 483,534 177,574 36.7
23 Fraser South 527,524 212,519 40.3
2 Fraser 1,219,789 472,568 38.7
31 Richmond 152,786 51,290 33.6
32 Vancouver 512,805 189,482 37.0
33 North Shore/Coast Garibaldi 228,543 106,830 46.7
3 Vancouver Coastal 894,134 347,602 38.9
41 South Vancouver Island 292,240 128,049 43.8
42 Central Vancouver Island 206,451 91,235 44.2
43 North Vancouver Island 94,885 41,044 43.3
4 Vancouver Island 593,576 260,328 43.9
41 Northwest 58,036 22,873 39.4
42 Northern Interior 123,367 48,004 38.9
43 Northeast 50,689 17,783 35.1
5 Northern 232,092 88,660 38.2
Source: Canadian Community Health Survey (CCHS), Cycle 2.1 (2003)
Note: This data is based on respondents consuming fruit/vegetables at least 5 or more times/day
Survey Questions:How often do you usually drink fruit juices such as orange, grapefruit or tomato?
1. per day2. per week3. per month4. per year5. never
Not counting juice, how often do you eat fruit?How often do you (usually) eat green salad?How often do you (usually) eat potatoes, not including French fries, fried potatoes or potato chips?How often do you (usually) eat carrots?Not counting carrots, potatoes, or salad, how many servings of other vegetables do you usually eat?
30 Statistics Canada, Canadian Community Health Survey, Table 105-0249, 2003

N
14
52
5351
2122
41
42
43
43
2331
32
33
22
33
3321
41
42
23
33
Per Cent ofPopulation (Aged +12)
43.26 - 44.19 39.47 - 41.98 36.95 - 39.41
13
1211
33.57 - 36.72
44.27 - 46.74
300 kms0 100 200
see inset 2
10 kms0Inset 2
see inset 1
50 kms0
Inset 1
Health Service Delivery Areas11 East Kootenay12 Kootenay Boundary13 Okanagan14 Thompson Cariboo Shuswap21 Fraser East22 Fraser North23 Fraser South31 Richmond32 Vancouver33 North Shore/Coast Garibaldi41 South Vancouver Island42 Central Vancouver Island43 North Vancouver Island51 Northwest52 Northern Interior53 Northeast
1� ActNowBC | Measuring Our Success
Figure 5. Per Cent of Population (Aged 12+) Who Meet the Recommended Daily Intake of Fruits and Vegetables (5 or More Servings per Day) by Health Services Delivery Area (Quintiles), 2003
Source: Statistics Canada, Canadian Community Health Survey, Table 105-0249, 2003

46.744.944.344.243.843.342.040.333.6 35.1 36.7 37.0
38.9 39.4 39.5
Perc
enta
ge
39.540.1
0
10
20
30
40
50
ActNowBC | Measuring Our Success 1�
Table 6 presents in ascending order the percent of the population (aged 12+) who consumed the daily recommended levels of fruits and vegetables by HSDA. Sampling introduces the possibility of random error and therefore the table includes 95% confidence intervals for each HSDAs estimated rate of recommended consump-tion. Richmond exhibited significantly lower (p<.05) levels of fruit and vegetable consumption (daily recommended) than the province while North Shore/Coast Garibaldi exhibited significantly higher (p< .05) fruit and vegetable intake (daily recommended) than the provincial average. All other HSDAs in the province did not differ significantly in terms of their mean rates of recommended fruit and vegetable consumption levels from the provincial average.
Figure 6 presents information on the prevalence of recommended fruit and vegetable consumption with corresponding 95% confidence intervals for each HSDA in comparison to the provincial average (noted as a red line). Green bars illustrate HSDAs that were significantly above the provincial average, blue connotes those not significantly different from the provincial average, while brown identifies those with fruit and vegetable rates that are significantly lower than the provincial average.
Table 6. Prevalence of Meeting the Daily Recommended Fruit and Vegetable Consumption - 5 or More Servings per Day by Health Service Delivery Area (95% Confidence Iinterval) for Population (Aged 12+), 2003
HSDA% Frt/Veg 5 or
More Times 95% Confidence IntervaI
Richmond 33.6 29.8 37.3
Northeast 35.1 29.7 40.5
Fraser North (Simon Fraser) 36.7 33.8 39.6
Vancouver 37.0 33.9 40.0
Northern Interior 38.9 33.9 43.9
Northwest 39.4 33.5 45.3
Okanagan 39.5 36.0 42.9
Fraser East (Fraser Valley) 39.5 35.5 43.5
British Columbia 40.1 39.0 41.1
Fraser South 40.3 37.1 43.5
Thompson/Cariboo 42.0 37.8 46.2
North Vancouver Island 43.3 38.5 48.1
South Vancouver Island 43.8 40.0 47.6
Central Vancouver Island 44.2 39.5 48.9
Kootenay-Boundary 44.3 39.2 49.3
East Kootenay 44.9 39.5 50.2
North Shore/Coast Garibaldi 46.7 43.0 50.5
Source: Statistics Canada, Canadian Community Health Survey, Table 105-0249, 2003
Figure 6. Fruit and Vegetable Consumption - (5 or More Servings per Day) by Health Service Delivery Area (95% Confidence Iinterval) for Population (Aged 12+), 2003
Source: Statistics Canada, Canadian Community Health Survey, Table 105-0249, 2003

N
14
52
5351
2122
41
42
43
43
2331
32
3322
33
33
21
41
42
23
23
33
1312
11
300 kms0 100 200
see inset 2
10 kms0Inset 2
see inset 1
50 kms0
Inset 1
Statistical SignificanceCompared to B.C.Average (40.1%)
Population (Aged 12+)Having Fruits/Vegetables
Significant HighSignificant Low
No Difference
At Least 5 Times/DayOther Quantities
Equivalent to200,000 Pop.
Health Service Delivery Areas11 East Kootenay12 Kootenay Boundary13 Okanagan14 Thompson Cariboo Shuswap21 Fraser East22 Fraser North23 Fraser South31 Richmond32 Vancouver33 North Shore/Coast Garibaldi41 South Vancouver Island42 Central Vancouver Island43 North Vancouver Island51 Northwest52 Northern Interior53 Northeast
20 ActNowBC | Measuring Our Success
Figure 7. Per Cent Who Consume Recommended Daily Intake of Fruits and Vegetables (5 or More Servings per Day) by Health Service Delivery Area for Population (Aged 12+), 2003
Source: HSDA boundary - BC Stats; HSDA population - PEOPLE 30; Fruits and Vegetables Intake - CCHS Cycle 2.1

ActNowBC | Measuring Our Success 21
Figure 7 presents where these significant differences exist on a map of the province. Brown areas signify those parts of the province with significantly higher (p<.05) daily recommended fruit and vegetable intake levels than the provincial average. The figure also takes into consideration the population differences that exist across the province. The size of the circle in the legend denotes a population of 200,000 persons, while the white or red illustrate the proportion who consume 5+ fruits or vegetable daily or do not, respectively. Most people who consume less than 5 fruits or vegetable daily (as denoted by the area of the red shading in the circles) are located in the lower mainland and on Vancouver Island.
e. Does the percent of British Columbians who engage in physical activity differ in the province?While varying definitions of physical activity and inactivity exist, regardless of which definition is utilized it is clear that many British Columbians are not sufficiently active. For example:
• Approximately one third (39%) of British Columbians (aged 12+) are physically inactive (get little or no exercise)31. Approximately 61% of males and 56% of females age 12+ years are active/moderately active32.
• As many as 46% of British Columbians are not active enough to achieve the health benefits of regular activity33.
• While many adults are inactive, 80% of adult British Columbians believed that they were active enough to achieve health benefits - including weight control34.
• Approximately 50% of BC youth aged 12 to 1935 were not active enough for optimal growth and development. The level of physical activity required for optimal growth and development for children and youth is equivalent to 60 minutes of physical activity throughout the day.
Baseline data from Actions Schools! BC pilot of 10 lower mainland elementary schools (Grades 4, 5, and 6) found 45% of children were not meeting health guidelines for physical activity (60 min/day)36.
Table 7 presents the prevalence of British Columbians by health region and HSDA who were classified as active or moderately active in their leisure-time physical activity. Approximately 58% of British Columbians (aged 12+) were classified as active or moderately active with the highest percentage of active British Columbians residing in the East Kootenay, North Shore/Coast Garibaldi and Kootenay Boundary areas (see Figure 8)37.
The Canadian Community Health Survey (CCHS) defines physical inactivity as less than 1.5 kcal/kg/day, moderate physical activity as 1.5 - 2.9 kcal/kg/day and active levels of physical activity as greater than 3 kcal/kg/day.
31 Statistics Canada, Canadian Community Health Survey, Table 105-0233, 2003.32 CCHS Share file, 2003, cycle 2.3. Not stated have been included to mirror the CANSIM data33 Canadian Fitness and Lifestyle Research Institute, 2002 Physical Activity Monitor, http://cflri.ca/eng/provincial_data/
pam2001/british_columbia.php34 British Columbia Nutrition Survey – Report on Physical Activity and Body Weight, p.17, March 2004, http://www.
healthservices.gov.bc.ca/prevent/nutrition/index.html35 Canadian Fitness and Lifestyle Research Institute, Results of the 2002 Physical Activity Monitor, http://www.cflri.
ca/eng/provincial_data/pam2002/british_columbia.php]36 ActionSchools! BC (2004). Phase I (Pilot) Evaluation Report and Recommendations A Report to the Ministry of Health
Services, pp. 8, http://www.healthservices.gov.bc.ca/cpa/publications/actionschoolsreport.pdf37 Statistics Canada, Canadian Community Health Survey, Table 105-0233, 2003

22 ActNowBC | Measuring Our Success
Table 7. Physically Active or Moderately Active by Health Region and Health Service Delivery Area for Population (Aged 12+), 2003
Region # Region Tot. Pop. Count Actv/Mod Actv % Actv/Mod Actv
0 All BC 3,521,971 2,044,762 58.1
11 East Kootenay 68,707 45,608 66.4
12 Kootenay Boundary 70,143 42,518 60.6
13 Okanagan 264,878 148,337 56.0
14 Thompson Cariboo 178,653 106,030 59.3
1 Interior 582,381 342,493 58.8
21 Fraser Valley 208,731 118,510 56.8
22 Simon Fraser 483,534 270,825 56.0
23 South Fraser 527,524 305,078 57.8
2 Fraser 1,219,789 694,413 56.9
31 Richmond 152,786 83,621 54.7
32 Vancouver 512,805 286,990 56.0
33 North Shore/Coast Garibaldi 228,543 149,178 65.3
3 Vancouver Coastal 894,134 519,789 58.1
41 South Vancouver Island 292,240 173,242 59.3
42 Central Vancouver Island 206,451 123,673 59.9
43 North Vancouver Island 94,885 57,513 60.6
4 Vancouver Island 593,576 354,428 59.7
41 Northwest 58,036 34,227 59.0
42 Northern Interior 123,367 72,157 58.5
43 Northeast 50,689 27,255 53.8
5 Northern 232,092 133,639 57.6
Source: Statistics Canada, Canadian Community Health Survey, Table 105-0233, 2003.
1. Population aged 12 and over reporting level of physical activity, based on their responses to questions about the frequency, duration and intensity of their participation in leisure-time physical activity.
2. Respondents are classified as active, moderately active or inactive based on an index of average daily physical activity over the past 3 months. For each leisure time physical activity engaged in by the respondent, an average daily energy expenditure is calculated by multiplying the number of times the activity was performed by the average duration of the activity by the energy cost (kilocalories per kilogram of body weight per hour) of the activity. The index is calculated as the sum of the average daily energy expenditures of all activities. Respondents are classified as follows: 3.0 kcal/kg/day or

N
14
52
5351
2122
41
42
43
43
2331
32
33
22
33
3321
41
42
23
33
Per Cent ofPopulation (Aged 12+)
59.35 - 60.61 57.83 - 59.28 56.00 - 56.78
1312
11
53.77 - 55.96
60.62 - 66.38
300 kms0 100 200
see inset 2
10 kms0Inset 2
see inset 1
50 kms0
Inset 1
Health Service Delivery Areas11 East Kootenay12 Kootenay Boundary13 Okanagan14 Thompson Cariboo Shuswap21 Fraser East22 Fraser North23 Fraser South31 Richmond32 Vancouver33 North Shore/Coast Garibaldi41 South Vancouver Island42 Central Vancouver Island43 North Vancouver Island51 Northwest52 Northern Interior53 Northeast
ActNowBC | Measuring Our Success 2�
Figure 8. Per Cent of Population (Aged 12+) Who Are Physically Active or Moderately Active by Health Service Delivery Area (Quintiles), 2003
Source: Statistics Canada, Canadian Community Health Survey, Table 105-0233, 2003
2� ActNowBC | Measuring Our Success
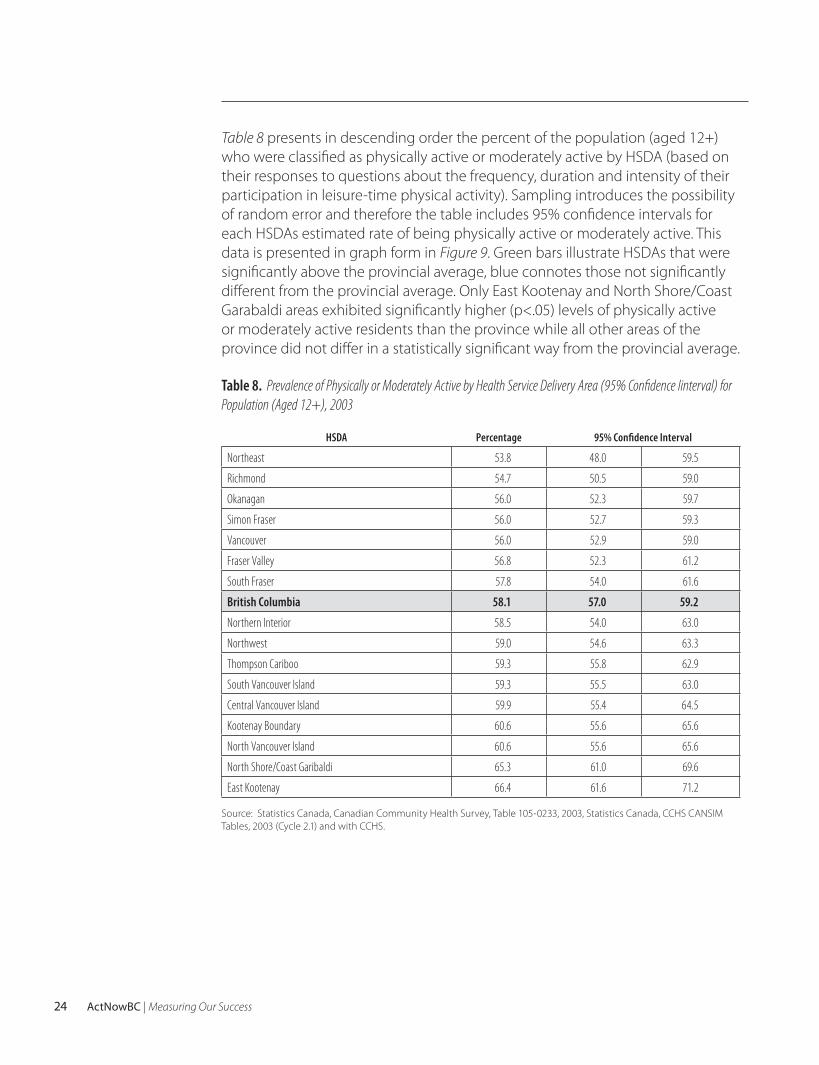
Table 8 presents in descending order the percent of the population (aged 12+) who were classified as physically active or moderately active by HSDA (based on their responses to questions about the frequency, duration and intensity of their participation in leisure-time physical activity). Sampling introduces the possibility of random error and therefore the table includes 95% confidence intervals for each HSDAs estimated rate of being physically active or moderately active. This data is presented in graph form in Figure 9. Green bars illustrate HSDAs that were significantly above the provincial average, blue connotes those not significantly different from the provincial average. Only East Kootenay and North Shore/Coast Garabaldi areas exhibited significantly higher (p<.05) levels of physically active or moderately active residents than the province while all other areas of the province did not differ in a statistically significant way from the provincial average.
Table 8. Prevalence of Physically or Moderately Active by Health Service Delivery Area (95% Confidence Iinterval) for Population (Aged 12+), 2003
HSDA Percentage 95% Confidence Interval
Northeast 53.8 48.0 59.5
Richmond 54.7 50.5 59.0
Okanagan 56.0 52.3 59.7
Simon Fraser 56.0 52.7 59.3
Vancouver 56.0 52.9 59.0
Fraser Valley 56.8 52.3 61.2
South Fraser 57.8 54.0 61.6
British Columbia 58.1 57.0 59.2
Northern Interior 58.5 54.0 63.0
Northwest 59.0 54.6 63.3
Thompson Cariboo 59.3 55.8 62.9
South Vancouver Island 59.3 55.5 63.0
Central Vancouver Island 59.9 55.4 64.5
Kootenay Boundary 60.6 55.6 65.6
North Vancouver Island 60.6 55.6 65.6
North Shore/Coast Garibaldi 65.3 61.0 69.6
East Kootenay 66.4 61.6 71.2
Source: Statistics Canada, Canadian Community Health Survey, Table 105-0233, 2003, Statistics Canada, CCHS CANSIM Tables, 2003 (Cycle 2.1) and with CCHS.

54.7 56.0 56.0 56.0 56.8 57.8 58.1 58.5 59.0 59.3 59.3 59.9 60.6 60.665.3 66.4
53.8
0
10
20
30
40
50
60
70
80
Perc
enta
ge
ActNowBC | Measuring Our Success 2�
Figure 9. Physically Active/Moderately Active by Health Service Delivery Area (95% Confidence Interval) for Population (Aged 12+) 2003
Source: Statistics Canada, Canadian Community Health Survey, Table 105-0233, 2003Statistics Canada, CCHS CANSIM Tables, 2003 (Cycle 2.1) and with CCHS.
Figure 10 presents where these significant differences exist on a map of the province. Green areas signify those parts of the province with significantly higher (p<.05) rates of physically active or moderately active residents than the provincial average. The figure also takes into consideration the population differences that exist across the province. The size of the circle in the legend denotes a population of 260,000 persons, while the white or red illustrate the proportion who are active (physically active or moderately active) or inactive (neither physically active or moderately active), respectively. Most people, in terms of absolute numbers, who are physically active or moderately active (as denoted by the area of the red shading in the circles) are located in the lower mainland and on Vancouver Island.

N
14
52
5351
2122
41
42
43
43
2331
32
33
22
33
33
21
41
42
23
23
33
Statistical SignificanceCompared to B.C.Average (58.1%)
Physically ActivePopulation (aged 12+)
Significant High
Significant Low
13
1211
No Difference
Not Active
Active
Equivalent to260,000 Pop.
300 kms0 100 200
see inset 2
10 kms0Inset 2
see inset 1
50 kms0
Inset 1
Health Service Delivery Areas11 East Kootenay12 Kootenay Boundary13 Okanagan14 Thompson Cariboo Shuswap21 Fraser East22 Fraser North23 Fraser South31 Richmond32 Vancouver33 North Shore/Coast Garibaldi41 South Vancouver Island42 Central Vancouver Island43 North Vancouver Island51 Northwest52 Northern Interior53 Northeast
2� ActNowBC | Measuring Our Success
Figure 10. Per Cent of Population (Aged 12+) Who Are Physically or Moderately Active by Health Service Delivery Area 2003
Source: HSDA boundary - BC Stats; HSDA population - PEOPLE 30; Physical Activity - CCHS Cycle 2.1

ActNowBC | Measuring Our Success 2�
f. Do the rates of tobacco use differ in the province?The proportion of British Columbians classified as smokers varies slightly depend-ing on the survey used. Variations may be due to differences in the wording of questions, response categories and survey methodologies. For example, according to the Canadian Tobacco Use Survey (CTUMS) 15%38 of the BC population above the age of 15 are smokers while the Canadian Community Health Survey, in 2003, reports that 18.7% of British Columbians (aged 12 and over) are current daily or occasional smokers39. BC Stats utilizes a 12- month rolling average to determine smoking rates. According to BC Stats the twelve month average, surveyed monthly from April ‘05 – March ‘06, is 18.2% (19.3% men and 17.1% women40). Table 9. presents the estimated percentage of smokers, by HSDA for those persons 15 years of age and older, while Figure 11 presents the prevalence of current smokers in the province based on quintiles.
Table 9. Percent of Population (Age 15+) Who Are Current (Daily and Occasional) Smokers by Health Service Delivery Area, 2005
Region/HSDA Population (Aged 15+), 2005 Est. Current Smokers Est. % Current Smokers
All BC 3,559,109 647,142 18.2Interior 604,901 137,283 22.7East Kootenay 69,409 18,626 26.8Kootenay/Boundary 68,517 16,525 24.6Okanagan 281,282 58,021 20.6Thompson/Cariboo 185,693 43,821 23.5Fraser 1,201,737 203,094 16.9Fraser East (Fraser Valley) 212,133 31,322 14.7Fraser North (Simon Fraser) 469,872 82,518 17.6Fraser South 519,732 88,007 16.9Vancouver/Coastal 894,815 127,287 14.2Richmond 148,218 19,230 12.9Vancouver 514,706 73,392 14.2North Shore/Coast Garibaldi 231,891 34,991 15.1Vancouver Island 614,054 119,786 19.5South Vancouver Island 302,079 57,997 19.2Central Vancouver Island 213,291 41,745 19.6North Vancouver Island 98,684 20,136 20.4Northern 243,602 59,655 24.5Northwest 66,313 15,356 23.2Northern Interior 123,556 30,554 24.7Northeast 53,733 14,027 26.1
Source: BC Stats, CHESS Twelve (12) month average, surveyed monthly April 05-Mar 06Note: counts may not equal the % smoker rate due to rounding and fact that counts are based on gender specific rates.
38 Canadian Tobacco Use Monitoring Survey (CTUMS), Annual Results 1999-2004, http://www.hc-sc.gc.ca/hl-vs/tobac-tabac/research-recherche/stat/ctums-esutc/prevalence/prevalence_e.html
39 Statistics Canada, Canadian Community Health Survey, Table 105-0227, 2003, http://www.statcan.ca/english/freepub/82-221-XIE/00604/nonmed/behaviours1.htm#smoke
40 BC Stats. Summary of Smoking Rates for BC, March 2006, p. 3.

N
14
52
5351
2122
41
42
43
43
2331
32
33
22
33
33
21
41
42
23
33
Per Cent ofPopulation (Aged 15+)
13
12
11
24.7 - 26.820.7 - 24.619.3 - 20.615.2 - 19.212.9 - 15.1
300 kms0 100 200
see inset 2
10 kms0Inset 2
see inset 1
50 kms0
Inset 1
Health Service Delivery Areas11 East Kootenay12 Kootenay Boundary13 Okanagan14 Thompson Cariboo Shuswap21 Fraser East22 Fraser North23 Fraser South31 Richmond32 Vancouver33 North Shore/Coast Garibaldi41 South Vancouver Island42 Central Vancouver Island43 North Vancouver Island51 Northwest52 Northern Interior53 Northeast
2� ActNowBC | Measuring Our Success
Figure 11. Tobacco Use by Health Service Delivery Area for Population (Aged 15+), 2005 (Quintiles)
Source: BC Stats, CHESS Twelve (12) month average, surveyed monthly April 05-Mar 06

0
5
10
15
20
25
30
35
Nov ’04 Dec ’04 Jan ’05 Feb ’05 Mar ’05 Apr ’05 May ’05 Jun ’05 Jul ’05 Aug ’05 Sep ’05 Oct ’05 Nov ’05 Dec ’05 Jan ’06 Feb ’06 Mar ’06
Perc
enta
ge
British ColumbiaInterior HealthFraser HealthVancouver Coastal HealthVancouver Island HealthNorthern Health
ActNowBC | Measuring Our Success 2�
Regardless of the method used, overall smoking rates in BC have been declining. Figure 12 presents the trends in smoking rates (occasional and daily) for the province as well as for each of the Health Regions between December, 2004 to March 200641. At the regional level, the proportion of smokers has generally been declining, while rates in the North have remained high.
Source: Summary of Smoking Rates for BC - March 2006. BC Stats, p.6.
Prevalence rates are calculated by BC Stats from the Community Health Education and Social Services (CHESS) Survey. CHESS survey data are collected monthly by BC Stats. Daily and occasional smokers are grouped together in the survey results as “current smokers”. Despite the name of the indicator, “tobacco use” only refers to cigarette smoking and ignores cigar smoking, chewing tobacco and pinch and snuff use.
Survey data are weighted to accurately reflect age and gender distribution within each health authority based on BC STATS population estimates.
41 CTUMS. (2003) http://www.hc-sc.gc.ca/hl-vs/tobac-tabac/research-recherche/stat/ctums-esutc/fs-if/2003/2003-smok-fum_e.html
Figure 12. Percent of British Columbia Population (Aged 15+) Who Are Current (Daily and Occassional Smokers)

Inputs Outputs Outcomes
What we invest What we do and who we reach
What results–Impacts of our
program or service
Resources (e.g. staff, funding) used to carry out activities, produce outputs and/or accomplish results
Direct products or services stemming from the activities of a policy, program or initiative, and delivered to a target group or population.
Examples include:
• Number and types of policies or resources created
• Number of participants involved
• Number and types of best-practice resources distributed
External results attributed to an organization, policy, program or initiative. Outcomes can be short term (impacts), medium term or long term.
Examples include:
• Change in participants knowledge, attitudes or practices/behav-iours
• Change in quality of environment that is conducive to healthy choices
• Change in prevalence rates of obesity
�0 ActNowBC | Measuring Our Success
Figure 13. Logic Model Planning Framework — General Concepts

ActNowBC | Measuring Our Success �1
Section 2 | ActNow BC Planning Models and Indicators
This section presents an overview of the importance of strategic planning and evaluation and how this will guide us in achieving the 2010 targets. A brief overview of the definitions to the components of the planning model will be provided. This will be followed by the overall ActNow BC planning model and the planning models for each of the four ActNow BC components:
• Healthy Eating
• Physical Activity
• Tobacco Control
• Healthy Choices in Pregnancy
Why monitor and evaluate?Evaluating ActNow BC serves many purposes – it not only provides a means by which stakeholders can assess whether services and programs have been imple-mented as planned (process evaluation), but also provides valuable information on the possible changes that may have occurred as a result of implementation (outcome evaluation) and whether resources were adequately allocated and utilized (accountability). Information gleaned from evaluation findings can be used to assist planners in identifying successful initiatives as well as areas that require improvement; and, justify continued or expanded funding for programs and services that are successful. Evidence of successful healthy living initiatives in one location provides opportunities to share and disseminate this information with other areas throughout the province (diffusion of innovation).
Over the next few years as the healthy living initiatives begin to take shape and are implemented it will be crucial that program planners have the appropriate tools and indicators to provide them with the ability to make appropriate and timely programmatic and policy decisions. The proposed framework provides a means by which progress of the ActNowBC goals and objectives can be monitored and achievement of these goals and objectives can be determined.
The ActNow BC Planning (Logic) ModelEvaluation is a comparison of objectives with achievements. Evaluations can assess both the process (what did we do, who did we reach, was our program implemented as planned?) and outcomes (what results or impacts did our program have?).
The logic model provides not only a useful tool for program planning, but also a comprehensive way to monitor the multiple components of an initiative and evaluate shorter and longer-term impacts (see Figure 13). Following are the more detailed topic model planning frameworks for ActNow BC and the planning frameworks for each of the ActNow BC component. After this, key ActNow BC indicators and performance indicators are presented.

Inputs Components Programs/Activities
Fiscal Resources
Material Resources
Human Resources
Partnering Resources
Tobacco Reduction Education and
Awareness
Programs and Services
Policies and Legislation
Knowledge Development and
Transfer
Physical Activity
Healthy Eating
Healthy Choices during
Pregnancy
Reach / Approach
· Population Health
· Multiple Settings (Schools, Worksites, Health Care Settings, Communities)
· Priority Populations
�2 ActNowBC | Measuring Our Success
ActNow BC Goal: BC is the healthiest jurisdiction ever to host the Olympic & Paralympic Games

Outputs
ActNow BC services and
programs:
· Volume (reach)
· Type (e.g. policy)
· Quality (e.g. satisfaction)
Short and Intermediate
Outcomes
Decreased Tobacco Use
Increased Physical Activity
Increased Fruit and Vegetable
Intake
Decreased Overweight and
Obesity
Longer Term Outcomes
Increased Life Expectancy
Improved Quality of Life
Decreased Low Birth Weight
Decreased Infant Mortality
FASD Prevention Plans and Increased
Counselling
Ultimate Outcomes
Improved Health
Decrease in preventable
health care costs
Context and External Factors
Monitoring, Surveillance and Evaluation
ActNowBC | Measuring Our Success ��

Inputs Components Programs/Activities
Fiscal Resources
Material Resources
Human Resources
Partnering Resources
Education and Awareness
Develop and implement
• audience specific materials
• communication strategies
• website• special events
Programs and Services
Policies and Legislation
Knowledge Development and Transfer
Reach / Approach
· Population Health
· Multiple Settings (Schools, Worksites, Health Care Settings, Communities)
· Priority Populations
Develop and implement
• resources/toolkits• workshops• strategies• training materials
• Share best practices
• Develop strategies for policy (municipal and public)
• Secure sustainable resources
• Develop standards
• Collect & analyze data
• Network and develop partnerships
• Develop indicators
�� ActNowBC | Measuring Our Success
Healthy Eating Component — ActNow BCVision: All British Columbians access healthy foods and eat well.
Target: To increase by 20% the proportion of the BC population (aged 12+) who eat the daily recommended level of fruit and vegetables by 2010

Outputs
# Calls to Dial-A-Dietitian
# Website hits – DAD ActNow/Making It Happen
# Resources distributed
Short and Intermediate
Outcomes
Inc. awareness of the benefits of healthy eating
Inc. awareness of opportunities/resources
Inc. skills in choosing healthy foods
Inc. supply of affordable fruits and vegetables
Inc. opportunities to purchase/grow and eat fruit and vegetables in schools workplaces and communities
Inc. healthy eating environments in early childhood, school and workplace settings
Inc. community food
Inc. best practice wt. mgt,
Inc. understanding of determinants of healthy eating
Inc. health/Agri-food partnerships
Longer Term Outcomes
Improved Healthy Eating
Knowledge, Attitudes and
Practices
Inc. Fruit and Vegetable
Consumption
Inc. Availability of Healthy Foods
Decrease in Overweight and
Obesity
Ultimate Outcomes
Optimal growth and
development
Decrease in premature
mortality and morbidity from major chronic
disease
Improved health and quality of
life
Decrease in Preventable
health care costs
Context and External Factors
Monitoring, Surveillance and Evaluation
# Participants in programs
# ActNow HE workshops
# ShapeDown programs
# School fruit & vegetable snack programs
# Health Check restaurants
# School/workplace policies
# Community food action networks/plans/policies
# Specialty food services
# Farm markets
# Surveys/Surveillance
# Partner Meetings
# Champion Organizations
# Reports /Publications
# Conferences/Presentations
ActNowBC | Measuring Our Success ��

Inputs Components Programs/Activities
Fiscal Resources
Material Resources
Human Resources
Partnering Resources
Education and Awareness
Develop and implement
• resources• audience specific
materials• communication
strategy • website• events (e.g. ActNow
BC day, MFHD, etc)
Programs and Services
Policies and Legislation
Knowledge Development and Transfer
Reach / Approach
· Population Health
· Multiple Settings (Schools, Worksites, Health Care Settings, Communities)
· Priority Populations
Develop and implement
• resources/toolkits• workshops• community grant • strategies (e.g low
income, older adults)• training materials
• Best practice sharing• Strategies for policy
(municipal and public)
• Urban planning (greenways, sidewalks)
• Sustainable resources• Develop standards• Collect & analyze
data• Network opports/
develop partnerships• Sustainable urban
planning
• Develop indicators
�� ActNowBC | Measuring Our Success
Physical Activity Component — ActNow BCVision: All British Columbians are physically active
Target: To increase by 20% the proportion of the BC population (aged 12+) who are physically active or moderately active during their leisure time by 2010

Outputs
# Materials disseminated (brochures, pamphlets, toolkits, brochures etc.)
# Website hits# Participants
reached# Events offered
Short and Intermediate
Outcomes
• Increased awareness of the benefits of PA
• Increased awareness of PA recommendations
• Awareness of PA opportunities/resources
• Improved attitude toward PA
• Increased PA levels
• Increased PA opportunities and access (AS! BC, ACs, 0-5 Physical Activity Family Resource, Healthy Schools)
• # Walkable/bikable communities
• # Opportunities to engage in PA
• Changes in community mobilization
• # Partnerships
Longer Term Outcomes
Inc. physical activity levels
Improved cardiovascular risk factors (BP,
BMI, cholesterol)
Inc. opportunities to
engage in PA
Decreased overweight and
obesity
Leverage partners for
sustainability
A culture of available and integrated PA
Ultimate Outcomes
Optimal growth and
development
Decreased premature
mortality and morbidity from major chronic
disease
Improved Health/ Quality
of Life
Decreased preventable
health care costs
Context and External Factors
# Resources/toolkits distributed
# Workshops delivered
# Grants administered
# Participants in programs and services
# Programs offered
# /km bike lanes
# /km trails
# Facilities/spaces
# Surveys/surveillance
# Meetings
# Partnerships
# Of knowledge exchange opportunities
(conferences)
Monitoring, Surveillance and Evaluation
ActNowBC | Measuring Our Success ��
Inputs Components Programs/Activities
Fiscal Resources
Material Resources
Human Resources
Partnering Resources
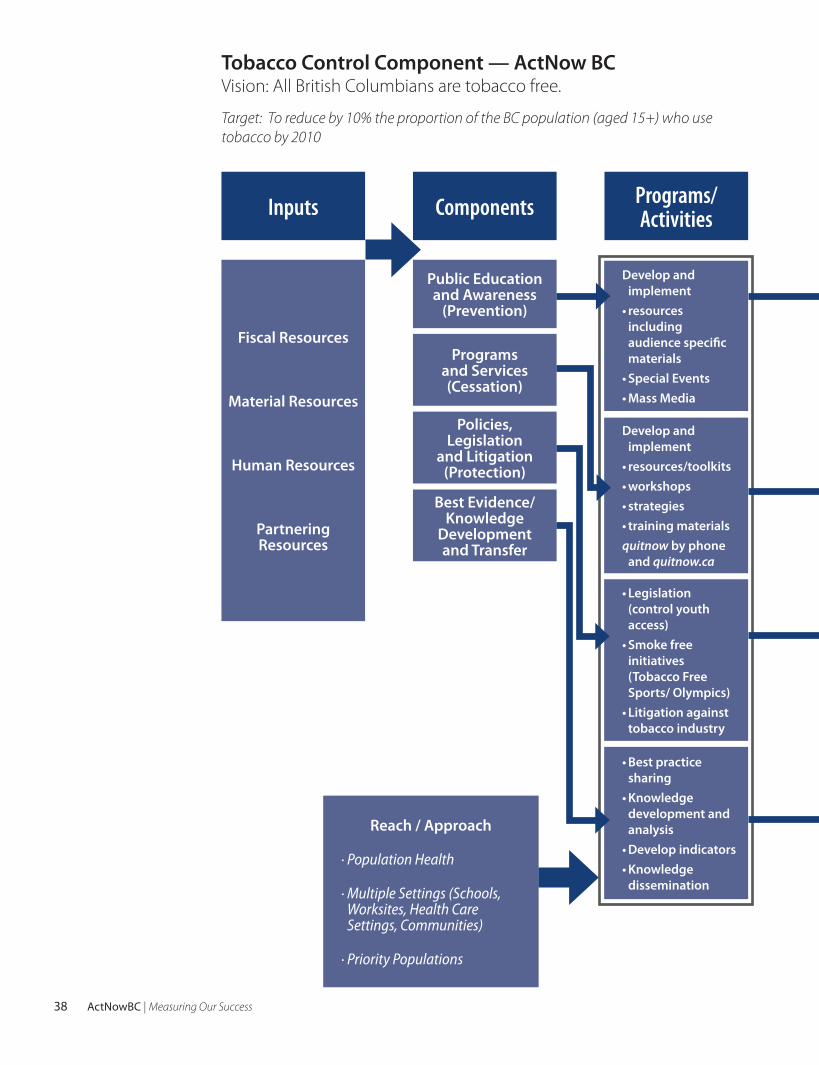
Public Education and Awareness
(Prevention)
Develop and implement
• resources including audience specific materials
• Special Events• Mass Media
Programs and Services (Cessation)
Policies, Legislation
and Litigation (Protection)
Best Evidence/ Knowledge
Development and Transfer
Reach / Approach
· Population Health
· Multiple Settings (Schools, Worksites, Health Care Settings, Communities)
· Priority Populations
Develop and implement
• resources/toolkits• workshops• strategies• training materialsquitnow by phone
and quitnow.ca
• Legislation (control youth access)
• Smoke free initiatives (Tobacco Free Sports/ Olympics)
• Litigation against tobacco industry
• Best practice sharing
• Knowledge development and analysis
• Develop indicators• Knowledge
dissemination
�� ActNowBC | Measuring Our Success
Tobacco Control Component — ActNow BCVision: All British Columbians are tobacco free.
Target: To reduce by 10% the proportion of the BC population (aged 15+) who use tobacco by 2010
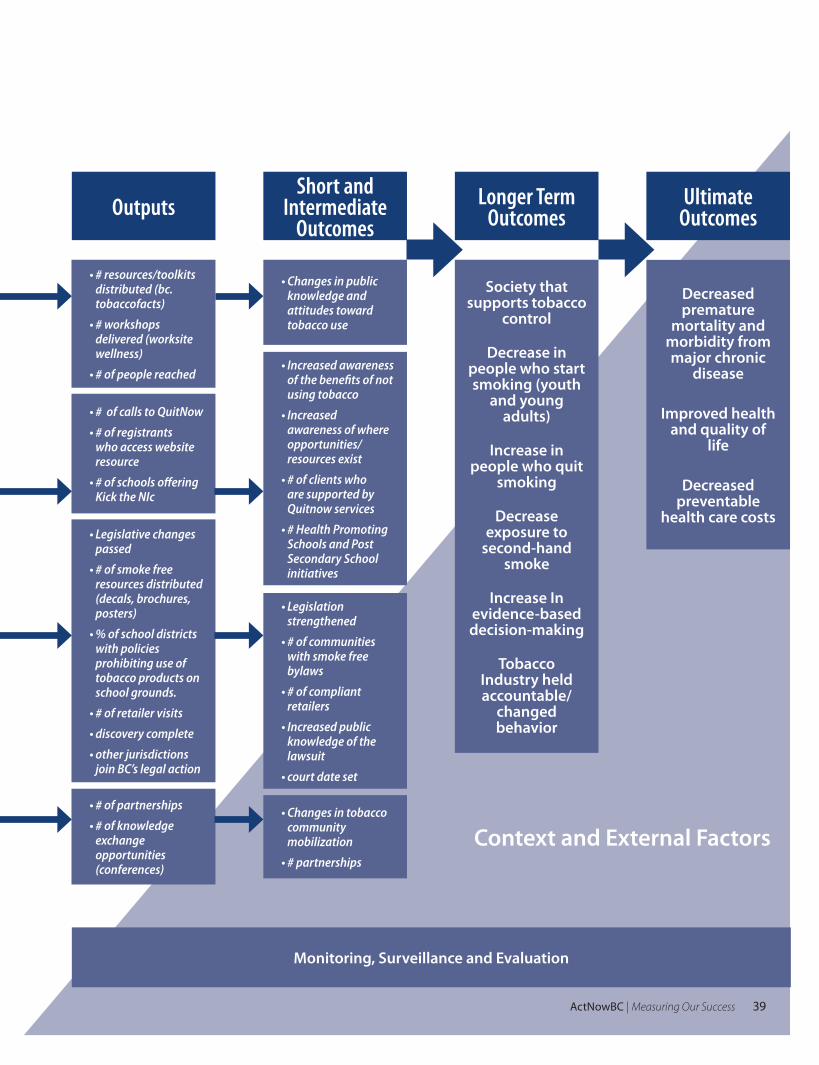
Outputs
• # resources/toolkits distributed (bc.tobaccofacts)
• # workshops delivered (worksite wellness)
• # of people reached
Short and Intermediate
Outcomes
• Changes in public knowledge and attitudes toward tobacco use
• Increased awareness of the benefits of not using tobacco
• Increased awareness of where opportunities/ resources exist
• # of clients who are supported by Quitnow services
• # Health Promoting Schools and Post Secondary School initiatives
• Legislation strengthened
• # of communities with smoke free bylaws
• # of compliant retailers
• Increased public knowledge of the lawsuit
• court date set
• Changes in tobacco community mobilization
• # partnerships
Longer Term Outcomes
Society that supports tobacco
control
Decrease in people who start smoking (youth
and young adults)
Increase in people who quit
smoking
Decrease exposure to
second-hand smoke
Increase In evidence-based decision-making
Tobacco Industry held accountable/
changed behavior
Ultimate Outcomes
Decreased premature
mortality and morbidity from major chronic
disease
Improved health and quality of
life
Decreased preventable
health care costs
Context and External Factors
• # of calls to QuitNow
• # of registrants who access website resource
• # of schools offering Kick the NIc
• Legislative changes passed
• # of smoke free resources distributed (decals, brochures, posters)
• % of school districts with policies prohibiting use of tobacco products on school grounds.
• # of retailer visits
• discovery complete
• other jurisdictions join BC’s legal action
• # of partnerships
• # of knowledge exchange opportunities (conferences)
Monitoring, Surveillance and Evaluation
ActNowBC | Measuring Our Success ��

Inputs Components Programs/Activities
Fiscal Resources
Material Resources
Human Resources
Partnering Resources
Knowledge development and transfer
Comprehensive education plan for care providers, including resource development.
Public awareness of healthy pregnancy
Healthy workplaces, breastfeeding support.
Enhanced perinatal capacity of BC NurseLine.
Enhancement of pregnancy support services.
Supporting HAs in development of comprehensive FASD prevention plans
Health promoting
policies
Prevention programs and
services
Public Education and Awareness
Reach / Approach
· Population Health
· Multiple Settings (Schools, Worksites, Health Care Settings, Communities)
· Priority Populations
ActNow BC Healthy Women in Pregnancy Logic ModelVision: All women in BC are supported in making healthy choices during pregnancy
�0 ActNowBC | Measuring Our Success

Outputs
Education resources: number and type of products.
Improved access to information: number of pregnant women receiving counselling.
Knowledgeable providers: number of sessions, number and type of attendees.
# of HAs supported in development of FASD prevention plans.
Each HA has completed FASD prevention plan.
Short and Intermediate
Outcomes
Women are provided with information on alcohol and pregnancy
Women who use tobacco and alcohol during pregnancy are offered screening, support and referral.
Health providers are knowledgeable and comfortable providing counselling on tobacco and alcohol use during pregnancy.
FASD prevention plans are completed and implementation underway in each HA.
Longer Term Outcomes
Women quit or reduce tobacco and/or alcohol
use during pregnancy.
Adequate range of
preconception, prenatal and postpartum services are available to
women.
Environment is supportive
of healthy pregnancy (including
physical, social, economic and policy
environments).
Decreased incidence of
FASD
Ultimate Outcomes
Improved maternal and
infant health and well-being
Context and External Factors
Monitoring, Surveillance and Evaluation
ActNowBC | Measuring Our Success �1

�2 ActNowBC | Measuring Our Success
Key ActNow BC IndicatorsFor purposes of developing a baseline by which to compare progress toward achieving the ActNow BC targets, a number of key indicators and corresponding performance measures were identified. Some of the measures will provide indications of how well initiatives are being implemented (outputs) while others will provide data on the changes that are occurring in the target population (outcomes) over time. The following tables provide a detailed list of the variables that will be monitored as the ActNow BC platform is implemented.
1. Physical ActivityComponent Area Indicators Performance measurePhysical ActivityTo increase by 20% the proportion of the B.C. population (aged 12+) who are physically active or moderately active during their leisure time from the current level (2003) of 58.1% to 69.7% of the B.C. population by 2010
% of BC population (age 12+) who are physically active or moderately active during their leisure time.
• CCHS - 2001 & every 2 yrs. afterward. Detail available summer of following year.
% of schools registered in AS!BC (Provincially by HSDA)
% of communities classified as Active Communities (by HSDA)
•
•
Action Schools website - reports monthly (provincial and by HSDA).
# of schools registered
# of workshops
# of student participants
BCRPA – monthly updates (provincial and by HSDA)
# of committees registered
# of grants provided
•
•
•
•
•
2. Overweight and ObesityComponent Area Indicators Performance measureOverweight/Obesity To reduce by 20% the proportion of the B.C. population (aged 18+) currently classified as overweight or obese from the current prevalence rate (2003) of 42.3% to 33.8% of the B.C. population by 2010.
% of BC population (age 18+) who are overweight or obese
• CCHS 1.1, 2.1, 3.1, (optional content provincial only)
# of clients and families receiving services at ShapeDownBC
Note: please refer to healthy eating and physical activity components for other indicators
• PHSA to report semi-annually on # of sites and number receiving services

ActNowBC | Measuring Our Success ��
3. Healthy EatingComponent Area Indicators Performance measureHealthy EatingTo increase by 20% the proportion of the B.C. population (aged 12+) who eat the daily recommended level of fruits and vegetables from the current level (2003) of 40.1 % to 48.1% of the population by 2010.
% of adult BC population (aged 12+) who eat 5+ servings of fruit and vegetables/day
• 1999 BCNS, CCHS 1.1, 2.1, 3.1, (optional content provincial only)
# of communities per region involved in food action networks (food security)
% of schools with food and nutrition policies)
# of school fruit and vegetable snack programs
# of call to Dial-A-Dietitian
•
•
•
•
PHSA- annually (May 2006) by HA
# of networks# of comm. Action plans# of healthy food policies (municipal and regional)
Survey by Min of Ed. Baseline done Spring 2005. Done periodically (possibly annually). Goal 90% by 2009
BC Agriculture in the Classroom. 10 pilot schools in 2005. Goal: all schools by 2010
# of calls determined semi-annually (Oct and May) by region.
•••
4.Tobacco ControlComponent Area Indicators Performance measureTobacco UseTo reduce by 10% the proportion of the BC population (aged 15+) that use tobacco from the current prevalence rate (2003) of 16.0% to 14.4% of the BC population by 2010. (Note: these rates apply to the BC population 15 years of age and older).
% of BC population (age 15+) who use tobacco products
• 1999 BCNS, CCHS 1.1, 2.1, 3.1, (optional content provincial only)
# of participants using QuitNow services - either quit line or web program
# of homes that are smoke free
# of people aware of Tobacco Free Sports
# of aboriginal communities that participate in Honour Your Health initiative
•
•
•
•
QuitNow by Phone: Clinidata - # of calls reported monthly - Provincial and HA
Interactive Cessation Website: BC Lung Assoc. - monthly reports. Provincial, HA and HSDA levels# of new registrants for access to website resource (personalized information)# of ongoing members who continue to access website resources
# of communities with 100% smoke free bylaws, # of communities with smoking bylaws
# of people 15+ years old exposed to tobacco smoke in the home
# of British Columbians 15+ who are aware of BC’s Tobacco Free Sports Program
# of Honour Your Health trainers# of community grants# of communities that participate

�� ActNowBC | Measuring Our Success
5. Healthy Choices In PregnancyComponent Area Indicators Performance measureHealthy Choices in Pregnancy
To increase by 50.0% the number of women counseled regarding alcohol use during pregnancy
By September 2006, for each health authority to have focused strategies for FASD prevention
•
•
% of health authorities that have completed comprehensive FASD prevention plans
• # of (1st) draft plans completed by March 2006
# of finalized plans completed by Sept. 2006.
# of service providers (by profession) providing services to pregnant women who receive training on counseling women about alcohol use during pregnancy
• Quarterly report (starting Fall, 2006) from PHSA on # of providers (Physicians, Midwives, Public Health Nurses, POPs and Addictions Counselors) who attend educational events by type of event. Number of practice guidelines disseminated to health professionals.
Quarterly report on BCRCP data on:# of pregnant women MD’s report they have counseled
•
changes in knowledge in general population and among pregnant women about alcohol use during pregnancy
• Knowledge levels of general population (including women who are pregnant) on the health risks associated with consuming alcohol during pregnancy (BC Stats, CCHS)

ActNowBC | Measuring Our Success ��
This section provides the baseline results by which progress will be determined as we move toward 2010. In some cases multiple measures (e.g. data have been collected on a monthly basis since program inception) already exist. For these indicators, an opportunity exists to assess whether progress is occurring and trajectories can be posited. For other areas, baseline information will not be avail-able till later in 2006. When this information becomes available, it will be added to the ongoing monitoring process and will be made available in a forthcoming document.
a. Physical ActivityActive CommunitiesThe Active Communities Initiative is part of a much larger wellness initiative being planned and supported by the Province to meet the 20% increase in physical activity levels of British Columbians by the year 2010. The BC Recreation and Parks Association is implementing the Initiative with support from the BC Ministry of Health and in partnership with ActNow BC and 2010 Legacies Now.
An Active Community is one that promotes and supports, through a coordinated strategy, a way of life in which physical activity is valued and integrated into daily life. The Active Communities Initiative will mobilize and support local governments and partner organizations to undertake actions that promote: healthy lifestyles; building healthy communities; and, increasing physical activity levels amongst British Columbians. This will be achieved by:
• Supporting communities to develop an Active Community plan
• Increasing local awareness of the benefits of regular physical activity
• Creating opportunities to increase participation levels by 20%
• Strengthening community partnerships
• Linking with other strategies under ActNow BC and 2010 Legacies Now
Progress of the Active Communities initiative will be monitored by collecting infor-mation on the number of registered communities. A community is not defined by geographical location – for example, a community can be a municipality, an aboriginal community, or a wellness coalition. Linkages and partnerships within geographical communities are encouraged, however, there may be more than one Active Community within a geographical boundary.
Figure 14 presents the number of registered Active Communities from the incep-tion of the initiative in late September 2005 to March 31, 2006.
Section 3 | Baseline information on outputs and outcome measures

�� ActNowBC | Measuring Our Success
Action Schools! BCAction Schools! BC promotes the creation of inclusive and diverse physical activity opportunities throughout the school day. Students, school staff, families and community practitioners can contribute to and benefit from balanced action plans that provide opportunities for children to be more physically active more often.
To help increase physical activity in schools, Action Schools! BC focuses on Six Action Zones:
School Environment – Action Schools! BC makes healthy choices the easy choices for schools by creating safe and inclusive environments, and supporting active living policy;
Scheduled Physical Education – Action Schools! BC supports the curriculum goal to deliver 150 minutes of scheduled physical education per week (IRP, 1995);
Classroom Action – Action Schools! BC provides creative, alternative classroom physical activity ideas that complement scheduled physical education and support the curriculum;
Family and Community– Action Schools! BC fosters the development of partnerships with families and community practitioners to benefit from the wealth of resources available to promote and encourage active living;
Extra-Curricular– Action Schools! BC balances classroom action and physical education with a variety of opportunities for students, school staff and families to be physically active before and after school, and during lunch and recess; and
School Spirit– Action Schools! BC cultivates school spirit by encouraging physi-cal activity and celebrating the benefits of active living for the whole school.
1.
2.
�.
�.
�.
�.
0
10
20
30
40
50
60
70
80
Oct 2005 Nov 2005 Dec 2005 Jan 2006 Feb 2006 Mar 2006
Num
ber
Figure 14. Number of Registered Active Communities
Source: Monthly statistics provided by BC Recreation and Parks Association. Information on current month located at: http://www.activecommunities.bc.ca/resources/HSDABreak-down.htm

ActNowBC | Measuring Our Success ��
There are four steps to becoming an Action School! BC: registering, which provides the school with access to resources and the assistance of the Action Schools! BC Support Team; bringing together an Action Team; developing a School Action Plan; and recording how the plan unfolds.
The following three figures present data between January 2004 and April 2006 on the increase in the number of schools that registered as Action Schools! BC, the number of students in those schools and the numbers of teachers, principals and other school personnel involved in Action Schools! BC initiatives. As of April 30, 2006 there were 2,653 classroom action bins distributed, 565 workshops delivered, 50 regional trainers in place and 98% of school districts that had at least one Action Schools! BC school in their district42.
0100
200300400500
600700800
9001000
Num
ber
Source: Monthly Status Reports provided by Action Schools! BC Support Team, Information on current month located at: http://www.actionschoolsbc.ca/Content/stats.asp
Figure 15. Number of Registered Action Schools! BC (January 2004 to April 2006)
42 Action Schools! BC, 2005-2006 Monthly Stats Overview, as of April 30, 2006

�� ActNowBC | Measuring Our Success
Num
ber o
f Stu
dent
s
0
20000
40000
60000
80000
100000
120000
140000
160000
180000
Figure 16. Number of Students in Schools Registered in Action Schools! BC
Source: Monthly Status Reports provided by Action Schools! BC Support Team, Information on current month located at: http://www.actionschoolsbc.ca/Content/stats.asp
0
1000
2000
3000
4000
5000
6000
7000
Num
bero
fSch
oolP
erso
nnel
Figure 17. Number of Teachers, Principals and Other School Personnel Involved in Action Schools! BC
Source: Monthly Status Reports provided by Action Schools! BC Support Team, Information on current month located at: http://www.actionschoolsbc.ca/Content/stats.asp

ActNowBC | Measuring Our Success ��
b. Healthy Eating Outputs and OutcomesDial-A-DietitianDial-A-Dietitian provides free nutrition information by phone and mail or internet website to British Columbians. Registered dietitians answer questions from the public, health educators and the media through a toll free number (1-800-667-3438) or provide nutrition information through a website at www.dialadietitian.org. By tallying the number of calls answered by Dial-A-Dietitian staff and the number of website pages viewed or visited, an indication of the public’s demand for nutrition information can be determined. From April to March, 2002-03, 2003-04 and 2004-05 the number of calls answered by Dial-A-Dietitian staff increased from 18,553, to 18,564 and 20,000 respectively. Between April 2003 and March 2004, there were 275,142 pages viewed on the Dial-A-Dietitian website. This increased to 284,332 pages being viewed between April 2004 and March 2005. Figure 18 presents the nutrition topics callers to Dial-A-Dietitian posed.
Dial-A-Dietitian Nutrition Topics (19,483) April 2004-March 2005
Child/Feeding, Pregnancy
15%
Food/ Nutrients/Labelling/ Preparation/Access/ Cost
7%
Diabetes, Cardiovascular17%
Arthritis, Gout, Allergy/Intolerances, Cancer, AIDS/HIV8%
Bone Health4%
Weight5%
Other10%
Nutrient Issues, Exercise/Sports, Vegetarian, Hypoglycemia14%
Food/Water Safety/Storage
8%
Digestive12%
Figure 18.
Source: http://www.dialadietitian.org/progrmas/2004-5%20Exec%20SummaryAnnualReport.pdf

�0 ActNowBC | Measuring Our Success
Food and Beverage Sales in BC SchoolsIn November 2005, the School Food Policies and Sales Report43, the Guidelines for Food and Beverage Sales in BC Schools, fact sheets and reference tools were released and posted on the Ministry of Education website for Healthy Schools. Of the 1,169 responding schools who participated in the School Food Policies and Sales Report survey, 654 (56%) reported having implemented policies or guidelines in at least one of the seven categories outlined in Table 10. A further 110 schools (9%) were in the process of developing guidelines/policies in at least one of these categories.44
Table 10. Proportion (%) of British Columbian Schools with Nutrition Policies/Guidelines
Categories of School Food Policies/Guidelines In placeUnder Development Neither
A. Types of food sold in school vending machines, cafeterias or school stores 20.3% 14.6% 65.1%
B. Types of food sold at school special events and field trips 10.6% 16.8% 72.6%
C. Fundraising by selling food outside the school 7.2% 8.5% 84.2%
D. Competitive pricing to promote healthy food choices 17.3% 12.6% 70.1%
E. Discouraging the use of food as a reward 12.7% 15.0% 72.3%
F. Limiting access to less nutritious foods during school hours 28.7% 13.8% 55.5%
G. Providing adequate time and pleasant spaces to eat 45.6% 8.5% 43.8%Source: School Food Sales and Policies Provincial Report, p.12, 2005, www.bced.gov.bc.ca/health/sales_report.pdf
At the time of reporting, 256 schools (25.2%) had a formal group with a central focus on nutrition in place (Table 11)45. As shown in the table, middle schools were most likely to have these groups. Percentages are based on the number of schools reporting.
Table 11. Number (N) and Proportion (%) of British Columbian Schools with a Formal Nutrition Group in Place by School Type
Elementary Middle Secondary TotalN % N % N % N %
184 24.7% 26 32.1% 46 24.1% 256 25.2%
Source: School Food Sales and Policies Provincial Report, p.11, 2005, www.bced.gov.bc.ca/health/sales_report.pdf
BC School Fruit and Vegetable Snack ProgramThis initiative is a partnership with Ministries of Health, Education and Agriculture and Lands and is delivered through BC Agriculture in the Classroom Foundation. School children in ten pilot elementary schools began in September 2005 receiving twice per week a free BC grown fruit or vegetable. As well, teachers, students and their families receive information on BC grown fruits and vegetables. These ten pilot schools represent 3300 elementary school children who receive approximately 6600 fruits and vegetables per week. An evaluation of this initiative will be completed by September 2006.
43 http://www.bced.gov.bc.ca/health/sales_report.pdf44 School Food Sales and Policies Provincial Report, p.12, 2005, www.bced.gov.bc.ca/health/sales_report.pdf45 School Food Sales and Policies Provincial Report, p.11, 2005, www.bced.gov.bc.ca/health/sales_report.pdf

ActNowBC | Measuring Our Success �1
Shapedown BCIn partnership with the Provincial Health Services Agency (PHSA), BC Children’s and Women’s Hospital, and the Child Health Services Network, this initiative provides assessment and treatment services for children and youth who are obese. By 2006, a prototype clinic was developed in Vancouver; plans are underway to expand the program to other areas of the province. The first report on the evaluation of this initiative is expected from PHSA in April 2007.
Community Food Action Initiative (CFAI)Health authorities received funding in June 2005 to support the implementation of integrated community food security plans to help improve long-term access to healthy foods for all members of the community, especially those living with low income. The PHSA is providing coordination for implementation and evaluation of the CFAI. As of April 30, 2006, sixty-three projects/communities have been funded under this initiative. Table 12 provides a detailed description of the type of grant funded by location (i.e. Health Authority).
Table 12. Community Food Action Initiative Reporting from Regional Health Authorities on Community Funding 2005/06
Regional Health Authority
Grants for Community Capacity
Building
Grants to develop Community Food
Action Plan
Grants to fund implementation
of Better Practices (Food Resources)
Grants to fund Implementation of a Community Food
Action PlanVIHA 10 7 4 1
VCHA 8
IHA 14
NHA 6
FHA 1 12
Total 31 15 16 1
c. Tobacco Control Outputs and OutcomesQuitNow QuitNow.ca is an internet-based cessation program managed by the BC Lung Association. From January to December 2005, 3,498 persons who smoke registered with QuitNow.ca – a monthly average of 291.5.
QuitNow by phone - A toll-free 24/7 intervention and counseling service available in 130 languages and with Telecommunications Device for the Deaf operated by Clinidata. The purpose of the service is to encourage and assist tobacco users to quit or reduce their use of tobacco products. From February 1 to December 31, 2005, 1,377 persons called QuitNow by phone, while 1,714 outbound calls were made by QuitNow by phone.

�2 ActNowBC | Measuring Our Success
Table 13. Registrations and Inbound Calls by Health Authority – January to December 2005
Sum of Health
Authorities
Interior Health
Authority
Fraser Health
Authority
Vancouver Coastal Health
Authority
Vancouver Island Health
Authority
Northern Health
Authority
Undefined Health
Authority
QuitNow registrations
3,498 786 984 758 700 250 20
QuitNow by phone
1,153 211 288 256 237 161
Source: QuitNow BCUndefined Health Authority is when it was not determined or it is unknown as to which health authority the registrant resides or caller is from.
Table 14 presents the percent of current smokers, age 15+, who stated either “QuitNow.ca” or “QuitNow by phone” when asked to provide three examples of resources or support that might help them to quit smoking. Percentages ranged from 0 to 6% for the former and 1 to 7% for the latter over the survey period.
Table 14. Top-of-Mind Cessation Resources, Current Smokers, Age 15+
Cessation ResourceJune-
05July-05 Aug-05
Sept-05
Oct-05 Nov-05 Dec-05 Jan-06 Feb-06 Mar-06
QuitNow.ca registrations 3% 2% 5% 3% 2% 0% 2% 3% 5% 6%
QuitNow by phone 2% 1% 4% 4% 7% 6% 6% 2% 2% 2%
Source: BC STATS, CHESS three (3) month average. Summary of Smoking Rates for BC - March 2006. p. 34.Question: When you think of resources or support that you might use to help you quit smoking, what is the first type of resource or support that comes to mind? And what comes to mind next? Third?
Approximately one in five British Columbia smokers reported that they were aware of QuitNow.ca, while approximately 12% were aware of QuitNow by phone.46
Table 15 Percent of Smokers Who Are Aware of QuitNow.ca or QuitNow by Phone by Province and Health Authority
British Columbia
Interior Health Authority
Fraser Health Authority
Vancouver Coastal Health
Authority
Vancouver Island Health
Authority
Northern Health
Authority
QuitNow.ca 20% 24% 20% 16% 19% 24%
QuitNow by phone
12% 16% 11% 9% 12% 18%
Source: BC STATS, CHESS twelve (12) month average, survey monthly April ’05 - Mar ’06. Summary of Smoking Rates for BC - March 2006. p. 37.Question: I am going to read you a list of resources used by smokers to quit. Could you please tell us which of the following resources you are aware of?
46 BC STATS, CHESS twelve (12) month average, surveyed monthly April ’05 - March ’06. Summary of Smoking Rates for BC March 2006, p.26

ActNowBC | Measuring Our Success ��
Municipal Smoking BylawsMost British Columbians agree or strongly agree that smoking in public places should not be tolerated (see Figure 19).
0
10
20
30
40
50
60
70
Jul ‘05 Aug ‘05 Sep ‘05 Oct ‘05 Nov ‘05 Dec ‘05 Jan ‘06 Feb ‘06 Mar ‘06
Agree Disagree
Age 15+ % Agree/Disagree - Smoking in public places should not be tolerated.
Figure 19. Attitudes Towards Smoking in Public Places.
Source: Summary of Smoking Rates for BC - March 2006. p. 34. BC Stats, CHESS Three month average - smokers and non-smokers
The purpose of smoke free bylaws is to protect people from known health hazards of exposure to second hand smoke. Three designations or standards exist for the extent of a bylaw:
Gold Standard: bylaws that prohibit smoking in all public places. There is no allowance for Designated Smoking Rooms (DSRs)
Silver Standard: bylaws that prohibit smoking in most public places, including restaurants. Smoking is permitted among bars, billiard halls, bingo halls, bowling alleys and casinos/slots. This exemption may or may not stipulate the need for a DSR or a Designated Smoking Area (DSA).
Bronze Standard: bylaws that prohibit smoking in most public places including restaurants. Two or more exemptions are permitted among bars, billiard halls, bingo halls, bowling alleys and casinos/slots. Bronze Standard exemptions may include DSRs and DSAs.
As of April 2006, five municipalities in BC were designated as achieving Gold Standard smoking bylaws, while eleven achieved Silver Standard bylaws, and no municipalities were found to have Bronze Standard bylaws47.
47 Compendium of 100% Smoke-free Municipal By-laws. Non-Smokers’ Rights Association. P. 5. http://66.51.169.163/cms/file/pdf/compendium_April_2006.pdf
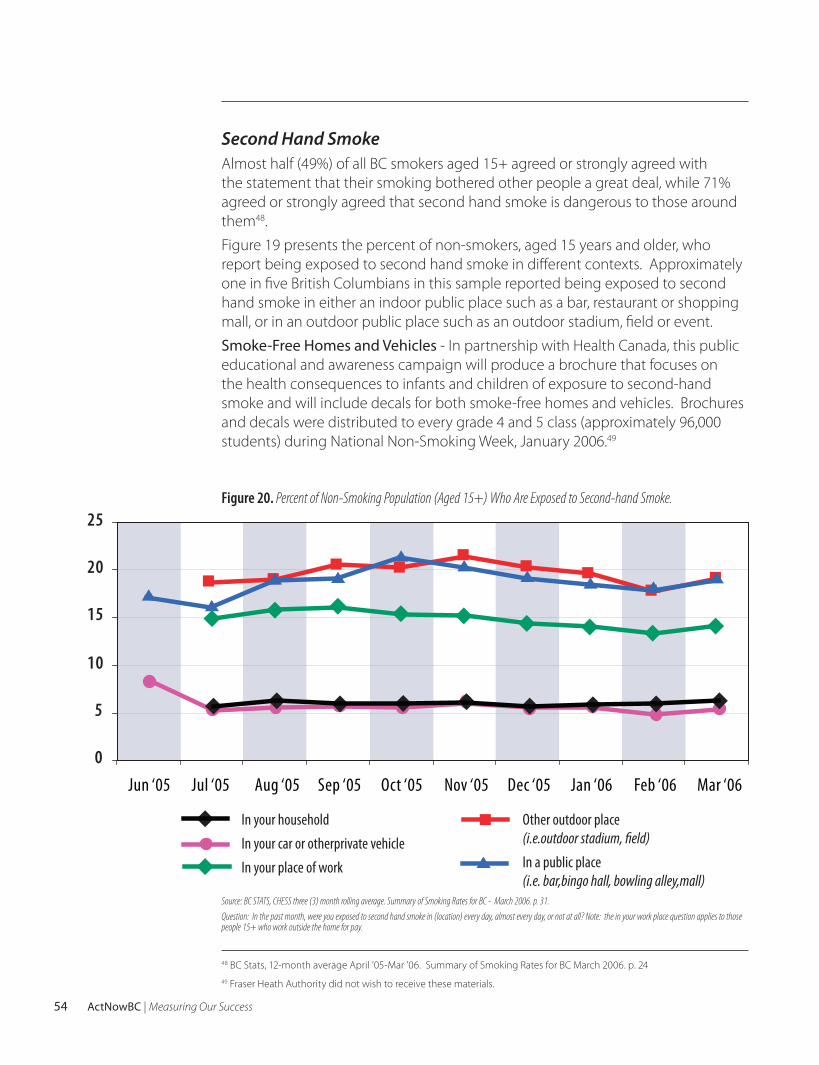
�� ActNowBC | Measuring Our Success
Second Hand SmokeAlmost half (49%) of all BC smokers aged 15+ agreed or strongly agreed with the statement that their smoking bothered other people a great deal, while 71% agreed or strongly agreed that second hand smoke is dangerous to those around them48.
Figure 19 presents the percent of non-smokers, aged 15 years and older, who report being exposed to second hand smoke in different contexts. Approximately one in five British Columbians in this sample reported being exposed to second hand smoke in either an indoor public place such as a bar, restaurant or shopping mall, or in an outdoor public place such as an outdoor stadium, field or event.
Smoke-Free Homes and Vehicles - In partnership with Health Canada, this public educational and awareness campaign will produce a brochure that focuses on the health consequences to infants and children of exposure to second-hand smoke and will include decals for both smoke-free homes and vehicles. Brochures and decals were distributed to every grade 4 and 5 class (approximately 96,000 students) during National Non-Smoking Week, January 2006.49
48 BC Stats, 12-month average April ’05-Mar ’06. Summary of Smoking Rates for BC March 2006. p. 2449 Fraser Heath Authority did not wish to receive these materials.
0
5
10
15
20
25
In your household
In your car or otherprivate vehicle
In your place of work
Other outdoor place(i.e.outdoor stadium, field)
In a public place(i.e. bar,bingo hall, bowling alley,mall)
Jul ‘05Jun ‘05 Aug ‘05 Sep ‘05 Oct ‘05 Nov ‘05 Dec ‘05 Jan ‘06 Feb ‘06 Mar ‘06
Figure 20. Percent of Non-Smoking Population (Aged 15+) Who Are Exposed to Second-hand Smoke.
Source: BC STATS, CHESS three (3) month rolling average. Summary of Smoking Rates for BC - March 2006. p. 31.Question: In the past month, were you exposed to second hand smoke in (location) every day, almost every day, or not at all? Note: the in your work place question applies to those people 15+ who work outside the home for pay.

ActNowBC | Measuring Our Success ��
Tobacco Free Sports ProgramThe Tobacco Free Sports Program provides support for tobacco-free athletes and sports environments and includes a toolkit for coaches, posters of high perfor-mance athletes endorsing a tobacco-free lifestyle, and funding for community education and policy work. Figure 21. presents the percent of British Columbians above 15 years of age who are aware of this initiative.
Jul ‘05 Aug ‘05 Sep ‘05 Oct ‘05 Nov ‘05 Dec ‘05 Jan ‘06 Feb ‘06 Mar ‘0602468
1012141618
Perc
ent
British Columbia
Interior Health
Fraser Health
Vancouver Coastal Health
Vancouver Island Health
Northern Health
Figure 21. Awareness of BC’s Tobacco Free Sports Program in Population (Aged 15+)
Source: Summary of Smoking Rates for BC - March 2006. p. 42. BC Stats. CHESS, Three (3) month rolling averageQuestion: There is a program in BC that provides anti-smoking resources and materials to sporting events. Have you seen or heard anything about BC’s tobacco free sports program?
Honour Your HealthHonour Your Health Challenge is a community-based program developed through the BC Aboriginal Tobacco Strategy that brings together best practices in health and the best Aboriginal traditions to promote the health and well-being of Aboriginal people, and to prevent and stop tobacco misuse. This program provides train-the-trainer training and grants, to help build capacity in Aboriginal communi-ties to raise awareness about health and tobacco misuse through community level health promotion events.
In 2005/2006 the Honour Your Health program included 100 communities from throughout BC. One hundred and forty three front line workers participated in a training event in October 2005. In November/December 2005, 71 community service grants were awarded. From January to March 2006, 86 communities participated in the 2006 Honour Your Health Challenge (71 with assistance from provincial grants and 15 through their own financial sources).

�� ActNowBC | Measuring Our Success
d. Healthy Choices In Pregnancy Outputs and OutcomesHealth Authority FASD Prevention PlansBy September 2006, all health authorities are expected to have focused plans for FASD prevention. As of May 2006, most health authorities had begun the planning process, varying from community round table forums, to active, stakeholder com-mittees through to draft logic models and draft program plans. It is encouraging that all the regions that have provided feedback, have incorporated relevant community partners into their planning process. It is anticipated that all regions will have completed plans in place by year-end.
Service Provider Awareness and EducationThe Provincial Health Services Authority has engaged in partnerships with the Ministry of Children and Family Development, Public Health Agency of Canada, BC Association of Pregnancy Outreach Programs, BC Centre of Excellence for Women’s Health, and the health authorities in the development a Provincial education plan addressing best practices for counseling women on the use of alcohol in pregnancy. The education delivery plan will target perinatal service providers including: physi-cians, midwives, addiction workers, public health nurses, and pregnancy outreach program staff. As of May 2006, an in-service training session has been provided for Pregnancy Outreach Program staff and another is planned for the end of May 2006. PHSA will be providing its first quarterly report in Fall 2006 on the numbers of service providers reached through education events and the types of events that occurred.
Knowledge of the Risks Associated With the Use of Alcohol in PregnancyThe Provincial Health Services Authority in collaboration with the Ministry of Children and Family Development, Public Health Agency of Canada, BC Association of Pregnancy Outreach Programs, BC Centre of Excellence for Women’s Health, and the health authorities is developing evidence-based resources and materials for women, their families, and the community that inform them of the harm of using alcohol in pregnancy. The British Columbia Reproductive Care Program (BCRCP) has produced and distributed to all physicians, midwives and other service providers, the “Guidelines for Alcohol Use in the Perinatal Period and Fetal Alcohol Spectrum Disorder”. These guidelines will be available at all forthcoming education events. Other products such as an instructional DVD, website article and poster campaign are in development. PHSA will be providing in Fall 2006 its first quarterly report on the numbers of products produced and the types of products.
To estimate the percentage of antenatal records that have documentation of alcohol being discussed with pregnant women by physicians and midwives a sample chart review will be completed in the Fall of 2006. This will consist of random selection of 385 charts from each HA and will form the baseline from which a determination can be made as to whether a 50% increase in the number of women counseled re: alcohol in pregnancy has occurred.

ActNowBC | Measuring Our Success ��
As ActNow BC initiatives, programs and services are planned, pilot-tested, implemented and evaluated it will become exceedingly important to monitor the impacts these activities have on the overall health status of British Columbians. Measuring Our Success: Baseline Document is intended as a beginning - a founda-tional document that is the first in a series of reports that visually present the status of British Columbians in relation to the key 2010 targets. The data contained within Measuring Our Success provides a baseline by which information in subsequent reports can be compared, progress can be noted and gaps can be identified.
A number of observations can be made from this baseline report:
• Chronic diseases are among the most prevalent and costly health issues in British Columbia.
. In 2003, approximately 42% of British Columbians (aged 18+) were overweight or obese and only 58% of British Columbians (aged 12+) were physically or moderately active;
. In 2005, 15% of British Columbians (aged 15+) continued to use tobacco; and
. In 2001, approximately one in ten pregnant Canadian women drank alcohol while pregnant .
• Most British Columbians (aged 12+) do not eat the daily recommended levels of fruits and vegetables. While variations occur throughout the province, in no HSDA is the percentage of the population who consume 5+ servings of fruits and vegetables daily above 50% .
• The ActNow BC planning models provide not only a useful tool for program planning, but also a comprehensive way to monitor the components of the multiple initiatives that make up the ActNow BC platform and evaluate their shorter and longer-term impacts.
The information contained in this report is intended as a guide for program planners and decision makers, both within and external to government. Future documents will include results on the outputs that are produced, in terms of the volume (reach), type (e.g. policy) and quality (e.g. satisfaction) as well as the short and intermediate outcomes. Whenever possible comparisons will be presented at a provincial, health region and Health Service Delivery Area level. By monitoring our progress toward achieving the ActNow BC targets, the impacts of our programs and services can be maximized and the improved health and well-being of all British Columbians can be realized.
Section 4 | Next Steps

�� ActNowBC | Measuring Our Success
Notes

