measuring patent intensity - universiteit...
TRANSCRIPT

Measuring patent intensity A Bachelor of Science thesis for the Business Administration programme
Written by Supervisors T.M. Bergers Dr. A.H. van Reekum
S0157619 Dr. R. Harms
August 28th, 2012

Bachelor thesis Tim Bergers
II | P a g e
Preface The bachelor thesis that lies here before you is the result of more than 4 months of research, reading, testing, guidance, discussing and motivation. I became interested in this research topic through the course intellectual property management within the minor Entrepreneurship, when near the end of this course it was mentioned that Dr. van Reekum was in search for motivated students to do research, I sent him an email as quick as possible. The last of the words I summarized in the beginning has been most important and covers all the others, just as most students during the period of their bachelor thesis, I had difficulties with the freedom found in the process. However motivation came from all angles.
First of all, I would like to thank my parents for helping whenever I was on a tight deadline, either food was brought to me, or invitation was sent covering the time I was expected and the meal that would be served.
Second, friends and family heard of my wish to go to Sweden. They took every chance to remind me that my bachelor thesis should be finished on time to fulfill this wish. I would like to thank three friends in particular that kept me on track during the process, thank you Kirsten van der Reest for the constant checks on my progress at Stress, thank you Danny Kappen for the Skype conversations and guidance when needed, and thank you Sean Straatman for getting me through the statistical part of my research and setting me back on track when stuck in a dead end. I learned that distance is of no Importance when having good friends and an internet connection.
Third and very important to keeping the process going, was the guidance and feedback I received from Dr. Rik van Reekum. Although always motivating, he made it clear that to reach my goal, I would have to work hard. When I didn´t make as much progress as wanted, or after a long period of radio silence from my end, I would get to hear it. When however I found the motivation, time was made to help me in the process.
Last but not least, Dr. Rainer Harms made it possible to keep the very tight schedule by fulfilling the position of a secondary supervisor, using his perspective to approach my paper from another angle.

Bachelor thesis Tim Bergers
III | P a g e
Management Summary It has been acknowledged that the use of strategic choices in patenting becomes more and more useful when it comes to gaining a competitive advantage. However to be able to make strategic choices, it is helpful to know which risk is accompanied with a certain choice. In this research an attempt has been made to develop an instrument capable of defining the patent intensity within industries, which gives an indication of the risk of exploiting a patented technology. In this attempt more than ninety papers were read, four concordance tables tested and days were spent on assessing the available databases.
As a result the amount of patents ‘ceased’, ‘revoked’, ‘appeals’, ‘license of right’ and ‘granted’ were determined as to possible correlate with the risk of litigation and thus give a view on the patent intensity within an industry. When following the natural order of occurrence within the process of patenting a flowchart can be formed as shown in appendix 5.1.
Assessing the available data found for 119 four digit IPC subclasses through regression analyses show the correlations within this flowchart, making it possible to create a general regression equation which can be used for a comparison within industries. Results for this comparison could be used to assess the patent intensity, and with it the risk within an industry and use this to make strategic choices.
As a result of statistical analyses some of the initially found indicators were dropped. The values that were found within an IPC subclass covering the granted patents in combination with the amount of patent appeals and patents revoked, were used as indicators and have been analyzed through statistical assessment to create an equation capable of indicating the amount of patents being revoked when a certain amount of appeals and grants have been measured. This can then be used to measure the difference in predicted versus actual revoked patents to indicate a higher or lower risk than the mean risk. According to this difference in risk, strategic choices can then be made on changes in attitude or approach.

Bachelor thesis Tim Bergers
IV | P a g e
Table of Contents Measuring patent intensity .................................................................................................................... I
Preface ..................................................................................................................................................... II
Management Summary .......................................................................................................................... III
Table of Contents ................................................................................................................................... IV
1 Introduction ..................................................................................................................................... 1
1.1 The competitive climate .......................................................................................................... 2
1.2 History and use of patenting ................................................................................................... 4
1.3 Defining the problem .............................................................................................................. 6
2 Literature Review ............................................................................................................................ 8
2.1 Risks and strategic uses of patents ......................................................................................... 8
2.2 Classification systems ............................................................................................................ 15
2.3 Conceptual model ................................................................................................................. 18
3 Methodology ................................................................................................................................. 21
3.1 Design Research Literature ................................................................................................... 21
3.2 Operationalization ................................................................................................................. 22
3.3 Statistics................................................................................................................................. 23
3.4 Evaluation .............................................................................................................................. 26
4 Discussion ...................................................................................................................................... 28
4.1 Theoretical contribution ........................................................................................................ 28
4.2 Limitations ............................................................................................................................. 29
4.3 Future Research..................................................................................................................... 29
5 Appendix ........................................................................................................................................ 31
5.1 “Patent Management Maturity” Model ................................................................................ 31
5.2 Technology Maturity Life Cycle ............................................................................................. 32
5.3 Patent life Cycle Model ......................................................................................................... 32
5.4 Raw Data ............................................................................................................................... 33
5.5 Stepwise regression analyses output .................................................................................... 36
5.6 scatterplot with outliers ........................................................................................................ 38
6 Bibliography ................................................................................................................................... 39
1 | P a g e
1 Introduction During the course Intellectual Property Management, I was confronted with the “Patent Management Maturity” model formulated by Dr. A.H. van Reekum(appendix 5.1). Although providing an adequate instrument to assign an attitude to an organization based on its actions on eight fields, there was no way of telling if this was a correct attitude for that organization. During the course this was not yet noted as a problem, but led to the question if the chosen attitude by the case company would suffice in the environment that the organization was operating in.
In many organizations success is largely dependent on the use of technology. For example: advances made in this field of technology might enhance the profits made by such an organization, while organizations that fail to take notice of these advancements may fall behind. However, the invention or adaptation of new technologies is not enough on its own. As can be seen in the research of Teece (1986) many organizations were not able to profit from their inventions, and were sometimes even pushed out of the market by competitors that did. This shows the importance of monitoring and protecting new inventions within a field of technology. As one might have already thought, the use of patents differs per industry and field of technology (Orsenigo and Sterzi 2010).
The goal of this research paper will be to successfully form an instrument to classify industries and/or fields of technologies based on patent intensity, thus giving a way of rating the minimum attitude needed within an industry. This will be done by studying theories known to science based on industry classifications and the use and effects of patents. Based on a quick scan, attempts have been made to determine risk factors in Intellectual Property infringement, but there is not yet a way to successfully rate patent intensity within industries (Berger, Blind et al. 2012). Means will have to be found to do this. Since this research is focused at the development of a model capable of measuring patent intensity within industries, it can be qualified as a design studies research (further elaborated in the methodology).

2 | P a g e
1.1 The competitive climate
Figure 1 'The competitive climate'1
To comprehend how an organization makes its choices, it is important to know which forces are affecting the management, either directly or through its surroundings. Figure 1 shows some sort of onion like layer structure where several layers can be found around the organization. Starting from the outer ring, on a macro level, several forces can be deducted. These forces can be determined using the PEST model (Grundy 2006), where the four letters stand for Political, Economic, Social and Technological forces. As said these forces within the macro level affect a layer below: The meso level where the growth forces, opportunities and threats within an industry, economic sector or field of technology are defined. This layer will then affect the micro level, where the organization will experience certain forces affecting their choices. The reason I chose the image above to display how the surroundings are structured, is to show the different forces within the layers that an organization could be subjected to and to show how much pressure is being conveyed from the layers above, thus give an indication about the competitive climate within the Meso and Macro level above. Using the “Five Forces Model” created by Michael E. Porter(1979), mostly used for assessing the attractiveness of an industry, in the discussion I will argument the use of the instrument developed in my research paper in combination with Porter’s five forces model. First I will briefly explain its importance for my research.
Technological innovation can be protected in several ways, one being by patents. As can be seen through the previously used PEST model, one of the forces within the Macro level is technology. Like
1 This figure can be found in the paper of Grundy, T. (2006). "Rethinking and reinventing Michael Porter’s five forces model." Strategic Change 15: 213-229.

3 | P a g e
all other forces this one differs per industry, economic sector and field of technology, however the changes within this force are very dependent on research and development being done within the individual organizations. A new technology being developed, could restructure the technology forces affecting the Meso level surrounding the organizations, thus changing the growth forces and choices that have to be made within the Micro level to cope with these changes.
However, how to cope with these changes is dependent on how the initiating actor protected their new technology.
Figure 2 "Porters five forces model"2
As discussed above, the five forces model is usually used to determine the attractiveness of an industry, however it can also be used to judge what effects a technology advance can have on an organization. Lundsager (Bittner and Lundsager)3 gives some short examples of the uses of IP within the five forces model. For example if we take a look at a few of the five forces through the eye of competitiveness and protection, we see the use of the IPC, through this categorization it can be checked if substitutes might come to the market. Competitiveness mostly takes place on either price differentiation or product differentiation, certain aspects of product differentiation can be protected through patents, and thus provide an advantage to the owner. Potential entrants will also have difficulty to enter a market that is largely protected by patents.
In my attempt to measure patent intensity as a method of risk assessment, I will keep the workings of the five forces model in mind, as it shows a method of assessing the risk involved in operating within a certain environment to determine its profitability and take precautions. First however we 2 Ibid. 3 No publication date could be found, but a direct link to the online document is provided in the table of authorities.
4 | P a g e
will take a short look at the most important aspect of patent intensity: patenting.
1.2 History and use of patenting
To explain how a patent works, it might be interesting to look at one of the earlier documentations of a similar right. The need for protection of intellectual property, the fruits of research as one might say, can be tracked back to 1559. At this time in a petition of Jacobus Acontius he requested a monopoly for the use of various machines invented by him to Elizabeth I: “Nothing is more honest than that those who by searching have found out things useful to the public should have some fruit of their rights and labors, as meanwhile they abandon all other modes of gain, are at much expense in experiments, and often sustain much loss, as has happened to me. I have discovered most useful things, new kinds of wheel machines, and of furnaces for dyers and brewers, which when known will be used without my consent, except there be a penalty, and I, poor with expenses and labor, shall have no returns. Therefore I beg a prohibition against using any wheel machines, either for grinding or bruising or any furnaces like mine, without my consent.” ; “it is right that inventors should be rewarded and protected against others making profit out of their discoveries.” (Phillips 1982)4. In Italy the home turf of Jacobus Acontius, trade monopolies were more common, but now also made their entrance in England. A list can be found5 of the manufactures monopolized by the grants handed out by Elizabeth I. The most important difference with the modern day patents is probably that there were also grants for imported products, the term invention was not only used for the origination of the invention in the inventors mind, but was also used to describe the discovery of arts and goods from outside the realm.
That Acontius could have been involved in the establishment of modern day patents can be seen in the way patents are explained in modern literature. A commonly used way to explain the use of patents to those seeking for explanation is: “A patent conveys to the owner the right to prevent others from making, using, selling, offering for sale, or importing the patented invention.” (Lerner 2011)6. In the EU the following demands are made to make something patentable: The invention should be novel, nonobvious and useful (Lerner 2011). This motivation concerns the protection of sunk assets and future profits for an organization and operates on a micro level, accounting for the rivalry or substitute forces at the micro level. However, when a patent application is filed, this has to be done while thoroughly showing what the invention is about. After all, patents were introduced not only to protect the patent holder from losing the patented invention to others, but also to give others insight in what the patent was covering, thus maybe creating a base for a follow up research. This enables progress to be made much quicker than when all research and progress would be kept secret.
Orsenigo and Sterzi (2010) state three functions of patents within the market they have an effect on. “Patents are a tool for protecting innovation7 from imitation, thereby providing supra-normal profits and thus incentives to costly innovative activities which would not otherwise
4 Page 71. 5 In the complete document provided by Philips. 6 Page 2. 7 This is a direct quote, I would prefer the use of the word invention, since these are patentable and innovation is not.

5 | P a g e
have been undertaken, absent the ability to privately appropriate the economic benefits stemming from innovation5” (Orsenigo & Sterzi,2010), Thus showing that without this “supra-normal” motivation to do research, much less innovation and research would take place. “Patents play also a fundamental role in disclosing information about innovations which might have been otherwise kept secret, thereby fostering further technological progress” (Orsenigo and Sterzi 2010)) and ”patents support the development of markets for technologies and encourage the development and commercialization of inventions: the establishment of property rights on research outcomes facilitates the economic exploitation of such knowledge (in the absence of patents, firms would not invest in R&D based on new discoveries because anyone could have access to them) and it may allow for an “ordered” path of exploitation of such knowledge, avoiding the wasteful duplication of efforts” (Orsenigo and Sterzi 2010). These three functions show that although patents seem only to be made to protect inventions from being copied, they actually motivate new research to surpass the present standards. Knowing this, monitoring the use of patents on a meso level should be even more important to an organization, not only to ensure protection of its own inventions, but also to see what is going on in its environment, and which technology might be on the brink of becoming obsolete, or on the opposite, might become a rising star.
As any product, the life of a patent is comparable with the well know product life cycle, a similar cycle named the technology maturity life cycle is added in the appendix (5.2). Based on this system there are seven life stages for a technology. As can be seen in the periods marked above the graph, we start off with the conceptual, basic and applied research, were no incomes can be generated with the invention and only investments are made, halfway during the applied research the development process is done and the invention itself takes form while investments lower. A market introduction can be started. If everything goes according to plan the sales are now starting to set off, making that actual income is generated during the operational introduction and growth stage, the investment will now be starting to pay off. During the maturity stage the optimum in the life of the invention is reached, and the breakeven point will be passed. All following incomes can be seen as profits on the investment (there will still be costs to make sales, services and production of the invention possible). From here on the use of the invention will slowly deteriorate until it’s “death” can be noticed, and all incomes stop. Five phases are paralleling the previous seven, during the research stage the conceptual and definition stage are taking place until revenues start to arise. Then the production and operational stage kick in to form the actual stage where investments start to pay back, ending in the disinvestment when the actual profit on investment is made, but this also brings the life of the patent to its end.
Based on the 5 stage patent life cycle; Bader, Gassman, Zoegler and Ruether (2012) formed a five phase model to make optimal use of the life cycle stages. Explore, generate, protect, optimize and decline are used here in a more practical manual on how to behave and what to do during these five stages. Although the use of this model for this specific paper is limited, it shows how strategic use can be made of these phases(appendix 5.3).

6 | P a g e
1.3 Defining the problem I already pointed out the forces affecting an organization through the different layers of their environment, and the strategic choices that can be made during the life cycle of a patent. We are not yet able to define the variables that are important to our instrument, however we should be able to generate some general thoughts to know what to look for in our literature research. To understand how different variables interact, I will shortly describe the causal relations. If we take a look at the problem described in the introduction, we notice that it is questioned if the chosen attitude would suffice within the corresponding industry. This assumes that there are wrong choices that can be made when it comes to choosing an attitude within an industry.
When looking at the relations within this assumption, it seems as if the choice is explaining the amount of success within a certain industry. This would lead us to the thought that choice is the independent variable affecting the dependent variable risk. The following model would show the relation:
R XA O Where R is a randomly chosen organization, XA is the chosen attitude, and O is the amount of risk. However according to my experience and a quick scan in literature (Orsenigo and Sterzi 2010), it seems as if the attitudes towards the use of patents differs greatly between industries. An attitude that might suffice in one industry might not in another. This leads us to the thought that there seems to be an extra independent variable affecting the causal relation.
R XA1B1 O Where R is a randomly chosen organization, XA1B1 is a certain choice of attitude within a certain industry, and O is the amount of risk.
This leads us to the assumption that there is a relation between the patent intensity, choice of attitude and the resulting risk. The intention of this research is to create an instrument capable of measuring patent intensity and thereby creating a predictive method of measuring the risk within an industry. This leads my research to a more design focused one working towards a predictive instrument, which will need a different approach than other forms of research (Switzer, Wiesniewski et al. 1999). Although I am not making use of a hypothesis, I do have variables interacting with each other, which relations are deemed important to my instrument. Since we are already able to analyze the “attitude towards IP” through the model of van Reekum, I will focus my research on the measurement of “patent intensity” on a certain aggregated level to predict the supposed risk involved in operating there.
I will have to limit the search for data to a certain aggregation level to predict patent intensity, this will have to be done within literature as well. This leads me to the first requirement for defining an

7 | P a g e
instrument:
-Find an appropriate aggregation level and method of classification to measure and predict patent intensity. My other requirement is focused more towards the actual use of patents, and the effects of this use. To measure the construct “patent intensity” I must analyze what variables are important within the construct and what its effects are within industries. The following requirement can thus be defined as: -Find a way to measure “patent intensity”. If these two requirements have been met, I should at one point be able to use them to create an instrument capable of measuring “patent intensity” within a certain aggregation level using a certain method of classification.

8 | P a g e
2 Literature Review Barab & Squire (2009) indicate the importance of understanding the design in practice, to do this we must analyze which motivations are affecting the use of patents and the effects they have in the databases available to me. I will use available literature to determine which results within the databases could be contributed to the patent intensity within an industry. Briefly the history and general use were described in the introduction, I will now take a closer look at the alternative factors that may affect the use of patents and their effects. Also I will take a look at the different forms of classification, and forms of concordance useful to a later application within the instrument.
2.1 Risks and strategic uses of patents I already described the most common uses of patents, and may have shown some risks. However to create an instrument capable of measuring patent intensity, I will have to point out all the factors affecting patenting, and the effects involved. Also I will describe the other effects and uses of patents to make it possible to analyze their use for measuring patent intensity. Blind, Edler et al. (2006) used research done by some of the main authors within this field of research to create a factor analysis that could identify the main motivations within organization patenting. I will briefly elaborate on these motivations and use them to explain the effects that can be found within patent databases, and indicate the risks they form to a competing patent holder covering technology in that field.
2.1.1 Protective motives The protective motive is addressed as the main motivator for patenting and is directly related to the main objective of a patent, protecting the invention from imitation and safeguarding sunk costs and possible profits as described by several authors (Blind, Edler et al. 2006; Orsenigo and Sterzi 2010). Some people refer to patents as a minefield, you may be aware of the inventions you patented, but are you aware if you are infringing patents yourself?8 If you want to be one step ahead of stepping on such a mine, a freedom to operate check can be performed. When this has been done, you could in theory start to exploit your patent or invention without risking infringing anyone’s owned technology. If the freedom to operate check brings up possible infringement cases, the choice can be made to either abandon the use of the invention or get in to contact with the patent holders to arrange a license of right. However it could be possible that either you or another organization (un)willingly infringe a patent. This is where the litigation starts to play its role. Based on the paper of Zeebroeck and Graham (2011)there are basically three types litigation cases.
Type I, “Infringement” organizations monitoring their patents will start an infringement case when they feel their Intellectual Property Rights are being harmed. Mainly the organization will accuse another organization of this in the hope that they willingly pay royalty fees, before the actual litigation takes place (normally both organizations will try to avoid to go to court, since this is very
8 The sheer size of the minefield can be found through the use of the standard online patent registers such as https://register.epo.org/espacenet/advancedSearch?lng=en#, simply fill in the IPC-Subclass in the appointed field and the amount of hits shows the amount of patents granted within the field.

9 | P a g e
costly). This type of litigation is deemed to be a risk when owning a patent, the cost of defending the patent has to be compared to the value of exclusive use for the patent holder.
Type II, “patent nullification” If it is perceived that a patent is awarded to a company while it is not fulfilling the claims set to a patent grant (novel, nonobvious and useful) a lawsuit can be filed to invalidate the patent. In theory the same effect could be reached through filing an appeal with the patent office within a certain period after the grant9.
Type III, “infringement” so “Nullify the patent” if the patent is found invalid, there is no basis for a lawsuit to enforce an injunction or the payment of royalties. As a patent holder, there is always a risk that the patent is invalidated. Starting an infringement case will cause the defendant to search for the weak spots in the infringement claim, maybe even causing them to fight the patent claim itself. However the accusation that a patent is invalid will have to be proven as well, and could possibly cause a disruption in the power balance of an industry. For an example of this fragile power balance I would like to refer to the case of C.K. Claridge, Inc. (Hammond 2010) In this case an organization is accused of infringement and has the (financial) choice to either try to nullify the patent, or to keep the patent intact and pay the royalties. The choice seems simple at first, no patent would mean no payments of royalties, but all other organizations in the market that were paying royalties would be free from their licensing contract as well. Although the own costs are kept lower through nullification, the costs of the competitors in the market might lower, maybe even causing a price drop of the afflicted product, thus lowering the income as well.
An injunction based on infringement is not as easily declared as one might think, in the case of Blackberry the US government chose not to stop Blackberry from selling and producing the infringing technology. This although the invention used in this technology was patented by another organization. The reason for this was that the initial impact of the injunction might damage society, while the patent owner was in itself not a practicing entity. In the Tessera case, multiple Non-practicing vs. Practicing entities cases were shown in which the practicing organization prevailed over their opponent, based on the fact that they were not directly harming the sales of these organizations (Shih 2010).
Measuring this motive could be done by measuring the amount of patents applied for within a sector, in combination with the amount of “type I” litigation cases within that same sector10. By measuring these two effects of protection, the intensity of this motivator could be made visible. Databases on the amount of patents per sector can be easily found using the information provided by the World Intellectual Property Organization, or on a smaller scale the European Patent Office. However databases covering this information8 are mostly owned by private companies, which means that costs will have to be made to make use of these databases. It should be taken into account that not all protective actions will end in a litigation case, most of them will be settled to save costs that would occur when a lawsuit would be filed. Due to the absence of a free database on patent
9 I will come back on the possibility and effects of filing an appeal, it has to be done within nine months after the grant of a patent as stated in article 99 by the EPO. In theory this is no real litigation since no court is involved. 10 For an example, I had contact with Darts-IP.com, a private organization covering litigation cases in Europe, although proving the possibility of retrieving this information based on IPC-subclasses, they were not granting me admission without payment, neither did they give me a sample.
10 | P a g e
litigation, I chose to search for the results of a successful type II litigation that can be found in the IPO database: revoked patents11. In addition due to the relation between appeals and litigation cases, I will use this as an indicator as well.
2.1.2 Blocking motives There are two main reasons to create a barrier using patents. On the one side it can be done to protect the freedom to operate, and create some working space. An example of this form can be seen when looking at the so called “Patent fence” this is called a defensive blockade. This blockade is created by patenting not only the invention to be used by the organization, but also all possible parts and substitute technologies. This makes it nearly impossible to surpass the actual patent used by the organization, and thus protects its source of income. This can also be used to “freeze” a certain technology to lengthen its life cycle. (Orsenigo and Sterzi 2010)
The other possible reason to create a blockade is to prevent others from using their technical inventions within the same application field. The organization will patent technology that it might not even want to use itself, but purely to make sure competitors won’t be able to profit from them.
The effects of this motive cannot be found as easily as those of the protective motive, a possible way would be to measure the amounts of patents per organization, a higher patent per organization ratio could be accounting for a defensive or offensive blockade. However, this data is harder to find within the databases and is very time consuming to gather. A workaround may be found through the paper of Cremers (2004) which indicated that a patent that has been confronted with an appeal during the application procedure was prone to find itself litigated 5 times faster than a normal patent. Appeals have a blocking motive, but indicate the chance of litigation and can be found through the database of the EPO12. Another indication of (a reduction) of the blocking motive can be found through the ceased patents within patent databases, these ceased patents are no longer being paid for and are thus no longer in force13, I will check for a possible negative correlation with patent intensity when doing the statistic tests. In itself the blocking motive does not contribute to the risk involved with patent intensity, only when the blocking patents are protected through litigation or appeals do they contribute to the risk.
2.1.3 Reputation motive A more and more important motive to patent is the image it creates within industry, a granted patent accounts for a new invention deemed patentable by the patent office. This means that the requirements “novel”, “useful” and “nonobvious” have been met and could thus be an addition to the current technology within that sector. The amount of patents, and their importance add value to the company image and can be used as an asset in the field of promotion and communication. This
11 http://www.ipo.gov.uk/types/patent/p-os/p-dl-notinforce.htm type in the IPC-Subclass involved in combination with “AND revoked”, for example “A01K AND revoked”. 12 http://www.epo.org/law-practice/case-law-appeals/advanced-search.html, all forms of appeals fit the bill and can be searched through the IPC-Subclass. 13 http://www.ipo.gov.uk/types/patent/p-os/p-dl-notinforce.htm type in the IPC-Subclass involved in combination with “AND revoked”, for example “A01K AND ceased”.

11 | P a g e
motivation has varying purposes when looking at the size of an organization and its position within the sector, a small firm may use this motivator to gain an image or a reputation within the sector, where a larger competitor may use it to show the innovative spirit active within the organization to attract potential new relations and keep a customer base.
Although the importance of this motivation has risen over the past years, it is fairly impossible to measure within a database, and has no special use within a database that can be tracked back through some sort of workaround. A possible solution would be individual assessment of separate patent holders, if they are advertising with the owned patents, the reputation motive is active.14 This is however not a risk to patent owners in the same sector and does as such not contribute to patent intensity.
2.1.4 Exchange motive Patents can also be created to create gain without exploiting them themselves, if an invention is appropriated that does not have direct use to the organization, the decision can be made to sell (a share of) the rights to a party that has more interest in it. The reasons for this can be pretty straightforward, either the organization may not have the funds to implement the invention, or the actual implementation of the patent may not be the core business of the inventing organization (a research institute, or university for example). Another reason to sell a patent is that it may be at the end of its useful life cycle to the organization, and can be sold or licensed to another organization.
Licenses Licenses are accompanied with a partial right to make, use, sell, offer for sale, or import the patented invention. However this does not have to be an exclusive right, and can be granted to multiple organizations. A problem with licensing is the royalty question, how can be monitored how much royalties should be paid? And what to do if they don’t pay up, or don’t want to pay the full price? In this case litigation is an option.
The least friendly way to out-license a patent is to threaten with litigation, this works best when infringement is noticed and the cost of switching would be higher than the cost of buying a license and pay royalties over the money or sales made on the patent. This is called “Stick licensing”.
The more friendly “Carrot licensing” comprehends the promotion of the patent to cause others to use the technology under a license. This is far less costly than litigation
I have not yet found a database alike yet2.com containing licenses, for sale, or used within the industries. Nonetheless some patent offices offer the possibility to reduce the periodical fee by setting the patent open for License Of Right, for my research I will use such a database provided by the IPO15,16.
14 This process would take too much time to actually consider within this research. 15 http://www.ipo.gov.uk/types/patent/p-os/p-dl-licenceofright.htm?filter=&sort=NIF+Start+Date&perPage=10, 25-6-2012.

12 | P a g e
Patent transaction
If the actual patent is being transacted this means that all rights move from one organization or person, to another. The property rights are being differed from one owner to another. There may be several reasons for an organization to give up all the rights on a patent, but mostly this will be because this is more lucrative than using it themselves.
Finding organizations that might be interested in using your patented invention can be done by promoting the use online using one of the websites made for this, for example yet2.com. This website uses several categories to show which patents are offered for sale. Another possible way to market a patent is to show its actual use within the market. In the Intellectual Property Management course I followed, the professor used the case of Tessera (Shih 2010), this company has invented a new wafer technology that might solve many problems and has a lot of potential within the wafer industry. However the investments made in switching from one technology to another proves to be a reason for the organizations not to make this switch at first. Tessera chooses to solve this problem by starting up two manufacturing plants themselves, in which is shown that mass implementation of the new technology would bring the lucrative effects they promised. This shows that creating an invention on its own, is not enough to show its potential use.
This motivation does not pose a risk in itself, however royalties may increase the protection motive.
2.1.5 Incentive motive The incentive motive is used to interact with the needs felt by employees, the more of these needs are met, the more motivated an employee will be. The end effect of this idea is that the employees that are now more motivated will be more productive within their tasks. This can be achieved by financial praising, or the acknowledgement and respect gained through the actual filing of a patent claim. More examples can be found within the model of van Reekum. This motive is difficult to retrieve information about, there will not be records on a Meso scale that can be used to measure the effect of this motive, next to that the motive is least active when applying for a patent (Blind, Edler et al. 2006) and has limited effect on the surrounding industry. Thus this motive is of less interest when forming an instrument to measure the patent intensity within a sector. The incentive motive does not pose a risk to competing patent holders, and does as such not contribute to patent intensity.
2.1.6 Research on patent value and propensity to patent A topic not yet covered in the previously discussed motives is patent value, although not directly covering a risk to patent holders, it can be imagined that high patent value will increase patent intensity. Patent value has been assessed in multiple ways and many methods, through the analysis of patent citations (Hall, Jaffe et al. 2001; Maurseth and Verspagen 2002), patent renewal data (Lanjouw, Pakes et al. 1998; Deng 2011) and the R&D investment in combination with amount of 16 This database may be tainted by the financial motive of fee reduction, I considered the use of the CATI-MERIT database but found this outdated, this argument got supported by Belderbos, R., V. Gilsing, et al. (2011) Although operating from within MERIT they chose to use Thomson Reuters SDC as an up to date alternative.

13 | P a g e
patents (Scherer 1983; Mäkinen 2007) these researches seem to succeed at determining which factors affect the propensity to patent. This however are all research papers covering why some inventions are patented, while others are not, or how the specific value of a patent can be determined. As such these research papers do not directly contribute indicators that can be used for risk assessment, however patent counts and the amount of ceased (non-renewed) patents may have some correlation with the risk involved with owning or using technology within a certain sector, and should be checked.
2.1.7 Patent Management Maturity model explained There are certain ways in which an organization can respond to certain situations, these choices make it possible to analyze what kind of attitude is being used by the organization. The first four of the functions looked at in the model of van Reekum are mainly structure bound, thus creating a structure on how to react to certain situations. The first factor of importance is the Incentive. Patents can be used as an incentive for researchers, this can either go with a financial contribution to the researchers in question, or other means of appreciation. This rewards researchers who are bringing in new inventions patentable by the organization. This can also be motivated by stimulating spin off programs where newly found inventions can be exploited further, either from within the organization, or by starting a new spin off non-related to the mother organization. Appropriation, research might help to find new ways to enhance processes or products, but will not protect the found inventions from being used by others. This is where the appropriation part starts to show its importance, the newly found inventions have to be patented to exclude others from using them. This can either be done by the researchers themselves, or an appointed manager, but there should be some form of policy prescribing what has to be done by whom in case of a patentable invention. Protection, once the invention has been appropriated, others can be excluded from making, using, selling, offering for sale, or importing the patented invention. However this will not automatically be done by another party, but has to be organized from within the organization. This concerns possible infringement of the organization on existing patents, just as well as monitoring if patented inventions are being used by others, and what to do if so. Dissemination, within the organization it would be helpful if there would be a database describing the features and characteristics of the different patents owned by the organization, thus handing information and potential utility of such information to different types of users. This could then be used for both internal en external usage, to either share knowledge within the organization or to be used as a source for further research or proposals to external parties. Asset, once an invention is appropriated it becomes property of the firm in form of a patent. This property can be valued in different ways, differing from no worth at all on the company balance, to actually creating profit through valuating it for the actual cost and selling it for its worth in the market. Portfolio component, the patents bound to the organization are part of a larger portfolio, however the relations between patents is not always as clear. A well-organized portfolio could shed light on the cross patent relationships from both a financial and a technological stance, making clear how the patents relate to each other. This portfolio could also be used to keep track of all the licenses being used or issued within the organization. Liability, as an asset a patent can also be used for getting finances from financial suppliers, this however usually means that there is no longer an exclusive use of the patent for the organization, the right is now shared. However how exclusive, or at which share is a choice of the organization, showing its attitude towards their

14 | P a g e
patents. Performance indication, patents can be used as a performance indicator, both from a external as an internal stance. The amount and importance of patents linked to an organization may give a certain status to the organization which can be used for both promotion and bargaining power. Differing attitudes may vary in the fact that this is either not acknowledged or used for internal or external communication with possible suppliers and clients.
As I already pointed out, the model of van Reekum makes it possible to analyze which attitude17 an organization chooses either willingly or without noticing. These attitudes are separated in four stances, I will give a short explanation of what type of organization is bound to what attitude:
The extreme form of an organization with an “inactive” attitude will not show the researchers the appreciation when finding a new invention patentable, and will demotivate anything that resembles a spin-off or spin-in18. There is no system in appropriating or protecting new inventions and will not check if it is infringing someone else’s patents. Also there is no patent portfolio that can be used to track down in-house and external patents for other uses, such as financing or promotion.
An organization with a more “reactive” attitude will do something to show the appreciation of newly found inventions and will react more positively towards the idea of spin-offs neither will they discourage the use of new inventions within the organization if useful. There are no guidelines on how to protect new IP, but petitions will be made by managers to file patents. If warned by competitors, the managers will react on the possible infringement and analyze the case. If an infringement of a company owned patent has been found and the financial aspect is substantial, the organization will pursue the infringer. Patent information is now stored at one point, and may even be used for further research.
An organization practicing the “active” stance will lead to a more motivated use of IP and IP protection, tangible rewards will be given to those who find new IP within the organization and will actively protect these newly found inventions. Also the patents are disseminated based on criteria given by the provider and will be more actively used as assets and for propositions. Licensing and scanning the environment for possibilities and infringers are done more commercially. The “Proactive” attitude, in this stage the previous stage is further formalized and is now proactively pursuing the protection and development of new IP. A structural use of patents and licenses allows proposition to other organizations more easily.
Now that we know which motivations are found within patenting, and the possible attitudes a patent holder can have towards the use and exploitation of patents the risks of owning a patent become visible and should be used when assessing for correlations and possible use within the instrument. It is important to get to know the methods currently used to classify both industries and patents within the databases so that the effects of the previously found theories can be tracked back to an according aggregation level.
17 Inactive, reactive, active or pro-active. 18 Further internal business development based on the new technology.

15 | P a g e
2.2 Classification systems To measure Patent intensity it will have to be made clear where the measurement will take place. Since I intend to build an instrument that will be able to give a probable intensity within industries or fields of technology, my model will have to be able to measure the intensity in those sectors. To do this, we must first define how these sectors can be classified. There are several possibilities to do this, I will focus on the systems used within the sources and the most used classification systems used in research.
2.2.1 IPC & ECLA In the patent databases used for this paper, basically two means of classification are used. The World International Patent Office uses the so called International Patent Classification System (abbreviated to IPC) with a total of approximately 70.000 categories. The European Patent Office uses an even more accurate classification method that is able to distinguish a total of about 135.000 categories, called ECLA.
The first classification step in the process towards identification is made out of eight sections, these eight sections don’t differ between the ECLA and IPC and are as follows:
A Human necessities
B Performing operations; Transporting
C Chemistry; metallurgy
D Textiles; Paper
E Fixed constructions
F Mechanical engineering; Lighting; heating; weapons; blasting
G Physics
H Electricity
The next step in the categorization of a patent is the class, stating a two digit number to point out the class within the section. Further indicating the precise use of the patent.
To define the use even further, three more categorization steps are being made, indicating the subclass and group. The subclass is indicated by a letter. The group by a one- to three- number followed by a oblique stroke and a double zero, if an extra subgroup is needed to further elaborate on the different uses of the patent, these zero’s change.
For example, if a patent bears the identification number H01S 3/00 this would make it a patent that is in the section H: Electricity, under the class 01: Basic Electric Elements, in the subclass S: Devices using stimulated emission. Main group 3/00: Lasers.

16 | P a g e
If I were to invent a laser specially tailored for the construction or shape of optical resonators, there would be two identification numbers attached.
Main group: H01S 3/00 Lasers
Sub group: H01S 3/05 construction or shape of optical resonators (WIPO 2011)
In the ECLA there is one more step that can be made to further specify the use of the patent. This is done by creating a subdivision within the subgroup. This is then made visible in the classification code by adding a letter and number to the end of the classification code.(Dickens 2004)
For example
Main group: H01S 3/00 Lasers
Sub group: H01S 3/05 construction or shape of optical resonators
Sub division: H01S 3/05C1 shape of optical resonators19
This system can be used in two ways for the organizations I want to analyze.
Downwards, so from the main sections towards a point where the depth is reached that is still useful for the entire organization, or upwards to see what technology will be used by the organization and can be used to analyze patent intensity.
Over the years revisions have taken place, the main ones in 2006 (Makarov 2006) and 2011 (Wongel and Farassopoulos 2012) where 5 new subclasses were added and modifications have taken place in 26 subclasses, resulting in a total of more than 640 subclasses20.
2.2.2 SIC In the beginning of the 20th century each department of the United States government developed their own kind of classification, this made it hard to compare, and fairly useless to be used in other departments or branches than the creating one. In the 1930s the need was felt to create a more standardized means of classification. To create a more meaningful means of analysis and measurement, the Standard Industry Classification system was created. The codes used in this system are comprised by four digits indicating the specific shared characteristics of the products, services, production and delivery systems of a business. The last sixty years there have been numerous revisions of the system to cope with the changing industrial compositions, This however was not enough to keep the criticisms at bay. Many believed that the SIC was no longer able to handle the quickly changing surroundings within the US economy. The main argument for a change of industry classification was the fact that the SIC was less able to cope with the recent developments in the information services and expansion of services, the high tech manufacturing and new forms of healthcare provisions, thus causing a felt need for a new classification system21.
19 Fictional example 20 http://www.wipo.int/classifications/ipc/en/faq/ 21 The NAICS solved this need for a new classification system.

17 | P a g e
2.2.3 ISIC The International Standard Industry Classification was intended to be a classification for industries based on their productive activities. Just like the rest of classification systems this systems main purpose is to provide a range of activity categories that can be used for the representation of organizations operating within these activity categories. The ISIC is generally covering the productive and economic activities within the boundaries of the System of National Accounts. A few exceptions have been made to make it possible to represent statistics that are just falling outside of the boundaries. The economic activities are divided in a four level structure that starts off with a general section level (much alike the other systems), and then is broken down to divisions (two-digits), groups (three-digits) and at the most accurate level a four digit code. The ISIC has been revised over the years, all these revisions can be found on the United Nations website22.
2.2.4 Concordance between patent databases and industry classification.
If applying for a patent in Europe or worldwide, the application is categorized and assigned to a certain classes within the IPC or ECLA. The assigned product code is primarily used by lawyers and patent examiners in grant and litigation decisions. This assigned code however is of less use to researchers since it does not bring proper possibilities to compare and analyze the use of patents within other classification systems. For this reason several workarounds have been sought of which I will address some of the most important based on my literature research.
The concordance table provided by MERIT in 1994 used patents from the IPC to develop a model which could assign these classes to one of the 22 chosen manufacturing classes used within the ISIC (rev. 2). (Verspagen, van Moergastel et al. 1994)
Similarly to most patent offices, the Canadian Intellectual Property Office assigns a technology field from the International Patent Classification (IPC) system to each patent it issues. Unlike other patent districts however, an industry of manufacture (IOM) and a sector of use (SOU) were added to the patent information between 1983 and 1993. The IOM is the industry that manufactures the product, and the IOU is the industry that uses it. If the patented invention was a process patent then IOM was only assigned if some form of apparatus was used in the process. Both concepts appear to be useful, since they provide a means of predicting patents by either IOM or SOU. In the development of the Yale concordance Table over 250 000 of these patents issued in Canada from 1983 through 1993 were examined and industry and technology assignments analyzed. Several concordance tables were based on this Canadian database (Kortum and Putnam 1997; Silverman 1998; Johnson 2002; Silverman 2004).
22 http://unstats.un.org/unsd/cr/registry/regct.asp?Lg=1

18 | P a g e
2.2.5 Concordance between patent databases and industry classification using fields of technology. In 2003 another approach was made to compare the IPC with industry classification, instead of using the fairly depleted and aged path of the Canadian classification added before 1993, they researched the industries in which the applicants of patents were active. This research was done by joint efforts of the ‘Frauenhofer Insitute’, ‘Observatoire de Sciences et des Techniques’ and the ‘University of Sussex’, and was able to create 44 classes compatible with the ISIC to which the subclasses used within the IPC could be appointed (Schmoch, Frietsch et al. 2003). In the matrix the ISIC (rev.3) and the IPC-7 were used, both have been revised by now, but have broadly stayed the same on a subclass level23. According to the authors the measured concordance is not as high as could be achieved by using purely industry classification instead of technology sectors, but still the relevance for doing research is high. Since this is the most recent concordance matrix, using both a recently revised industry classification system and a fairly unchanged IPC, this would at this moment be my table of choice to bridge the gap between activity based classification and patent classification.
2.3 Conceptual model
According to the information found in the literature review, the classification systems are differing greatly when it comes to which type of data is deemed most important by the users. This led to two main types of classification, one where the industries measuring what type of activities are practiced by the different types of organizations (SIC, ISIC etc.), and the patent classification systems, mainly focusing on the types of technology used within the patents (IPC & ECLA). In the design research literature, this situation is commonly known as most databases within information systems are a result of engineering, and not focused at use by managers, I will get back on this topic in the methodology part covering design literature.
Since the goal of my instrument is to formulate an instrument capable of predicting the risk at an industry level24, this would make it possible to assess an attitude in combination with the patent intensity and give an indication on the fit within the environment. To do this, I want to use a classification system commonly used in making management decisions. While I analyzed the data that could be used to predict patent intensity, I found out that most of this data is being classified using a system based on the IPC. This classification system however is arranged to be of most use to those practicing law (tracking possible infringement cases), or engineering (gaining new knowledge through publications, checking freedom to operate), and cannot be translated to data useful to those usually making the strategic choices within an organization, such as managers.
When I discussed this problem with my supervising professor, he pointed out the use of concordance tables to deal with this matter. When following up this possibility I noticed most of the concordance tables are either imprecise and outdated (Verspagen, van Moergastel et al. 1994), based on the SIC, which has not been revised recently and/or using data compiled by the CIPO which has become outdated as well (Kortum and Putnam 1997; Johnson 2002; Silverman 2004). This lack of recently revised systems led me to choose the in my opinion least outdated means of concordance. Schmoch,
23 Subclasses were used as an aggregation level in the concordance table. 24 Using patent intensity.

19 | P a g e
Frietsch et al. (2003) created a concordance table based on the organizations within the ISIC (rev. 3) and their patent practices as patent holders within the EPO. To create this concordance they formulated 44 fields of technology that are linked to both the IPC-7 on a subclass level and the ISIC. Both classification systems have been revised over time, but the main classification is still the same, and the changes made are of a small scale. I will use this type of concordance in my instrument to gather IPC data on a subclass level, to predict patent intensity within industries formulated within the ISIC (rev. 3).
In my search for patent intensity indicators I found many motives to either patent, or choose not to (Jensen and Webster 2006). Since the artifact patent intensity should indicate which attitude to use, I will only use those indicators that have an effect on the risk when owning or possibly using a certain patented technology within an industry, thus leaving non-protected technology out of the equation. In my search for indicators I used both the literature available and the effects visible through databases. The reason I chose to also analyze public databases on which data was available, was the supposed wickedness of indicators within the artifact. According to the literature of design research, for example Alturki, Gable and Bandara (2011), most problems are ill-defined and thus need full understanding of the phenomenon to create a useful design. Indicators of patent intensity should be measurable within the public databases. These results in combination with the motives to patent explain which data could be relevant in defining the risk within in industry or IPC subclass. Some of these strategic motives to patent were pointed at the internal functioning of an organization such as the “incentive motive” found in both the model created by van Reekum and the paper of Blind, Edler, Frietsch and Smoch (2006). Motives and actions25 that have no direct effect in the industry and were deemed less important in measuring patent intensity, since the patent intensity is primarily formulated to indicate the risk of owning a patent, or start using certain technologies within a certain industry. Possible indicators for patent intensity are:
-The amount of patents active within an industry, since these indicate the risk of “infringing” a patented technology. Information about this indicator can be found using the EPO database. 26 -Litigation cases type I and type II27, within the industries. These indicate the risk of a lawsuit, however it should be kept in mind that most infringement claims will be dealt with through licensing or cross licensing agreements to avoid legal costs, the litigation cases will thus only show the tip of the iceberg. There are no public databases available on this topic that compile data useful for measuring patent intensity.28
-Licensing agreements, these indicate the avoidance of litigation and bundle both the protection and exchange motive discussed in the literature review. However no public databases are available to -
25 Strategic actions such as keeping a technology secret, or using the “first-to-move” advantage are important alternatives to patenting but have no effect on owning a patent in this industry when looking at the chance of being litigated or infringed, their use in defining ‘patent intensity’ is fairly absent. 26 Since both the claim and the actual infringement will be accompanied by a risk of loss of time and money, both are considered important in measuring patent intensity. 27 Type III is mostly a reaction on type I claims, using these to indicate patent intensity could result in counting the same litigation twice, thus resulting in a higher supposed intensity, and legal databases showing the non-structured results of cases between the defendant and the opposing party. 28 There are however private organizations such as darts-IP that compile data of litigation cases in Europe.
20 | P a g e
measure the amount of licenses within an industry.29 An alternative would be the License of Right provided by some patent offices to lower the periodical fees to be paid by the owner of a patent, in combination a license has to be provided to a possible licensee for a certain amount of royalties when applied for. The IPO provides data on license of right.
-Appeal cases. When a patent is granted to an organization third-party opposition has a chance to file an appeal. These appeal cases can be found through use of the EPO database.30
-Patents that are invalidated should be traceable within the databases as well, covering successful type two litigation cases and appeals. Revoked patents can be found in the IPO database of the UK.
-Patents that are no longer being cared for will be taken out of the databases as well, if there is some way of tracing these seemingly inactive patents it could indicate the fall of a technology or a seemingly less intense environment. Ceased patents can be found in the IPO database of the UK.
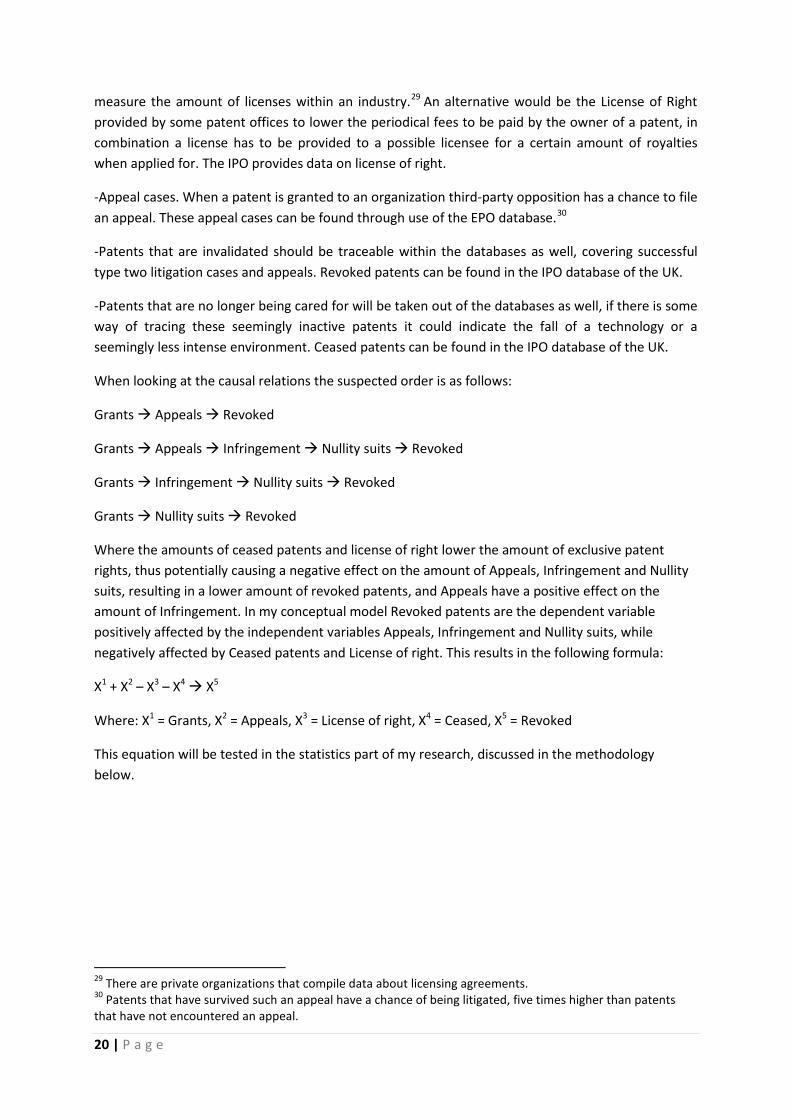
When looking at the causal relations the suspected order is as follows:
Grants Appeals Revoked
Grants Appeals Infringement Nullity suits Revoked
Grants Infringement Nullity suits Revoked
Grants Nullity suits Revoked
Where the amounts of ceased patents and license of right lower the amount of exclusive patent rights, thus potentially causing a negative effect on the amount of Appeals, Infringement and Nullity suits, resulting in a lower amount of revoked patents, and Appeals have a positive effect on the amount of Infringement. In my conceptual model Revoked patents are the dependent variable positively affected by the independent variables Appeals, Infringement and Nullity suits, while negatively affected by Ceased patents and License of right. This results in the following formula:
X1 + X2 – X3 – X4 X5
Where: X1 = Grants, X2 = Appeals, X3 = License of right, X4 = Ceased, X5 = Revoked
This equation will be tested in the statistics part of my research, discussed in the methodology below.
29 There are private organizations that compile data about licensing agreements. 30 Patents that have survived such an appeal have a chance of being litigated, five times higher than patents that have not encountered an appeal.

21 | P a g e
3 Methodology
Basically there are three types of scientific research: Exploratory, Descriptive and Predictive. Since my research’s goal is to develop an instrument capable of predicting the risk describing measured patent intensity within a certain environment, my research would be placed under the predictive header, with some descriptive aspects, thus pointing towards the use of a design research method.
3.1 Design Research Literature Before elaborating on the research structure to be used, I want to make a short side-step to the paper of Purao (2002) who created an image showing the difficulty in creating an instrument based on engineering data to be used by management.
Figure 3 "Patronage Structure of the IS Discipline"31
What is clearly visible in the figure posted above is the direct effect engineering and management have on Information Systems, and its relation with Information Systems and Technology Practice. This indicates the problem I am confronted with in creating an instrument that is useful to management (risk management) but mostly based on information systems used for engineering32
Since my goal is to create an instrument capable of predicting the risk within an industry through describing patent intensity based on available information systems, I will try to guide my research using a method specialized for this. This led me to the search for an adequate ‘theory of design research’, this form of research was most used in engineering but over the years found its way to Information System management and behavioral sciences. The crossover between fields of expertise has led to many different approaches and theories about how design literature should be handled, a summary about the different methods used for certain research and sort of output has been performed by Alturki, Gable and Bandara (2011). In my opinion Peffers, Tuunanen, Rothenberger and Chatterjee (2007) provide an easy to follow step-by-step approach in performing design research, combining both the theory and theorizing and the importance of evaluation but lacking a focus on the actual design of an instrument. This is why I chose a method with a similar step by step approach
31Figure from Purao, S. (2002). "Design Research in the Technology of Information Systems." Working Paper. 32 Patent databases are provided mainly for litigation and innovation purposes.

22 | P a g e
but more focused on the practical utility and iterative steps within the development of an instrument (McLaren and Buijs 2011).
In most forms of design science the research focusses on first clarifying the goals of the artifacts and then building on and carefully evaluating the utility of the artifacts (Gregor 2006; Baskerville and Pries-Heje 2009), and to a lesser degree their reliability and validity (Hevner, March et al. 2004; McLaren and Buijs 2011). In the research paper of Mclaren and Buijs the use of design research to develop an instrument in Information Systems research is stressed with a focus on practical utility to motivate the use by expert practitioners and addition of additional evidence that can corroborate the statistical reliability and validity (McLaren and Buijs 2011). The traditional approach to research instrument development would be to create new measurement instruments and then subject them to relatively short and a more lengthy analysis of statistical conclusion validity and often overlooks the assessment of the descriptive or prescriptive utility. In the more iterative design research approach it is less important how valid or reliable the instrument is, but focusses more on a ‘how well does it work? ’ approach when it comes to making management decisions (Hevner, March et al. 2004).
To bring the iterative nature into practice, the next step will be to test a conceptual model of the instrument to retrieve information deemed to be an effect of patent intensity, during this process the indicators may be adjusted if utility or statistical conflicts arise.
3.2 Operationalization Using the results found in the literature review and public databases in combination with the approach formulated by Mclaren and Buijs (2011) we can now try to gather up to date data on the indicators that should measure patent intensity. This process is deemed important in several papers covering both design research and the development of an industry (Switzer, Wiesniewski et al. 1999; Barab and Squire 2009; McLaren and Buijs 2011).This ‘test run’ is to check on the feasibility of retrieving this information, search for new insights, and to gather information to perform statistical analysis on the results that were deemed useful and accessible33.
Since both the requirements that I mentioned in the introduction have been met, I will now formulate the process on how to gain information about the patent intensity within an industry. The method used to measure ‘patent intensity’ should be well defined to ensure proper use of the instrument. I will elaborate on the use of the different classification systems, concordance table and databases in a step by step approach.
3.2.1 Choose the industry To ensure measuring the patent intensity for the environment the organization will be operating in, it is of extreme importance to choose the most important industry using the ISIC (rev. 3) classification. If multiple industries apply to the surroundings of the chosen organization, it may be useful to check which ISIC (rev. 3) codes are used for these organizations as well. However, each new ISIC code will
33 This will be done in the statistics chapter following later on.

23 | P a g e
result in a new set of IPC-7 codes when used in the concordance table, and thus multiple ‘patent intensity’ ratios could be found, resulting in different needs of ‘attitude towards IP’.
3.2.2 Use of the Concordance table Now that the ISIC (rev. 3) code(s) are found, we can use these to gather information on the technology fields attached using the concordance table provided by the EOCD. These technology fields can then be used to check which IPC subclasses are related to these fields. If in the previous step the choice was made to check multiple industries, If a selection of IPC subclasses is based on multiple ISIC codes, it is very likely that IPC subclasses will be connected to multiple ISIC codes and may thus be encountered multiple times when analyzing the found data from the EPO. These IPC subclasses can be considered more important since they have multiple connections to the suspected environment.
3.2.3 Document the results in the databases If a more narrow risk assessment is requested, this can be used as a starting point as well, directly documenting the results for the IPC-Subclass having most effect on the invention.
There are several types of data that we need to find to measure the possible patent intensity, since all the data is a direct effect of patent intensity. The cumulative nature of the instrument makes it possible to give an indication about the patent intensity, even if not all of the indicating databases are accessible.
The EPO provides information on several types of data, information can be found for the total amount of appeals, the total amount of applications and the total amount of granted patents, all bound to IPC subclasses. Each of these datasets is an indication to the patent intensity, where an indication on the amount of litigation can be given through the amount of appeals within the IPC subclasses. The amount of applications and granted patents are indicators of several effects of patent intensity:
-A high amount of granted patents can give an indication on possible offensive or defensive blockades active within the industry.
To test the operationalization I gathered results for 119 IPC subclasses, which can now be used for statistical tests, to which we will come in the next part of my paper.
3.3 Statistics The database (appendix 5.4) I gathered during the testing of the conceptual method is showing, from left to right, the Technology field, Subclass measured, Grants, Appeals, License Of Right and Revoked amount of patents. Each row is showing the effects measured per subclass, while the shown technology field makes it possible to be used as a means of selecting on industry level. According to literature concerning the development and use of an instrument (Switzer, Wiesniewski et al. 1999;

24 | P a g e
McLaren and Buijs 2011) it is important to analyze both the reliability and validity of the used indicators within an instrument.
To perform statistical tests, I moved the data from Excel 2010 to SPSS 17.0, a program commonly used for statistical analysis. Since we have determined possible indicators in assessing patent intensity involving the risk in operating within a certain technology, but have no clue for which of this data correlations can be found. To get a general view on the inter-item correlations I let SPSS perform a test on the five indicators previously chosen, I will use the results found in the conceptual model, this databases covers the results for 119 subclasses and 7 industries (based on the concordance table previously chosen).
Correlations
Grants Revoked Appeals LicenseofRights Ceased
Grants Pearson Correlation 1 ,640** ,762** ,526** ,780**
Sig. (2-tailed) ,000 ,000 ,000 ,000
N 119 119 119 119 119
Revoked Pearson Correlation ,640** 1 ,961** ,168 ,423**
Sig. (2-tailed) ,000 ,000 ,069 ,000
N 119 119 119 119 119
Appeals Pearson Correlation ,762** ,961** 1 ,274** ,548**
Sig. (2-tailed) ,000 ,000 ,003 ,000
N 119 119 119 119 119
LicenseofRights Pearson Correlation ,526** ,168 ,274** 1 ,446**
Sig. (2-tailed) ,000 ,069 ,003 ,000
N 119 119 119 119 119
Ceased Pearson Correlation ,780** ,423** ,548** ,446** 1
Sig. (2-tailed) ,000 ,000 ,000 ,000
N 119 119 119 119 119
**. Correlation is significant at the 0.01 level (2-tailed).
As can be seen in the bivariate correlations table, correlations vary between 0,168 and 0,961, the closer the value comes to 1 the higher the correlation between items. Based on this matrix we can already assume that the correlations found for license of rights and ceased seem too low to be used as an indicator to predict most items in the model. To check this outcome and see which variables can be used to determine overall patent intensity, further tests will have to be done. For this I want to use a regression analyses. Based on the flowchart (Appendix 5.5) previously mentioned we can determine that Revoked would be a dependent variable caused by the independent variables nullity

25 | P a g e
suits34 and appeals. As such I will use Revoked as the independent variable, and use a stepwise linear regression to determine which variables could play a significant role at predicting the amount of patents revoked, and at what magnitude. In the appendix (5.6) I added the results of this stepwise linear regression test for all 5 indicators.
According to the R square value in the “model summary” table 40,9% (,409) of the variance in the dependent variable revoked could be explained through the variance in the independent variable Grants at a very high significance level35. When adding the independent variable Appeals to the equation a total of 94,4% would be predictable through the use of these two independent variables. What is visible in the same model summary is that although included in the test, the variables Ceased and License of Right were not shown, by taking a look at the Excluded Variables table we can see that SPSS determined both variables being non-significant at a ,166 and ,083 level.
The goal of my paper is to develop an instrument capable of measuring patent intensity as an indicator of risk, based on indicators found in public databases. Since we have determined a dependent variable, that can now be determined using the results found in the regression analyses we have come one step closer at creating a general risk getting your patent revoked that can be used to compare data with, and thus give an indication of the risk within an industry or IPC Subclass compared to this general mean. To determine this mean, we will use the data found in the coefficients table, which gives an indication of the weight of the different variables within the equation. The standardized coefficients indicate that when using these two variables Grants have a negative weight of ,221 while Appeals have a positive weight of 1,129 on the dependent variable Revoked. For actual use in an equation however, the B values indicate the factors used when entering measured results in the equation. For Grants this would be 0,00 and ,664 for Appeals at an interception point of ,532. The equation would be:
Y=,532-0,00X1+0,664X2
Where X1 = Value found for Grants, and X2=Value found for Appeals.
Since we can now predict the number of revoked patents in an IPC Subclass and compare this to the actual number, we have an indication if this number is lower or higher. SPSS has an option which is able to visualize these differences from a standardized point of view. Appendix 5.7 shows this visualization in which I labeled the dots with the industry with which the IPC-Subclass was associated. The most extreme outliers are IPC-Subclasses H01L (part of the pharmaceutical industry being seriously over predicted by the scatterplot) and A61K (part of the electronic components industry, being seriously under predicted according to the scatterplot). In the evaluation below, I will come back to these two cases when assessing the conceptual model in combination with the statistical tests and visualizations.
34 A result from type II and type III litigation, which both are associated with high costs and thus a risk when owning a patent, giving a good indication of overall risk. No public data was available for the actual amount of these cases. 35 Sig. is ,000 which is lower than ,05 the significance indicator normally used.

26 | P a g e
3.4 Evaluation Since we have now passed the point where all theory and assumptions come together in the statistical testing, where it would show if my assumed relations would show up as significant correlations and result in an equation that would be able to measure the risk within an IPC-Subclass and in combination with a concordance table industries. It is time to evaluate this first attempt.
I will start at the beginning where I assumed that certain results found in the databases could be used to indicate patent intensity. While some of these indicators were ruled out during the search for available information, others made it to the statistical test only to be ruled as well. Since no other risk indication was available to me to be used for a regression analyses, I chose to the revoked patents within certain IPC subclasses as an indication of the maximum risk to a patent holder. In relation to this variable it was found that both grants and appeals have a high correlation and can be used to predict the amount of revoked patents.
There are two methods to get an indication of the risk within an IPC-Subclass, the first being the easiest where the found regression formula can be used to process data found for this IPC-Subclass on appeals and grants to predict the amount of revoked patents. Since the standardized values argue that not only the amount of appeals have a high correlation, but also the amount of grants should be included in the equation to reach an even higher significance. Due to the high amount of grants in comparison with the amount of appeals and the restriction to three decimals grants are included in the equation but will not contribute in the according result. To make actual use of the amount of grants the amounts I also tested the possibility of dividing the amount by thousand, resulting in equal standardized values but more useful factors.
Coefficientsa
Model
Unstandardized
Coefficients
Standardized
Coefficients
t Sig.
95,0% Confidence Interval for
B
Collinearity
Statistics
B Std. Error Beta Lower Bound
Upper
Bound
Toleran
ce VIF
1 (Constant) -
3,616
9,134 -,396 ,693 -21,705 14,474
Grantsdividedb
ythousand
2,834 ,315 ,640 8,998 ,000 2,210 3,458 1,000 1,000
2 (Constant) ,532 2,832 ,188 ,851 -5,076 6,140
Grantsdividedb
ythousand
-,980 ,151 -,221 -6,507 ,000 -1,279 -,682 ,419 2,385
Appeals ,664 ,020 1,129 33,223 ,000 ,624 ,704 ,419 2,385
a. Dependent Variable: Revoked

27 | P a g e
The resulting regression equation would be:
Y=,532-0,980X1+0,664X2
Where X1 = Value found for Grants divided by thousand, and X2=Value found for Appeals.
This method is however based on an equation based on the results I found for data collected a few weeks ago, and will be less and less valuable as time passes. A more reliable but also more time consuming method would be repeating for a research such as mine or using an even larger amount of IPC-Subclasses. This would cope with the risk of possible changes in the variables and their relation to each other.
If we take a look at the visualization of the standardized residual values in IPC-Subclasses measured within the database in relation to the standardized predicted value some outliers were shown. Since not much research has been done showing the actual risk of litigation within Europe on IPC subclasses, I chose to add industries during the process of data gathering based on the industries for which I had data covering litigation. I did this so that if my instrument would work, these more extreme IPC-Subclasses covering the most, and least litigated patents (van Zeebroeck and Graham 2011) would show up as extremes in this visualization. At the end of the statistical part of my research paper I mentioned some outliers that were clearly visible as being over or under predicted, these same two Subclasses show up in the extremes chart of Zeebroeck and Graham (2011) as being more or less litigated than others. So far this is a success and indicates the potential use when assessing the potential risk of litigation. However what I also noticed was that some of the Subclasses mentioned in this chart that should be part of the industries I chose in my data gathering did not show up in the visualization provided by SPSS36, when I checked if this was due to the instruments workings or the used data I noticed that Schmoch, Frietsch et al. (2003) had left these out of their concordance table for some reason, and the equation itself was not to blame, this does indicate the risk of using a concordance table.
What also became clear in the statistical part of the paper was that the indicators that I presumed to be having a negative correlation with the risk were not deemed significant or the correlation was not high enough according to the stepwise linear regression analyses. Most iterative steps mentioned to be normal in a design research have been taken while searching for public data to be used in the instrument, for example the most important motivator for patent use is protection, however no publicly available data directly covers this indicator and a workaround was found using appeals and revoked patents. Just as such, the amount of applications within an IPC-Subclass seemed to be more difficult to gather than presumed and were limited to 100.000 too often to be used as an indicator and was dropped during the gathering of data.
In total I would say the instrument can be very useful, however I advise dividing the amount of grants by thousand and use of the corresponding regression equation for a more balanced prediction. In the upcoming discussion I will elaborate on the methods of use, contribution to theory, limitations and future research.
36 For example A06P and A06Q, are part of the pharmaceutical industry according to Zeebroeck and Graham(2011).

28 | P a g e
4 Discussion In my opinion I developed a potentially useful instrument when assessing the risk within IPC-Subclasses, and the same instrument could be even more useful in combination with a more up to date concordance table. If we take a look at previous research done on patent value and patent litigation my instrument could be a useful addition. Not only is it applicable without the use of private databases, also the process of data gathering and processing itself is extremely simple. I will explain the advantages and restrictions below
4.1 Theoretical contribution In my research I developed an instrument in the form of an equation that makes an attempt at measuring patent intensity within IPC-Subclasses to indicate the risk, which is useful, if not necessary, when making strategic choices. To discriminate from more conventional studies on such as on patent propensity which is limited to determining patenting through R&D expenses (Scherer 1983; Mäkinen 2007) or patent value through renewal data (Lanjouw, Pakes et al. 1998) and citation analysis (Hall, Jaffe et al. 2001; Maurseth and Verspagen 2002) and has less use in risk assessment. I did this by studying the motives and attitudes when it comes to patenting, and using these to find indicators that could be measured in patent databases, for this I used an IPC-Subclass level that can be transformed to an industry aggregation level using a concordance table provided by the EOCD (Schmoch, Frietsch et al. 2003). This concordance table does not cover all the ISIC classes, but focusses on the more technology advanced ones makes more use of patenting. However, the role of the concordance table is not essential, but a help in assessing the risk on a level that might be more useful to a manager, adding to theories such as those of Porter’s five forces model (Grundy 2006). This instrument can be an aid to the strategic choices that are made in the use of patents, and can be used in combination with existing models to assess the risk necessity of attitudes used such as the model provided by van Reekum.
Most research on patent litigation is based on non-publicly available data and/or pointed towards determining which industries, organizations or patents were most prone to be litigated (Cremers 2004; van Zeebroeck and Graham 2011). What these research papers have in common is the fact that no instrument was provided to predict and compare the risk involved in operating within a certain environment such as an IPC-Subclass or industry, most papers had either a descriptive or explanatory approach while my research hands a predictive instrument to those who want to analyze and compare risk. While Cremers (2004) research on the determinants of patent litigation on individual patents already pointed out the relation between appeals and patent litigation, the results of my research contribute to this theory and show that this relation can be used to predict patent litigation on an IPC-Subclass aggregation level.
In the introduction I mentioned the importance of the five forces model in assessing the attractiveness of industries, when looking at the indicators used through the lens of Porters five forces model its logic can be explained as follows: Grants can be used as a measurement of competitors coping with the threat of “potential entrants”, gaining a competitive advantage within the field of “competitive rivalry” and reducing the “bargaining power of buyers” through, for example, setting the standard for a certain technology within an industry and then excluding others

29 | P a g e
from using this technology through the exclusive right of a grant. Appeals can be used within the “potential entrants” field as an indicator for the attempted removal of an entry barrier, as well as within “competitive rivalry” field where it may be used to prevent others from gaining an advantage. Last but not least, the revoked patents indicate both the removal of an entry barrier for potential entrants and the loss of an exclusive right for a competitor, a possible act of “competitive rivalry”. What can be found through the use of the instrument is the activity within the indicators in an IPC Subclass in comparison to each other which should lead to a certain amount of revoked patents, a higher amount of predicted revoked patents show a high risk of litigation, whereas a lower amount than predicted indicates a lower amount of risk of being litigated within the IPC Subclass. Litigation itself is best indicating the risk within the field of “competitive rivalry”, the center of the five forces, afflicted by the four other forces in the model. As such the attractiveness of specific IPC Subclasses can be determined, adding to the practical use of Porters five forces model and the possibility to make more strategic choices.
4.2 Limitations Although my method might contribute to theory, it suffers from some weaknesses. First: I used revoked patents as an independent variable indicating risk, while infringement is a type of litigation that is a risk to patent holders not resulting in a revoked patent (unless it turns in a type III litigation case)but mostly involving high costs. My second problem is the fact that I used data from the European Patent Office for Appeals and Grants, while the data for Ceased, License of Right and Revoked were found using the database of the Intellectual Patent Office based in the United Kingdom. This difference may be problematic since differences have been found between national regimes when it comes to patent litigation (van Zeebroeck and Graham 2011). Another problem might be the fact that I was not able to restrict the data used to a certain period, this led to the use of all patent data found within databases bundling possible trends such as shown by PriceWaterhouseCoopers (2011). Fourth, when using the concordance table to select which cases are important within certain industries the risk assessment is based on a selection of IPC-Subclasses that do not always seem to cover all the important IPC-Subclasses if we take a look at the missing pharmaceutical subclasses that do show up in the extremes table provided by van Zeebroeck and Graham (2011). In addition the risk is risk assessment is based on a subclass level, either an average per variable should be used to research the average risk within an industry in comparison to the predicted amount of revoked patents, or one could use the highest scoring IPC-Subclass as an indication of the maximum risk involved in in holding a patent within a certain industry, this will be less accurate than only assessing those IPC-Subclasses that are linked to the patent holder.
4.3 Future Research Patents are added and dropped on a continuous basis, the equation is based on data found within 3 days of searching and will thus give a view on the general risk at that moment, and will have to be revised once a while to remain useful. One of the biggest problems to me in developing an instrument based on the motivators and attitudes found in patenting was the lack of publicly

30 | P a g e
available databases covering important information such as license relations and infringement cases. Without a budget for my research, this led to the use of workarounds that are less accurate at describing one aspect of the use of patents, and sometimes cover multiple motivations. This does not lead to any restrictions within my instrument, since it will still be giving a general indication, but for professional use or future research the addition of data found in private databases may contribute to the percentage that can be predicted by the individual variables. Basing my knowledge on some of the papers I read, I would like to advise the use of Darts-IP for measuring litigation cases (van Zeebroeck and Graham 2011) and the Reuters SDC for determining the use of licenses (Belderbos, Gilsing et al. 2011), who were both not willing to let me access their databases without payment. If the instrument is to be used, the research should be repeated on a periodical basis to check for possible changes in the equation, making it more accurate when predicting risk on an IPC-Subclass level. For this a research comprising all the IPC-Subclasses would be even more valuable since an equation for the total population can be used instead of assuming that the regression equation found in my research can be generalized (which can be argued since the adjusted R square found in the SPSS output is well above 94%, indicating a high predicting power for other samples such as the total population). Another great addition to my instrument would be a more accurate and up to date concordance table. Because although the assessment on a higher aggregation level (industries) will always be less accurate than on a lower level (IPC-Subclass), both the risk assessment on the industry level and determining which individual IPC-Subclasses are carrying the highest risk will greatly improve once all important subclasses can are covered per ISIC class.

31 | P a g e
5 Appendix
5.1 “Patent Management Maturity” Model Attitude towards IP Protection and patent functions
Inactive
Reactive
Active
Proactive
1. Incentive
- No reward or appreciation
- Spin-offs suppressed
- Intangible reward - Sin-offs tolerated
- Tangible reward (fixed or variable) - Stimulation of spin-offs (bound to mother facilities)
- Tangible reward, both fixed and variable - development of spin-offs (could be bound to mother)
2. Appropriation
- No organizational responsibility patent petition - No part of regular meetings - Not part of research proposition model - Not part of model contracts for appointment, contract research and cooperation - No guidelines for publications and secrecy - No use of other methods for advantage oppose to competitors
- Managers take the initiative to petition a patent - Ex-post meeting between management team and patent specialist - As part of a research proposal, it is appreciated but not mandatory - Part of model contracts; usage judged on case by case analysis, no legal advice - Per case arrangement, without guidelines - Trusting on informal relations and developing speed
- Also researchers take the initiative to petition a patent - Ex-post with patent specialist and ex-ante as part of the management meeting - Mandatory part of research proposals - Part of model contracts; internal guidelines for use with legal consultation - Individual arrangements with responsible manager - Formalizing trust relations and development methods
- Continuous attention for patent applications and development of information systems - Integral part of regular meetings ex-ante and ex-post, with management, researchers and patent specialist - Mandatory part of research proposals, incl. exploitation expectancies - Part of model contracts; usage internal and external known - Internal procedures and external use of NDA’s - Protection of results of relations and methods
3. Protection
- No infringement protection - No infringement persuasion
- Following warnings from competitors - Boarding out infringement protection - Persuasion if economic effects are substantial
- following warnings from and giving warnings to competitors - Internal capacity for infringement protection - Case by case analysis when identified
- Preventive offering and request for cross licenses - Previous plus “circumvention” - Persuasion only as a last resort
4. Dissemination
- No structural source of patent information “in house” (internal) - No use of patent information by researchers (external)
- Patent information at one central location - Incidental use for own research
- Patent information is disseminated based on criteria given by provider - Structural use for own research and incidental for propositions
- Patent information is disseminated based on criteria given by provider - Structural use for own research and propositions
5. Asset
- No financial appreciation
- External interest is randomly appreciated
- Patents are assessed on cots-plus-margin basis
- Patents are assessed on market potential and activated on cost basis
6. Portfolio component
- No mutual technology or commercial link - incidental licensing (buy or sell) initiated by third parties
- Solely a mutual technology link - Incidental licensing (buy or sell) at researchers initiative
- Technological and commercial link - Structural licensing (buy and sell) at managers and third party initiative
- Based on audits, proposals are provided with patent paragraphs - Structural licensing (buy and sell) at researchers, managers and third party initiative
7. Liability
- Not used as a liability by financing
- At financers request fully and exclusively
- At own initiative, fully and exclusively
- At own initiative, but never fully and exclusively
8. Performance indication
- Not used when assessing partners - No communication about IPR’s
- Low priority in assessing potential partners - Internal communication; ex-post
- High priority in assessing potential partners - Internal ex-ante and ex-post and external communication ex-post
- Most important criterion for selecting partners - Internal and external communication; ex-post en ex-ante
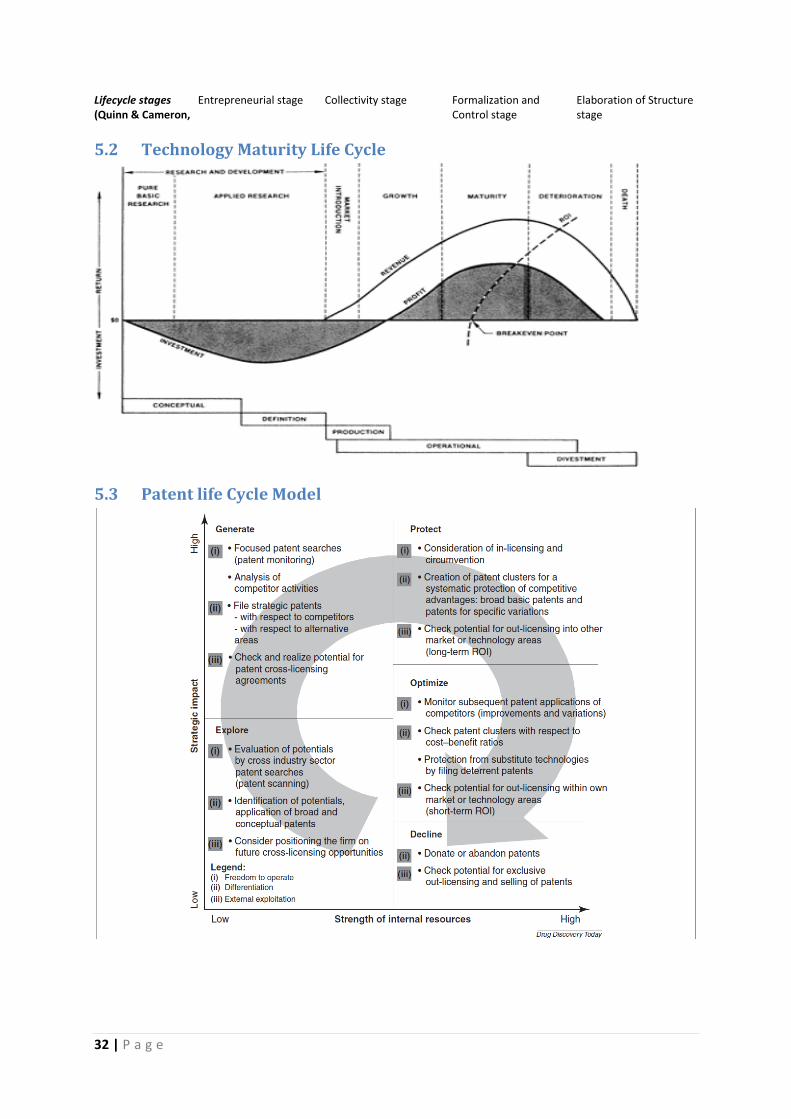
32 | P a g e
Lifecycle stages (Quinn & Cameron,
Entrepreneurial stage Collectivity stage Formalization and Control stage
Elaboration of Structure stage
5.2 Technology Maturity Life Cycle
5.3 Patent life Cycle Model

33 | P a g e
5.4 Raw Data
Tech_Field IPC Subclass Grants Appeals LicenseOfRight Revoked Ceased 34 B81B 2504 0 2 0 42 34 B81C 1605 1 2 0 13 34 G11C 15095 49 46 9 3336 34 H01C 2666 15 10 13 518 34 H01F 12583 74 25 46 1897 34 H01G 6306 25 8 16 809 34 H01J 26034 85 70 44 5348 34 H01L 100000 561 305 99 12308 35 G09B 6609 28 4 8 566 35 G09C 650 4 1 0 23 35 H01P 5534 15 27 14 1033 35 H01Q 15798 67 29 32 2197 35 H01S 12987 62 37 23 2256 35 H02J 13498 44 26 16 948 35 H03B 2067 5 11 4 327 35 H03C 819 1 0 1 181 35 H03D 2476 5 7 6 499 35 H03F 7117 27 22 11 1315 35 H03G 3445 14 21 6 606 35 H03H 7486 21 20 12 1339 35 H03M 11480 71 46 15 1695 35 H04B 58764 165 153 70 4809 35 H04J 15338 21 35 16 959 35 H04K 1636 3 1 1 106 35 H04L 100000 215 608 106 6644 35 H04M 34647 137 47 43 2803 35 H04Q 45025 140 89 93 3804 35 H05K 27310 73 72 44 3843 36 G03H 1814 6 1 3 120 36 H03J 1459 15 22 6 341 36 H04H 4996 37 19 14 234 36 H04N 86176 503 687 219 10527 36 H04R 12150 40 31 37 1115 36 H04S 1864 5 14 2 117 16 A24B 1176 6 0 3 203 16 A24D 1467 18 0 10 230 16 A24F 10791 3 0 0 118 10 B01J 43158 320 12 150 4206 10 B09B 2979 31 2 12 280 10 B09C 919 1 0 0 54 10 B29B 5353 35 8 15 615 10 C01B 21222 180 12 94 2767

34 | P a g e
10 C01C 881 3 0 0 87 10 C01D 729 1 0 1 82 10 C01F 3043 32 0 13 411 10 C01G 729 31 1 5 706 10 C02F 20266 110 4 36 2315 10 C05B 233 0 0 0 14 10 C05C 453 6 0 1 34 10 C05D 530 0 0 0 38 10 C05F 1975 5 0 1 242 10 C05G 1086 1 0 1 95 10 C07B 5530 7 0 6 366 10 C07C 72690 448 5 306 16582 10 C07F 17921 68 0 38 3125 10 C07G 867 2 0 0 102 10 C08B 5058 63 0 23 646 10 C08C 1302 4 0 3 183 10 C08F 37307 389 3 250 7398 10 C08G 41938 352 9 164 7340 10 C08J 28248 180 3 87 2819 10 C08K 30413 135 6 68 2333 10 C08L 52504 358 5 206 6195 10 C09B 8549 58 2 38 2488 10 C09C 4511 60 1 25 587 10 C09D 30141 179 7 130 3243 10 C09K 22912 108 14 55 2207 10 C10B 1897 9 0 7 266 10 C10C 438 4 0 1 121 10 C10H 19 0 0 0 5 10 C10J 2003 15 0 6 219 10 C10K 559 1 0 1 44 10 C12S 347 1 0 0 8 10 C25B 4237 34 0 10 696 10 F17C 3605 18 5 5 400 10 F17D 980 1 0 3 83 10 F25J 2365 79 3 46 411 10 G21F 2361 19 3 7 542 44 A63F 9766 34 7 4 868 44 A63G 938 6 0 1 133 44 A63H 4317 4 2 2 826 44 A63J 291 0 1 0 30 44 A63K 85 0 0 0 24 44 B43K 1769 8 1 5 390 44 B43L 850 4 0 1 186 44 B44D 873 3 2 0 114 44 B62B 3542 9 4 4 679 44 B68G 419 17 0 2 79

35 | P a g e
44 C06F 25 0 0 0 7 44 F23Q 1288 9 0 7 244 44 G10B 34 0 0 0 0 44 G10C 282 1 0 0 37 44 G10D 1160 1 0 0 215 44 G10F 92 0 0 0 15 44 G10G 343 1 0 0 50 44 G10H 2204 4 13 2 289 44 A41G 454 0 0 1 61 44 A42B 1838 5 1 2 287 44 A44C 2159 5 0 2 418 44 A45B 875 2 1 0 193 44 A45F 1622 2 0 1 170 44 A46B 3469 29 2 11 505 44 A46D 683 9 0 3 138 44 A47B 8892 36 6 15 1540 44 A47C 9654 42 4 15 1620 44 A47D 1144 3 0 1 208 44 A47F 4371 26 0 7 551 44 A63B 12754 23 5 6 2266 44 A63C 4796 40 0 2 420 44 A63D 304 0 1 0 106 13 A61K 100000 1640 5 1072 1608 13 A61P 87235 26 0 5 62 13 C07D 100000 379 1 146 17962 13 C07H 21841 70 0 30 1542 13 C07J 2899 29 0 6 655 13 C07K 65896 172 0 75 3160 13 C12N 92768 653 3 218 5389 13 C12P 29498 105 0 43 1670 13 C12Q 50136 150 4 56 2108

36 | P a g e
5.5 Stepwise regression analyses output
Model Summaryc
Model R R Square
Adjusted R
Square
Std. Error of
the Estimate
Change Statistics
R Square
Change F Change df1 df2
Sig. F
Change
1 ,640a ,409 ,404 85,444 ,409 80,967 1 117 ,000
2 ,971b ,944 ,943 26,463 ,535 1103,780 1 116 ,000
a. Predictors: (Constant), Grants
b. Predictors: (Constant), Grants, Appeals
c. Dependent Variable: Revoked
ANOVAc
Model
Sum of
Squares df
Mean
Square F Sig.
1 Regression 591106,522 1 591106,522 80,967 ,000a
Residual 854172,033 117 7300,616
Total 1445278,555 118
2 Regression 1364047,579 2 682023,790 973,948 ,000b
Residual 81230,975 116 700,267
Total 1445278,555 118
a. Predictors: (Constant), Grants
b. Predictors: (Constant), Grants, Appeals
c. Dependent Variable: Revoked
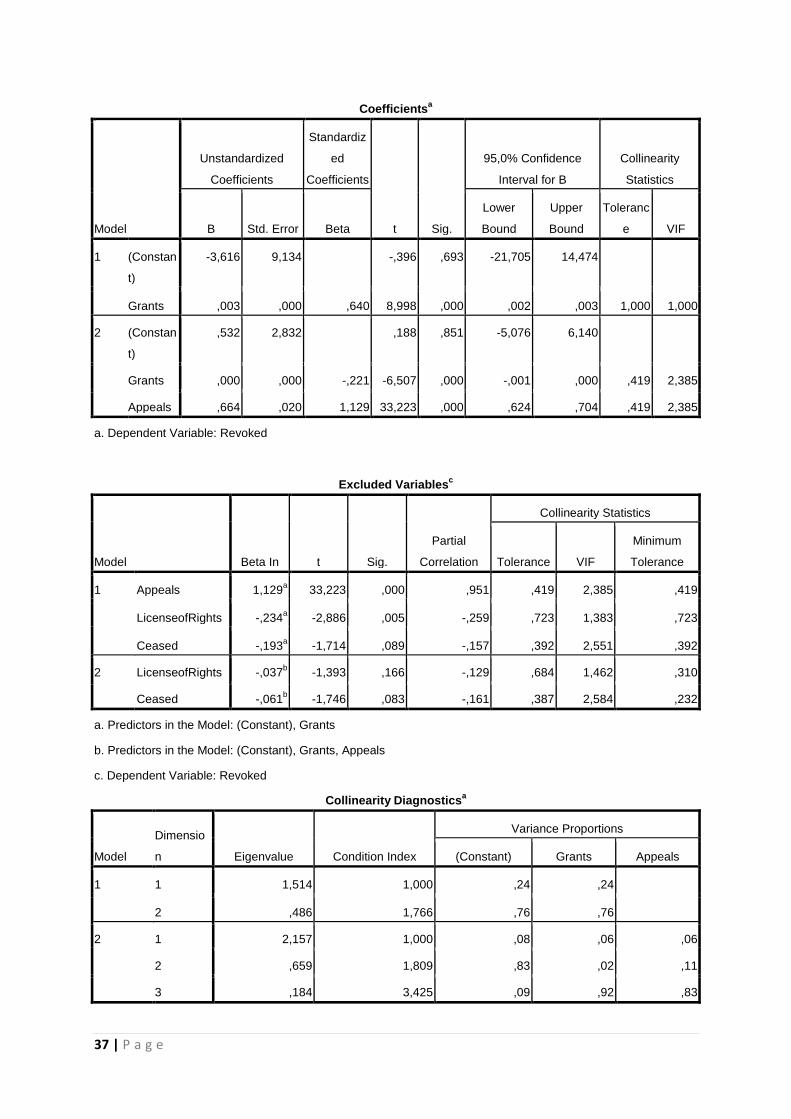
37 | P a g e
Coefficientsa
Model
Unstandardized
Coefficients
Standardiz
ed
Coefficients
t Sig.
95,0% Confidence
Interval for B
Collinearity
Statistics
B Std. Error Beta
Lower
Bound
Upper
Bound
Toleranc
e VIF
1 (Constan
t)
-3,616 9,134 -,396 ,693 -21,705 14,474
Grants ,003 ,000 ,640 8,998 ,000 ,002 ,003 1,000 1,000
2 (Constan
t)
,532 2,832 ,188 ,851 -5,076 6,140
Grants ,000 ,000 -,221 -6,507 ,000 -,001 ,000 ,419 2,385
Appeals ,664 ,020 1,129 33,223 ,000 ,624 ,704 ,419 2,385
a. Dependent Variable: Revoked
Excluded Variablesc
Model Beta In t Sig.
Partial
Correlation
Collinearity Statistics
Tolerance VIF
Minimum
Tolerance
1 Appeals 1,129a 33,223 ,000 ,951 ,419 2,385 ,419
LicenseofRights -,234a -2,886 ,005 -,259 ,723 1,383 ,723
Ceased -,193a -1,714 ,089 -,157 ,392 2,551 ,392
2 LicenseofRights -,037b -1,393 ,166 -,129 ,684 1,462 ,310
Ceased -,061b -1,746 ,083 -,161 ,387 2,584 ,232
a. Predictors in the Model: (Constant), Grants
b. Predictors in the Model: (Constant), Grants, Appeals
c. Dependent Variable: Revoked
Collinearity Diagnosticsa
Model
Dimensio
n Eigenvalue Condition Index
Variance Proportions
(Constant) Grants Appeals
1 1 1,514 1,000 ,24 ,24
2 ,486 1,766 ,76 ,76
2 1 2,157 1,000 ,08 ,06 ,06
2 ,659 1,809 ,83 ,02 ,11
3 ,184 3,425 ,09 ,92 ,83

38 | P a g e
Excluded Variablesc
Model Beta In t Sig.
Partial
Correlation
Collinearity Statistics
Tolerance VIF
Minimum
Tolerance
1 Appeals 1,129a 33,223 ,000 ,951 ,419 2,385 ,419
LicenseofRights -,234a -2,886 ,005 -,259 ,723 1,383 ,723
Ceased -,193a -1,714 ,089 -,157 ,392 2,551 ,392
2 LicenseofRights -,037b -1,393 ,166 -,129 ,684 1,462 ,310
Ceased -,061b -1,746 ,083 -,161 ,387 2,584 ,232
a. Predictors in the Model: (Constant), Grants
b. Predictors in the Model: (Constant), Grants, Appeals
a. Dependent Variable: Revoked
5.6 scatterplot with outliers

39 | P a g e
6 Bibliography Alturki, A., G. G. Gable, et al. (2011). A Design Science Research Roadmap. DESRIST'11, Springer-Verlag Berlin, Heidelberg ©2011. Bader, M. A., O. Gassmann, et al. (2012). "Getting the most out of your IP – patent management along its life cycle." Drug Discovery Today 17(7/8). Barab, S. and K. Squire (2009). "Design-Based Research: Putting a Stake in the Ground." Journal of the Learning Sciences 13(1): 14. Baskerville, R. and J. V. Pries-Heje, J. (2009). Soft Design Science Methodology. Proceedings of the 4th International Conference on Design Science Research in Information Systems and Technology. Malvern, PA: ACM: 9-20. Belderbos, R., V. Gilsing, et al. (2011). "Technology alliances in emerging economies: Persistence and interrelation in European firms' alliance formation." Working Paper #2011-026. Berger, F., K. Blind, et al. (2012). "Risk factors and mechanisms of technology and insignia copying—A first empirical approach." Research Policy 41: 376-390. Bittner, P. and B. Lundsager. "Trolls and the Five Forces (White Paper)." from http://i3pm.org/files/misc/trolls_and_the_five_forces.pdf. Blind, K., J. Edler, et al. (2006). "Motives to patent. Empirical evidence from Germany." Research Policy 35: 655-672. Cremers, K. (2004). "Determinants of Patent Litigation in Germany." EW - Centre for European Economic Research Discussion Paper No. 04-072 Deng, Y. (2011). "A dynamic stochastic analysis of international patent application and renewal processes." International Journal of Industrial Organization 29. Dickens, D. T. (2004). "The ECLA Classification System." World Patent Information 16(4): 28-32. Gregor, S. (2006). "The Nature of Theory in Information Systems." MIS Quarterly 30(3): 611-642. Grundy, T. (2006). "Rethinking and reinventing Michael Porter’s five forces model." Strategic Change 15: 213-229. Hall, B. H., A. B. Jaffe, et al. (2001). THE NBER PATENT CITATIONS DATA FILE: LESSONS, INSIGHTS AND METHODOLOGICAL TOOLS. N. B. O. E. RESEARCH. 1050 Massachusetts Avenue Cambridge, MA 02138. Hammond, J. (2010). C.K. Claridge, Inc., Harvard Business School. Hevner, A., S. T. March, et al. (2004). "Design Science in Information Systems Research." MIS Quarterly 28(1): 75-105. Jensen, P. H. and E. Webster (2006). "Firm Size and the Use of Intellectual Property Rights." The economic record 82(256): 44-55.

40 | P a g e
Johnson, D. K. (2002). "The OECD Technology Corcordance (OTC): Patents by Industry of Manufacture and Sector of Use." OECD Science, Technology and Industry Working Papers. Kortum, S. and J. Putnam (1997). "Assigning Patents to Industries: Tests of the Yale Technology Concordance." Economic Systems Research 9(2): 161-176. Lanjouw, J. O., A. Pakes, et al. (1998). "How to Count Patents and Value Intellectual Property:The Uses of Patent Renewal and Application Data." The Journal of Industrial Economics 46(4): 405-432. Lerner, A. I. P. P. J. (2011). Essentials of intellectual property. Hoboken, New Jersey, John Wiley & Sons, Inc. Makarov, M. (2006). "The eighth edition of the IPC." World Patent Information 28: 122-126. Mäkinen, I. (2007). The propensity to patent: An empirical analysis at the innovation level*. the EPIP-2007 Conference. Lund, Sweden. Maurseth, P. B. and B. Verspagen (2002). "Knowledge Spillovers in Europe: A Patent Citations Analysis*." Scand J. of Economics 104(3): 531-545. McLaren, T. and P. Buijs (2011). A Design Science Approach for Developing Information Systems Research Instruments. 6th International Conference on Design Science Research in Information Systems and Technology (DESRIST 2011). Milwaukee, USA. Orsenigo, L. and V. Sterzi (2010). "Comparative Study of the Use of Patents in Different Industries." Kites 33. Peffers, K., T. Tuunanen, et al. (2007). "A design science research methodology for Information Systems Research." Journal of Management Information Systems 24(3): 45-77. . Phillips, J. (1982). "The english patent as a reward for invention: The importation of an idea." The Journal of Legal History 3(1): 71-79. PriceWaterhouseCoopers (2011). "2011 Patent Litigation Study." from http://www.pwc.com/us/en/forensic-services/publications/assets/2011-patent-litigation-study.pdf. Purao, S. (2002). "Design Research in the Technology of Information Systems." Working Paper. Scherer, F. M. (1983). "THE PROPENSITY TO PATENT*." International Journal of Industrial Organization 1: 107-128. Schmoch, U., R. Frietsch, et al. (2003). "Linking Technology Areas to Industrial Sectors." Final Report to the European Commission, DG Research Shih, W. (2010). Carrot or Stick? Getting Paid for Innovation at Tessera Technologies, Harvard Business School. Silverman, B. S. (1998). Technological Resources and the Direction of Corporate Diversification: Toward an Integration of the Resource-Based View and Transaction Cost Economics. H. B. S. W. P. #99-019. Morgan Hall 243
41 | P a g e
Soldiers Field Boston, MA 02163, Harvard Business School. Silverman, B. S. (2004). "Documentation for International Patent Classification – U.S. SIC concordance." from http://www.rotman.utoronto.ca/~silverman/ipcsic/documentation_IPC-SIC_concordance.htm. Switzer, G. E., S. R. Wiesniewski, et al. (1999). "Selecting, developing, and evaluating research instruments." Soc Psychiatry Psychiatr Epidemiol 34: 399-409. Teece, D. J. (1986). "Profiting from Technological Innovation - Implications for Integration, Collaboration, Licensing and Public-Policy." Research Policy 15(6): 285-305. van Zeebroeck, N. and S. J. H. Graham (2011). "Comparing Patent Litigation across Europe: A First Look*." from http://papers.ssrn.com/sol3/papers.cfm?abstract_id=1924124. Verspagen, B., T. van Moergastel, et al. (1994). "MERIT concordance table: IPC - ISIC (rev. 2)." MERIT Research Memorandum 2/94-004. WIPO (2011) INTERNATIONAL PATENT CLASSIFICATION(version 2011). Guide to the IPC Wongel, H. and A. Farassopoulos (2012). "Changes to the IPC effective from January 2011." World Patent Information 34: 4-7.