measuring performance on windows embedded...
TRANSCRIPT

Measuring Performance on Windows Embedded Standard 7
Contents Summary ....................................................................................................................................................... 1
Introduction .................................................................................................................................................. 1
Using the Windows Performance Analysis Toolkit ....................................................................................... 2
How Performance Measurement Works .................................................................................................. 2
Measure Runtime Performance ................................................................................................................ 2
Measure State Transition Performance .................................................................................................... 4
Example: Analyze CPU Usage ........................................................................................................................ 6
Conclusion ..................................................................................................................................................... 9
Summary The Windows Performance Analysis Toolkit is a powerful tool for measuring and diagnosing
performance issues in Windows Embedded Standard 7. By using this tool that you can capture and view
performance information for almost any part of the system. This includes your own applications.
Introduction Performance is a very important aspect to all embedded systems. The level of performance for any
given system depends heavily on the design, regardless of the operating system being used. An
important part of the design process is using tools to assess performance problems and performance
opportunities. Many times developers must manually instrument the operating system and programs
with performance metrics, and write tools to collect and analyze these metrics. Fortunately Windows
Embedded Standard 7 is built on Windows 7 and therefore takes advantage the existing instrumentation
and powerful free tools that exist for Windows 7.
To improve the performance of an embedded system that is running Windows Embedded Standard 7
three primary steps are needed. The first is to determine key scenarios that are important from a
performance standpoint. The second step is to measure system activities during the execution of these
scenarios, and the third is to analyze the results for opportunities to improve the performance.
Starting with Windows Embedded Standard 7 there are new powerful tools that allow for better
measurement and diagnosis of performance issues. The dependencies required to run them are built

into the Windows Embedded Foundation Core (every Windows Embedded Standard 7 image contains
the Foundation Core) so no special steps are required to run them (with one exception which is
discussed in the “Measure State Transition Performance” section).
Using the Windows Performance Analysis Toolkit The flagship tool for measuring performance in the Windows 7 code base is called the Windows
Performance Analysis (WPA) Toolkit and comes as part of the Windows 7 SDK. The WPA Toolkit enables
you to measure most aspects of performance on a system. You do not have to download the complete
SDK to access this tool. It can be selected by itself to minimize download time.
The Windows 7 SDK is available here:
http://www.microsoft.com/downloads/details.aspx?FamilyID=c17ba869-9671-4330-a63e-
1fd44e0e2505&displaylang=en
The WPA Toolkit is a part of the “Developer Tools” option in the Windows 7 SDK.
How Performance Measurement Works Throughout Windows Embedded Standard 7 events are signaled called ETW (Event Tracing for
Windows) Events. These events are provided by hundreds of different providers. One of the core
providers is the kernel itself. Disk read/write events, task switching events, interrupt subroutines (ISR’s)
entry events, Deferred Procedure Calls (DPCs) events are only a few examples. These events are
collected to create event trace logs for analysis. The WPA Toolkit provides tools to capture and view
these traces.
There are two main executables for capturing and viewing traces. The first is xperf.exe which is used to
capture runtime traces, and to start the Graphical User Interface on traces already captured. The
second is xbootmgr.exe which is similarly used to capture traces for state transitions such as restart,
shutdown, hibernate, sleep, and resume, but is not used to view the traces. First we will examine run
time traces which are captured by using xperf.exe.
Measure Runtime Performance As soon as the WPA Toolkit is installed, you can run it to capture a trace. First we willl run a basic trace
used for general performance investigations using xperf.exe. To execute a trace capture, type the
following from an elevated command prompt:
C:\Program Files\Microsoft Windows Performance Toolkit\xperf –on DiagEasy
Now execute whatever scenarios you are investigating.
When you are finished executing your scenarios, stop the trace and merge all the data together into an
“Event Trace Log” file by typing following from an elevated command prompt:
C:\Program Files\Microsoft Windows Performance Toolkit\xperf –d MyTrace.etl

The xperf.exe application will merge all the data it has collected into the MyTrace.etl file. This is a binary
collection of all the trace events. Be aware that these files can become very large for longer durations.
You can now view the data by just typing:
C:\Program Files\Microsoft Windows Performance Toolkit\xperf MyTrace.etl
This opens the GUI used to examine the data graphically. Figure 1 shows an example of what an event
trace log file looks like in the xperfviewer tool. In this view we can see the “CPU Usage by CPU”, the
“CPU Usage by Process”, and the “CPU Usage by Thread”. There are many more views under this one
and you can select which views by clicking the pull out arrow on the left side of the screen.
Figure 1 Viewing an Event Trace Log

In addition to viewing the graphs, you can view details about the graph by selecting a period of time
(click drag to select), right-clicking on it, and selecting “Summary Table” or “Detail Graph” depending on
which chart you are viewing.
In Figure 2 you can see how to select which graphs to view. Clicking the graph selection pullout midway
down the left side of the screen lets you select which graphs to view and compare.
More details about how to capture runtime traces and how to use the GUI are available in the Help file
provided by the WPA Toolkit.
Figure 2 Selecting Which Graphs to View
Measure State Transition Performance In addition to measuring runtime performance using xperf.exe, you can use xbootmgr.exe to measure
performance metrics for boot, shutdown, suspend, hibernate, and resume.

This works much as xperf does. At the elevated command prompt, you can type the following.
C:\Program Files\Microsoft Windows Performance Toolkit\xbootmgr –trace boot –numRuns 3 –
resultPath c:\myBootTraces
The xbootmgr.exe program will notify the user that it is shutting down the system. It will then restart
three times (-numRuns 3) and collect trace information about the boot process every time. This data
can then be further parsed for relevant boot data using the “boot” action. The “boot” action will parse
the .etl trace file for data which is pertinent to the boot process. This includes IO times, process load
times, and the boot interval times overall. It also includes several key boot metrics such as
“BootDoneViaPostExplorer” which is the overall time in mS it took the system to reach a usable state
plus 10 seconds. The 10 seconds are 10 accumulated seconds of idle time which are subtracted to find
the point at which the user might have started an application or otherwise seen the system as useful.
This is determined by measuring key system resources and establishing when the system became idle
enough for the user to begin effectively using the computer. Here is how to apply the “boot” action on
an .etl trace file captured by the previous command:
C:\Program Files\Microsoft Windows Performance Toolkit\xperf –i c:\myBootTraces\boot_BASE_CSWITCH_1.etl –
o boot1.xml –a boot
The resulting boot.xml file will contain performance information about the boot process. Figure 3 is an
example of one of these files:

Figure 3 Boot Action XML File
In this example the system was effectively booted in “bootDoneViaPostBoot – 10000mS” = 26.699
seconds. You can also view various other information such as which services were started, how long
each service took to start, Plug n Play events, and the duration and IO activity of each interval within the
boot process.
You can experiment with other actions also. To see a complete list of actions you can perform on traces
type:
C:\Program Files\Microsoft Windows Performance Toolkit\xperf –help processing
Example: Analyze CPU Usage One fairly widespread metric of performance is CPU usage. Every embedded system has a CPU, and
every embedded system depends on that CPU to perform tasks in a timely manner. In this example I

will examine the CPU usage during the playback of an audio file in the Zune client application, as I’d like
to know how much of an effect that has on my system, from a CPU usage perspective. To analyze this
scenario, I must take a performance trace while playing back an audio track in zune.exe, and typing this
white paper.
With Microsoft Office Word 2007 running and the Microsoft Zune Client Application playing back an
audio track, I type the following in my elevated command prompt:
C:\Program Files\Microsoft Windows Performance Toolkit\xperf –on DiagEasy
My scenario is typing this sentence, after which I type the following into the command prompt:
C:\Program Files\Microsoft Windows Performance Toolkit\xperf –d zune.etl
Now I have a file that is named zune.etl which I can open by using the xperf.exe application:
C:\Program Files\Microsoft Windows Performance Toolkit\xperf zune.etl
Because I am only interested in CPU related metrics, I pull out the selection bar on the left and clear
everything except for “CPU Usage by CPU”, “CPU Usage by Process”, “CPU Usage by Thread”, and
“Interrupt CPU Usage”. The result is in Figure 4.
Figure 4 Example Trace View
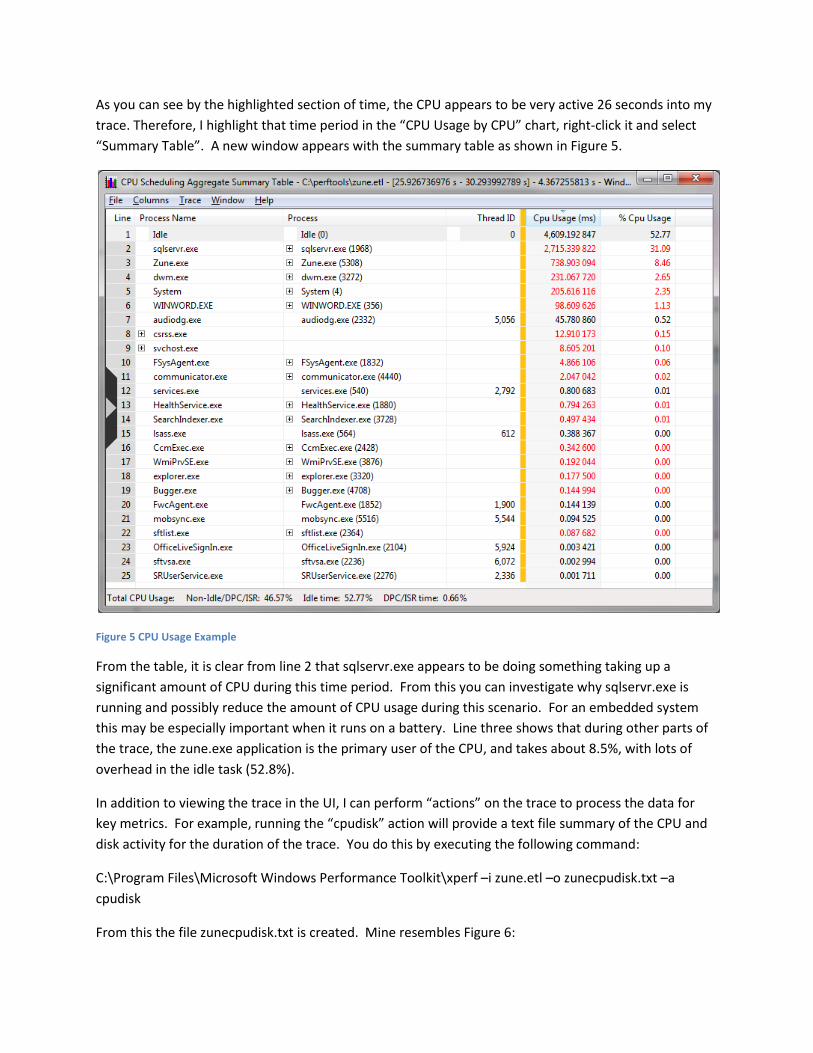
As you can see by the highlighted section of time, the CPU appears to be very active 26 seconds into my
trace. Therefore, I highlight that time period in the “CPU Usage by CPU” chart, right-click it and select
“Summary Table”. A new window appears with the summary table as shown in Figure 5.
Figure 5 CPU Usage Example
From the table, it is clear from line 2 that sqlservr.exe appears to be doing something taking up a
significant amount of CPU during this time period. From this you can investigate why sqlservr.exe is
running and possibly reduce the amount of CPU usage during this scenario. For an embedded system
this may be especially important when it runs on a battery. Line three shows that during other parts of
the trace, the zune.exe application is the primary user of the CPU, and takes about 8.5%, with lots of
overhead in the idle task (52.8%).
In addition to viewing the trace in the UI, I can perform “actions” on the trace to process the data for
key metrics. For example, running the “cpudisk” action will provide a text file summary of the CPU and
disk activity for the duration of the trace. You do this by executing the following command:
C:\Program Files\Microsoft Windows Performance Toolkit\xperf –i zune.etl –o zunecpudisk.txt –a
cpudisk
From this the file zunecpudisk.txt is created. Mine resembles Figure 6:

Figure 6 CPU Disk Action
You must zoom in on this to see it, but it contains average and total information for the trace on CPU
and disk activity. For example, overall the zune.exe application took 8.52% of the CPU time, and 79.35%
of the time was spend idle.
Conclusion The systems and events needed to use the Windows Performance Analysis Toolkit are included in
Windows Embedded Standard 7. This enables embedded systems developers to perform powerful
analysis of performance on their systems. You can find the WPA Toolkit as part of the Windows 7 Client
SDK here.
Solutions and needs vary from one embedded project to another, but good performance stretches
across all categories of embedded systems. These tools are available to aid developers in reaching this
goal of achieving the best possible performance for their Windows Embedded Standard 7 device.