measuring preferences on health system … preferences on health system performance assessment...
TRANSCRIPT

1
MEASURING PREFERENCES ON HEALTH SYSTEM PERFORMANCE ASSESSMENT
Emmanuela Gakidou Christopher JL Murray
Julio Frenk
GPE Discussion Paper Series: No.20
EIP/GPE World Health Organizatiom
Acknowledgements
The authors wish to thank Leonid Andreev for programming the survey on the internet; Jim and Vivienne Duppenthaler for handling the WHO server and dissemination; Phyllida Travis, Joshua Salomon, Steve Pennell, Gary King and Bedhiran Ustun for substantive input; Charles Darby, Felicia Knaul, Ana Mylena Aguilar, Rafael Lozano for helpful comments. We are grateful to Pierre Lewalle and Eduardo Sabaté for translating the questionnaire into French and Spanish.

2
I. Introduction The World Health Organization has developed a framework for assessing the performance of health systems of Member States in a comparable fashion across countries1. Each country is evaluated on the attainment of the goals of health system and on the overall performance of the health system in achieving this goals given available resources.
In assessing the performance of health systems several normative choices have to be made. There are no right or wrong answers with respect to normative issues. To design the indicators of the attainment of the goals of the health system and a measure of composite goal attainment, parameters could have been arbitrarily selected or based on some empirical ascertainment of informed individual preferences. For the World Health Report 2000, the WHO opted to base development of the indicators of goal attainment on the measured preferences of health systems experts and other individuals with an interest in health system performance. This paper reports on the efforts to implement that measurement.
We designed an internet-based interactive questionnaire that elicited the respondents’ preferences on the parameters that go into the measures of attainment and performance of health systems. The survey was administered to WHO staff and was also available to interested individuals on the WHO web site.
We chose to measure preferences of informed individuals rather than the general public for two reasons: 1) the concepts included in the framework are complex and are difficult to differentiate if one is not familiar with the field and the literature; and 2) the choices of the parameters for the indicators of performance involve technical questions, such as choosing between distributions of health, which assume some basic knowledge of public health. The results discussed below reflect a sample of informed preferences – preferences of individuals with an interest and knowledge of the field2.i
The paper is organized into four sections: a brief review of the WHO framework for measuring health system performance in order that the key normative choices can be highlighted; methods; results; and a discussion of the findings and future directions of this work.
II. WHO Framework for Health System Performance Assessmentii
A. Conceptual Framework
The WHO framework for health system performance assessment identifies three main goals on which health systems should be evaluated:
i In political science the term “enlightened preferences” is used in situations such as this. The term implies that individuals who responded have preferences based on expert knowledge and that if the general population had the same knowledge as the experts, they would have the same preferences (see King and Gelman, 1993). ii This section provides a brief synopsis of the framework of health system performance assessment. The purpose is to provide an overview of the definitions of the goals and their components. For more details on the definition and the measurement of the goals see Murray and Frenk (2000).
3
1. Health
The defining goal for the health system is to improve the health of the population. Health includes both premature mortality and non-fatal health outcomes. In this framework, WHO is concerned both with the average level of population health and with the distribution of health within the population, namely health inequalities.
2. Responsiveness
The second main goal is to enhance the responsiveness of the health system to the legitimate expectations of the population for the non-health improving dimensions of their interaction with the health systemiii. Responsiveness expressly excludes the expectations of the public for the health improving dimensions of their interaction, as this is fully reflected in the first goal of population health.
Responsiveness has seven key sub-components: respect for persons and client orientation. Respect for persons captures aspects of the interaction of individuals with the health system that often have an important ethical dimension and is comprised of:
a) Respect for the dignity of the person. Individuals’ interactions with a health system should not violate their basic human rights. Respect for dignity also includes aspects such as courtesy and sensitivity to potentially embarrassing moments(3).
b) Respect for the autonomy of the individual to make choices about his/her own health. Individuals, when competent, or their agents, should have the right to choose what interventions they do and do not receive (4).
c) Respect for confidentiality. In interacting with the health system, individuals should have the right to preserve the confidentiality of their personal health information (5,6).
The second sub-component, client orientation, includes the major components of consumer satisfaction that are not a function of health improvement:
d) Prompt attention to health needs. Prompt attention does not refer to situations where response time may have a direct effect on the health of the individual, but rather aims to capture the fears and concerns that come with long waiting times for diagnosis and treatment.
e) Basic amenities, such as clean waiting rooms or adequate beds and food in hospitals are aspects of care that are often highly valued by the population (7).
f) Access to social support networks for individuals receiving care. An expectation to have access to social support through family and friends during care and recovery is an intrinsically valued attribute. (8).
g) Choice of institution and individual providing care. Individuals may want to select who provides them with healthcare. This concern is most often for the individual provider and only secondarily for the institution providing care.
As with health, society is concerned not only with the average level of responsiveness but also with inequalities in its distribution. This means that we are implicitly interested in differences related to social, economic, demographic and other factors.
iii The term “legitimate” is used to recognize that some individuals may have frivolous expectations for the health system which should not from part of the articulation of this goal (iii).

4
3. Fairness of financial contribution
The third main goal of health systems is fairness in financing and financial risk protection for households (9). To be fair, financing of the health system should address two key challenges. First, households should not become impoverished or pay a catastrophic share of their permanent non-subsistence income to obtain health care. Second, poor households should pay in absolute terms less towards the health system than rich households. Every household should pay a fair share towards the costs of the health system.
We are only concerned with the distribution of the financing mechanism across households. The average level of financing is not an intrinsic goal for the health system; rather, we consider it one of the key policy choices for society. The level of resources invested in the health system is the variable against which goal attainment is compared in order to measure performance.
B. Measuring goal attainment
The first step in assessing performance is the measurement of how much of each goal each country achieves – the level of attainment. This section describes the indicators used to measure attainment for each of the five main goals of health systems.
1. Health
To measure the level of health in a population, WHO has used a measure of healthy life expectancy, the Disability-Adjusted Life Expectancy (DALE). DALEs are a measure that incorporates premature mortality and non-fatal health outcomes in a population and thus reflects the number of years that an individual born today would expect to live in full health.
A detailed description of the methodology used to develop the indicator and estimates for all Member States is provided elsewhere (10,11). Nevertheless, DALE incorporates health state preferences in its calculation. WHO has a major effort to collect health state preferences in multiple populations underway (12). Given this large-scale empirical effort, in the questionnaire used for the present paper there were no questions pertaining to the measurement of the level of health.
2. Health inequalities
In the measurement of health inequalities several normative choices need to be made. The questions on health inequalities were designed to gauge respondents’ preferences on several normative choices made explicit in a framework for the measurement of health inequalities. (13)
In this framework two families of measures are developed that can be modified to take the form of most of the commonly used inequality measures in the literature.
β
α
yn
yyIID
n
i
n
jji
2
1 1
2
∑ ∑= =
−=

5
or
β
α
yn
yyIIM
n
i
n
ji
2
1 1
2
∑ ∑= =
−=
where yi is each individual’s health expectancy, y is the average health expectancy in the population, n is the number of individuals, and α and β are parameters reflecting normative preferences.
There are three normative choices implicit in the choice of an inequality measure:
1. Which family of measures – inter-individual differences (IID) vs. individual-mean differences (IMD)? Inter-individual measures of inequality, such as the Gini coefficient, are calculated based on differences of each individual in the population from everybody else in the population. How individuals are distributed from minimum to maximum is important and all pairs of differences between individuals feed into the measure. In contrast, individual-mean differences measures, such as the variance, compare each individual in the population to the observed mean. These measures are less sensitive to the distribution of individuals in the range of observed values and are more sensitive to the mean of the population. The questionnaire elicits preferences of an IID vs. an IMD measure.
2. Absolute or relative inequality? This normative choice refers to whether the respondent prefers to measure absolute differences between individuals, regardless of the average level of health achieved in the population, or relative differences, which take into account the mean of the population. The parameter β, is the exponent to which the mean is raised in the measurement of inequality. When β is zero, the mean is not included in the inequality measure, and hence, the measure reflects absolute inequalities in the population. The variance is one example of an absolute inequality measure. When β is equal to one the mean is included in the calculation and relative inequality is measured. An example of such a measure is the Gini coefficient. When β is between zero and one the mean is increasingly included in the measure, which becomes increasingly more relative as β gets closer to one. The questionnaire elicits people’s preferences on relative vs. absolute inequality measures, which feed into the choice of the β parameter.
3. How much weight should be given to the ends of the distribution? This normative choice refers to whether extreme values in the distribution should be assigned a larger weight. Some inequality measures such as the Gini coefficient do not differentiate between different parts of the distribution. Others, such as the variance, weigh more the tails of the distribution by raising the absolute difference from the mean to a power greater than one. The parameter α in the equation above reflects this normative choice. When α is one all parts of the distribution are given equal weight. When α is greater than one the tails of the distribution are given a greater weight. There is no limit as to how large α can be. Common measures, such as the variance and the skewness have an α of two and three, respectively.

6
3. Responsiveness
As described in the previous section, responsiveness has seven components, which can be grouped into two categories. Client orientation includes prompt attention, basic amenities, choice of provider and access to social support networks for the patients. Respect for persons includes autonomy, dignity and confidentiality. The normative questions in the choice of a measure of responsiveness of a health system are: 1) the relative weight given to each of the two categories, respect for persons and client orientation; and 2) within client orientation and respect for persons the weights attached to each of the more detailed components. The questionnaire elicits respondent’s preferences for client orientation versus respect for persons and also asks respondents to rank the seven components of responsiveness in order of importance. The use of the survey results to operationalize the measure of responsiveness are described in detail elsewhere (14).
4. Responsiveness inequalities
In addition to the level of responsiveness achieved by health systems, its distribution in the population is also of much interest in the assessment of health system performance. The methods and measures used to calculate inequality in responsiveness are presented elsewhere (15). This questionnaire did not elicit any preferences specific to the measurement of inequalities in responsiveness.
5. Fairness in financial contribution
To measure the degree of fairness in financial contribution to the health system, the survey elicited respondents’ preferences for financing systems, by providing a range of options including highly regressive to progressive mechanisms.
Once the definition of a fair way to finance the health system has been articulated, further normative choices have to be made. The measure developed to capture the fairness of health systems in the financial contributions of households is based on the following summary statistic for a distribution:
125.0*1
n
HFCHFCn
ii∑
=−
α
where HFCi is a measure of each household’s financial contribution to health, calculated according to the definition of a fair way to finance the health system, and HFC is the average across all households in a population of the financial contribution to health. The number of households is denoted by n. The scalar 0.125 is the maximum value that the measure can take and is used to scale the value of the index for all countries between 0 and 1.
The value of the parameter α is a normative choice. The questionnaire included three questions involving trade-offs. The trade-offs involved households becoming impoverished and households accruing large financial burden through paying for health care. The responses to these trade-off questions would help inform the choice of the value of the parameter α, which reflects how much weight is given to households that are at the upper tail of the distribution of expenditure, i.e. households that spend a large share of resources to pay for healthcare. A higher α, will result in a higher

7
inequality index for countries that have households that become impoverished through health care payments.
6. Composite measure of goal attainment
A step in the application of the WHO Framework for Health Systems Performance Assessment is the calculation of a composite measure of overall health system attainment based on the attainment of the five components: average healthy life expectancy, health inequality, average level of responsiveness, responsiveness inequality and the fairness of financial contribution. WHO adopted the simplest form of a composite measure of goal attainment based on the following additive model:
ssponivenesualityHealthIneqHealthComposite Re321 ααα ++=
nontributioFinancialCFairnessoftyssInequalisponsivene 54 Re αα ++
where the sum of the alphas is set equal to one. The questionnaire included several questions to elicit the respondents’ preferences on the relative weights of the five goals. In addition, the questionnaire asked respondents to rank the goals of the health system from least to most important.
II. Methods To measure preferences of informed individuals on the relative importance of health system goals and on the normative choices involved in the measurement of those goals, we designed an interactive, internet-based questionnaire.
Internet as a medium of administering surveys
The internet is growing in popularity as a medium on which surveys are administered(16, 17, 18).
We chose the internet as a way of administering the questionnaire because of its many advantages. First, respondents can be easily assured of anonymity and confidentiality. Second, the internet avoids errors on the part of the interviewers/ administrators, including data-entry errors (since the responses are coded directly into a database), and interviewer bias, arising from deviations from the way the questionnaire is supposed to be administered. Third, the costs of administering an internet-based survey are very low, and much lower than those of a mail or personal interview survey. Fourth, the turnaround time from designing the questionnaire to administering it is very short, as the phase of training interviewers or other types of personnel that are usually associated with the administration of a survey is not applicable in this case. Fifth, a computer-based questionnaire provides the option of interactive graphics and consistency checks that are not possible on a paper survey.
A potential disadvantage of an internet-based survey is the fact that a large majority of internet users are from developed countries and the results are likely to be biased. Because of the remarkable diversity of WHO staff in terms of country of origin and the fact that the WHO website routinely receives hits from developing countries, there was a large number of respondents to this questionnaire from developing countries. The extent of developing country input in this survey is addressed in more detail in the results section. Another disadvantage of internet-based surveys is that the respondents do not have the option of asking for clarification questions as in personal interviews; this is also a disadvantage of mail surveys.

8
Participants/ Respondents
Staff members of the World Health Organization at headquarters and all regional and country offices were encouraged to participate in the survey. The availability of the questionnaire was announced to WHO staff members in an email sent by the Director-General. A reminder email was sent a week after the first message that prompted WHO staff to participate in the survey.
The questionnaire was also placed on the WHO web site in four of the main pages: “What’s new”, “Reports”, “Information sources” and “Health topics”.
The intent was to elicit informed preferences, i.e. preferences of individuals with knowledge in the field. WHO staff members, by nature of their work, are exposed to health system issues constantly and are assumed to have preferences that are more informed than the general public. Internet respondents that visit the WHO web site, particularly the four pages that contained links to the survey, and are willing to participate in a questionnaire are also assumed to have informed preferences. Their interest in the health field is demonstrated by the fact that they visit the WHO web site. By taking the time to participate in a detailed survey, they demonstrate a high degree of interest in the subject of health systems.
The respondents are not a representative sample of any population. Yet, the purpose of this survey was not to describe preferences in a population, but rather to empirically derive a set of weights reflecting normative choices.
Questionnaire development
The questionnaire was developed in three stages in consultation with survey design experts, public health professionals working on issues relevant to the health systems performance framework, and public health professionals who were not directly involved with the development of the framework. The latter group provided useful input on the questionnaire from the perspective of potential respondents, i.e. individuals with an interest in the field but who had not been exposed to the specific issues before.
An early version of the questionnaire on paper was piloted in a group of ethicists and public health professionals with an interest in the field, and on a small group of WHO staff working in the health systems area. The respondents were encouraged to provide detailed comments. Even though the option of anonymity was offered to all respondents, we encouraged participants to volunteer for a one-on-one interview after they had filled the questionnaire. We had detailed interviews with several of the respondents, whose comments contributed to the further development of the questionnaire.
Based on the interviews and comments from the first pilot and the responses, the questionnaire was shortened significantly and some consistency checks were built into the questions, to allow the respondents to reconsider their answers to questions where they had been inconsistent, and thereby provide them with another opportunity to think about the question at hand. As a result of the early pilot, the methods of presenting graphs were changed and the option to make them interactive was added.

9
The new version of the questionnaire was programmed and placed on a website dedicated to the survey. The link to the website was then emailed to a group of 100 WHO staff who were asked to participate in the pilot phase. This pilot was completely confidential and anonymous, but some respondents provided helpful comments.
The questionnaire was finalized based on the comments from the second pilot study. It was then translated into French and Spanish by WHO staff who were familiar with the concepts and terminology and who were native speakers of the languageiv.
Once the questionnaire was programmed in all three languages on the internet, the website link was emailed to all WHO staff, in the Geneva headquarters, the six Regional Offices and all the country offices. A separate email was sent to all WHO staff a week later, encouraging them to participate in the survey. The respondents were assured of confidentiality and anonymity. A comment box was added at the end of the questionnaire and an email address was set up for individuals wanting to ask questions or provide detailed comments. Each of the questions in the questionnaire had the option of being left unanswered.
Annexes 1-4 include the questionnaire in English, French and Spanish in pdf format. The interactive, internet-based questionnaire is available at:
http://www-nt.who.int/whosis/hspa_survey/survey.html
a. General questions
The first eight questions of the survey were aimed at obtaining general information about the respondents. The questions were general enough so that anonymity would not be compromised (particularly among WHO staff) but provided us with a demographic profile of the respondents (age, sex, country of origin, educational attainment) as well as an indication of how they view their health status and when their last interaction with the health system was.
These questions were used to determine if there was any significant relationship between the responses to the normative questions and the demographic characteristics of the respondents.
b. Health system goals comparisons
To elicit relative weights on health system performance the questionnaire included eight questions. Four were interactive pie charts where the respondents were asked to provide relative weights for the goals shown by changing the slice of the pie chart corresponding to each goal. Figure 1 presents an example of a pie chart. This one was used to elicit relative weights between the three main goals: health, responsiveness and financial contribution. The respondents could either enter new values for each of the goals by hand, or click on the “+” and “-” buttons to increase or decrease the value of each goal. The size of the slices in the pie charts changed accordingly to reflect the respondents’ inputs.
iv The authors wish to thank Pierre Lewalle and Eduardo Sabate in the Global Programme on Evidence for Health Policy, WHO, for translating the questionnaire into French and Spanish, respectively.

10
Figure 1. Example of an interactive pie chart: relative weights of health system goals.
The four pie charts elicited relative weights between 1) health, responsiveness and fairness in financing, as demonstrated above, 2) average level of health and health inequalities, 3) average level of responsiveness and responsiveness inequalities, and 4) the two components of responsiveness, client orientation and respect for persons.
These questions were repeated later on in the questionnaire in the form of descriptive – text only – questions with multiple choice answers. There was also a question asking respondents to rank the five goals: health, health inequality, responsiveness, responsiveness inequality and fairness in financing by assigning them numbers from 1 to 5. Respondents were allowed to use the same rank only once.
The answers to these questions determine the relative weights of the five goals that are used in the calculation of the composite health system goal attainment score.
c. Health inequality
The health inequality questions were designed to elicit preferences on the normative choices implicit in inequality measures as described earlier.
In the questionnaire we used hypothetical populations of 5 to 10 individuals in order to depict the implications of the normative choices more clearly. Respondents were asked to pick between two scenarios in which only one thing was changing between the two populations. With their choice respondents were indicating their preferences on one of the parameters of the inequality measure at a time.
There were four questions on the choice between absolute versus relative measure of inequality. Positive and negative measures of health (life expectancy, probability of survival and probability of death) were used to test the consistency of the preferences. Figure 2 presents an example of scenarios that respondents were asked to choose
Health Financial contribution
Responsiveness
33% 33%
34%
Health System
(click on the -/+ buttons or entera new value and press 'Tab')
(click on the -/+ buttons or entera new value and press 'Tab')
(click on the -/+ buttons or entera new value and press 'Tab')
+- -
-
+
+

11
between. Population A and Population B have the same number of people, distributed in the same way around the mean. The means of the two populations are different, though, with Population A having a life expectancy of 20 years, while Population B has a life expectancy of 65 years. Individuals who are of the opinion that health inequality is the same in the two populations are expressing a preference for measuring absolute inequalities. Those who think that the degree of inequality is different in the two populations reveal a preference of relative measures of inequality, as they think of inequality, relative to the mean of the populations. Figure 2. An example of a question eliciting respondents’ preferences for absolute vs. relative measures of inequality.
For the choice of family of measures between individual-mean differences and inter-individual differences two questions were asked. An example is shown in Figure 3. In this scenario the two Populations, A and B, have the same mean life expectancy but the distribution of individuals around that mean is different. The same change occurs in the A and B: one individual with life expectancy at the mean gets moved to the lower end of the distribution and another individual from the mean gets moved to the upper end of the distribution. Respondents who think of the two changes as equal are primarily concerned with individuals in a population relative to the mean. Those who consider the two scenarios to be different are not only concerned with how an individual fares compared to the average, but also with how an individual fares compared to everyone else in their population. Figure 3. An example of a question eliciting preferences for IID vs. IMD measures of inequality.

12
The third normative choice is about whether the tails of a distribution should be weighed more heavily than the mean. The respondents’ preferences were elicited by two questions; one where the health of the individuals affected by the changes was increasing and one where it was decreasing. Figure 4 shows an example of these questions. Again there are two Populations, A and B. The initial populations are identical and in each population one individual gains 5 years of life expectancy while another individual loses 5 years of life expectancy. In Population A the individuals affected by the change are at the ends of the distribution, while in Population B they are not. If the respondents thought that the change in A was larger than the change in B, they expressed a preference the ends of the distribution should be weighed more. If respondents thought the two changes were identical, then they were opting for equal weights to all parts of the distribution.
Figure 4. Example of a question eliciting preferences for relative weighting of outliers in a distribution.
d. Fairness in financial contribution
To measure fairness in financial contribution, a definition of a fair mechanism of financing first needs to be articulated. Respondents in the survey were asked to choose among five mechanisms of financing a health system, ranging from regressive to very progressive.
In addition, in the measurement of the fairness in financial contribution there are normative choices to be made on the measure used. Three questions in the survey addressed the issue of impoverishment through paying for health care. Scenarios were presented that involved trade-offs between households accumulating large financial burdens and households driven to impoverishment.
Consistency checks
We took advantage of internet technology to build consistency checks into the questions. There were three types of consistency checks:
1. Ranking questions: in the two questions where respondents were asked to assign ranks from 1 to the number of choices available (5 for health system goals, 7 for

13
responsiveness) a dialog box appeared if the respondent entered a number twice or entered a number that was greater than the number of choices.
2. Inequality questions: In two sets of questions a dialog box appeared if the respondents’ answer was inconsistent with prior answers they had given. The dialog box had a short vignette about the questions and urged the respondent to reconsider their answer. Consistency was not forced and the respondent had the choice to keep their original answers. The dialog box appeared only once for each set of questions.
3. Health system goals: Implicit consistency checks were built in for the relative weights of health system goals. Respondents were not prompted to reconsider their answers in this case. We asked some of the relative weighting questions in two different ways – a graphical and a verbal form – and checked for consistency in the respondents’ preferences.
III. Results The results are presented five categories. First, a summary of the respondents’ profiles derived from the general and demographic questions is provided and then each of the four categories of questions is analysed: health system goals, responsiveness, health inequalities and fairness in financial contribution. The results shown below refer to the respondents whose answers were consistent within each category of questions.
1. General information about the respondents
We received 1007 responses, of which about half were WHO staff and half were people who visited the WHO website and volunteered to participate in the survey. Almost half of the respondents were female. Respondents from the internet had an average age of 35 to 39 years, while WHO staff who responded were on average 10 years older. On average, respondents had some post-graduate education, as indicated by the fact that the average years of educational attainment was about 18 years. Among WHO respondents, 43 percent of respondents were from developing countries, while that percentage was lower (33%) for internet respondents. Participants came from 125 countries and the majority chose to respond to the questionnaire in English, while about 30% responded in French or Spanish. More details are provided in the following table.
Table 1.1 Demographic composition of respondents WHO staff Respondents
from Internet All
respondents Number of respondents 501 506 1007 Sex -- % Female 47 48 48 Average age (in years) 45-49 35-39 40-45 Average years of education 18.7 17.9 18.4 % from developed countries 57 67 62 Language
% English 68 78 73 % French 18 7 13 % Spanish 13 15 14

14
2. Health system goals Questions 9-18 asked respondents to assign relative weights to health systems goals and rank them. The following table shows the relative weights for each of the main five components, calculated for the sample of consistent respondents.
Table 2.1 Relative weighting of the five main goals of health systems WHO staff Internet
respondents All
respondents Average level of health 24 23 24 Health inequalities 25 25 25 Average level of responsiveness 13 14 13 Responsiveness inequalities 15 16 16 Fairness in financial contribution 22 22 22
The five following tables have results from the regression analysis performed for each of the five main goals. The purpose of these regressions was to ascertain whether there were any systematic differences in the responses according to any of the demographic criteria, or according to self-reported health status and use of health services.
In all five of the main goals, the responses from WHO staff did not differ significantly from those elicited from internet respondents, even after controlling for demographic and other factors (see tables below). In the following tables, it is shown that the relative weights assigned to the five goals of health systems did not change significantly with any of the social or demographic variables, with two exceptions:
1. The weight assigned to the level of health seems to be significantly different in respondents from developed countries than respondents from developing countries. Respondents from developed countries assign a weight to health that is approximately 2.8 percentage points higher than respondents from developing countries. This difference, albeit statistically significant, is not substantively significant in terms of the weights used for each of the five goals in the construction of the composite goal.
2. The weight for responsiveness inequalities shows a similar relationship. Respondents from developed countries assign a weight to responsiveness that is 1.7 percentage points lower than the weight that respondents from developing countries do. This difference is statistically significant, but is not substantively significant.
No other variables appear to have a significant effect on the weight assigned to the five main goals at the 0.01 levelv.
v We selected the 0.01 level of significance because of the large number of regressions run and the number of variables included in them.

15
Table 2.2 Regression results: Weight on level of health as a goal of health systems R-squared 0.0345 Coef. Std. Err t P>|t| [95% Conf. Interval]Sex 0.505 0.941 0.536 0.592 -1.345 2.354 Age 0.496 0.224 2.218 0.027 0.057 0.936 Education 0.000 0.000 -0.065 0.948 0.000 0.000 Self-reported health status -0.492 0.549 -0.895 0.371 -1.571 0.588 Last visit to physician -0.431 0.349 -1.233 0.218 -1.117 0.256 Last hospitalization -0.078 0.433 -0.179 0.858 -0.929 0.774 WHO staff -0.801 0.953 -0.840 0.401 -2.673 1.072 From developed country 2.807 0.921 3.048 0.002 0.997 4.617 Constant 18.797 2.730 6.885 0.000 13.432 24.162
Table 2.3 Regression results: Weight on level of health inequalities as a goal of health systems R-squared 0.0149 Coef. Std. Err t P>|t| [95% Conf. Interval] Sex 0.882 0.872 1.012 0.312 -0.830 2.595 Age -0.304 0.207 -1.470 0.142 -0.711 0.103 Education 0.000 0.000 -0.703 0.482 0.000 0.000 Self-reported health status 0.172 0.506 0.340 0.734 -0.823 1.167 Last visit to physician -0.100 0.322 -0.311 0.756 -0.733 0.532 Last hospitalization 0.490 0.399 1.226 0.221 -0.295 1.275 WHO staff 1.306 0.881 1.482 0.139 -0.425 3.036 From developed country -0.733 0.849 -0.863 0.389 -2.402 0.936 Constant 20.493 2.518 8.138 0.000 15.545 25.442
Table 2.4 Regression results: Weight on level of responsiveness as a goal of health systems R-squared 0.0141 Coef. Std. Err t P>|t| [95% Conf. Interval] Sex -0.871 0.524 -1.661 0.097 -1.900 0.158 Age 0.047 0.128 0.367 0.714 -0.204 0.298 Education 0.005 0.004 1.285 0.199 -0.002 0.011 Self-reported health status 0.522 0.311 1.680 0.093 -0.088 1.131 Last visit to physician 0.107 0.199 0.538 0.591 -0.283 0.497 Last hospitalization -0.132 0.235 -0.562 0.574 -0.594 0.329 WHO staff -0.107 0.540 -0.198 0.843 -1.168 0.954 From developed country -0.560 0.532 -1.054 0.292 -1.605 0.484 Constant 14.460 1.593 9.077 0.000 11.331 17.588
Table 2.5 Regression results: Weight on responsiveness inequalities as a goal of health systems R-squared 0.0238 Coef. Std. Err t P>|t| [95% Conf. Interval] Sex -0.899 0.600 -1.498 0.135 -2.078 0.279 Age 0.124 0.146 0.848 0.397 -0.163 0.412 Education -0.001 0.004 -0.234 0.815 -0.009 0.007 Self-reported health status 0.709 0.356 1.993 0.047 0.010 1.407 Last visit to physician 0.283 0.227 1.242 0.215 -0.164 0.729 Last hospitalization -0.033 0.269 -0.122 0.903 -0.561 0.496 WHO staff 0.135 0.619 0.218 0.827 -1.080 1.350 From developed country -1.673 0.609 -2.746 0.006 -2.869 -0.476 Constant 15.833 1.824 8.679 0.000 12.251 19.416

16
Table 2.6 Regression results: Weight on fairness in financial contribution as a goal of health systems R-squared 0.0457 Coef. Std. Err t P>|t| [95% Conf. Interval] Sex 0.537 0.954 0.563 0.574 -1.337 2.410 Age -0.547 0.234 -2.342 0.020 -1.006 -0.088 Education -0.116 0.062 -1.880 0.061 -0.238 0.005 Self-reported health status 0.186 0.559 0.333 0.740 -0.912 1.284 Last visit to physician 0.512 0.349 1.467 0.143 -0.174 1.198 Last hospitalization -0.840 0.407 -2.063 0.040 -1.641 -0.040 WHO staff 0.227 1.000 0.227 0.820 -1.738 2.193 From developed country 1.779 0.975 1.826 0.069 -0.136 3.694 Constant 32.116 2.906 11.053 0.000 26.406 37.825
The following table shows the results from the ranking question on the five goals, among consistent respondents. From the rankings, 1 being most important and 5 being least important, it is clear that most people consider health (both average level and health inequalities) as more important than fairness in financial contribution, which appears to be more important than the average level and inequalities in responsiveness.
Table 2.7 Ranks assigned to each of the five main goals % respondents who assigned rank 1 2 3 4 5 Average level of health 48 19 14 12 8 Health inequalities 36 32 16 11 5 Average level of responsiveness 3 18 20 27 32 Responsiveness inequalities 3 19 20 31 26 Fairness in financial contribution 13 12 29 17 29
3. Responsiveness
The responsiveness section of the questionnaire elicited preferences for relative weights between average level versus inequalities in responsiveness, and between client orientation (including basic amenities, access to social support networks, prompt attention and choice of provider of care) and respect for persons (which includes confidentiality, dignity and autonomy). There was also a question that asked respondents to rank the seven components of responsiveness in order of relative importance, with 1 being the most important and 7 being the least important.
Client orientation got a slightly larger weight than respect for persons and inequalities in responsiveness a larger weight than the average level of responsiveness. The tables below show the relative weights assigned by WHO staff, internet respondents and all respondents combined. There was no significant difference between the responses of WHO staff and those from internet participants.
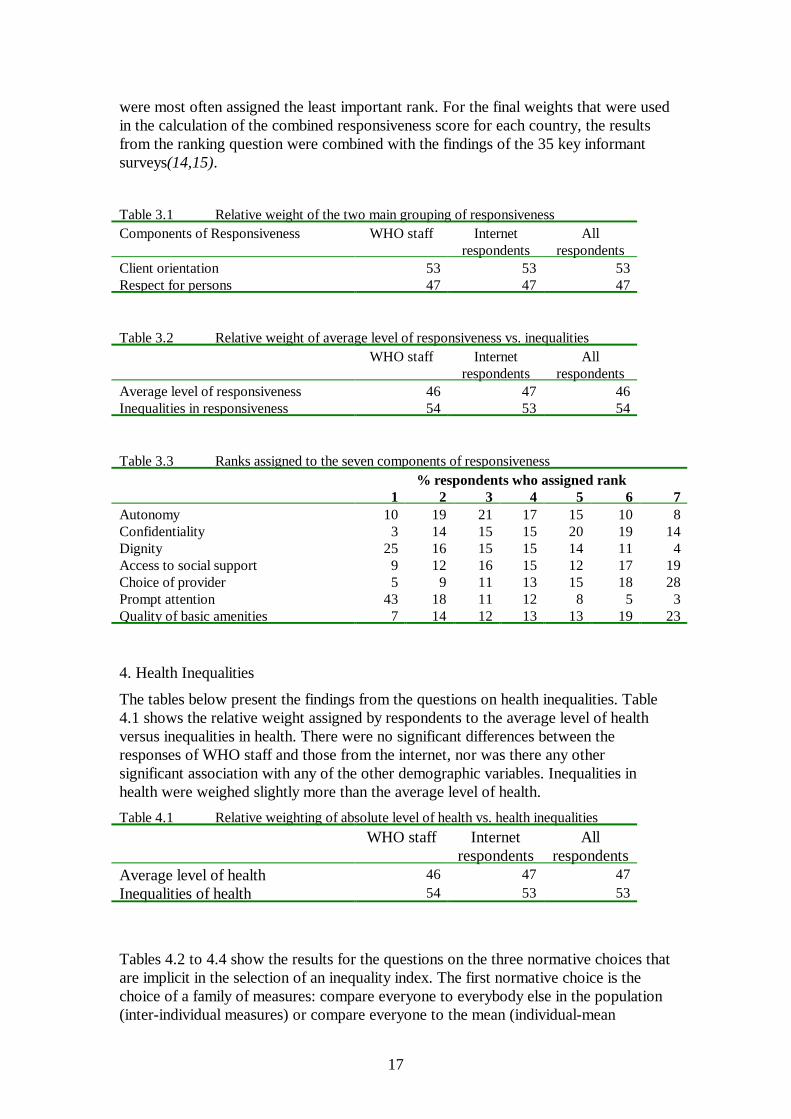
Table 3.3 shows the results of the question asking respondents to rank the seven components of responsiveness. The ranks range from 1 to 7, with one being the most important and 7 the least important. Prompt attention and respect for dignity were most frequently assigned the most important rank among the seven components while choice of provider and the quality of basic amenities were the two components that
17
were most often assigned the least important rank. For the final weights that were used in the calculation of the combined responsiveness score for each country, the results from the ranking question were combined with the findings of the 35 key informant surveys(14,15).
Table 3.1 Relative weight of the two main grouping of responsiveness Components of Responsiveness WHO staff Internet
respondents All
respondents Client orientation 53 53 53 Respect for persons 47 47 47 Table 3.2 Relative weight of average level of responsiveness vs. inequalities WHO staff Internet
respondents All
respondents Average level of responsiveness 46 47 46 Inequalities in responsiveness 54 53 54 Table 3.3 Ranks assigned to the seven components of responsiveness % respondents who assigned rank 1 2 3 4 5 6 7 Autonomy 10 19 21 17 15 10 8 Confidentiality 3 14 15 15 20 19 14 Dignity 25 16 15 15 14 11 4 Access to social support 9 12 16 15 12 17 19 Choice of provider 5 9 11 13 15 18 28 Prompt attention 43 18 11 12 8 5 3 Quality of basic amenities 7 14 12 13 13 19 23 4. Health Inequalities
The tables below present the findings from the questions on health inequalities. Table 4.1 shows the relative weight assigned by respondents to the average level of health versus inequalities in health. There were no significant differences between the responses of WHO staff and those from the internet, nor was there any other significant association with any of the other demographic variables. Inequalities in health were weighed slightly more than the average level of health.
Table 4.1 Relative weighting of absolute level of health vs. health inequalities WHO staff Internet
respondents All
respondents Average level of health 46 47 47 Inequalities of health 54 53 53
Tables 4.2 to 4.4 show the results for the questions on the three normative choices that are implicit in the selection of an inequality index. The first normative choice is the choice of a family of measures: compare everyone to everybody else in the population (inter-individual measures) or compare everyone to the mean (individual-mean

18
measures). A large majority of respondents to the questionnaire (about 76%) preferred a measure that was calculated by measuring the differences in health between all individuals in the population. The responses to this question did not differ significantly according to any of the demographic characteristics of the respondents.
Table 4.3 shows the results for the second normative choice: should the measure of inequality reflect absolute inequalities in the population or relative inequalities? The responses to this question showed significant differences between WHO staff and internet respondents and also varied significantly between male and female respondents. Table 4.4 shows the results from the logistic regression on a number of demographic variables that might be associated with a preference for an absolute versus relative measure of inequality. Being female is associated with a lower probability of preferring an absolute measure of inequality. WHO staff also had a higher probability of preferring an absolute measure of inequality. Respondents from developed countries also showed a higher probability of choosing an absolute measure of inequality, however this relationship was not significant at the 0.01 level.
To facilitate interpretation of the logistic regression results, Table 4.5 provides the estimates of the probability of preferring an absolute measure of inequality based on the logistic regression including the mean values for age, education, self-reported health status, last visit to physician, last hospitalization but for varying for sex, developed country versus developing country and WHO versus internet. The probability varies widely from 0.24 for a developing country female on the internet to 0.66 for a developed country male from WHO. This variation is both statistically and substantively significant. As noted in Gakidou et al.(11), however, the ranking of countries based on inequality of child survival in the World Health Report 2000 is largely insensitive to this range of absolute to relative inequality.
Preferences on the third normative choice – whether to give more weight to the tails of the distribution – are shown in Table 4.6. A large majority of respondents preferred a measure that puts more weight on individuals that are at either end of the distribution. Therefore, if there is a sub-group of the population with extremely good health or a sub-group with extremely bad health, the inequality measure would be very sensitive to the differences between individuals in this group and the rest of the population.
Table 4.2 Choice of family of measure for inequality index Family of measure WHO staff Internet
respondents All
respondents Inter-individual measures 77 75 76 Individual-mean measures 23 25 24 Table 4.3 Relative weighting of absolute vs. relative health inequalities WHO staff Internet
respondents All
respondents Relative 47 61 54 Absolute 53 39 46 Table 4.4 Logistic regression results on preference for an absolute measure of inequality

19
Coef. Std. Err t P>|t| [95% Conf. Interval] Sex 0.672 0.207 3.244 0.001 0.266 1.078 Age -0.041 0.049 -0.842 0.400 -0.137 0.055 Education 0.000 0.000 -0.481 0.630 0.000 0.000 Self-reported health status 0.041 0.119 0.346 0.729 -0.192 0.275 Last visit to physician -0.052 0.076 -0.690 0.490 -0.201 0.096 Last hospitalization -0.109 0.094 -1.154 0.248 -0.294 0.076 WHO staff 0.687 0.209 3.292 0.001 0.278 1.097 From developed country 0.508 0.202 2.513 0.012 0.112 0.905 Constant -1.016 0.597 -1.701 0.089 -2.186 0.155 Table 4.5 Estimated probability of preferring an absolute measure of inequality,
based on logistic regression Males WHO Internet Developed 0.66 0.51 Developing 0.52 0.37
Females Developed 0.50 0.35 Developing 0.36 0.24 Table 4.6 Relative weighting of the tails of the distribution WHO staff Internet
respondents All
respondents More weight at the tails 81 81 81 Equal weights for all parts of the distribution 19 19 19
5. Fairness of financial contribution
The final set of questions were aimed at eliciting preferences for the choice of indicator for fair financing. Table 5.1 shows the responses to the question regarding the choice of a financing mechanism for a health system. The responses to this question did not vary significantly according to any of the demographic variables and were very similar between WHO staff members and respondents from the internet.
Based on these responses, a fair financing mechanism for a health system was selected to be a system where each household contributed an equal share of its disposable income, where disposable income was defined to be income left over after expenditures on food.
In terms of the fairness in financial contribution indicator described earlier, this choice meant defining HFC as the ratio for each household of the total health expenditure in a year to the household’s capacity to pay, where capacity to pay refers to money left over after the household’s expenditure on food.
Tables 5.2 to 5.4 show the results of the trade-off questions on financial burden accrued from health expenditure. When faced with a choice between distributing the burden of health finance among two households as opposed to concentrating the burden in a single household, more than 70% of respondents voted in favor of

20
distributing the burden across two households. This preference is robust to varying the health financing burden between 25% and 100% of household disposable income. This suggests a strong preference for protecting individual households form catastrophic expenditures and for sharing the burden of health finance across families. The index of fairness in financial contribution was designed based on these results (9,19).
Table 5.1 How should a health care system be financed? WHO staff Internet
respondents All
respondents Everyone pays the same amount 0 2 1 Everyone pays for what they receive 5 7 6 Everyone pays an equal share of their income 20 25 23 Everyone pays an equal share of their
disposable income 72 61 67
The richest 10% pay for everyone 3 5 4 Table 5.2 Trade-off between one household paying 100% of disposable income vs. two
households each paying 50% towards health care costs. WHO staff Internet
respondents All
respondents One household more fair 4 4 4 Two households more fair 74 75 74 Equally fair 12 10 11 Don’t know 11 11 11 Table 5.3 Trade-off between one household paying 200% of disposable income vs. two
households each paying 100% towards health care costs. WHO staff Internet
respondents All
respondents One household more fair 4 4 4 Two households more fair 68 73 71 Equally fair 10 8 9 Don’t know 18 15 17 Table 5.4 Trade-off between one household paying 50% of disposable income vs. two
households each paying 25% towards health care costs. WHO staff Internet
respondents All
respondents One household more fair 3 5 4 Two households more fair 73 75 74 Equally fair 12 10 11 Don’t know 12 11 12
21
IV. Discussion This paper and more generally the WHO Framework for Health System Performance Assessment has presented an approach to deal with three common problems of measurement in public health and the social sciences. The first problem is that most of the normative choices involved even in conventional measures remain implicit. The approach adopted by WHO in the development of the WHO Framework for Health System Performance Assessment and the publication of the World Health Report 2000 has been to make such choices explicit. By parameterizing the measures of health, health inequality, responsiveness, fairness of financial contribution and the composite measure of overall health system attainment in a way that makes the normative choices explicit, we can highlight the range of normative choices available in designing these measures.
The second problem is that even when normative choices in the development of indicators are made explicit the parameter values used are assigned arbitrarily. This study and future work being undertaken by WHO is based on the empirical measurement of informed preferences rather than arbitrary choice.
The third problem is the often-held view that values around health and health systems are so specific to particular contexts that any attempt at comparison is flawed. This extreme forms of cultural relativism has often hampered comparative analysis in public health. In contrast, an empirical analysis of which this is but a first attempt however limited, provides the opportunity to measure and define the extent of homogeneity and divergence in key health system preferences. It is interesting that our analysis has found broad homogeneity around the same set of values among a convenient sample of knowledgeable people, but who were diverse in terms of country of origin, educational attainment, age and gender.
As argued earlier, the complexity of judgements required for this exercise calls for the measurement of informed preferences from individuals selected for their understanding of the issues involved. Despite this common element, such individuals may come from very different cultural backgrounds, as is the case with our respondents. Yet, with the few exceptions noted in the presentation of results, this diverse group of informed individuals exhibits remarkable similarities in normative preferences.
We have demonstrated through this survey that it is feasible to measure preferences directly and use them to quantify the normative components of complex measures. We hope and plan to use this empirical approach more extensively in the future to further investigate the extent to which preferences vary across populations and population sub-groups. The extent of inconsistent responses in the survey demonstrates the importance of measuring preferences in an interactive environment that can elicit deliberative preferences. Further analytical efforts to understand why respondents provide inconsistent responses may help improve the instrument and identify factors that may in their own right be important dimensions of health system policy debates.
It is striking that health inequalities are considered equally important to the average level of health in a population in this sample. Health inequalities have recently been receiving a prominent place in global health policy agendas. The survey results are consistent with this increasing policy focus on reducing inequalities. In future work, it may be important to more directly measure trade-offs between policies that seek to raise the average level of health and those that seek to reduce inequalities. Clearly,

22
efforts to improve the health of the worst off will reduce health inequalities and raise the average level of health but at a policy level tradeoffs may exist in identifying key health system priorities. Our findings are consistent with a heavy emphasis in national health policy formulation on efforts to reduce health inequalities.
An important finding of this survey is the high relative importance attached to responsiveness and fairness in financial contribution, which has important implications for measuring the output and outcome of health systems. Historically, WHO has focused its recommendations to its Member States on the measurement of health outcomes without much attention on responsiveness and the health financing system. Given that responsiveness and fairness of financial contribution together are accorded as much importance as health (level and inequality combined), substantial efforts may be required in many countries to fill in important information gaps.
WHO is committed to monitoring health system performance. We need to improve and elaborate our instrument for measuring preferences for the assessment of the performance of health systems. This can be done in two ways: 1) expand the sample of respondents both in terms of size, and in terms of the composition of respondents, ideally eliciting more respondents from developing countries; and 2) improve the questions to include more trade-offs. Trade-offs have been used extensively in the field of economics to measure preferences. We have used them in this questionnaire in the measurement of preferences of a measure of inequality and the measure of fairness in financing. More trade-offs could be included in questions eliciting relative weights of the goals of health systems, and also between average levels of the goals and inequality in the distribution of the goals. The disadvantage of including trade-offs for all the questions is that the length of the questionnaire and the time required from respondents increase significantly, to the point where respondents may choose not to participate because of the long duration of the survey. WHO plans to pursue both of these strategies in future work to more accurately measure preferences for health system performance.

23
References
1 Murray CJL, Frenk J. A framework for assessing the performance of health systems. Bulletin of WHO, 2000. 78(6):717-731.
2 Gelman A, King G. Why are American presidential election campaign polls so variable when votes are so predictable? British Journal of Political Science. 1993. 23(1):409-451.
3 World Medical Association, Declaration of Lisbon. 1981 and 1995.
4 Brock D. Life and Death: Philosophical Essays in Biomedical Ethics. Cambridge University Press, 1993.
5 Rylance G (1999) Privacy, Dignity and Confidentiality: interview study with structured questionnaire, BMJ, Vol. 318. P 301.
6 Beauchamp T, Childress J. Principles of Biomedical Ethics. 3rd edition. Oxford: Oxford University Press, 1989.
7 Bernhart MH, Wiadnyana IGP, Wihardjo J, Pohan I. Patient Satisfaction in developing countries. Social Science and Medicine 1999. 48(8):989-996.
8 Gilson L, Alilio M, & Heggenhougen K (1994) Community satisfaction with primary health care services: An evaluation undertaken in the Morogoro region of Tanzania, Social Science and Medicine, Vol. 39, No. 6 pp 767-780
9 Murray CJL, Knaul F, Musgrove P, Xu K, Kawabata K. Defining and measuring fairness of financial contribution. Geneva, World Health Organization, 2000 (GPE Discussion Paper No. 24).
10 Sadana R, Mathers C, Lopez A, Murray CJL. Comparative analysis of more than 50 household surveys on health status. Geneva, World Health Organization, 2000 (GPE Discussion Paper No. 15).
11 Mathers C, Sadana R, Salomon J, Murray CJL, Lopez AD. Estimates of DALE for 191 countries: methods and results. Geneva, World Health Organization, 2000 (GPE Discussion Paper No. 16).
12 Murray CJL, Lopez AD. Progress and directions in refining the global burden of disease approach: a response to Williams. Health Economics 9(1):69-82.
13Gakidou EE, Murray CJL, Frenk J. Measuring health inequality: an approach based on the distribution of health expectancy. Bulletin of WHO, 2000. 78(1):42-54.
14 deSilva A, Valentine N (2000). Measuring responsiveness: results of a key informants survey in 35 countries. Geneva, World Health Organization, 2000 (GPE Discussion Paper No. 21).
15 Valentine N, deSilva A, Murray CJL (2000). Estimates of responsiveness level and distribution for 191 countries: methods and results. Geneva, World Health Organization, 2000 (GPE Discussion Paper No. 22).
16 Taylor H, Terhanian G. Heady days are here again: Online polling is rapidly coming of age. Public Perspective 1999. 10(4):20-23.

24
17 Black GS, Terhanian G. Using the Internet for election forecasting. URL: http://www.pollingreport.com October 16, 1998.
18 Walsh JP, Kiesler S, Sproull L, hesse B. Self selected and randomly selected respondents in a computer network survey. Public Opinion Quarterly 1992. 56(2):241-244.
19 Xu K, Lydon P, Ortiz de Iturbide J, Musgrove P, Knaul F, Kawabata K, Florez N. CE, John J, Wibulpolprasert S, Waters H, Tansel A. Analysis of the fairness of financial contribution in 21 countries. Geneva, World Health Organization, 2000 (GPE Discussion Paper No. 25).