measuring progress towards the wbcsd statement of ambition
TRANSCRIPT

Wor
king
Pape
r
Measuring Progress Towards the WBCSD Statement of Ambition on Climate-Smart Agriculture
Improving Businesses’ Ability to Trace, Measure and Monitor CSA
Working Paper No. 199
CGIAR Research Program on Climate Change, Agriculture and Food Security (CCAFS)
Sonja J. Vermeulen Snorre S. Frid-Nielsen

1
Measuring Progress Towards the WBCSD Statement of Ambition on Climate-Smart Agriculture Improving Businesses’ Ability to Trace,
Measure and Monitor CSA
Working Paper No. 199
CGIAR Research Program on Climate Change,
Agriculture and Food Security (CCAFS)
Sonja J. Vermeulen
Snorre S. Frid-Nielsen

2
Correct citation:
Vermeulen SJ, Frid-Nielsen SS. 2017. Measuring Progress Towards the WBCSD Statement of
Ambition on Climate-Smart Agriculture: Improving Businesses’ Ability to Trace, Measure and
Monitor CSA. CCAFS Working Paper no. 199. Copenhagen, Denmark: CGIAR Research Program on
Climate Change, Agriculture and Food Security (CCAFS). Available online at: www.ccafs.cgiar.org
Titles in this Working Paper series aim to disseminate interim climate change, agriculture and food
security research and practices and stimulate feedback from the scientific community.
The CGIAR Research Program on Climate Change, Agriculture and Food Security (CCAFS) is a
strategic partnership of CGIAR and Future Earth, led by the International Center for Tropical
Agriculture (CIAT). The Program is carried out with funding by CGIAR Fund Donors, Australia
(ACIAR), Ireland (Irish Aid), Netherlands (Ministry of Foreign Affairs), New Zealand Ministry of
Foreign Affairs & Trade; Switzerland (SDC); Thailand; The UK Government (UK Aid); USA
(USAID); The European Union (EU); and with technical support from The International Fund for
Agricultural Development (IFAD).
Contact:
CCAFS Coordinating Unit - Faculty of Science, Department of Plant and Environmental Sciences,
University of Copenhagen, Rolighedsvej 21, DK-1958 Frederiksberg C, Denmark. Tel: +45 35331046;
Email: [email protected]
Creative Commons License
This Working Paper is licensed under a Creative Commons Attribution – NonCommercial–NoDerivs
3.0 Unported License.
Articles appearing in this publication may be freely quoted and reproduced provided the source is
acknowledged. No use of this publication may be made for resale or other commercial purposes.
© 2017 CGIAR Research Program on Climate Change, Agriculture and Food Security (CCAFS).
CCAFS Working Paper no. 199
DISCLAIMER:
This Working Paper has been prepared as an output for the Project 273: Learning Platform on
Partnerships and Capacity for Scaling Climate-Smart Agriculture under the CCAFS program and has
not been peer reviewed. Any opinions stated herein are those of the author(s) and do not necessarily
reflect the policies or opinions of CCAFS, donor agencies, or partners.
All images remain the sole property of their source and may not be used for any purpose without
written permission of the source.

3
Abstract
At the Paris climate summit in 2015, the World Business Council on Sustainable
Development (WBCSD) announced a set of 2030 ambitions under the three pillars of climate-
smart agriculture (CSA), namely productivity, resilience and mitigation. Based on work under
WBCSD’s workstream to improve businesses’ ability to trace, measure and monitor CSA,
this working paper provides (a) a simple framework, (b) sets of recommended indicators, and
(c) a stock-take of the current status of CSA progress under each of the three pillars, both
globally and among WBCSD member companies. The purpose is to inform future monitoring
and reporting on CSA among member companies, both individually and collectively. For
pillar 1, productivity, we are exceeding targets for global food production. However, we have
less information on whether this food is nutritious, available and affordable, or whether we
are achieving higher productivity per unit of input, and sustainable use of resources, not just
higher production. For pillar 2, resilience, there is insufficient company or global data to
monitor the resilience and welfare of agricultural communities and landscapes under climate
change. A high priority is collection of activity data on provision and adoption of positive
environmental (e.g. agroecological) and social (e.g. climate information and financial)
approaches among farmers. For pillar 3, mitigation, we are falling behind targets for
agricultural and food system emissions. While there have been some impressive
improvements in emissions intensity for some foods and beverages, increasing levels of
production mean that absolute emissions are rising. This early snapshot of progress can
hopefully stimulate shared learning and renewed investment, ahead of future collective
reporting by WBCSD.
Keywords
Private sector, World Business Council on Sustainable Development, climate-smart
agriculture, food systems, metrics, indicators

4
Acknowledgements
We thank the World Business Council on Sustainable Development and its member
companies for their cooperation, inputs and openness during this work. We also thank
CCAFS colleagues Dhanush Dinesh, Verena Knoetig, James Rawles and Alain Vidal for their
support.
This work was implemented as part of the CGIAR Research Program on Climate Change,
Agriculture and Food Security (CCAFS), which is carried out with support from CGIAR
Fund Donors and through bilateral funding agreements. For details please visit
https://ccafs.cgiar.org/donors. The views expressed in this document cannot be taken to
reflect the official opinions of these organisations.
About the authors
Sonja J. Vermeulen is Head of Research of the CGIAR Research Program on Climate
Change, Agriculture and Food Security. Her research focuses on the global context for
achieving food security under climate change.
Snorre S. Frid-Nielsen is a Phd Fellow at the Department of Social Sciences and Business at
Roskilde University. His research focuses on applying behavioural insights within public
policy.

5
Contents
Introduction .................................................................................................................... 6
WBCSD statement of ambition on climate-smart agriculture ....................................... 8
Framework for tracking progress towards the global CSA ambition .......................... 11
Stock-taking method .................................................................................................... 13
Data sources ............................................................................................................. 13
Identifying CSA indicators used by companies ....................................................... 13
Assessing current progress and future projections ................................................... 14
Estimating WBCSD companies’ contribution to global progress ........................... 14
General issues with the stock-take ........................................................................... 16
Pillar one: productivity ................................................................................................ 18
1. Recommended framework and indicators ........................................................... 18
2. Global data sets and analysis ............................................................................... 19
3. Company data sets and analysis ........................................................................... 20
4. Conclusions on progress ...................................................................................... 23
Pillar two: resilience .................................................................................................... 24
1. Recommended framework and indicators ........................................................... 24
2. Global data sets and analysis ............................................................................... 25
3. Company data sets and analysis ........................................................................... 25
4. Conclusions on progress ...................................................................................... 28
Pillar three: mitigation ................................................................................................. 29
1. Recommended framework and indicators ........................................................... 29
2. Global data sets and analysis ............................................................................... 30
3. Company data sets and analysis ........................................................................... 31
4. Conclusions on progress ...................................................................................... 34
Conclusions and ways forward .................................................................................... 35
Opportunities for companies: building CSA metrics into regular practice .............. 35
Opportunities for road-test countries: shared measurement across value chains .... 35
How are we doing? Progress and outlook on the global Statement of Ambition .... 36

6
Introduction
Monitoring, evaluating and learning from CSA progress will motivate and empower
companies and their partners to meet the WBCSD 2030 Statement of Ambition on climate-
smart agriculture, thereby enhancing food security, building resilience to climate change in
their value chains, improving natural resource use efficiency, and reducing environmental
impacts.
This working paper informally presents progress under Action Area 3 of the WBCSD Action
Plan on climate-smart agriculture. Action Area 3 works to improve businesses’ ability to
trace, measure and monitor CSA progress. As agreed in early 2016, the aim is not to provide a
comprehensive new protocol for CSA measurement, but rather to support monitoring and
evaluation of progress by building on metrics that businesses and other entities collect
already.
Therefore this working paper provides (a) a simple framework, (b) sets of recommended
indicators, and (c) a stock-take of the current status of CSA progress under each of the three
pillars of productivity, resilience and mitigation, globally and among WBCSD member
companies. The purpose is to inform future monitoring and reporting on CSA among member
companies, both individually and collectively.
This working paper is organized as follows:
WBCSD statement of ambition on climate-smart agriculture is simply reproduced from
the WBCSD CSA Action Plan launched in Paris at COP21 in December 2015. It is an
important part of this working paper as it provides the exact definition and detailed
parameters of the WBCSD 2030 ambitions for CSA. The WBCSD CSA definition and
parameters differ in small but important ways from other definitions of CSA (e.g. FAO).
Framework for tracking progress towards the global CSA ambition provides a very
simple framework for structuring measurement of the three CSA pillars by combining activity
and outcome data, and company and global data.

7
Stock-taking method provides the rationale and methods used in this stock-take of progress
under each of the three CSA pillars (productivity, resilience and mitigation) against the agreed
2010 baseline, combining global and WBCSD member company data.
Pillar one: productivity, Pillar two: resilience and Pillar three: mitigation provide
recommend indicator sets for each pillar and the stock-take of current progress against the
three pillars. Recommended indicators draw on other WBCSD processes and the formal
indicators of the Sustainable Development Goals (SDGs) where possible.
Ways forward suggests how companies can apply and use the indicators and metrics in
measuring progress towards the WBCSD statement of ambition on climate-smart agriculture
at multiple levels from individual business unit to global levels.
8
WBCSD statement of ambition on climate-smart
agriculture1
The WBCSD’s Low Carbon Technology Partnership initiative (LCTPi) is a joint public and
private initiative to accelerate low-carbon technology development. Climate-smart agriculture
is one of the solutions that the WBCSD and its member companies have identified as critical
to reach the 2C target. Climate-smart agriculture (CSA), as presented by FAO at the Hague
Conference on Agriculture, Food Security and Climate Change in 2010, integrates the three
dimensions of sustainable development (economic, social and environmental) by jointly
addressing food security and climate challenges. It has three main pillars:
1. Sustainably increasing agricultural productivity and incomes;
2. Adapting and building resilience to climate change;
3. Reducing and/or removing greenhouse gases emissions, where possible.
WBCSD members have built on this three pillar concept to prepare a Statement of Ambition
taking into account the views shared by WBCSD and the CSA Working Group members to
date, objectives set out for the Global CSA Alliance (of which WBCSD is a member),
WBCSD’s Action 2020 ‘Must-Haves’ and Vision 2050, the current version of the UN
Sustainable Development Goals, and extensive engagement and collaboration with farmers,
the private sector, government, civil society organizations, NGOs and research institutes
through multiple regional meetings during 2015. The Statement of Ambition for WBCSD
CSA working group member companies is as follows:
Pillar 1: Productivity ambition
Increase global food security by making 50% more nutritional food available2 through
increased production on existing land, protecting ecosystem services3 and biodiversity,
bringing degraded land back into productive use4 and reducing food loss from field to shelf5.
1 Taken from the WBCSD CSA Action Plan launched in Paris at COP21 in December 2015
2 Includes milk & dairy, meat & fish, vegetable oils, fruit & vegetables, oilseeds and products, pulses, sugar, roots and tubers and
food cereals available for consumption by the global population after food waste is taken into account. All food will be
produced in accordance with rigorous safety standards. Nutritional food, in accordance with the WHO Guidelines on Nutrition,
9
Pillar 2: Climate change resilience, incomes & livelihoods ambition
Strengthen the climate resilience of agricultural landscapes and farming communities to
successfully adapt to climate change through agroecological approaches appropriate for all
scales of farming. Invest in rural communities to deliver improved and sustainable livelihoods
necessary for the future of farmers, bringing prosperity through long-term relationships based
on fairness, trust, women’s empowerment and the transfer of skills and knowledge.
Pillar 3: Climate change mitigation ambition
Reduce GHG emissions by at least 30%6 of annual agricultural CO2e emissions against 2010
levels (aligned with a global 1.6 GtCO2e yr reduction by 2030).7 This recognizes the strong
positive role played by farming communities to date in reducing GHG emissions and the
potential carbon sequestration role of farmland as described in the supply side mitigation
options and potential for the agricultural sector in the IPCC’s AR5 report. It is also important
to stress that not all these reductions will be at the farm level - a substantial portion of these
reductions will also be achieved through reducing food waste up to the point of sale to the end
consumer, in line with WBCSD’s Action 2020 to halve food waste.
We will also play a role to eliminate GHG emissions from land-use change to commercial
agriculture8 through working to halt conversion of HCV9 or HCF10 forest and all grasslands,
wetlands and peatlands by the sector (equivalent of a 2.1 GtCO2e reduction per year11).
should include protein, energy, vitamin A and carotene, vitamin D, vitamin E, vitamin K, thiamine, riboflavin, niacin, vitamin
B6, pantothenic acid, biotin, vitamin B12, folate, vitamin C, antioxidants, calcium, iron, zinc, selenium, magnesium and iodine
(http://www.who.int/nutrition/topics/nutrecomm/en/).
3 Ecosystem services are the benefits people obtain from ecosystems. These include provisioning services such as food and water;
regulating services such as flood and disease control; cultural services such as spiritual, recreational, and cultural benefits; and
supporting services, such as nutrient cycling, that maintain the conditions for life on Earth. Definition from Millennium
Ecosystem Assessment (2003).
4 In alignment with the WBCSD Action 2020 objective to restore at least 12 million hectares per year of degraded land
5 Food losses up to the point of the consumer. This does not include post-consumer loss, which is considered outside the scope of
CSA, and is being addressed through broader work within the WBCSD such as the Sustainable Lifestyles cross-sectoral group.
6 This is the net GHG emissions reduction across a company’s agricultural supply chains (GHG quantity emitted minus GHG
quantity sequestered).
7 Aligned with the IPCC supply-side mitigation options and potential for the agricultural sector presented in its Fifth Assessment
Report (AR5). Table 11.2 in: IPCC, 2014: Climate Change 2014: Mitigation of Climate Change identifies a mitigation
potential from land-based agriculture of 1.6 GtCO2e per year by 2030 (see Appendix 7.1). This represents a 30% reduction in
CO2e emissions per year on 2012 CO2e emissions from agriculture (5.38Gt CO2e) reported by FAOSTAT. As companies do
not constitute 100% of global agricultural emissions the Vision aligns itself with an equivalent % reduction in emissions by
companies and is also extended to agricultural supply chain emissions reductions.
8 This term refers to the production of crops and farm animals for sale, which could enter the supply chains of WBCSD member
companies – as opposed to subsistence agriculture, the product of which does enter these supply chains.

10
We will work with existing work streams to decrease agricultural-related deforestation
already underway such as the Consumer Goods Forum, and through the Declaration on
Forests and the Tropical Forests Alliance. The relative distribution of our CO2e reduction
ambition between agriculture (including reductions in food waste from field to shelf) and land
use change is provided in the chart below:
In addition we align ourselves with the climate mitigation objectives of the WBCSD Land
Degradation Neutrality initiative, which states that restoring the 12 million hectares that are
degraded every year could secure the sequestration of 20% of global CO2 emissions12, and the
WBCSD Forests Solutions Group to achieve the restoration of 30% global forest cover (1990
levels) by 2050, with 45 Gt CO2e stored by 2030.
9 High Conservation Value Forests – Defined as forests of outstanding and critical importance due to their high environmental,
socio-economic, biodiversity or landscape values. From WWF (2007).
10 High Carbon Stock - The HCS approach distinguishes natural forest from degraded lands with only small trees, scrub,
or grass remaining. It separates vegetation into 6 different classes (stratification) through the combination of analysing satellite
images and field plots. The Indonesian descriptions of these are: High Density Forest (HK3), Medium Density Forest (HK2),
Low Density Forest (HK1), Old Scrub (BT) 3, Young Scrub (BM), and Cleared/Open Land (LT). HCS forest includes the
vegetation classes of BT and above (HK1, 2 & 3). The HCS threshold between BT and BM is largely determined by the
vegetation structure and density difference, where BT can be described as- Mostly young re-growth forest, but with occasional
patches of older forest within the stratum, and BM as - Recently cleared areas, some woody re-growth and grass-like ground
cover. Below this, BM (young scrub) and LT (cleared/open land) would be considered of low carbon stock and potentially
suitable for development. From Greenpeace (2013).
11 This quantification uses the ‘FAO and Climate Advisors (2014) Quantifying Benefits of the New York Declaration on Forests’
report as a detailed and recent analytical resource, though this does not represent a formal alignment with the Declaration. We
use the average CO2e removed or avoided in the ‘2030 Forest loss goal’ (Table 4, Page 9), which is 4.15 GtCO2e. We then
divide this by 2, which represents an estimate that commercial agriculture is responsible for 50% of tropical deforestation. This
estimate is derived from the range of figures presented by analyses in Hosonuma et al (2012).
12 WBCSD (2015) Land Degradation Neutrality. A business perspective.
43
57
% distribution of Pillar 3 CO2e 2030 reduction ambition between agriculture and land-use change
Agricultureand foodwastereduction(field to shelf)

11
Framework for tracking progress towards the global
CSA ambition
Two principles shape the simple framework for tracking progress on CSA. The first is to
include both activity and outcome indicators. Each of the three pillars of CSA is defined by
WBCSD in terms of (a) outcomes and (b) activities to achieve those outcomes (Figure 1). For
example, the intended outcome of pillar two is to strengthen climate resilience of agricultural
landscapes and farming communities. The stated activities to achieve this outcome include
adopting agroecological approaches, investing in rural communities, and building long-term
empowering relationships between farmers and industry. For each pillar, the outcomes and the
activities are linked by an implicit theory of change – a hypothesis, or best bet, that the
activities will deliver the outcomes.
Figure 1 How activities lead to outcomes in the implicit theory of change for each CSA pillar
The second principle is to combine and triangulate information from WBCSD CSA member
companies and from external sources, generally global. The WBCSD CSA Statement of
Ambition is global, going well beyond member companies in its scope. Individual companies
PRODUCTIVITY
OUTCOMES: global food
security, nutritious food
available to all
AC
TIV
ITY
e.g
. ra
ise
yie
lds
RESILIENCE,
INCOMES &
LIVELIHOODS
OUTCOMES: resilient
communities & landscapes,
sustainable livelihoods
AC
TIV
ITY
e.g
. tr
an
sfer
sk
ills
MITIGATION
OUTCOMES: emissions reduced
in agriculture & eliminated in
land use change
AC
TIV
ITY
e.g
. h
alt
fo
rest
co
nv
ersi
on

12
will be seeking to improve their own performance on various metrics, and to track WBCSD
collective contributions towards the global goal. They will also be looking to stimulate
positive change across their own sectors and industries, as well as among governments, rural
communities, consumers and other agents of change.
Figure 2 Combining company and external global indicators for a fuller picture of CSA progress
In some cases, there will be important scale effects or trade-offs that can only be accounted
for meaningfully at a higher scale. For example, while emissions intensities in smallholder
livestock systems tend to be very high (per kilogram of meat or per litre of milk), they do not
add up to a major contribution to global agricultural emissions (scale effect), plus they make
critical contributions to human nutrition, especially for vulnerable children (trade-off effect).
Many of the most valuable advances in CSA are likely to come from collaboration across
value chains and among partners from different sectors – for example in the WBCSD CSA
road-test countries. Therefore we need to track progress using multiple data sources to give a
global picture (Figure 2).
INPUTS &
FARMING PROCESSING &
LOGISTICS
STORAGE &
TRANSPORT
SERVICES e.g. FINANCE
TRADING & PURCHASE
GLOBAL INDICATORS
(some are OUTCOME indicators and some are ACTIVITY indicators)
COMPANY INDICATORS
(some are OUTCOME indicators and some are ACTIVITY indicators)
Enabling and regulatory environment

13
Stock-taking method
This section outlines the approach used to take stock of WBCSD companies’ progress on
CSA targets from 2010-2015. We combine the bottom-up reporting available from companies
with a top-down perspective using available global data sets to estimate progress towards
2030 targets and ambitions. By projecting global trends from 2010 to 2015, we can generate a
simplified comparison between the current trajectory under business-as-usual and the
WBCSD members’ target performance.
Data sources
Multiple data sources were searched, including the SDG indicators, World Bank, IFAD and
FAO. The Food and Agriculture Organization of the United Nations Statistics Division
(FAOSTAT) provides global datasets including: the quantity of food produced and yields
(pillar 1), and direct agricultural emissions (pillar 3). However, pillar 2 targets are difficult to
align with global data, as they apply to individual communities (e.g. livelihoods) and
companies (e.g. farmer training) and are difficult to aggregate at the global level. Thus, no
relevant data for pillar 2 were available at FAOSTAT.
In terms of company data, several companies report measures linked to CSA objectives within
their own annual reports, corporate social responsibility (CSR) reports and sustainability
reports, as well as through external initiatives such as the Global Reporting Initiative (GRI)
and Carbon Disclosure Project (CDP). Companies track progress differently, in terms of
which indicators are used, how the indicators are measured (i.e. absolute vs. relative
progress), and how far back the reporting goes. These inconsistencies complicate the
measurement of progress across the group of WBCSD CSA members, motivating us to
establish a set of common indicators to allow for the most accurate assessment.
Identifying CSA indicators used by companies
We identified CSA-related indicators for each company by searching keywords (e.g. yield,
livelihood, emission) in recent company reports. Company representatives provided further
insights and data via phone interviews and emails. We aligned indicators to the CSA pillars,
giving a set of 17 common indicators across the three CSA pillars. Each of these indicators
was mentioned by at least two companies. We created a database of quantitative measures for

14
each indicator for each company in both 2010 and 2015, if possible. If no quantitative data
were reported in 2010, data from 2011-2012 were used, where available.
Assessing current progress and future projections
To measure company CSA progress, we compared the percentage change from 2010 to 2015,
for each indicator where sufficient quantitative data were available. There are major gaps in
data availability, both across companies and for individual companies over time. Thus,
company progress tracing is limited to the following indicators, where at least 5 companies
(~40%) provide data for both 2010 and 2015: total waste to landfill (pillar 1), total water use
(pillar 2); absolute Scope 1 & 2 emissions, and emissions intensity (pillar 3). We used simple
linear regression to create business-as-usual projections up to 2030, based on the available
global data from 2010-2014 on food availability (pillar 1) and greenhouse gas emissions
(pillar 3). Business-as-usual projections were held up against target scenarios for 50% more
food (pillar 1), and 30% fewer direct agricultural emissions (pillar 3). It was not possible to
gauge progress relating to pillar 2, since the pillar has no quantifiable CSA target and lacks
global data to support a projection for 2030.
Estimating WBCSD companies’ contribution to global progress
To bridge the gap between company and global data, we made some rough assumptions on
the companies’ share of global progress towards the WBCSD CSA Statement of Ambition.
We estimated each company’s share of their respective sub-sectors, based on 2016 sales
revenue. First, we divided WBCSD members by sub-sector (value chain segment):
agricultural inputs, food processing, and retail. Table 1 provides a list of companies that were
included. The companies’ estimated revenue share within their respective sub-sector (a proxy
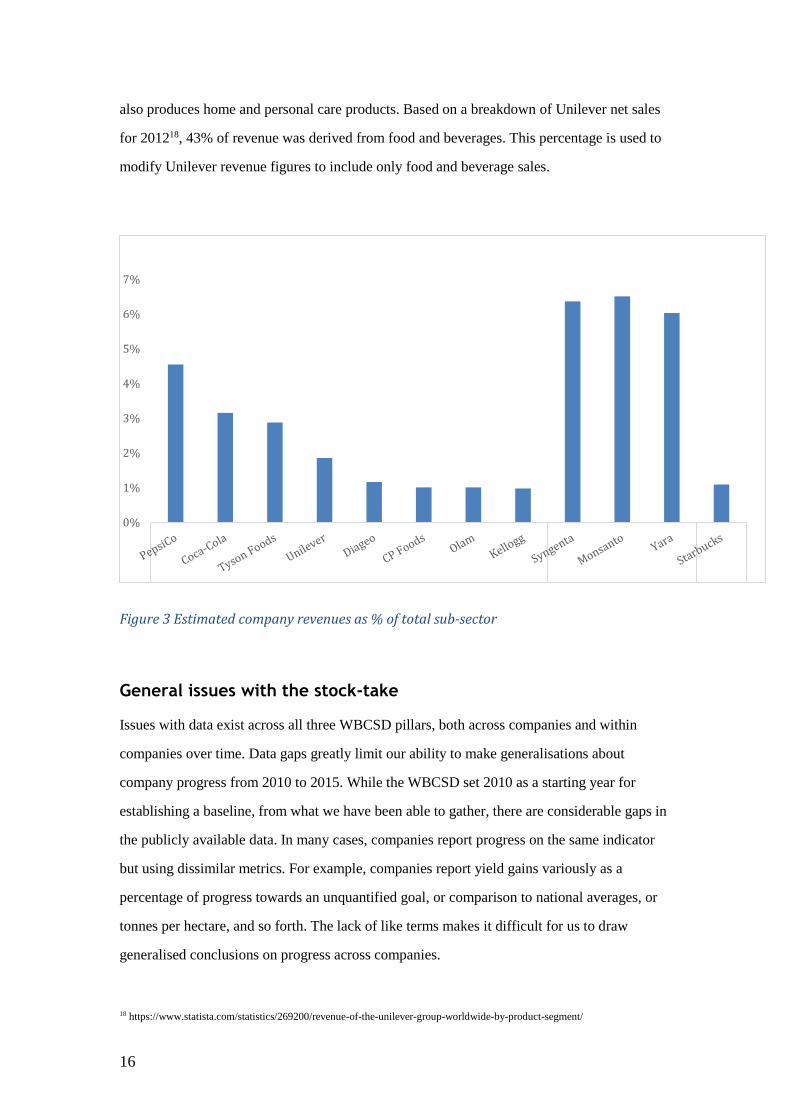
we used to be able to estimate global progress) is shown in Figure 3.
Since shares of global production are not readily available, we used revenue figures (from the
2016 Forbes Global 200013) as a simple proxy for volume. A caveat of this approach is that it
does not consider the different values of food items. For example, while global pork sales
brought in twice the revenue of wheat in 2012, six times as much wheat was produced in the
13 http://www.forbes.com/global2000/

15
same period14. Thus, calculating companies’ shares of global food production in this manner
may distort their role in contributing to food security, as sales do not directly translate to
quantities of food produced nor number of people fed. Nevertheless, revenue provides some
indication of volume, assuming that price reaches equilibrium across competing companies in
a given year.
Table 1 Companies included in the analysis
Company Sub-sector
Coca-Cola Food processing
CP Foods Food processing
Diageo Food processing
DuPont Agricultural inputs
Kellogg Food processing
Monsanto Agricultural inputs
Olam Food processing
PepsiCo Food processing
Starbucks Retail
Syngenta Agricultural inputs
Tyson Foods Food processing
Unilever Food processing
Yara Agricultural inputs
For the agricultural input companies, the total sub-sector revenue consists of all top
companies within the diversified chemicals sub-sector. While this overlooks smaller input
suppliers, top 10 companies within seeds, fertilizers and pesticides make up 75%, 55% and
95% of their respective markets15. Within food processing, top companies make up a smaller
portion of total sales (~25%). In the restaurant industry, top companies make up
approximately 10% of global sales. This makes the previously employed method for
estimating WBCSD share of production less accurate. Instead, total scales estimates for food
processing are taken from an analysis by ETC Group16 (USD 1.38 trillion), and Starbucks’
revenue is held against estimates of global restaurant sales, (USD 1.85 trillion)17. While most
of these food processing companies operate only in the food and beverage industry, Unilever
14 http://faostat.fao.org/site/339/default.aspx
15 http://www.econexus.info/sites/econexus/files/Agropoly_Econexus_BerneDeclaration.pdf
16 http://www.etcgroup.org/sites/www.etcgroup.org/files/publication/pdf_file/ETC_wwctge_4web_Dec2011.pdf
17 http://www.forbes.com/forbes/welcome/?toURL=http://www.forbes.com/2007/11/11/growth-agriculture-business-forbeslife-
food07-cx_sm_1113bigfood.html&refURL=&referrer=
16
also produces home and personal care products. Based on a breakdown of Unilever net sales
for 201218, 43% of revenue was derived from food and beverages. This percentage is used to
modify Unilever revenue figures to include only food and beverage sales.
Figure 3 Estimated company revenues as % of total sub-sector
General issues with the stock-take
Issues with data exist across all three WBCSD pillars, both across companies and within
companies over time. Data gaps greatly limit our ability to make generalisations about
company progress from 2010 to 2015. While the WBCSD set 2010 as a starting year for
establishing a baseline, from what we have been able to gather, there are considerable gaps in
the publicly available data. In many cases, companies report progress on the same indicator
but using dissimilar metrics. For example, companies report yield gains variously as a
percentage of progress towards an unquantified goal, or comparison to national averages, or
tonnes per hectare, and so forth. The lack of like terms makes it difficult for us to draw
generalised conclusions on progress across companies.
18 https://www.statista.com/statistics/269200/revenue-of-the-unilever-group-worldwide-by-product-segment/
0%
1%
2%
3%
4%
5%
6%
7%
Processing Inputs Retail

17
We also encountered challenges in clearly assessing progress within companies. Factors such
as increased market share, recovery from the financial crisis, and mergers can distort
measures such as absolute emissions, and total water usage. In some cases, companies take
these factors into account, and adjust their past reporting to reflect restructuring of their
businesses. However, in cases where data dating back to 2010 were not adjusted, we relied on
older annual reports, which may not be wholly accurate.

18
Pillar one: productivity
1. Recommended framework and indicators
The target for productivity in the WBCSD Statement of Ambition is to “Increase global food
security by making 50% more nutritional food available through increased production on
existing land, protecting ecosystem services and biodiversity, bringing degraded land back
into productive use and reducing food loss from field to shelf”. To identify indicators, we
separate out the components as shown in Table 2.
Table 2 Recommended and current indicators for pillar 1
Component of
WBCSD
pillar 1
Recommended indicators that align with
WBCSD processes or SDGs
Other recommended
indicators
Currently available
indicators among two or
more WBCSD CSA
member companies
1.1 Improve
the supply of
nutritious
food
(OUTCOME)
- Prevalence of moderate or severe food
insecurity in the population, based on the
Food Insecurity Experience Scale (SDG
indicator 2.1.2)
- Food production across
range of key food groups
- Affordability of nutritious
food e.g. hours of labor to
buy daily nutritional needs
None
1.2
Sustainably
improve
production on
existing land
(ACTIVITY)
- Proportion of agricultural area under
productive and sustainable agriculture
(SDG indicator 2.4.1)
- Production per labour unit by classes of
farm size (SDG indicator 2.3.1)
- Change in water-use efficiency over time
(SDG indicator 6.4.1)
- Production of food (tonnes,
calories, nutrition) per unit
nutrient, water, land and
energy
Percentage yield change
Total water use (see
pillar 2)
1.2 Protecting
ecosystem
services and
biodiversity,
and bringing
degraded land
back into
productive
use
(ACTIVITY)
- WBCSD Action 2020 objective to restore
at least 12 million hectares per year of
degraded land
- Proportion of important sites for
terrestrial and freshwater biodiversity that
are covered by protected areas, by
ecosystem type (SDG indicator 15.1.2)
- Freshwater withdrawal as a proportion of
available freshwater resources (SDG
indicator 6.4.2)
- Proportion of degraded land in total land
area (SDG indicator 15.3.1)
- Other ecosystem services
indicators, such as
prevalence of natural
pollinators
Percentage of
sustainable sourcing and
certified raw materials
1.3 Reduce
food loss from
field to shelf
(ACTIVITY)
- WBCSD Food Loss and Waste
Accounting and Reporting Standard
- Global food loss index; halve food waste
(SDG indicator 12.3.1)
- End use other than human
food or animal feed (kg) –
see the WBCSD Standard
for more detail
Waste (not food) to
landfill (kg)
The footnotes to the WBCSD Statement of Ambition for pillar 1 note that nutritious food
means a range of macro-and micro- nutrients, that ecosystem services follow the Millennium
Ecosystem Assessment definition and thus include cultural as well as ecological services, and
that food loss is up to the point of the consumer.

19
2. Global data sets and analysis
Table 3 summarizes the main findings. Between 2010-201419, global average production
quantity and yield of important food groups (cereals, vegetables, roots and tubers, fruit, meat,
and milk) increased 10.8% and 2.7% respectively. To reach the 2030 food production target,
food production must increase approximately 1.9% per year.
Table 3 Summary of pillar 1 results for global production data
Quantity of major food types produced, 2010 (tonnes) 6,094,375,990
Quantity of major food types produced, 2014 (tonnes) 6,753,782,383
2030 target of 50% more food (tonnes) 9,141,563,985
Average change in food production of major crops, 2010-2014 (%) 10.8%
Average change in yield of major crops, 2010-2014 (%) 2.7%
Annual production increase needed for 50% more food, 2014-2030
(%)
1.9%
Figure 4 projects global production of major food groups to 2030, based on data from 2010-
2014, compared to the target of increasing food production 50% relative to 2010 levels. All
else equal, if the current food production trajectory continues, it may slightly exceed target of
50% food production compared to 2010 levels.
19 http://faostat3.fao.org/download/Q/*/E

20
Figure 4 Projected production of major food groups between 2010 and 2030: WBCSD
target versus current trajectory
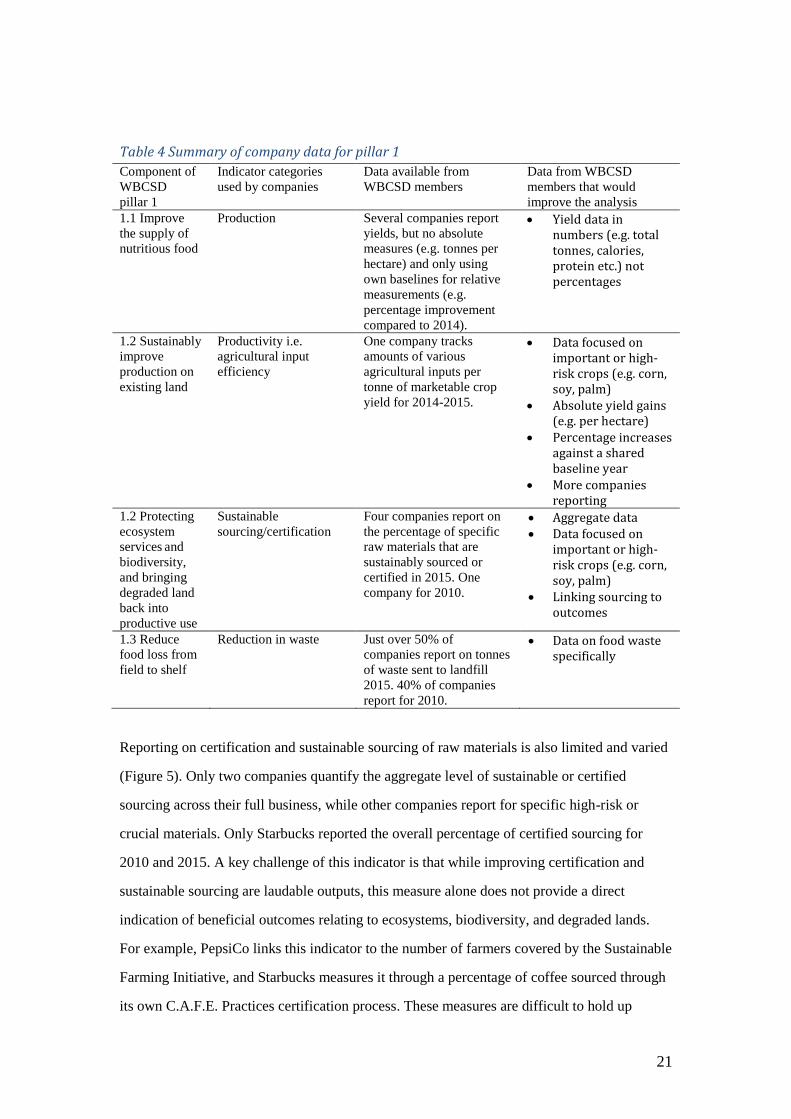
3. Company data sets and analysis
Table 4 provides a summary of the state of company data for pillar 1. We established three
common indicators based on company reporting: farm yield and agricultural input efficiency
(1.2); sustainable sourcing/certification of raw materials (1.2); reduction of waste (1.3).
Although several companies report on yield, there was a high level of variation in the
transparency, scale, and units of the data. CP Foods highlights a 10-15% increase in corn
yields among suppliers compared to the national average in their 2015 annual report.
Monsanto reports progress towards doubling food availability in select crops against a 2000
baseline. Olam reports on yield gains for select crops, but the timescale and units vary.
Syngenta is the only company to report yield gains and agricultural input efficiency at the
aggregate level, recording a 2% increase in yields in 2015 compared to 2014. Syngenta
provides open data access via their website, though data for 2010 are not available. Due to the
lack of cohesive reporting on yields, it is not possible to measure progress across companies.
5
5.5
6
6.5
7
7.5
8
8.5
9
9.5
10
Bil
lio
ns
ton
nes
Stock-take WBCSD target Current trajectory
21
Table 4 Summary of company data for pillar 1
Component of
WBCSD
pillar 1
Indicator categories
used by companies
Data available from
WBCSD members
Data from WBCSD
members that would
improve the analysis
1.1 Improve
the supply of
nutritious food
Production Several companies report
yields, but no absolute
measures (e.g. tonnes per
hectare) and only using
own baselines for relative
measurements (e.g.
percentage improvement
compared to 2014).
Yield data in numbers (e.g. total tonnes, calories, protein etc.) not percentages
1.2 Sustainably
improve
production on
existing land
Productivity i.e.
agricultural input
efficiency
One company tracks
amounts of various
agricultural inputs per
tonne of marketable crop
yield for 2014-2015.
Data focused on important or high-risk crops (e.g. corn, soy, palm)
Absolute yield gains (e.g. per hectare)
Percentage increases against a shared baseline year
More companies reporting
1.2 Protecting
ecosystem
services and
biodiversity,
and bringing
degraded land
back into
productive use
Sustainable
sourcing/certification
Four companies report on
the percentage of specific
raw materials that are
sustainably sourced or
certified in 2015. One
company for 2010.
Aggregate data Data focused on
important or high-risk crops (e.g. corn, soy, palm)
Linking sourcing to outcomes
1.3 Reduce
food loss from
field to shelf
Reduction in waste Just over 50% of
companies report on tonnes
of waste sent to landfill
2015. 40% of companies
report for 2010.
Data on food waste specifically
Reporting on certification and sustainable sourcing of raw materials is also limited and varied
(Figure 5). Only two companies quantify the aggregate level of sustainable or certified
sourcing across their full business, while other companies report for specific high-risk or
crucial materials. Only Starbucks reported the overall percentage of certified sourcing for
2010 and 2015. A key challenge of this indicator is that while improving certification and
sustainable sourcing are laudable outputs, this measure alone does not provide a direct
indication of beneficial outcomes relating to ecosystems, biodiversity, and degraded lands.
For example, PepsiCo links this indicator to the number of farmers covered by the Sustainable
Farming Initiative, and Starbucks measures it through a percentage of coffee sourced through
its own C.A.F.E. Practices certification process. These measures are difficult to hold up

22
against each other and do not directly indicate sustainability progress. Furthermore, indicators
relating to sustainable-sourcing are reported across all three pillars: the concept of
sustainability can be linked to environmental, social, and economic factors, making it difficult
to separate outcomes related to these factors when the only measurement is the percentage of
certified materials.
Figure 5 Company reporting on percentage of raw materials that are sustainably sourced
or certified
Company reporting on food loss is also limited. Olam provides some aggregated data on
product loss across the supply chain. Kellogg refers to overall progress on Sustainable
Development Goal of halving food waste. Monsanto ties into food loss using microbial
technology for increasing pest and disease resistance, but only reports the number of farms
employing the technology, rather than estimating the amount of loss avoided. Instead, over
half of the companies track waste to landfill in 2015. Five of these companies also measured
this in 2010 (see Figure 6). On average, companies tracking this indicator reduced their total
waste to landfill by 24% from 2010-2015. A promising new development is the Champion
12.3 initiative, under which companies will track and report progress towards the SDG
ambition of halving food loss and waste.20
20 https://champions123.org/2016-progress-report/
0%
10%
20%
30%
40%
50%
60%
70%
80%
90%
100%
DuPont PepsiCo Starbucks (2010) Starbucks (2015) Unilever Diageo
Palm Coffee All

23
Figure 6 Company reporting on percentage change in waste to landfill, 2010-2015
4. Conclusions on progress
Trends in global yield and production quantities from 2010-2014 indicate that we are on track
to produce enough food to meet the demand for 50% more food by 2030. Though we do not
have direct evidence that this food will be equally or more nutritious, all major food groups
are included in this rate of growth.
The four WBCSD agricultural input companies (Monsanto, Syngenta, Yara, DuPont) make up
an estimated 31% of total sales in the specialised chemicals sub-sector, giving an indication of
their contribution to yield gains. However, this estimate does not consider potential yield
gains in farming due to innovations and efficiency improvements other than specialised
chemical inputs.
The food processing companies (PepsiCo, Coca-Cola, Tyson Foods, Diageo, CP Foods,
Olam, Unilever and Kellogg) make up 16.5% of sales in their sector, but this estimate does
not consider the total amount of nutritious food produced by these companies.
Although some companies report improvements in yields, more efficient farming, more
sustainably sourced their raw materials, and reductions their total waste to landfill, we need
more holistic data on the inputs, throughputs and outputs of the food supply chain to properly
assess the companies’ CSA progress and the sustainability of the increased food production
evidenced from 2010 to 2014.
-80%
-60%
-40%
-20%
0%
20%
40%
60%
80%
Diageo (2011) PepsiCo Kellogg Syngenta Yara Average

24
Pillar two: resilience
1. Recommended framework and indicators
The aim for resilience in the WBCSD Statement of Ambition is to “strengthen the climate
resilience of agricultural landscapes and farming communities to successfully adapt to climate
change through agroecological approaches appropriate for all scales of farming. Invest in rural
communities to deliver improved and sustainable livelihoods necessary for the future of
farmers, bringing prosperity through long-term relationships based on fairness, trust, women’s
empowerment and the transfer of skills and knowledge.” There are no quantitative targets. To
identify indicators, we separate the components as shown in Table 5.
Table 5 Recommended and current indicators for pillar 2
Component of
WBCSD pillar 2
Recommended indicators that align
with WBCSD processes or SDGs
Other recommended indicators Currently available
indicators among two
or more WBCSD
CSA member
companies
2.1 Improve rural
incomes and
livelihoods
(OUTCOME)
- Number of people below international
or national poverty line (SDG
indicators 1.1.1 and 1.2.1)
- Average income of small-scale food
producers, by sex and indigenous status
(SDG indicator 2.3.2)
- Welfare among supplier
farmers and wider community,
e.g. number hungry months, %
children at school, number of
doctors per head
Headcount of
improved livelihoods
(undefined)
2.2 Implement
agroecological
approaches
(ACTIVITY)
- Proportion of local breeds classified
as at risk, not-at-risk or at unknown
risk of extinction (SDG indicator 2.5.2)
- Extent of agroecological
approaches (ha, % operations,
% supply)
Total water use
2.3 Maintain
long-term fair
relationships with
smallholder
suppliers
(ACTIVITY)
None - Percentage of smallholder
suppliers who have entered a
fair labour agreement
- Provision of services to
farmers, e.g. percentage
covered by climate information
services or financial services
None (one company
tracks the percentage
of farmers who have
entered a fair labour
agreement)
2.4 Empower
women in
smallholder
farmer
communities
(ACTIVITY)
- (a) Proportion of total agricultural
population with ownership or secure
rights over agricultural land, by sex;
and (b) share of women among rights-
bearers (SDG indicator 5.a.1)
- Proportion of individuals who own a
mobile telephone, by sex (SDG
indicator 5.b.1)
- Proportion of women in managerial
positions (SDG indicator 5.5.2)
- Percentage of smallholder
suppliers who are women
- Income and/or assets of
women compared to men
- Representation of women in
producer organizations and
other bodies (% members and
% leaders)
Number of female
farmers trained
2.5 Transfer skills
and knowledge to
smallholder
farmers
(ACTIVITY)
None - Number and percentage of
smallholder farmers trained
- Demonstrable outcomes from
training e.g. higher quality of
product, reduced losses
Number of farmers
(not smallholders)
trained
25
The simplest approach to measure progress on pillar 2 would be to collect some simple
activity data on both social and environmental aspects. On the social side, this might be the
number of farmers adopting improved practices or provided with climate-smart services such
as user-friendly weather forecasts or weather-index insurance products. On the environmental
side, it might be number of hectares covered by agroecological approaches. The term
“agroecological approaches” (like “climate-smart approaches”) is open to multiple
interpretations. Agroecology can be understood as a scientific discipline, a movement or a set
of practices.21 WBCSD has adopted IIED’s description of agroecology22, which includes the
key functions of increasing functional biodiversity and reinforcing biological regulation.
Agroecological approaches are holistic and multi-scale and often rely on highly cooperative
institutional arrangements to achieve outcomes across landscapes. The forward linkages from
these activities to ultimate outcomes for livelihoods (the theory of change) would need to be
tested through research, but not at every site and for every company.
2. Global data sets and analysis
Global data sets on rural poverty can provide a metric towards the overall intended outcome
of pillar 2, but are not especially useful for the WBCSD CSA initiative because they do not
link to climate change or to private sector activities. On the other hand, the actual WBCSD
pillar 2 sub-components are difficult to aggregate and align with global data, as they apply to
individual communities (e.g. livelihoods) and companies (e.g. farmer training). FAOSTAT
does not have relevant data for that match the WBCSD sub-components of pillar 2.
3. Company data sets and analysis
Table 6 provides an overview of company reporting relating to pillar 2 sub-components. We
identified eight common indicators: total water use (2.1); livelihoods improved and farmer
loans (2.2); fair labour agreements (2.3); female farmers trained (2.4); farmers and
smallholders trained, and youth engagement (2.5).
21 Wezel, A., and V. Soldat. 2009. A quantitative and qualitative historical analysis of the scientific discipline of agroecology.
International Journal of Agricultural Sustainability 7 (1):3-18.
22 IIED 2014. Agroecology: What it is and what it has to offer.

26
Table 6 Summary of company data for pillar 2
Component of
WBCSD pillar 2
Indicator
categories used
by companies
Data available from
WBCSD members
Data from WBCSD members
that would improve the
analysis
2.2 Improve rural
incomes and
livelihoods
Livelihoods
improved
Three companies provide a
headcount of livelihood
improvements in 2015, and
one in 2010.
Common units for measuring
livelihood improvements
More comprehensive data on
e.g. income or assets
2.1 Implement agro-
ecological
approaches
Total water use Most companies report
total water use (m3) for
both 2010 and 2015.
Reporting of e.g. hectares
covered by agroecological
practices
2.3 Maintain long-
term fair
relationships with
smallholder
suppliers
Farmer loans One company measures
total value of loans (USD)
for 2010 and 2015.
More companies reporting
2.3 Maintain long-
term fair
relationships with
smallholder
suppliers
Fair labour
agreements
One company tracks the
percentage of farmers who
have entered a fair labour
agreement.
More companies reporting
2.4 Empower
women in
smallholder farmer
communities
Female farmers
trained
Three companies report,
with only one company
providing 2015 data for
number of female farmers
trained.
Data relating to
empowerment outcomes for
female farmers, e.g. income,
assets, etc.
2.5 Transfer skills
and knowledge to
smallholder farmers
Farmer training Three companies report
number of farmers trained
(not women or
smallholders specifically)
in 2010 and 2015.
More companies reporting
Clearer distinction between
farmers and smallholders
2.5 Transfer skills
and knowledge to
smallholder farmers
Youth
engagement
Two companies report for
2015, one for both 2010
and 2015.
More companies reporting
2.5 Transfer skills
and knowledge to
smallholder farmers
Smallholders
trained
Three companies report
number of smallholders
trained in 2015, one of
these in 2010.
More companies reporting
Clearer distinction between
farmers/smallholders
Notably absent in pillar 2 reporting are common indicators relating to agroecology. Following
Schaller (2013)23, agroecological approaches involve increasing natural, farmed or bred
functional biodiversity and reinforcing biological regulation. At present, WBCSD CSA
companies do not appear to be explicitly tracking activities within this frame or under the
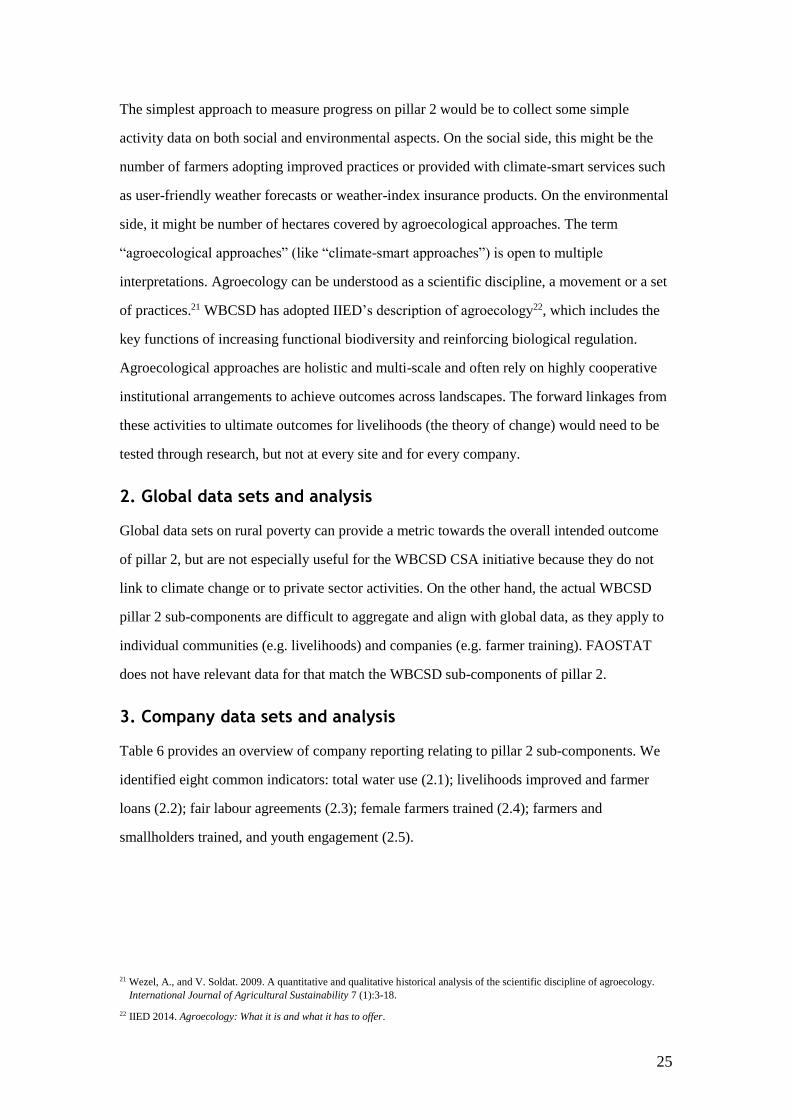
wider IIED definition. Rather, most companies report total water use – the most widely
reported indicator across pillar 2 – and companies tended to self-report this indicator under
the agroecology sub-component of pillar 2. While reducing water use is indeed important for
CSA, this indicator is perhaps a better fit for productivity; more efficient water use could fit
23 Schaller, N. 2013. Agro-ecology: different definitions, common principles.
http://agreste.agriculture.gouv.fr/IMG/pdf/analyse591307anglais.pdf

27
well under the pillar 1 goal of producing more food with less inputs. However, on average,
total water use rose 13% across the reporting companies (see Figure 7).
Reporting on rural incomes and farmer livelihoods is seldom quantitative. Monsanto reports a
“measurable improvement” in the incomes of resource-poor farmers but no actual numbers.
Kellogg tracks and conducts impact assessments on smallholder farmers24, and farmer
livelihoods in general, but there is little information showing progress compared to 2010.
DuPont quantifies the number of farmers, more than doubling the number of households with
improved livelihoods between 2012 and 2015, but the extent of these livelihood gains is not
specified. Starbucks reports a 46% increase in the value of loans granted to farmers from
2010-2015.
In terms of long-term fair relationships with farmers, Syngenta’s open data set provides
measures of seed supply farms covered by their Fair Labor Program, but data are only
available dating back to 2014. Olam’s Livelihood Charter appears to be tracking this
indicator, but the data are not accessible.
The only commonly reported metric for women’s empowerment is the quantity or percentage
of female farmers trained, reported by three companies. No companies reported the number of
women trained in 2010, limiting our ability to gauge progress. Additionally, it is also
questionable to what extent the indicator measures women’s empowerment. Linking training
to outcomes such as improvements in e.g. in wages and income compared to men, share of
assets, land tenure, and representation in key decision-making bodies could be more
illuminating.
Finally, companies track skill and knowledge transfer in terms of both farmer and smallholder
training, and youth engagement. Three companies tracked smallholder training (Syngenta,
Monsanto and Olam) and three tracked general farmer training (CP Foods, Olam, and
Syngenta) in 2015. In the baseline year of 2010, Syngenta was the only company reporting
smallholder training, while CP Foods, Olam, and Syngenta were the only companies reporting
farmer training. DuPont and CP Foods quantified youth engagement in 2015, but only DuPont
provided data for the baseline year of 2010.
24http://www.kelloggcompany.com/content/dam/kelloggcompanyus/corporate_responsibility/pdf/2015/KelloggSmallholdersand
WomenImpactAssessmentFINAL.pdf
28
Figure 7 Company reporting on percentage changes in water use, 2010-2015
4. Conclusions on progress
There are no quantitative CSA targets for pillar 2, nor relevant global data that match the
indicators that companies use for resilience. In addition, few companies report on resilience
indicators, let alone in both 2010 and 2015. Thus, it is impossible to make a general statement
on progress from 2010 to 2015, or make projections towards 2030. Total water use, the most
widely reported pillar 2 indicator, grew on average from 2010-2015. However, this indicator
does not sufficiently operationalize agroecological practices, limiting our ability to link it to
the overarching pillar 2 statement. For WBCSD members to demonstrate their collective
progress towards the CSA pillar on resilience globally, more companies will need to provide
quantitative information on indicators that cover both activities (e.g. training, on-farm
agroecological practices) and outcomes (e.g. incomes, women’s share of assets and
decisions).
-20%
-10%
0%
10%
20%
30%
40%
50%
60%
70%
Kellogg PepsiCo DuPont Coca-Cola Syngenta CP Foods Yara Average

29
Pillar three: mitigation
1. Recommended framework and indicators
The target for mitigation in the WBCSD Statement of Ambition is to “reduce GHG emissions
by at least 30% of annual agricultural CO2e emissions against 2010 levels (aligned with a
global 1.6 Gt CO2e/yr reduction by 2030).” This target includes both agricultural emissions
(and carbon sequestration on agricultural land) and emissions in the non-agricultural segments
of food supply chains, including input manufacture, transport, processing and retail – but not
emissions past the point of the consumer’s purchase of the food. A substantial portion of these
reductions may be achieved through reducing food waste. To identify indicators, we separate
out the components of this target as shown in Table 7.
Table 7 Recommended and current indicators for pillar 3
Component of
WBCSD pillar 3
Recommended
indicators that align
with WBCSD
processes or SDGs
Other recommended
indicators
Currently available indicators
among two or more WBCSD
CSA member companies
3.1 Direct
agricultural
emissions
(OUTCOME)
- WBCSD
Greenhouse Gas
Protocol
- Important to report
total emissions (and
fluxes), rather than
emissions intensity,
to align with the
Paris Agreement
- Total emissions
from farming
systems (CO2e)
- Scope 1&2
emissions from farms
or farming business
units (CO2e)
- Scope 3 emissions from
agricultural inputs, food
processing & retail companies
(CO2e)
3.2 Food supply
chain emissions
(OUTCOME)
- Emissions per unit
of value added (SDG
indicator 9.4.1)
- Scope 3 emissions
from agricultural
inputs, food
processing & retail
companies (CO2e)
- Scope 1&2 emissions from
agricultural inputs, food
processing & retail companies
(CO2e)
- Emissions intensity of
products (CO2e per kg)
- Use of resource-efficient
packaging
3.3 Deforestation
and other land use
change
(OUTCOME)
- Forests Solutions
Group zero
deforestation
commitment plus
commitment to
restore 30% global
forest cover (1990
levels) by 2050,
storing 45 Gt CO2e
- Total emissions
from land use change
(CO2e)
- Sustainable
sourcing/certification of
forestry-based goods

30
2. Global data sets and analysis
Table 8 summarizes FAOSTAT data on global direct agricultural emissions, highlighting a
3.3% increase in emissions from 2010-2014. If total agricultural emissions are to be reduced
30% compared to 2010 levels by 2030, emissions will need to decrease at a rate of
approximately 2.4%, year on year, from 2015. Figure 8 demonstrates projected BAU
agricultural emissions based on the past five years, versus a trajectory where total agricultural
emissions are reduced the necessary 2.4% per year, to reach a 30% reduction of emissions
compared to 2010 levels. This constitutes a total difference of over 2 gigatonnes, between
BAU and best case (target) scenarios. While the companies with baseline data have a 1.6%
share of the 2015 emissions burden, even if companies reduce their emissions footprint in line
with the 2030 target this will only provide a reduction equivalent to only .7% of total global
direct agricultural emissions.
Table 8 Summary of pillar 3 results for global emissions data
Global agricultural emissions 2010 (tonnes CO2e) 5,077,484,950
Global agricultural emissions 2014 (tonnes CO2e) 5,245,823,200
Percent change in emissions, 2010-2014 3.3%
Company share of global ag emissions, 2015 1.2%
Needed annual reduction in emissions to reach goal 2.4%
Figure 8 Projected total agricultural emissions between 2010 and 2030: WBCSD target
versus current trajectory
0
1000
2000
3000
4000
5000
6000
7000
20
10
20
11
20
12
20
13
20
14
20
15
20
16
20
17
20
18
20
19
20
20
20
21
20
22
20
23
20
24
20
25
20
26
20
27
20
28
20
29
20
30
Mil
lio
ns
t C
O2
e
Stock-take WBCSD target Current trajectory

31
3. Company data sets and analysis
Table 9 gives an overview of company data covering pillar 3. We established five common
indicators for pillar 3: Scope 3 emissions (3.1); Scope 1 & 2 emissions, emissions intensity
and resource efficient packaging (3.2); sustainable sourcing/certification of forestry-based
goods (3.3). Since none of the companies are solely agricultural companies (and only Olam
separates processing and farm emissions), Scope 3 emissions are assigned to sub-component
3.1. Likewise, Scope 1 & 2 emissions fall under sub-component 3.2, concerning food supply
chain emissions.
Table 9 Summary of company data for Pillar 3
Component of
WBCSD
pillar 3
Indicator categories
used by companies
Data available from
WBCSD members
Data from WBCSD
members that would
improve the analysis
3.1 Direct
agricultural
emissions
Scope 3 emissions
Almost half of the
companies report Scope 3
emissions for 2015, but
only three companies report
in 2010. One company
reports Scope 3 emissions
in both periods.
More transparent and
complete scope 3 reporting,
i.e. some companies only
consider a limited number
of factors (e.g. corporate
travel).
3.2 Food supply
chain emissions
Scope 1 & 2 emissions
Except for one company, all
companies report Scope 1
& 2 emissions for 2015.
Three companies do not
have Scope 1+2 emissions
available for 2010, or 2012.
Data from all companies, in
2010 and 2015.
3.2 Food supply
chain emissions
Emissions intensity Calculated based on Scope
1+2 emissions divided by
sales in USD.
The emissions intensity
measure used here does not
take into account margins.
Alternatively, could use
e.g. emissions per tonne of
food produced.
3.2 Food supply
chain emissions
Resource-efficient
packaging
Two companies report for
2015.
Harmonization of metrics.
For example, either percent
improvement in efficiency
compared to a common
baseline, or total weight of
packing or packaging
reductions.
3.3
Deforestation
and other land
use change
Sustainable
sourcing/certification
of forestry-based
goods
Two companies report for
2015.
Harmonization of metrics,
e.g. percent covered by
FSC. Alternatively, tonnes
of C (or CO2e) avoided or
sequestered.
While nearly half of the companies reported their Scope 3 emissions in 2015, only three
companies reported in 2010. Only one of these companies reported Scope 3 emissions in both
periods, limiting our ability to trace progress over time. A further complication is that some
32
companies were not able to holistically report their Scope 3 emissions. For example,
DuPont’s 2015 CDP report states that the uncertainty regarding emissions from use of sold
products, expected to be the most important Scope 3 category, is too significant to report25.
Except for Tyson Foods, all companies reported Scope 1 & 2 emissions in 2015. Monsanto,
Tyson Foods and Unilever did not report this indicator in 2010. While some companies
directly reported emissions intensity, there were discrepancies. For example, some companies
calculated intensity based on emission per kilo product, while others calculated it based on
revenue. To harmonize intensity, we calculated emissions intensity for all companies that
provided Scope 1 & 2 emissions, based on emissions divided by total revenue (from Forbes).
Few companies reported on improved packaging efficiency. The companies that reported on
this indicator used varying metrics: percentage of total packing reduced, reduction in
packaging weight, and reduction in fibre usage. Sustainable sourcing of wood-based materials
faced similar problems, with companies reporting measures such as net deforestation link to
products, percentages of key crops sourced in areas where deforestation is not a risk, and
percent of cardboard materials derived under certification. Due to the lack of similar measures
and data from 2010, we could not assess progress for either of these indicators.
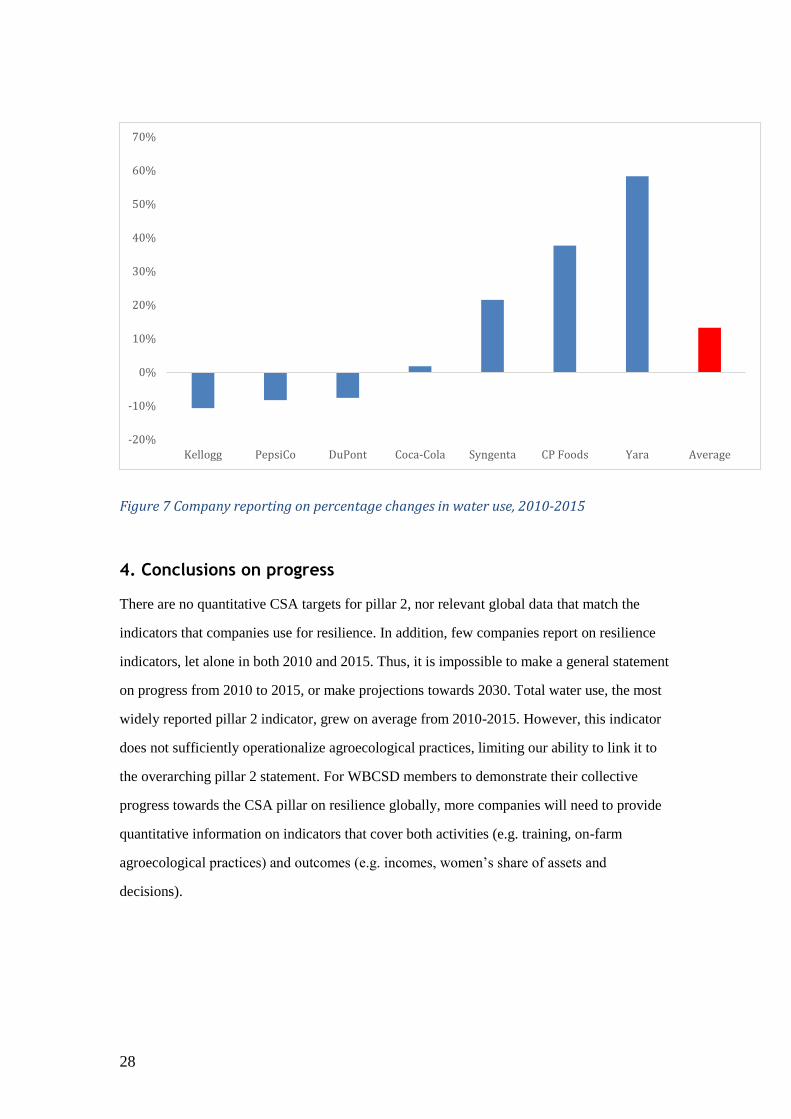
To measure progress within Pillar 3, we calculated the percentage change in Scope 1 & 2
emissions across companies, comparing the latest data against available baseline data. Figure
9 depicts percentage change in Scope 1 & 2 CO2e emissions from 2010-2015, across the ten
companies. Except for Olam, absolute Scope 1 & 2 CO2e emissions increased for all
companies with available data from 2010-2015. Companies’ Scope 1 & 2 emissions are not
directly comparable to global agricultural emissions; for most WBCSD member companies,
agricultural emissions will be Scope 3 emissions. We can see that companies’ Scope 1 & 2
emissions are rising faster than agricultural emissions. On average, company emissions
increased approximately 9%, compared to global direct agricultural emissions, which
increased only 3.3% from 2010-2014.
25 http://www.dupont.com/content/dam/dupont/corporate/our-approach/sustainability/documents/DuPont-
ProgrammeResponseClimateChange-2015.pdf

33
Figure 9 Company reporting on percentage change in Scope 1+2 emissions, 2010-2015
However, solely examining absolute CO2e emissions provides a limited perspective on
company progress. For example, as the global economy recovers from recent financial crisis,
overall sales and production are likely to be greater in 2015 compared to 2010, bringing larger
absolute emissions. Alternatively, companies may have increased their market share or carried
out mergers within the period, which can be assumed to be associated with a heavier total
emissions output due to increased production capacity. Even if companies improve their
carbon efficiency, a larger production may obfuscate potential efficiency gains when looking
at absolute emissions. Instead, evaluating relative emissions intensity (i.e. tonnes CO2e per
USD in revenue) provides a more nuanced picture.
Figure 10 demonstrates that while total emissions increased from 2010-2015, emissions
intensity decreased in the same timeframe for most companies. This indicates that progress is
being made in increasing efficiency and reducing emissions, with companies achieving varied
levels of success.
-15%
-10%
-5%
0%
5%
10%
15%
20%
25%
30%
35%
Olam Kellogg PepsiCo DuPont Syngenta CP Foods(baseline
2012)
Coca-Cola Yara(baseline
2011)
Diageo Starbucks Average

34
Figure 10 Company reporting on Scope 1 & 2 emissions intensity, 2010-2015
4. Conclusions on progress
Between 2010 and 2015, global direct agricultural emissions and company Scope 1 & 2
emissions increased, 3.3% and 9% respectively. If direct agricultural emissions continue
along the same trend they exhibited from 2010-2014, the 2030 goal of 30% emissions
reductions compared to 2010 will not be met. Nevertheless, companies generally reduced the
intensity of their own operations, showing that some progress is being made to reach the
target. However, reporting on Scope 3 emissions is not currently pervasive enough to report
on company progress tied specifically to agricultural emissions. In addition, harmonized
indicators and further reporting would be necessary to track company progress on emissions
linked to post-production activities such as packaging, transport and refrigeration.
Deforestation, a major source of global emissions associated with agriculture, will also
contribute to Scope 3 emissions for some companies.
-70%
-60%
-50%
-40%
-30%
-20%
-10%
0%
10%
20%
0
0.2
0.4
0.6
0.8
1
1.2
1.4
1.6
1.8
2
CP Foods Olam Starbucks PepsiCo Coca-Cola Syngenta KelloggCompany
Yara DuPont Diageo
% c
han
ge i
n i
nte
nsi
ty
Kg
CO
2e/
USD
2010 2015 % change in emissions intensity, 2010-2015

35
Conclusions and ways forward
Opportunities for companies: building CSA metrics into regular
practice
Climate change is an increasing risk for companies operating in agriculture and food systems.
There may be strong rationale to build climate risk assessment into current systems, not as a
standalone “CSA” initiative but simply through integration of a few additional indicators into
regular monitoring and evaluation protocols. The sections above on each CSA pillar provide
recommendations of indicators, drawing directly from the SDGs and existing WBCSD work
where possible.
An important consideration for any company is how any activity or intervention will lead to
desired outcomes for productivity, resilience and mitigation, taking into account scale effects
and trade-offs. Several tools now exist to help farming operations and rural development
projects to weigh up options for agricultural investment. A useful resource, particularly at the
level of farm operations, is the CSA Planning and Indicator Tool (https://ccafs.cgiar.org/csa-
programming-and-indicator-tool). This guides the user through a process to: consider how an
intervention will perform on each CSA pillars, to compare the scope and CSA intentionality
among different project designs, and to select CSA indicators. The tool includes a database
with information and links for more than 350 CSA indicators that are currently used by
international development agencies, the private sector, NGOs and research institutes.
Opportunities for road-test countries: shared measurement across
value chains
Food systems are complicated, with many interconnections and feedback loops. Real progress
towards the Statement of Ambition on CSA will benefit from systems-wide action and
collaboration, going well beyond what companies can do individually. For a nutrient supply
company, for example, helping to raise smallholder productivity might involve higher
company-level emissions as more mineral fertilizer is manufactured to meet demand, but a
value-chain and landscape approach might demonstrate how this is more than offset by gains
in local livelihoods and resilience, coupled with reduced deforestation. For an insurance
company, the returns to a crop weather insurance product might increase dramatically if

36
issued with lower premiums for farmers who use agroecological approaches, climate-adapted
breeds or other proven CSA practices.
The WBCSD CSA road-test countries and regions provide an innovative opportunity to
implement CSA across whole value chains and landscapes – and to test and measure how
scale effects and trade-offs can be managed in the real world. If relevant companies are
ready, willing and able to invest in shared monitoring and evaluation, this is also an
innovative opportunity to improve businesses’ ability to trace, measure, monitor and
communicate progress on CSA.
How are we doing? Progress and outlook on the global Statement of
Ambition
The WBCSD CSA working group plans to report in 2018 on progress towards the global
Statement of Ambition. The snapshot of progress we have for each pillar between 2010 and
2015 is that:
For pillar 1, productivity, we are exceeding targets for global food production. However we
have less information on whether this food is nutritious, available and affordable. We also
need to know more about whether we are achieving higher productivity per unit of input, and
sustainable use of resources, not just higher production.
For pillar 2, resilience, we know very little indeed. Neither companies nor global datasets are
keeping track of the resilience and welfare of agricultural communities and landscapes under
climate change.
For pillar 3, mitigation, we are falling behind targets for agricultural and food system
emissions. While there have been some impressive improvements in emissions intensity for
some foods and beverages, increasing levels of production mean that absolute emissions are
rising.
In short, a lot of work needs to be done – on measurement of course, but more importantly on
action. WBCSD member companies have rightly set out an ambitious statement of intent to
address the massive climate challenges that global society faces together. This early snapshot
of progress can hopefully stimulate shared learning and renewed investment.

The CGIAR Research Program on Climate Change, Agriculture and Food
Security (CCAFS) is a strategic initiative of CGIAR and Future Earth, led by the
International Center for Tropical Agriculture (CIAT). CCAFS is the world’s most
comprehensive global research program to examine and address the critical
interactions between climate change, agriculture and food security.
For more information, visit www.ccafs.cgiar.org
Titles in this Working Paper series aim to disseminate interim climate change,
agriculture and food security research and practices and stimulate feedback
from the scientific community.
Research supported by:
CCAFS is led by: Strategic partner: