measuring respiration or other periodic physiological ...davidc/pubs/patent_gpbr.pdf · measuring...
TRANSCRIPT

1
MEASURING RESPIRATION OR OTHER PERIODIC PHYSIOLOGICAL PROCESSES
The present invention provides an improved way of monitoring periodic physiological
processes and is particularly applicable to measuring respiratory rate.
Respiratory rate has been shown to be an important indicator of patient deterioration [4], [11], 5
and extreme values of respiratory rate are associated with an increased risk of adverse events in
hospital patients [4], [11], [5]. The importance of assessing respiratory rate has led to its inclusion in
most numerical patient assessment systems, often termed early warning scores or EWS [6], the use of
which is widespread. Such systems typically consist of the application of univariate scoring criteria to
observational physiological variables (including the vital signs) and produce a cumulative score that 10
can, if it exceeds a predefined threshold, lead to identification of physiological deterioration in
acutely-ill hospital patients. While automated techniques exist for measuring respiratory rate, they
usually require the use of equipment which might interfere with natural breathing, such as spirometry,
or might be uncomfortable for the patient, such as measurement via a band that encircles the chest.
The signals acquired from conventional methods, including impedance plethysmography (IP), are 15
often unusable as a result of a poor signal-to-noise ratio and are sensitive to frequent movement
artefact [12].
The ECG signal, recorded for most acutely ill patients, has been considered as a source of
potentially reliable respiratory information. Respiratory activity may cause the ECG to be modulated
in two fundamental ways: R-peak amplitude (RPA) modulation, which is caused by the movement of 20
the chest due to the filling and emptying of the lungs (which in turn causes a rotation of the electrical
axis of the heart and the consequent modulation of the amplitude of the ECG) [2], and respiratory
sinus arrhythmia (RSA), which is a frequency modulation, corresponding to a variation in heart rate
that occurs throughout the respiratory cycle [2], [8]. Much previous work exists concerning the
estimation of respiratory rate from ECG or other signals, such as the photoplethysmogram or PPG, 25
and the arterial blood pressure (ABP) waveform [18]. These approaches are based on either the RPA-
or RSA-modulated signals (or a combination of both), and use a variety of algorithms based on
spectral analysis [1], the continuous wavelet transform [3], neural networks [10], and autoregressive
models [13], [14]. Small errors (around 1 to 2 breaths per minute) between estimates derived from
these signals and reference respiratory rate values have been reported [1], [13], [14] for studies of 30
healthy volunteers.
A drawback with these approaches, however, is that they provide a point estimate of the
respiratory rate. The uncertainty associated with the estimated value cannot be directly quantified, due
to the nature of the algorithms employed. Experience has shown that existing methods tend to work
relatively reliably for healthy volunteers but are less successful for patients who are unwell and/or 35
elderly. In the absence of a robust method of identifying an error associated with the point estimate of

2
respiratory rate, a clinician is unable to distinguish between point estimates that correctly indicate the
state of the patient and those that are dominated by noise.
It is an object of the invention to address at least partially one or more of the shortcomings
described above in relation to the prior art.
According to an aspect of the invention, there is provided a method of obtaining information 5
about the rate of a periodic physiological process from a time series of measurements obtained from a
patient, comprising: obtaining the time series of measurements; fitting a model defining a probability
distribution over functions to the time series of measurements, wherein the model is defined by a
mean function and a periodic covariance function determined using prior knowledge of the
physiological process under observation; and outputting the result of the fitting as information about 10
the rate of the periodic physiological process.
Thus, an intrinsically probabilistic method is employed that is able to output probabilistic
information about the rate of a periodic physiological process (e.g. respiratory rate). For example, the
information may comprise not only an estimate of the rate of the periodic physiological process, but
also a statistically derived measure of the uncertainty of the estimate (in contrast to the prior art, 15
which is only able to output a point estimate of the rate). A clinician is therefore able to make a well
informed judgement about whether a particular reading is statistically significant (which might
prompt the clinician to take action if the reading is outside of a normal range for example) or
statistically insignificant (i.e. dominated by noise, in which case the clinician may not react to the
reading in the same way). Alternatively or additionally the information may comprise a probabilistic 20
posterior distribution over the rate (for example as part of a joint distribution over the
hyperparameters of the covariance function). This is useful if the output from the method is to be used
as the input to a subsequent probabilistic inference system, where knowing the full distribution of the
input is more informative than a point estimate.
Choosing a model that defines a probability distribution over functions (e.g. a Gaussian 25
Process model) and selecting a covariance function that is periodic, enables the rate and uncertainty to
be extracted directly from an analysis of the joint probability distribution over the hyperparameters of
the covariance function. One of the hyperparameters will define the periodicity of the covariance
function, which after fitting to the input time series of measurements will correspond to the
periodicity of the underlying rate to be measured. Thus, by analysing the joint probability distribution 30
over the hyperparameters it is possible to obtain the estimate of the rate and of the uncertainty in the
rate, for example by estimating the mode and covariance of the distribution over the hyperparameters.
The use of a probabilistic framework (such as Gaussian process regression) brings all of the
advantages of a principled, probabilistic approach: the uncertainty in the estimation is directly
quantified; incompleteness, noise, and artefact may be handled in a robust manner; and the output 35
may consist of a predictive posterior distribution, rather than a single estimate. Additionally, due to

3
the generative nature of the approach, it is possible to generate data from the model, which can be
useful for estimating the behaviour of respiratory rate during periods of missing data.
According to a further aspect of the invention, there is provided a patient monitor that
comprises one or more sensors for receiving a time series of measurements and a processor adapted to
execute a method of obtaining information from the time series of measurements according to an 5
embodiment of the invention.
According to a further aspect of the invention, there is provided a patient monitoring system
comprising a patient monitor according to an embodiment of the invention and a probabilistic
inference system that uses the output from the patient monitor together with other probabilistic
information about the patient obtained from the patient monitor and/or from other sources to detect an 10
abnormal state of the patient (or to otherwise classify the state of the patient and/or make or assist
with diagnosis of a condition).
The invention may be embodied in computer software adapted to execute the method on a
programmed computer system. The computer software may be stored in a portable medium, in
memory, or transmitted as a data signal. The programmed computer system may comprise standard 15
computer hardware such as CPU, RAM, etc. that is well known to the skilled person.
The invention will be further described by way of example with reference to the
accompanying drawings in which:
Figure 1 is a flow chart illustrating the framework of an example method for obtaining
information about the rate of a periodic physiological process; 20
Figure 2 is a flow chart illustrating an example approach for obtaining the mode and
covariance of hyperparameters;
Figure 3 depicts a patient monitor and patient monitoring system;
Figure 4 depicts extraction of respiratory rate from single-lead ECG: (a) ECG signal; (b)
Reference (IP) respiration signal; (c) RSA waveform from the R-R intervals time series; (d) RPA 25
waveform from the R-peaks time series; (e) Final respiratory rate estimates from the AR- and GP-
based methods;
Figure 5 depicts histograms showing the percentage error E between the proposed method and
a “gold standard” reference respiratory rate as follows: data are first partitioned into 1-minute
windows. The method is then used to estimate the respiratory rate on each window of data separately. 30
The estimate of respiratory rate for each window is then compared with the reference rate, to give the
percentage error E, which is shown on the x-axis. The histograms show the number of windows with
different ranges of percentage error, E, using data for “young” and “elderly” subjects.
According to an embodiment, there is provided a method of obtaining information about the 35
rate of a periodic physiological process from a time series of measurements obtained from a patient.
In an embodiment, the physiological process is breathing and the rate is the respiratory rate. In

4
another embodiment, the physiological process is pumping of blood around the body by the heart and
the rate is the heart rate. The time series of measurements may consist of the output from a sensor at a
plurality of different times. The output may be selected so as to be sensitive to the physiological
process being measured (i.e. so that the physiological process can modulate the signal in a measurable
way). Specific examples are mentioned below. The different times at which the time series of 5
measurements are provided may be equally or irregularly spaced. The times series of measurements
may comprise the output from plural different sensors at plural different times or plural outputs from
the same sensor at each of a plurality of different times.
In an embodiment, the time series of data comprises either or both of R-R peaks and R-R
intervals, respectively from RPA and RSA waveforms. In an embodiment, the times series of 10
measurements comprise a time series of one or more of the following: photoplethysmogram data
(acquired from pulse oximetry, or from a video camera recording an area of the patient’s skin),
arterial blood pressure waveform data, ECG data.
In an embodiment, as illustrated in the flow chart of Figure 1, the method comprises the step
(S1) of obtaining the time series of measurements. The time series of measurements may be obtained 15
directly (i.e. substantially in real time) from a sensor on or in close proximity to the patient’s body.
Alternatively, the times series of measurements may have been obtained by a sensor at an earlier time
(e.g. such that all of the time series of measurements was obtained by the sensor and stored before any
of the data is used in the method of Figure 1), in which case the time series of measurements may be
retrieved from a storage device containing the earlier obtained data (e.g. over a data connection or via 20
direct access to the storage device).
In a subsequent step (S2), a model is fitted to the time series of measurements (this step may
also be referred to as a “training” step). The model is of a type that defines a probability distribution
over functions. The time series of measurements represents one example of points that occur within
such a function. The fitting of the model involves obtaining an estimate of the probability distribution 25
over functions that best fits the time series of measurements. In an embodiment, the fitting involves
estimating the mode and covariance of a joint distribution over hyperparameters defining the model.
The fitting process provides information about the rate of the periodic physiological process
being measured, which may be output (step S3) for further processing or display for example. The
output may comprise a probability distribution of the rate or an estimate of the rate and an uncertainty. 30
The uncertainty in the rate may be derived from the quality of the fit to the time series data, or from
the variance of the distribution over the rate. The model may be characterized by a covariance
function that is periodic and the information about the rate may be obtained from an estimate of the
distribution of the hyperparameter that defines the periodicity of the covariance function (step S31).
For example, a distribution over all of the hyperparameters defining the model may be 35
obtained from the fitting. The mode of the distribution may be obtained, which will comprise a
distinct mode value for each of the hyperparameters considered. An estimate of the rate can then be

5
derived from the mode of the particular hyperparameter which defines the periodicity of the
covariance function of the model. The uncertainty in the rate can then be obtained from the variance
of that hyperparameter at the mode of the distribution of hyperparameters. The variance of this
hyperparameter at the mode can be obtained from the covariance of the distribution over all of the
hyperparameters. 5
Alternatively or additionally, the output step S3 comprises a step (S32) of outputting a
posterior probability distribution over the hyperparameters for use, for example, in a probability
inference system.
In an embodiment, the model is a Gaussian process model and the fitting process is an
example of Gaussian process regression. 10
In an embodiment, the periodic covariance function (i.e. the form of the periodic covariance
function) is determined using prior knowledge of the physiological process. The fact that the
covariance function is periodic already encodes prior knowledge that the physiological process is
periodic. The form of the periodic covariance function may however be configured to encode further
prior knowledge that may be available. For example, the periodic covariance function may encode 15
prior knowledge that the rate of the physiological process will drift through time. This may be
achieved for example by including a hyperparameter representing a length scale of the periodic
covariance function. An example of such a hyperparameter is the hyperparameter discussed below
in the context of the “detailed example”. Modifying the periodic covariance function to include prior
knowledge may improve (e.g. in terms of efficiency and/or accuracy) the fitting of the model to the 20
time series of measurements.
Figure 2 illustrates in further detail how the fitting/training step S2 and output step S31 may
be configured in a particular embodiment. According to this embodiment, the fitting/training step S2
comprises a step S21, in which an estimate of the mode of a joint distribution over the
hyperparameters is obtained using a maximum a posteriori (MAP) estimate. This mode is then used 25
to output an estimate of the rate (step S311) as part of the output step S31. According to this
embodiment, the fitting/training step S2 further comprises a step S22, in which the covariance is
obtained using the inverse of the negative Hessian matrix about the mode obtained in step S21. The
covariance can then be used to derive a quantitative measure of the uncertainty in the rate value output
in step S311, which may be output in step S312. 30
Figure 3 depicts an example of apparatus that could be configured to implement a method
according to an embodiment. The depicted apparatus comprises a patient monitor 2 comprising a data
processor 4 (comprising for example, CPU, motherboard, RAM, etc.) configured to carry out the data
processing operations necessary to implement the method of obtaining information about the rate of
the periodic physiological process according to an embodiment. The patient monitor 2 shown 35
comprises an I/O interface 6 for receiving data from one or more sensors 12,14, or from a data source,

6
in order to obtain the required time series of measurement data that is used for fitting to the model
(e.g. using Gaussian process regression). The sensor(s) 12,14 may be adapted to obtain
photoplethysmogram data (from either a pulse oximeter or from video camera recordings of a
patient’s skin), arterial blood pressure waveform data and/or ECG data for example.
The patient monitor 2 comprises a further I/O interface 8 for outputting information about the 5
rate that has been derived from the input times series of measurement data. In the particular
embodiment shown, the output data 10 is transmitted (e.g. via a network connection) to an input
interface 20 of a patient monitoring system 18. The patient monitoring system 18 may be configured
to store the data output from the patient monitor 2 in memory 16, for example, and/or display the data
on display 22. In an embodiment, the patient monitoring system 18 comprises a probabilistic 10
inference system 24 (which may comprise standard computer hardware programmed for carrying out
a probabilistic inference method) and the patient monitor 8 may be configured to output a
probabilistic posterior distribution over the rate. The probabilistic inference system 24 may be
configured for example to detect an abnormal state of the patient by combining the output 10 from the
patient monitor 2 with one or more further probabilistic information inputs (input via an I/O interface 15
20 for example) derived from other measurements performed on the patient.
DETAILED EXAMPLE
The presence of respiratory information within the electrocardiogram (ECG) signal is a well-
documented phenomenon. In the detailed example described below, a Gaussian process framework is 20
used for the estimation of respiratory rate from different sources of modulation in a single-lead ECG.
A periodic covariance function is used to model the frequency- and amplitude-modulated time series
measurements derived from the ECG, where the hyperparameters of the process are used to derive the
respiratory rate. In the particular example described, the approach is evaluated using data taken from
40 healthy subjects each with 2 hours of monitoring, containing ECG and respiration (impedance 25
plethysmography, or IP) waveforms. Results indicate that the accuracy of the example method is
comparable with that of existing methods, which are non-probabilistic, but with the advantages of the
example method being a principled probabilistic approach, including the direct quantification of the
uncertainty in the estimation.
To illustrate the efficacy of an embodiment of the invention, the method was applied to data 30
from the Physiobank/Physionet Fantasia database [7], [9]. The latter consists of data acquired from
two subgroups of volunteers: 20 “young” (21 - 34 years old) and 20 “elderly” (60 - 85 years old)
healthy subjects who underwent 120 minutes of continuous supine rest (while watching the film
“Fantasia”). Continuous single-lead ECG and respiration (IP) signals were collected. Each subgroup
of subjects includes equal numbers of men and women. 35
7
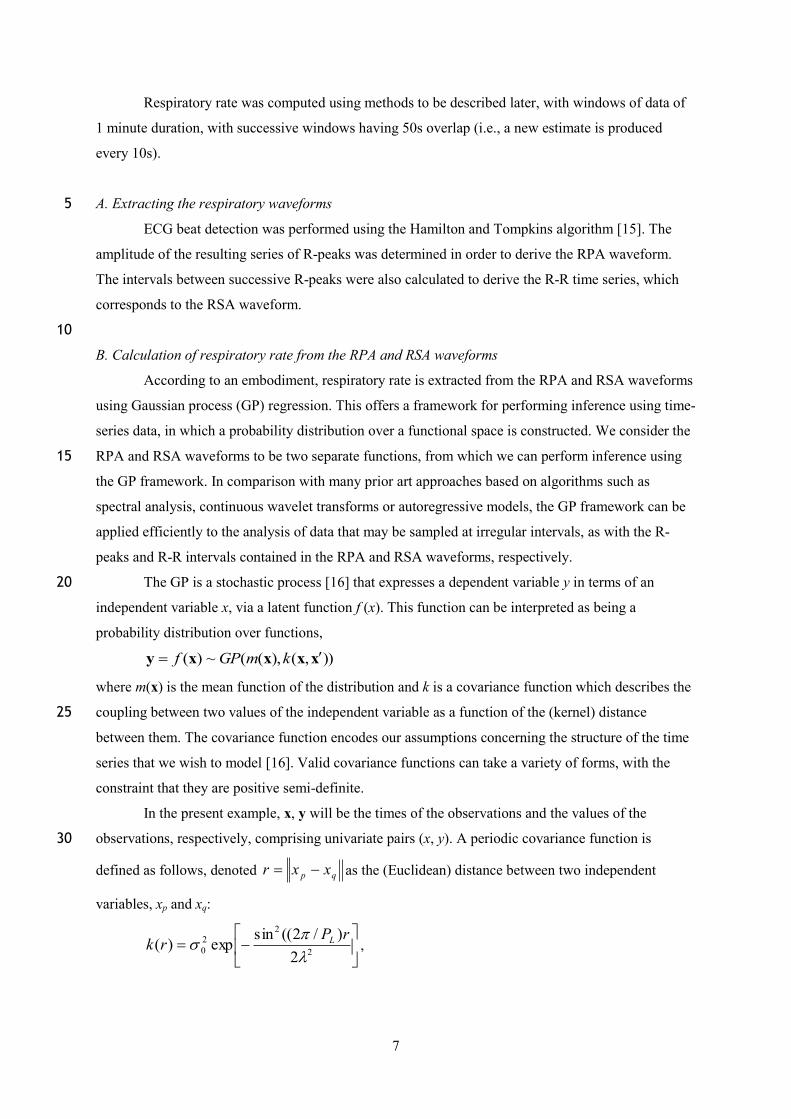
Respiratory rate was computed using methods to be described later, with windows of data of
1 minute duration, with successive windows having 50s overlap (i.e., a new estimate is produced
every 10s).
A. Extracting the respiratory waveforms 5
ECG beat detection was performed using the Hamilton and Tompkins algorithm [15]. The
amplitude of the resulting series of R-peaks was determined in order to derive the RPA waveform.
The intervals between successive R-peaks were also calculated to derive the R-R time series, which
corresponds to the RSA waveform.
10
B. Calculation of respiratory rate from the RPA and RSA waveforms
According to an embodiment, respiratory rate is extracted from the RPA and RSA waveforms
using Gaussian process (GP) regression. This offers a framework for performing inference using time-
series data, in which a probability distribution over a functional space is constructed. We consider the
RPA and RSA waveforms to be two separate functions, from which we can perform inference using 15
the GP framework. In comparison with many prior art approaches based on algorithms such as
spectral analysis, continuous wavelet transforms or autoregressive models, the GP framework can be
applied efficiently to the analysis of data that may be sampled at irregular intervals, as with the R-
peaks and R-R intervals contained in the RPA and RSA waveforms, respectively.
The GP is a stochastic process [16] that expresses a dependent variable y in terms of an 20
independent variable x, via a latent function f (x). This function can be interpreted as being a
probability distribution over functions,
)),(),((~)( xxxxy kmGPf
where m(x) is the mean function of the distribution and k is a covariance function which describes the
coupling between two values of the independent variable as a function of the (kernel) distance 25
between them. The covariance function encodes our assumptions concerning the structure of the time
series that we wish to model [16]. Valid covariance functions can take a variety of forms, with the
constraint that they are positive semi-definite.
In the present example, x, y will be the times of the observations and the values of the
observations, respectively, comprising univariate pairs (x, y). A periodic covariance function is 30
defined as follows, denoted qp xxr as the (Euclidean) distance between two independent
variables, xp and xq:
2
22
02
)/2((sinexp)(
rPrk L
,
8
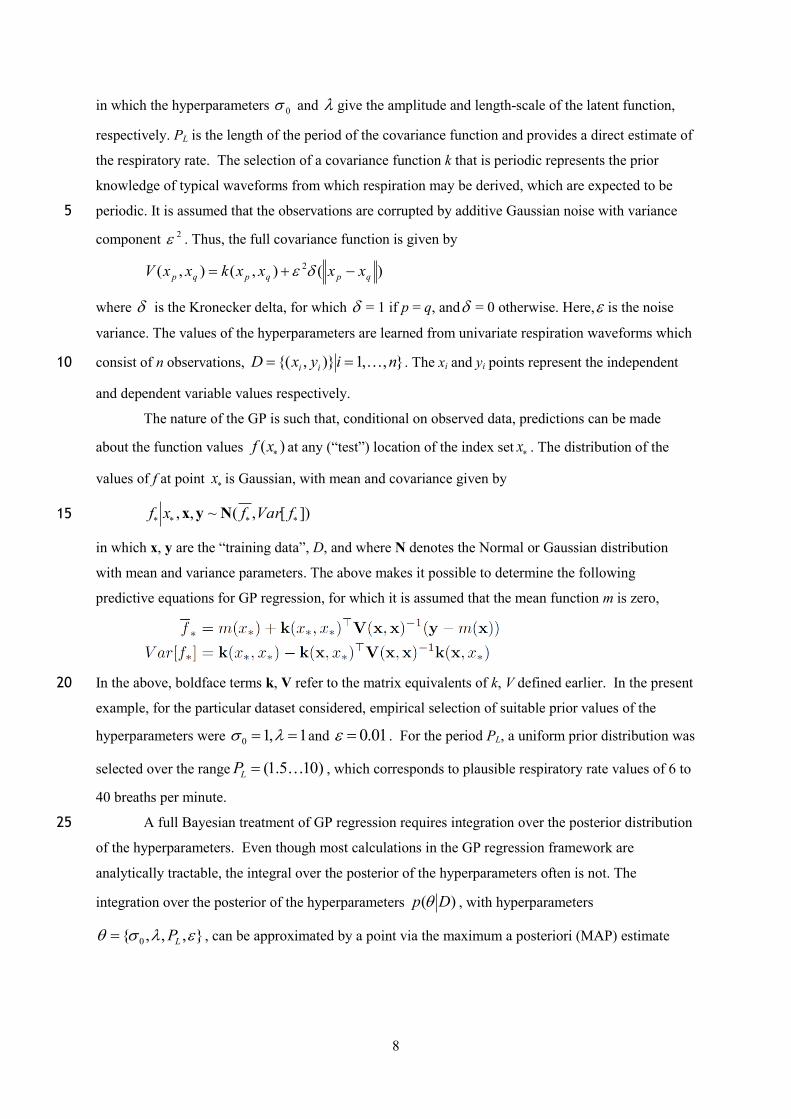
in which the hyperparameters 0 and give the amplitude and length-scale of the latent function,
respectively. PL is the length of the period of the covariance function and provides a direct estimate of
the respiratory rate. The selection of a covariance function k that is periodic represents the prior
knowledge of typical waveforms from which respiration may be derived, which are expected to be
periodic. It is assumed that the observations are corrupted by additive Gaussian noise with variance 5
component 2 . Thus, the full covariance function is given by
)(),(),( 2
qpqpqp xxxxkxxV
where is the Kronecker delta, for which = 1 if p = q, and = 0 otherwise. Here, is the noise
variance. The values of the hyperparameters are learned from univariate respiration waveforms which
consist of n observations, },,1)},{( niyxD ii . The xi and yi points represent the independent 10
and dependent variable values respectively.
The nature of the GP is such that, conditional on observed data, predictions can be made
about the function values )( xf at any (“test”) location of the index set x . The distribution of the
values of f at point x is Gaussian, with mean and covariance given by
])[,(~,, fVarfxf Nyx 15
in which x, y are the “training data”, D, and where N denotes the Normal or Gaussian distribution
with mean and variance parameters. The above makes it possible to determine the following
predictive equations for GP regression, for which it is assumed that the mean function m is zero,
In the above, boldface terms k, V refer to the matrix equivalents of k, V defined earlier. In the present 20
example, for the particular dataset considered, empirical selection of suitable prior values of the
hyperparameters were 1,10 and 01.0 . For the period PL, a uniform prior distribution was
selected over the range )105.1( LP , which corresponds to plausible respiratory rate values of 6 to
40 breaths per minute.
A full Bayesian treatment of GP regression requires integration over the posterior distribution 25
of the hyperparameters. Even though most calculations in the GP regression framework are
analytically tractable, the integral over the posterior of the hyperparameters often is not. The
integration over the posterior of the hyperparameters )( Dp , with hyperparameters
},,,{ 0 LP , can be approximated by a point via the maximum a posteriori (MAP) estimate

9
In this approximation, the distribution over the hyperparameters is assigned a point mass at the mode
of the posterior, allowing the marginal distribution of the latent function to be approximated by
)ˆ,()( DfpDfp . This approach is computationally attractive. The grid search approximation to
the full integral over the posterior distributions of the hyperparameters follows the work of Rue et al. 5
[17], in which the posterior mode is first located by maximising the log-posterior distribution
)(log yp , and the shape of the log-posterior is approximated with a Gaussian, the covariance
of which is the inverse of the negative Hessian at the mode (more details may be found in [16], [17]).
In the present example, for each 60s window, the RPA and RSA time series are first
normalized using a zero mean, unit-variance transformation. A Gaussian process is then fitted to each 10
of the waveforms, using the procedure described above to obtain an estimate of both the value and
uncertainty of the respiratory rate value (directly from the distribution over the period, PL). The
estimate with lower uncertainty (i.e., where the posterior distribution had lowest variance) was chosen
as the final estimate of the respiratory rate for that window.
The performance of the present example was compared with that of the autoregressive model, 15
a parametric, non-probabilistic spectral analysis technique that has been successively applied to this
problem [13], [14]. This method requires equispaced samples, and so the time series of R-R intervals
and R-peaks were resampled at 4 Hz, and the RPA and RSA waveforms were obtained using linear
interpolation. Each of the waveforms was then filtered using an FIR band-pass filter with cut-off
frequencies of 0.1 and 0.6 Hz (equivalent to respiratory rates of 6-36 breaths per min). Following 20
previous methods, the steps involved in estimating respiratory rates are as follows for each of the RPA
and RSA waveforms: (i) fit an AR model to each 60 s window of resampled data; (ii) reject all poles
with frequencies corresponding to respiratory rates outside the range of physiologically-plausible
values (6-36 breaths per min); (iii) keep all poles with magnitude of at least 95% of the remaining
highest-magnitude pole; and (iv) select the pole remaining that has the smallest angle. The frequency 25
associated with this pole is the estimate of respiratory rate for this waveform. Finally, the respiratory
rate corresponding to the pole with the highest magnitude (extracted from the two waveforms) was
selected as the final respiratory rate for that window.
C. Reference respiratory rate 30
A reference respiratory rate was calculated from the IP signal in the database using both an
extrema detection algorithm and an AR-based method. With the latter, the respiration signal was
down-sampled to 4 Hz, after applying an anti-aliasing filter, and a 0.1-0.6 Hz FIR band-pass filter was

10
then applied. The resulting waveform was then fitted to an AR model and the respiratory pole
identified using the same method as described in the previous section. Only those reference
waveforms for which the agreement between both extrema- and AR-based estimates was within 3
breaths per min were retained (”valid windows”). As a result, 72% of the available windows were
deemed to be ”valid”. This approach ensures only the highest quality reference values are considered 5
by potentially eliminating regions of low IP quality.
Results
Over the entire database, the mean reference respiratory rate was 9.23.18 breaths per min
( 8.29.17 for the young subjects and 0.38.18 for the elderly subjects). Figure 4 shows an example 10
from a 1-minute window of data. In general, as illustrated in the figure, it can be seen that the values
extracted using the AR method and the proposed GP method are close to the corresponding reference
respiratory rate. However, using the GP-based approach, it is possible explicitly to quantify the
uncertainty in the estimated value by computing the variance of the posterior distribution drawn from
the related period length parameter (PL) of the GP. The uncertainty of an estimate may be due to the 15
presence of noise in the derived respiration waveform (which in turn may be caused by a bad
performance of the beat detector), which precludes an accurate estimation of the respiratory rate. In
such cases, the precision (inverse of the variance) of the estimate is very low.
The performances of the AR and proposed methods were assessed by calculating the mean
absolute error (MAE) in breaths per min,
n
i irefi yyn
MAE1 ,
ˆ1
, where n is the number of valid 20
windows over the entire database of both groups (young and elderly subjects), iy is the estimated
respiratory rate (mean posterior value in the case of the GP-based method) irefy , is the reference
respiratory rate for window i. Table I shows MAE for different ranges of respiratory rates.
25
While both methods show similar performance, both performed better for the young group of
patients. As the respiratory rate increases (or decreases), the estimation errors also increase. Crucially,
it can be seen that the method disclosed herein is more accurate for higher respiration rates in the

11
elderly, which is the typical target population. To assess further the performance of the method, the
percentage of valid windows for different ranges of the percentage error were calculated (see Figure
5), which is given by 100ref
MAEE
, where ref is the mean of the reference respiratory rates over
each of the two patient groups. This is a useful metric since the significance of MAE is different
depending on the actual respiratory rate. It can be seen that both methods perform similarly. 5
Thus, a novel probabilistic approach for extracting respiratory rate from time-series sensor
data using Gaussian processes is provided. The method is able to give not only a point estimate of the
breathing rate, but, for the first time, a measure of uncertainty of the estimate. By applying this
technique to a database of 40 healthy subjects, it has been demonstrated that it is possible to match the
performance of the existing state-of-the-art, while bringing the benefits of a probabilistic framework. 10
REFERENCES
[1] K.H. Chon, S. Dash, and K. Ju. Estimation of respiratory rate from photoplethysmogram data
using time–frequency spectral estimation. IEEE Transactions on Biomedical Engineering,
56(8):2054–2063, 2009. 15
[2] G.D. Clifford, F. Azuaje, P. McSharry, et al. Advanced methods and tools for ECG data analysis.
Artech House, 2006.
[3] D. Clifton, J.G. Douglas, P.S. Addison, and J.N. Watson. Measurement of respiratory rate from
the photoplethysmogram in chest clinic patients. Journal of clinical monitoring and computing,
21(1):55–61, 2007. 20
[4] M. Cretikos, J. Chen, K. Hillman, R. Bellomo, S. Finfer, A. Flabouris, et al. The objective medical
emergency team activation criteria: A case-control study. Resuscitation, 73(1):62–72, 2007.
[5] J.F. Fieselmann, M.S. Hendryx, C.M. Helms, and D.S. Wakefield. Respiratory rate predicts
cardiopulmonary arrest for internal medicine inpatients. Journal of general internal medicine,
8(7):354–360, 1993. 25
[6] H. Gao, A. McDonnell, D.A. Harrison, T. Moore, S. Adam, K. Daly, L. Esmonde, D.R. Goldhill,
G.J. Parry, A. Rashidian, et al. Systematic review and evaluation of physiological track and trigger
warning systems for identifying at-risk patients on the ward. Intensive care medicine, 33(4):667–679,
2007.
[7] Goldberger, A. L. et al. Physiobank, physiotoolkit, and physionet. Circulation, 101(23):e215-30
e220, 2000 (June 13).
[8] JA Hirsch and B. Bishop. Respiratory sinus arrhythmia in humans: how breathing pattern
modulates heart rate. American Journal of Physiology-Heart and Circulatory Physiology,
241(4):H620–H629, 1981.
12
[9] N. Iyengar, CK Peng, R. Morin, AL Goldberger, and L.A. Lipsitz. Age-related alterations in the
fractal scaling of cardiac interbeat interval dynamics. American Journal of Physiology-Regulatory,
Integrative and Comparative Physiology, 271(4):R1078–R1084, 1996.
[10] A. Johansson. Neural network for photoplethysmographic respiratory rate monitoring. Medical
and Biological Engineering and Computing, 41(3):242–248, 2003. 5
[11] J. Kause, G. Smith, D. Prytherch, M. Parr, A. Flabouris, K. Hillman, et al. A Comparison of
Antecedents to Cardiac Arrests, Deaths and Emergency Intensive Care Admissions in Australia and
New Zealand, and the United Kingdom the ACADEMIA study. Resuscitation, 62(3):275–282, 2004.
[12] V.H. Larsen, P.H. Christensen, H. Oxhøj, and T. Brask. Impedance pneumography for long-term
monitoring of respiration during sleep in adult males. Clinical Physiology, 4(4):333–342, 1984. 10
[13] J. Lee and KH Chon. Respiratory rate extraction via an autoregressive model using the optimal
parameter search criterion. Annals of biomedical engineering, 38(10):3218–3225, 2010.
[14] C. Orphanidou, S. Fleming, SA Shah, and L. Tarassenko. Data fusion for estimating respiratory
rate from a single-lead ecg. Biomedical Signal Processing and Control, 2012.
[15] J. Pan and W.J. Tompkins. A real-time QRS detection algorithm. Biomedical Engineering, IEEE 15
Transactions on, (3):230–236, 1985.
[16] C.E. Rasmussen and C.K.I. Williams. Gaussian processes for machine learning, volume 1. MIT
press Cambridge, MA, 2006.
[17] H. Rue, S. Martino, and N. Chopin. Approximate Bayesian inference for latent Gaussian models
by using integrated nested Laplace approximations. Journal of the royal statistical society: Series b 20
(statistical methodology), 71(2):319–392, 2009.
[18] N. Shamim, M. Atul, C. Gari D, et al. Data fusion for improved respiration rate estimation.
EURASIP Journal on advances in signal processing, 2010, 2010.
13
CLAIMS
5
1. A method of obtaining information about the rate of a periodic physiological process from a
time series of measurements obtained from a patient, comprising:
obtaining the time series of measurements;
fitting a model defining a probability distribution over functions to the time series of
measurements, wherein the model is defined by a mean function and a periodic covariance function 10
determined using prior knowledge of the physiological process under observation; and
outputting the result of the fitting as information about the rate of the periodic physiological
process.
2. A method according to claim 1, wherein the form of the periodic covariance function is 15
determined using prior knowledge of the physiological process.
3. A method according to claim 2, wherein the periodic covariance function encodes prior
knowledge that the rate of the physiological process will drift through time by including a
hyperparameter representing a length scale of the periodic covariance function. 20
4. A method according to any of the preceding claims, wherein the output information
comprises an estimate of the rate and of an uncertainty in the estimation of the rate.
35. A method according to claim 1 or 2any of the preceding claims, wherein the output 25
information comprises a probabilistic posterior distribution over the rate.
46. The method according to any of the preceding claims, comprising:
estimating the mode and covariance of a distribution of one or more hyperparameters defining
the covariance function based on the fitting, wherein: 30
the output information comprises an estimate of the rate based the estimated mode; and
the output information comprises an uncertainty in the estimate of the rate based on the
estimated covariance.
57. A method according to claims 46, wherein the estimate of the rate is obtained from the 35
estimated mode of a hyperparameter defining the periodicity of the covariance function of the model

14
and the uncertainty in the rate is obtained from the variance of the distribution of the hyperparameter
defining the periodicity of the covariance function of the model at the mode.
68. A method according to any of the preceding claims, wherein the model is a Gaussian Process.
5
79. A method according to any of the preceding claims, wherein the physiological process is a
respiratory rate.
810. A method according to claim 79, wherein the time series of data comprises R-R peaks and R-
R intervals obtained respectively from RPA and RSA waveforms. 10
911. A method according to claim 79 or 810, wherein the time series of measurements comprises a
time series of one or more of the following: photoplethysmogram data, acquired for example from a
pulse oximeter or a video camera recording of a patient’s skin, arterial blood pressure waveform,
ECG. 15
1012. A method according to any of the preceding claims, wherein the hyperparameters comprise a
hyperparameter that defines the period of the covariance function and is equal or directly proportional
to the period of the physiological process.
20
1113. A method according to any of the preceding claims, wherein the covariance function is
defined as follows:
)(),(),( 2
qpqpqp xxxxkxxV
with k being given as follows:
2
22
02
)/2((sinexp)(
rPrk L
25
and in which the hyperparameters are 0 , , PL , and , where 0 and give the amplitude and
length-scale of the latent function, respectively, PL defines the period of the covariance function, 2
represents the variance of an additive noise component, wherein is the Kronecker delta, for which
= 1 if p = q, and = 0 otherwise, and x p and xq represent two independent variables.
30
12.14. A patient monitor comprising:
a sensor for receiving a time series of measurements that are affected by a periodic
physiological process;
15
a data processor adapted to execute the method of any one of the preceding claims to obtain
information about the rate of the periodic physiological process from the time series of measurements.
13.15. A patient monitoring system comprising:
a patient monitor according to claim 1214 configured to output a probabilistic posterior 5
distribution over the rate as the information about the rate; and
a probabilistic inference system configured to detect an abnormal state of the patient by
combining the output from the patient monitor with one or more further probabilistic information
inputs derived from measurements performed on the patient.
10
1416. A computer program comprising program code means for executing on a programmed
computer system the method of any one of claims 1 to 1113.
1517. A method of obtaining information about the rate of a physiological process substantially as
hereinbefore described with reference to and/or as illustrated in the accompanying figures. 15
1618. A patient monitor or patient monitoring system arranged and configured to operate
substantially as hereinbefore described with reference to and/or as illustrated in the accompanying
figures.
20

16
ABSTRACT
A method of obtaining information about the rate of a periodic physiological process from a time 5
series of measurements obtained from a patient, comprising: obtaining the time series of
measurements; fitting a model defining a probability distribution over functions to the time series of
measurements, wherein the model is defined by a mean function and a periodic covariance function
determined using prior knowledge of the physiological process under observation; and outputting the
result of the fitting as information about the rate of the periodic physiological process. 10