measuring safety improvement - ihi · measuring safety improvement ... through medication...
TRANSCRIPT

9/11/2012
1
Measuring
Safety Improvement
© National Healthcare Group, SIN
Learning Outcomes
o Understand the concept of system-level measures
in patient safety and quality improvement work
o Explain the importance of measurement in
improvement
o Identify three kinds of measures: process, outcome
and balance measures
o State the difference between project-level
measures and PDSA-level measures

9/11/2012
2
© National Healthcare Group, SIN
Health System Levels:
IOM Chasm Report Chain of Effect
Health System
Clinical Service Line
Clinical Unit
Care Giver
PatientInformation System Design Principle:
capture data at lowest level and aggregate up to higher levels for cascading metrics throughout system
© Institute of Healthcare Quality
Macro-view Health System using Whole System Measures
9/11/2012
3
© National Healthcare Group, SIN
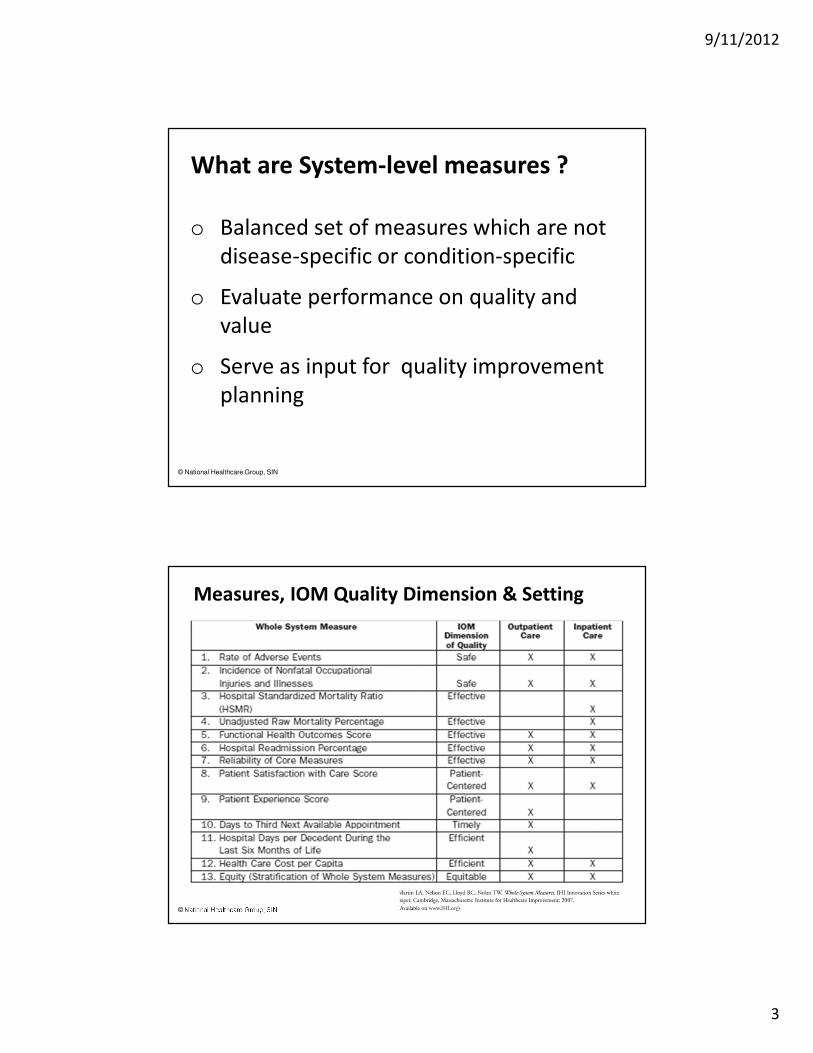
What are System-level measures ?
o Balanced set of measures which are not
disease-specific or condition-specific
o Evaluate performance on quality and
value
o Serve as input for quality improvement
planning
© National Healthcare Group, SIN
Measures, IOM Quality Dimension & Setting
9/11/2012
4
© National Healthcare Group, SIN
Why balanced set of System-level measures?
o Provides leaders and stakeholders with data
o Shows performance of the health care system over
time
o Allows the organization to see how it is performing
relative to its strategic plans for improvement
o Serves as input to strategic quality improvement
planning
© National Healthcare Group, SIN
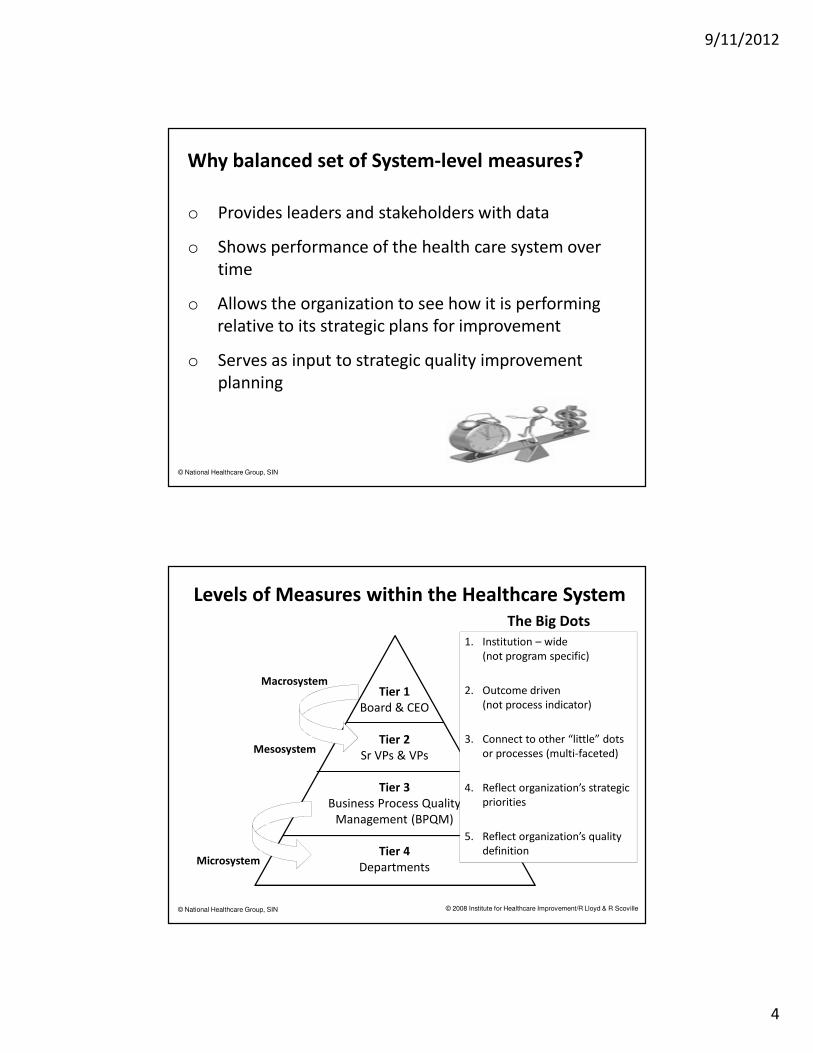
Levels of Measures within the Healthcare System
Tier 1
Board & CEO
Tier 2
Sr VPs & VPs
Tier 3
Business Process Quality
Management (BPQM)
Tier 4
Departments
Macrosystem
Mesosystem
Microsystem
© 2008 Institute for Healthcare Improvement/R Lloyd & R Scoville
The Big Dots
1. Institution – wide
(not program specific)
2. Outcome driven
(not process indicator)
3. Connect to other “little” dots
or processes (multi-faceted)
4. Reflect organization’s strategic
priorities
5. Reflect organization’s quality
definition
9/11/2012
5
© National Healthcare Group, SIN
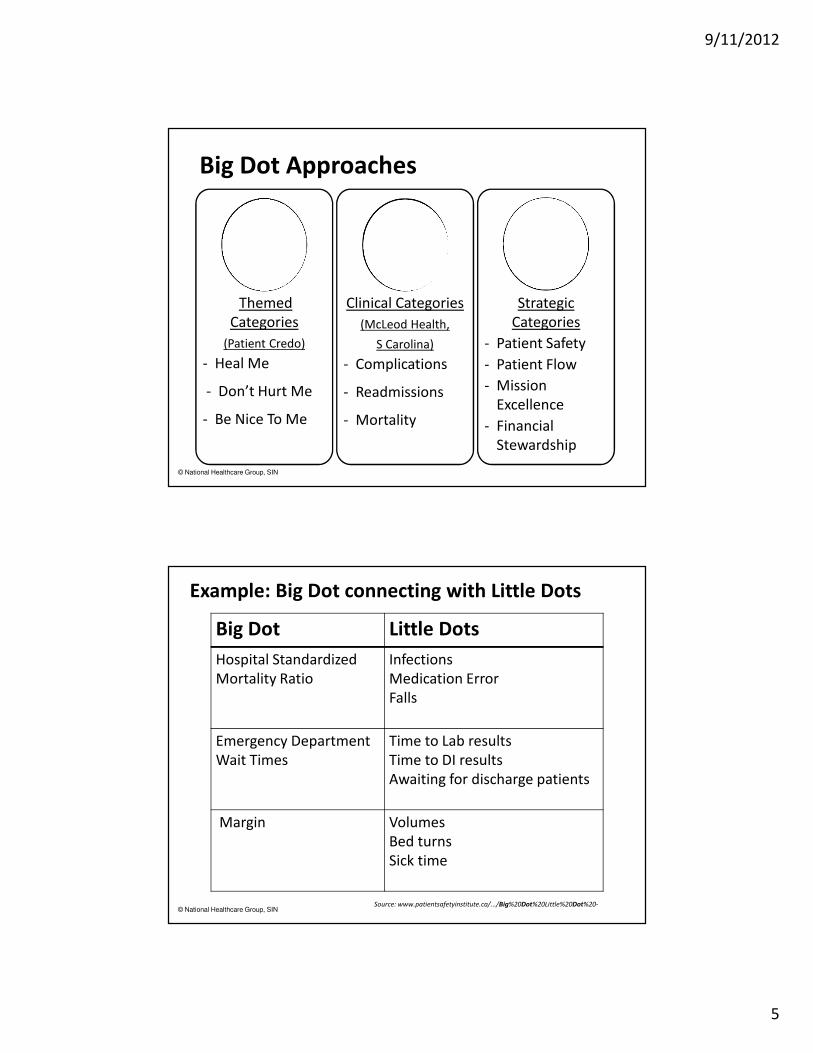
Big Dot Approaches
Themed
Categories
(Patient Credo)
- Heal Me
- Don’t Hurt Me
- Be Nice To Me
Clinical Categories
(McLeod Health,
S Carolina)
- Complications
- Readmissions
- Mortality
Strategic
Categories
- Patient Safety
- Patient Flow
- Mission
Excellence
- Financial
Stewardship
© National Healthcare Group, SIN
Example: Big Dot connecting with Little Dots
Big Dot Little Dots
Hospital Standardized
Mortality Ratio
Infections
Medication Error
Falls
Emergency Department
Wait Times
Time to Lab results
Time to DI results
Awaiting for discharge patients
Margin Volumes
Bed turns
Sick time
Source: www.patientsafetyinstitute.ca/.../Big%20Dot%20Little%20Dot%20-
9/11/2012
6
© National Healthcare Group, SIN
Tier 1
Board & CEO
Tier 2
Sr VPs & VPs
Tier 3
Business Process Quality
Management (BPQM)
Tier 4
Departments
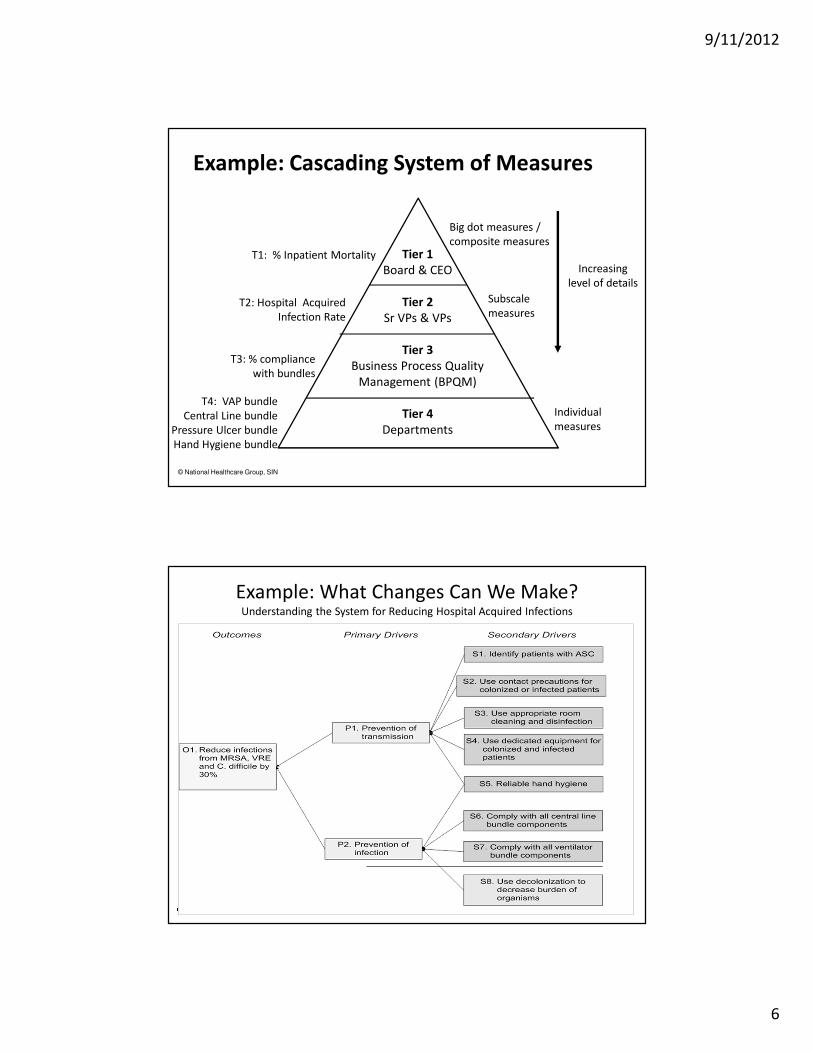
Big dot measures /
composite measures
Subscale
measures
Individual
measures
Increasing
level of details
Example: Cascading System of Measures
T1: % Inpatient Mortality
T2: Hospital Acquired
Infection Rate
T3: % compliance
with bundles
T4: VAP bundle
Central Line bundle
Pressure Ulcer bundle
Hand Hygiene bundle
© National Healthcare Group, SIN
Example: What Changes Can We Make? Understanding the System for Reducing Hospital Acquired Infections

9/11/2012
7
© National Healthcare Group, SIN
Example: How Will We Know We Are Improving? Understanding the System for Reducing Hospital Acquired Infections with Measures
© National Healthcare Group, SIN
Singapore Story
9/11/2012
8
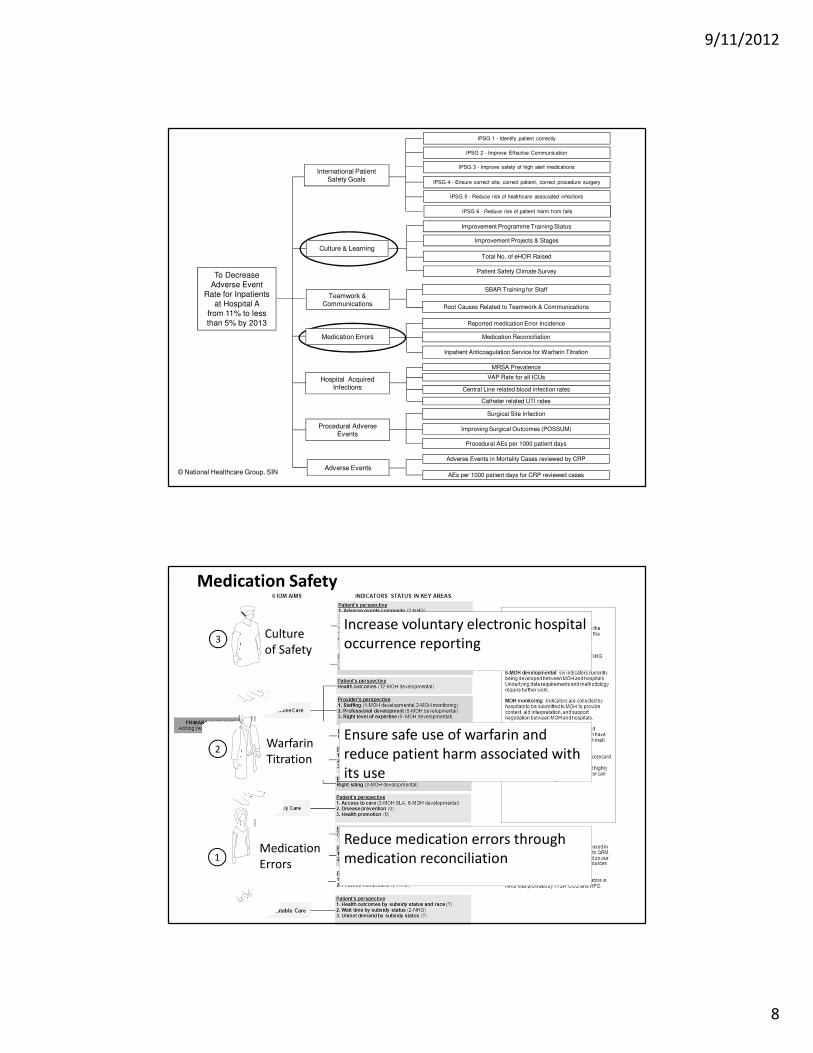
To Decrease
Adverse Event
Rate for Inpatients
at Hospital A
from 11% to less
than 5% by 2013
AEs per 1000 patient days for CRP reviewed cases
Adverse Events in Mortality Cases reviewed by CRP
Culture & Learning
Improvement Programme Training Status
Improvement Projects & Stages
Total No. of eHOR Raised
Patient Safety Climate Survey
Hospital Acquired Infections
MRSA Prevalence
VAP Rate for all ICUs
Central Line related blood infection rates
Medication Errors
Reported medication Error Incidence
Medication Reconciliation
Inpatient Anticoagulation Service for Warfarin Titration
International Patient Safety Goals
IPSG 1 - Identify patient correctly
IPSG 2 - Improve Effective Communication
IPSG 3 - Improve safety of high alert medications
IPSG 4 - Ensure correct site, correct patient, correct procedure surgery
IPSG 5 - Reduce risk of healthcare associated infections
IPSG 6 - Reduce risk of patient harm from falls
Teamwork & Communications
SBAR Training for Staff
Root Causes Related to Teamwork & Communications
Surgical Site Infection
Improving Surgical Outcomes (POSSUM)Procedural Adverse Events
Adverse Events
Catheter related UTI rates
Procedural AEs per 1000 patient days
© National Healthcare Group, SIN
© National Healthcare Group, SIN
1
2Warfarin
Titration
Medication
Errors1
3Culture
of Safety
Increase voluntary electronic hospital
occurrence reporting
Ensure safe use of warfarin and
reduce patient harm associated with
its use
Reduce medication errors through
medication reconciliation
Medication Safety
9/11/2012
9
© National Healthcare Group, SIN
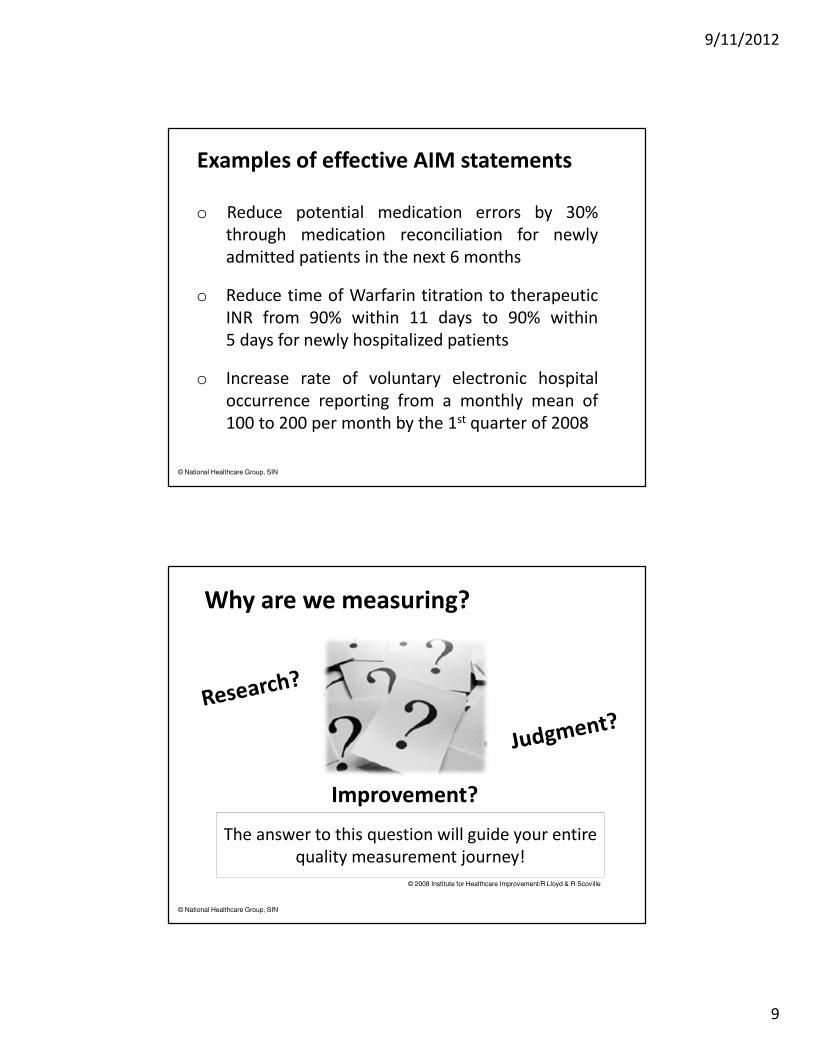
Examples of effective AIM statements
o Reduce potential medication errors by 30%
through medication reconciliation for newly
admitted patients in the next 6 months
o Reduce time of Warfarin titration to therapeutic
INR from 90% within 11 days to 90% within
5 days for newly hospitalized patients
o Increase rate of voluntary electronic hospital
occurrence reporting from a monthly mean of
100 to 200 per month by the 1st quarter of 2008
© National Healthcare Group, SIN
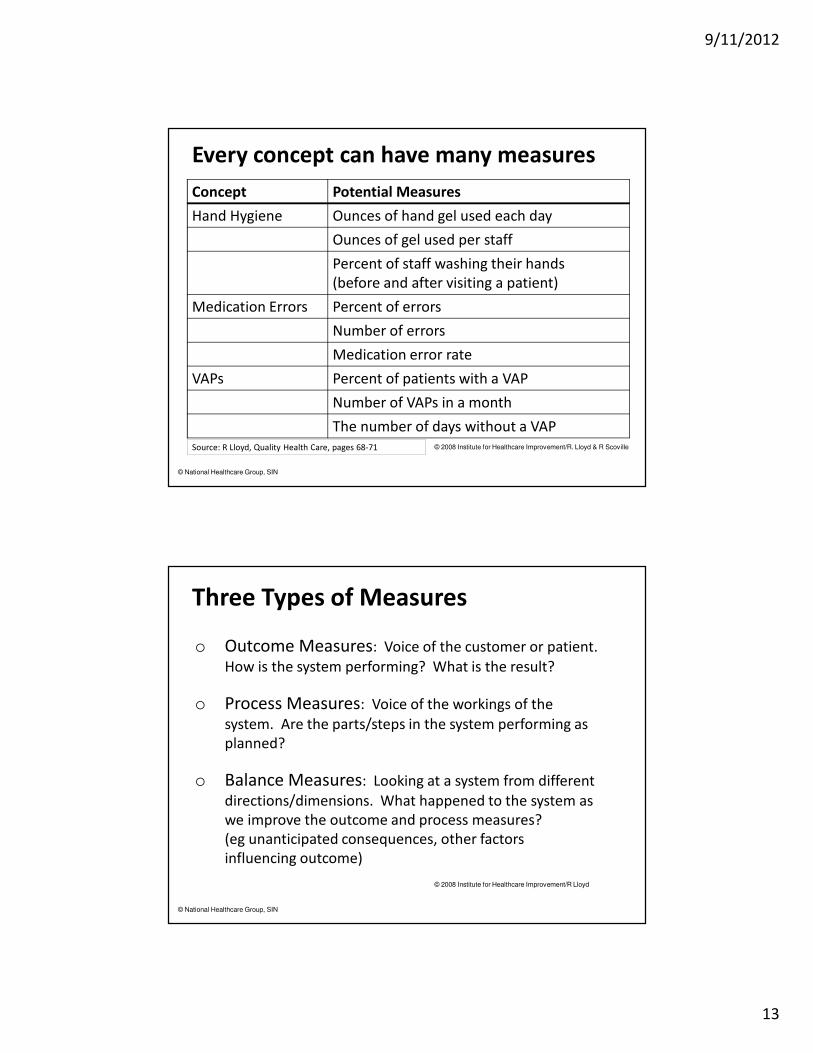
Why are we measuring?
Improvement?
The answer to this question will guide your entire
quality measurement journey!
© 2008 Institute for Healthcare Improvement/R Lloyd & R Scoville
9/11/2012
10
© National Healthcare Group, SIN
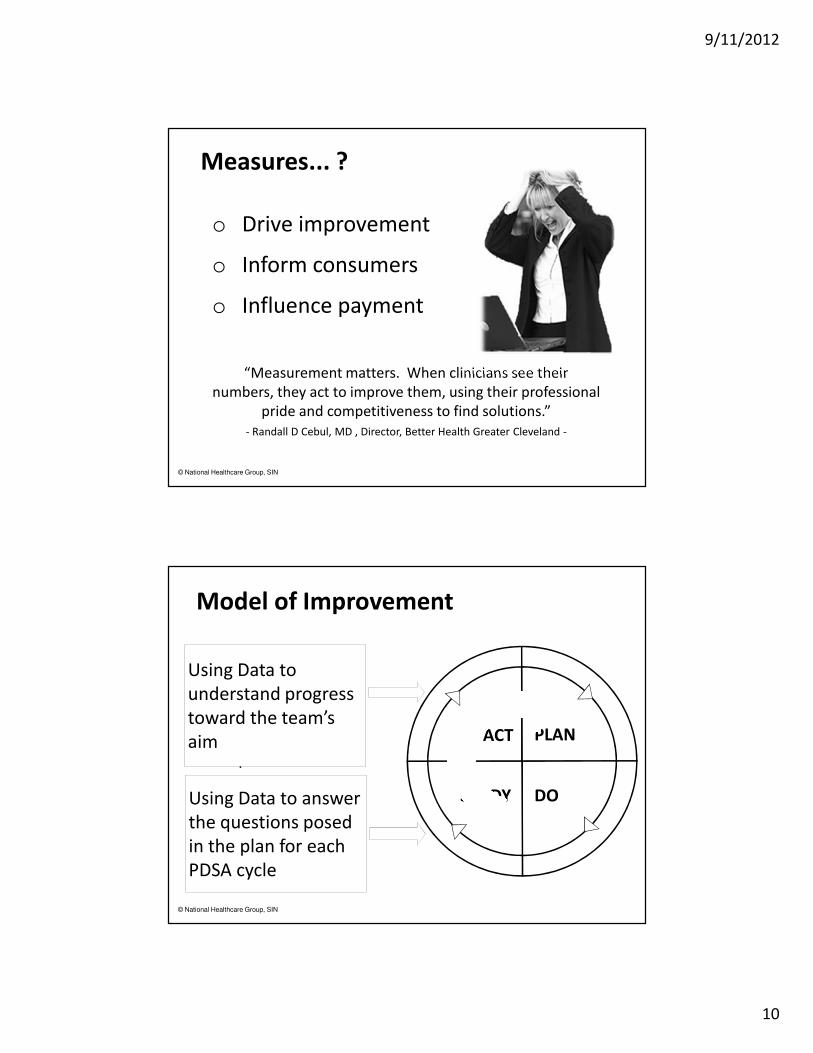
Measures... ?
o Drive improvement
o Inform consumers
o Influence payment
“Measurement matters. When clinicians see their
numbers, they act to improve them, using their professional
pride and competitiveness to find solutions.”
- Randall D Cebul, MD , Director, Better Health Greater Cleveland -
© National Healthcare Group, SIN
PLAN
DOSTUDY
ACT
o What are we trying
to accomplish?
o How will we know
that a change is an
improvement?
o What change can
we make that will
result in
improvement?
Model of Improvement
Using Data to
understand progress
toward the team’s
aim
Using Data to answer
the questions posed
in the plan for each
PDSA cycle
9/11/2012
11
© National Healthcare Group, SIN
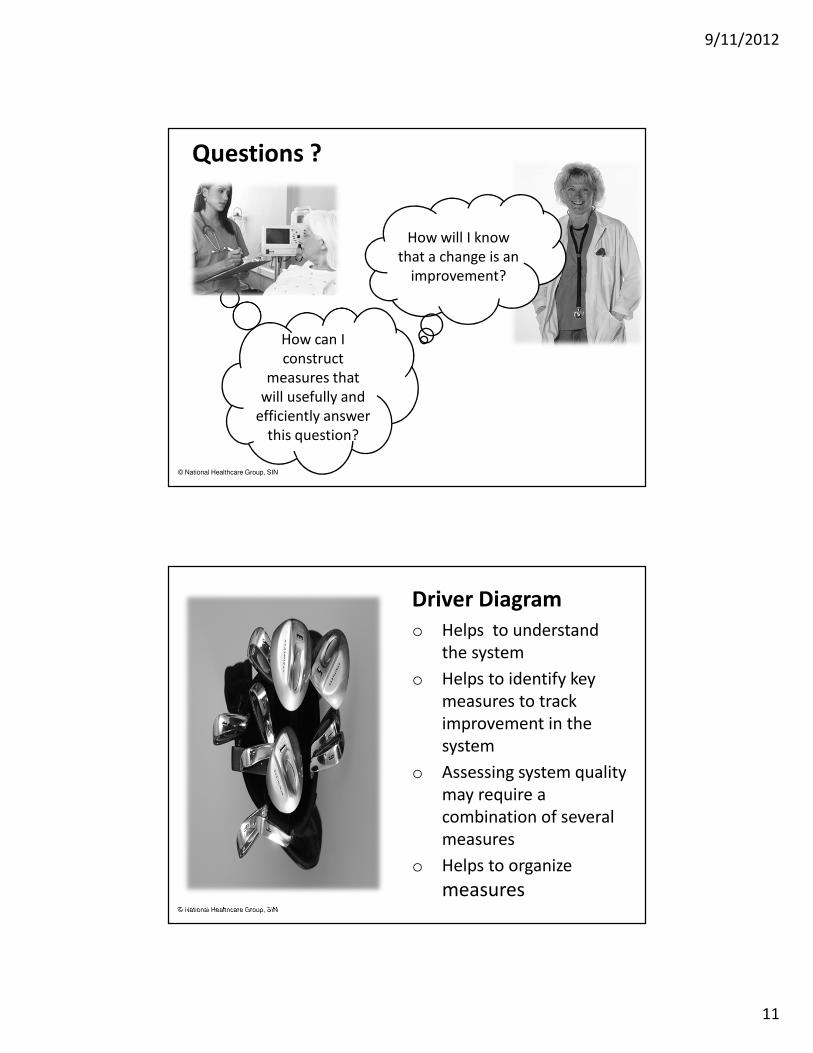
Questions ?
How will I know
that a change is an
improvement?
How can I
construct
measures that
will usefully and
efficiently answer
this question?
© National Healthcare Group, SIN
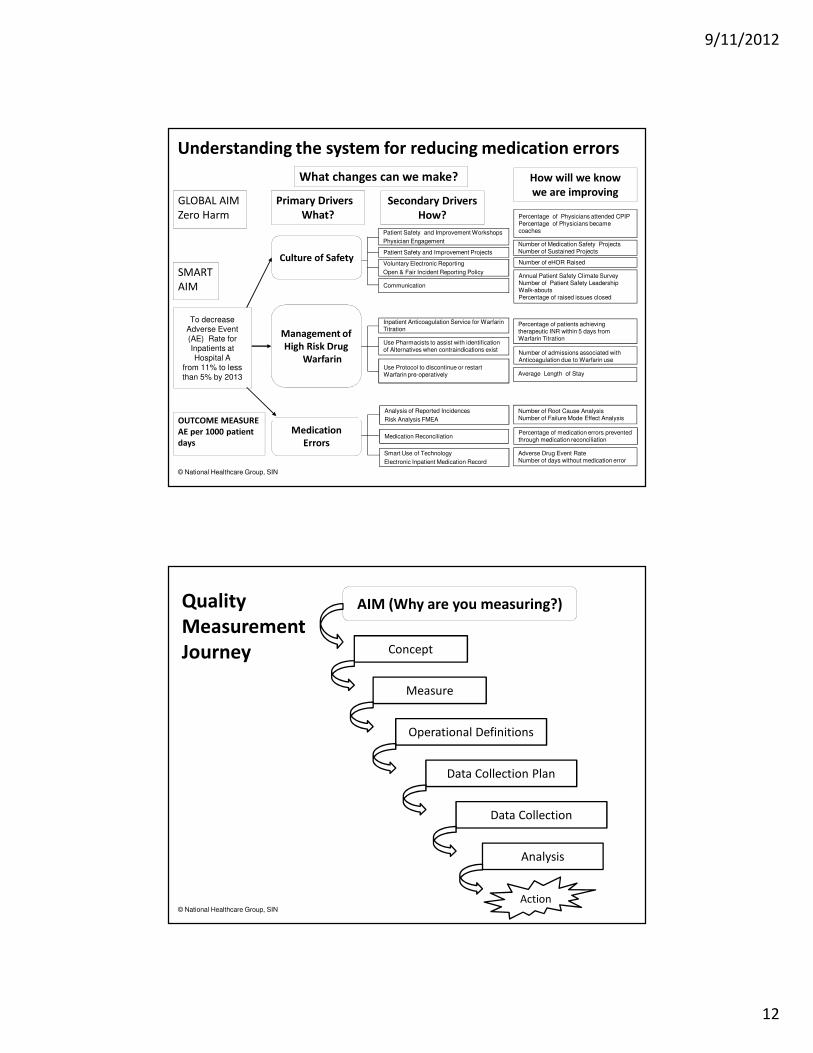
o Helps to understand
the system
o Helps to identify key
measures to track
improvement in the
system
o Assessing system quality
may require a
combination of several
measures
o Helps to organize
measures
Driver Diagram
9/11/2012
12
© National Healthcare Group, SIN
Understanding the system for reducing medication errors
To decrease
Adverse Event
(AE) Rate for
Inpatients at
Hospital A
from 11% to less than 5% by 2013
SMART
AIM
GLOBAL AIM
Zero Harm
OUTCOME MEASURE
AE per 1000 patient
days
What changes can we make?
Primary Drivers
What?
Secondary Drivers
How?
Culture of Safety
Management of
High Risk Drug
Warfarin
Medication
Errors
Analysis of Reported Incidences
Risk Analysis FMEA
Medication Reconciliation
Smart Use of Technology
Electronic Inpatient Medication Record
Patient Safety and Improvement Projects
Voluntary Electronic Reporting
Open & Fair Incident Reporting Policy
Communication
Patient Safety and Improvement Workshops
Physician Engagement
Inpatient Anticoagulation Service for Warfarin Titration
Use Pharmacists to assist with identification of Alternatives when contraindications exist
Use Protocol to discontinue or restart Warfarin pre-operatively
How will we know
we are improving
Percentage of Physicians attended CPIPPercentage of Physicians became coaches
Number of Medication Safety ProjectsNumber of Sustained Projects
Number of eHOR Raised
Annual Patient Safety Climate SurveyNumber of Patient Safety Leadership Walk-aboutsPercentage of raised issues closed
Percentage of patients achieving therapeutic INR within 5 days from Warfarin Titration
Number of admissions associated with Anticoagulation due to Warfarin use
Average Length of Stay
Number of Root Cause Analysis Number of Failure Mode Effect Analysis
Percentage of medication errors prevented through medication reconciliation
Adverse Drug Event RateNumber of days without medication error
© National Healthcare Group, SIN
Quality
Measurement
Journey
AIM (Why are you measuring?)
Concept
Measure
Operational Definitions
Data Collection Plan
Data Collection
Analysis
Action
9/11/2012
13
© National Healthcare Group, SIN
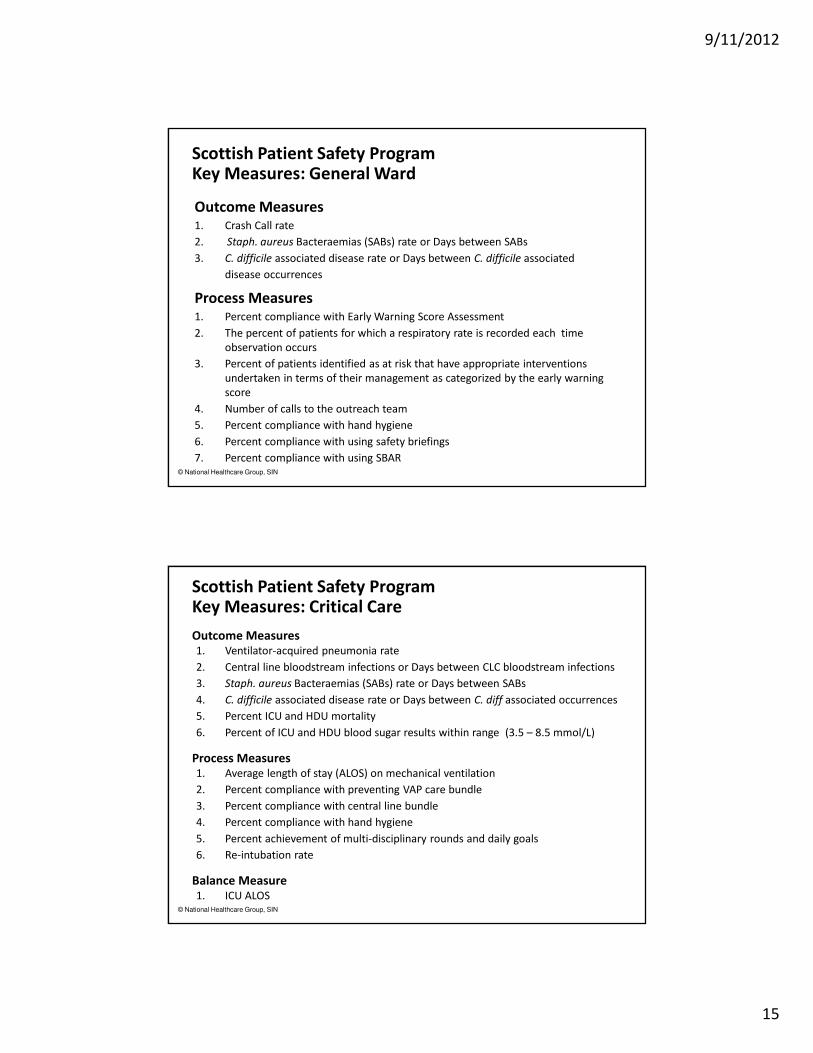
Every concept can have many measures
Concept Potential Measures
Hand Hygiene Ounces of hand gel used each day
Ounces of gel used per staff
Percent of staff washing their hands
(before and after visiting a patient)
Medication Errors Percent of errors
Number of errors
Medication error rate
VAPs Percent of patients with a VAP
Number of VAPs in a month
The number of days without a VAP
Source: R Lloyd, Quality Health Care, pages 68-71 © 2008 Institute for Healthcare Improvement/R. Lloyd & R Scoville
© National Healthcare Group, SIN
© 2008 Institute for Healthcare Improvement/R Lloyd
Three Types of Measures
o Outcome Measures: Voice of the customer or patient.
How is the system performing? What is the result?
o Process Measures: Voice of the workings of the
system. Are the parts/steps in the system performing as
planned?
o Balance Measures: Looking at a system from different
directions/dimensions. What happened to the system as
we improve the outcome and process measures?
(eg unanticipated consequences, other factors
influencing outcome)

9/11/2012
14
© National Healthcare Group, SIN
Example: Diabetes Care Measures
Outcome % of patients with HbA1c < 7
% of patients with BP <= 130/80
% of patients with LDL < 100
Process % of patients with >= 1 LDL
% of patients with >= 9 HbA1c
% of patients with foot exam
% of patients with eye exam
% of patients with micro-albumin screen
Balancing Annual cost per patient
Cycle time
Staff satisfaction
© National Healthcare Group, SIN
Potential Set of Measures for improvement
in the ED
Topic Outcome
Measures
Process Measures Balance
Measures
Improve waiting
time and patient
satisfaction in the
ED
Total Length of
Stay in the ED
Patient
Satisfaction Scores
Time to registration
Patient/staff
comments on flow
% patient receiving
discharge materials
Availability of
antibiotics
Volumes
% Leaving
without
being seen
Staff
satisfaction
Financials
© 2008 Institute for Healthcare Improvement/R Lloyd & R Scoville
9/11/2012
15
© National Healthcare Group, SIN
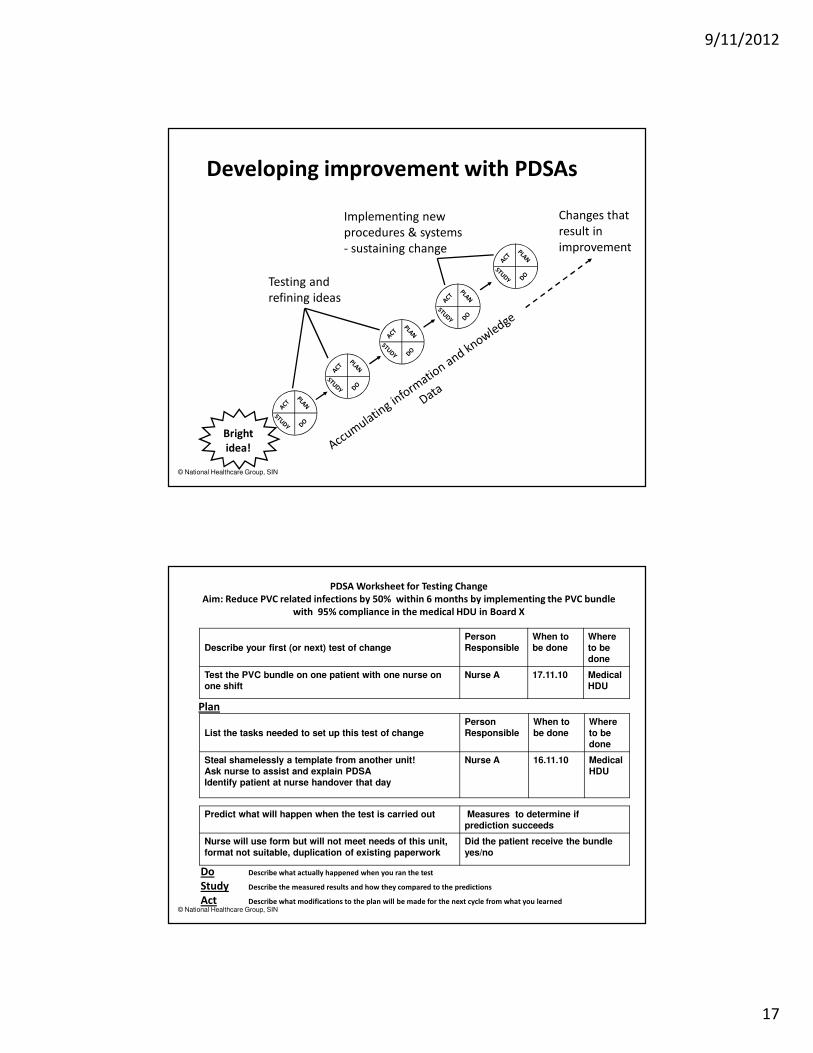
Scottish Patient Safety Program Key Measures: General Ward
Outcome Measures1. Crash Call rate
2. Staph. aureus Bacteraemias (SABs) rate or Days between SABs
3. C. difficile associated disease rate or Days between C. difficile associated
disease occurrences
Process Measures1. Percent compliance with Early Warning Score Assessment
2. The percent of patients for which a respiratory rate is recorded each time
observation occurs
3. Percent of patients identified as at risk that have appropriate interventions
undertaken in terms of their management as categorized by the early warning
score
4. Number of calls to the outreach team
5. Percent compliance with hand hygiene
6. Percent compliance with using safety briefings
7. Percent compliance with using SBAR
© National Healthcare Group, SIN
Scottish Patient Safety Program Key Measures: Critical Care
Outcome Measures 1. Ventilator-acquired pneumonia rate
2. Central line bloodstream infections or Days between CLC bloodstream infections
3. Staph. aureus Bacteraemias (SABs) rate or Days between SABs
4. C. difficile associated disease rate or Days between C. diff associated occurrences
5. Percent ICU and HDU mortality
6. Percent of ICU and HDU blood sugar results within range (3.5 – 8.5 mmol/L)
Process Measures1. Average length of stay (ALOS) on mechanical ventilation
2. Percent compliance with preventing VAP care bundle
3. Percent compliance with central line bundle
4. Percent compliance with hand hygiene
5. Percent achievement of multi-disciplinary rounds and daily goals
6. Re-intubation rate
Balance Measure1. ICU ALOS

9/11/2012
16
© National Healthcare Group, SIN
Percentage of Physicians attended CPIPPercentage of Physicians certified coaches
Number of Medication Safety ProjectsPercentage of Sustained Projects
Number of eHOR Raised
Annual Patient Safety Climate SurveyNumber of Patient Safety Leadership Walk-aboutsPercentage of raised issues closed
Percentage of patients achieving therapeutic INR within 5 days from Warfarin Titration
Percentage of admissions associated with Anticoagulation due to Warfarin use
Number of Root Cause Analysis Number of Failure Mode Effect Analysis
Percentage of medication errors prevented through medication reconciliation
MEASURES
Adverse Drug Event RateNumber of days without medication error
Total of Length of Stay
How will we know we
are improving
Outcome
Adverse Drug Event Rate
Percentage of patients
achieving therapeutic INR
within 5 days from Warfarin
Titration
Total Length of Stay (LOS)
Process
Percentage of physicians
attended CPIP
Percentage of medication errors
prevented through
medication reconciliation
Balance
Average Length of Stay
( ALOS)
Number of days without
medication error
Improving Medication Errors
© National Healthcare Group, SIN
Project Measure vs PDSA Cycle Measures
Achieving Aim
Data for Project Measures
Outcome, Process and Balance measures for the life
of the project
Adapting changes during PDSA Cycles
Data for PDSA Measures
Quantitative data
Qualitative data
Stratification of project measures for particular
patients or providers
Collect only during cycles
9/11/2012
17
© National Healthcare Group, SIN
Testing and
refining ideas
Bright
idea!
Developing improvement with PDSAs
Implementing new
procedures & systems
- sustaining change
Changes that
result in
improvement
© National Healthcare Group, SIN
PDSA Worksheet for Testing Change
Aim: Reduce PVC related infections by 50% within 6 months by implementing the PVC bundle
with 95% compliance in the medical HDU in Board X
Describe your first (or next) test of change
Person
Responsible
When to
be done
Where
to be
done
Test the PVC bundle on one patient with one nurse on
one shift
Nurse A 17.11.10 Medical
HDU
Plan
List the tasks needed to set up this test of change
Person
Responsible
When to
be done
Where
to be
done
Steal shamelessly a template from another unit!
Ask nurse to assist and explain PDSA
Identify patient at nurse handover that day
Nurse A 16.11.10 Medical
HDU
Predict what will happen when the test is carried out Measures to determine if
prediction succeeds
Nurse will use form but will not meet needs of this unit,
format not suitable, duplication of existing paperwork
Did the patient receive the bundle
yes/no
Do Describe what actually happened when you ran the test
Study Describe the measured results and how they compared to the predictions
Act Describe what modifications to the plan will be made for the next cycle from what you learned
9/11/2012
18
© National Healthcare Group, SIN
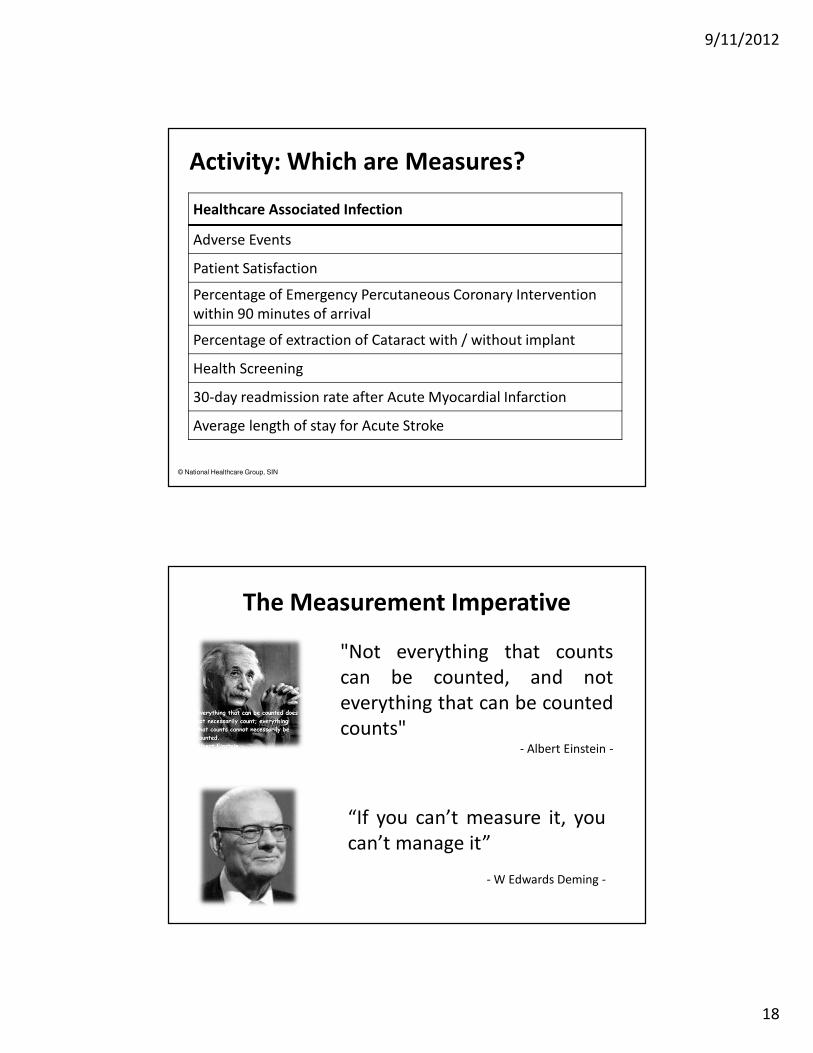
Healthcare Associated Infection
Adverse Events
Patient Satisfaction
Percentage of Emergency Percutaneous Coronary Intervention
within 90 minutes of arrival
Percentage of extraction of Cataract with / without implant
Health Screening
30-day readmission rate after Acute Myocardial Infarction
Average length of stay for Acute Stroke
Activity: Which are Measures?
The Measurement Imperative
"Not everything that counts
can be counted, and not
everything that can be counted
counts"- Albert Einstein -
“If you can’t measure it, you
can’t manage it”
- W Edwards Deming -
9/11/2012
19
Acknowledgements
Materials for program sourced from:
o The Improvement Guide : A Practical Approach to Enhancing Organizational Performance by Gerald J. Langley et al
o The Healthcare Quality Book: Vision, Strategy & Tools by Scott B. Ransom et al
o Toward Optimized Practice [Online information; retrieved on 24/08/12.]
o www.topalbertoctors.org/services.
o Enhancing Clinical Practice Improvement: A Tribute, 2008 (National Healthcare Group, Singapore)
o Adding Years of Healthy Life , 2010 (National Healthcare Group, Singapore)
o Ministry Of Health, Statement of Priorities, FY 2011 Singapore
o Model for Improvement by Carol Haraden (Institute for Healthcare Improvement)
o www.scottishpatientsafetyprogramme.scot.nhs.uk/.../...
o www.patientsafetyinstitute.ca/.../Big%20Dot%20Little%20Dot%20-
o Visuals adapted from Flickr/LumaxArt
© National Healthcare Group, SIN