measuring service quality level of tuition providers … · measuring service quality level of...
TRANSCRIPT

© 2015. Md. Zainal Abedin. This is a research/review paper, distributed under the terms of the Creative Commons Attribution-Noncommercial 3.0 Unported License http://creativecommons.org/licenses/by-nc/3.0/), permitting all non-commercial use, distribution, and reproduction in any medium, provided the original work is properly cited.
Global Journal of Management and Business Research: E Marketing Volume 15 Issue 3 Version 1.0 Year 2015 Type: Double Blind Peer Reviewed International Research Journal Publisher: Global Journals Inc. (USA) Online ISSN: 2249-4588 & Print ISSN: 0975-5853
Measuring Service Quality Level of Tuition Providers in Bangladesh: A Study on S@Ifur's
By Md. Zainal Abedin World University, Bangladesh
Abstract- The study investigates and measure the service quality level of S@ifur’s through SERVQUAL-model statements (Parasuraman et al, (1990),that means that we measure customer expectations and customer perceptions and make a comparison between different areas of service given by the organization. To do this Five-Point Likert Scale has been used to survey customers. The study actually reveals the state of service quality level and the customer perception on this service and whether the service quality level, its standard and customer perceptions are able to increase market share in the industry. The study also focused to the extent that whether these service quality level and the defined customer perception can create positive impact on customers and be able to create positive contribution on the building of brand image of the tuition provider.
Keywords : s@ifur’s, tuition provider, customer expectations, customers satisfaction, customer perceptions, SERVQUAL-model.
GJMBR - E Classification : JEL Code : M39
MeasuringServiceQualityLevelofTuitionProvidersinBangladesA StudyonSIfurs
Strictly as per the compliance and regulations of:
Measuring Service Quality Level of Tuition Providers in Bangladesh: A Study on S@Ifur's
Abstract- The study investigates and measure the service quality level of S@ifur’s through SERVQUAL-model statements (Parasuraman et al, (1990),that means that we measure customer expectations and customer perceptions and make a comparison between different areas of service given by the organization. To do this Five-Point Likert Scale has been used to survey customers. The study actually reveals the state of service quality level and the customer perception on this service and whether the service quality level, its standard and customer perceptions are able to increase market share in the industry. The study also focused to the extent that whether these service quality level and the defined customer perception can create positive impact on customers and be able to create positive contribution on the building of brand image of the tuition provider. As sample, Dhaka University students and some selective samples have been surveyed since they represent whole Bangladesh as customers. The main purpose of the study is to measure the service quality level of customers and their perceived value of the services given by the S@ifur’s. The study also has the objective to find out and analyze the service gaps.as well as on the basis of service gaps and other findings, a comprehensive recommendations will be given. The study found that different service quality and dimensions bound customers to perceive service quality differently and its service quality level is moderate though it is leading tuition provider in the country. So S@ifur’s should analyze the customer expectations first and then it should make a diagram so that the company can give the best services to the customers. Keyword: s@ifur’s, tuition provider, customer expectations, customers satisfaction, customer perceptions, SERVQUAL-model.
I. Introduction
ervice quality is need for creating customer satisfaction and service quality is connected to customer perceptions and customer expectations.
Oliver (1997) argues that service quality can be described as the result from customer comparisons between their expectations about the service they will use and their perceptions about the service company. That means that if the perceptions would be higher than the expectations the service will be considered excellent, if the expectations equal the perceptions the service is considered good and if the expectations are not met the service will be considered bad.
Oliver (1997) argues that customer satisfaction can be described as a judgment that a product or
service feature, or the product or service itself, provides pleasurable consumption. Satisfaction can also be described as a fulfillment response of service and an attitude change as a result of the consumption. Gibson (2005) put forward that satisfied customers are likely to become loyal customers and that means that they are also likely to spread positive word of mouth. Understanding which factors that influence customer satisfaction makes it easier to design and deliver service offers that corresponds to the market demands. Service quality linked explicitly to customer satisfaction that marketer too seen as having an important role to play.
Making service processes more efficient does not necessarily result in a better quality experience for customers, or does it always lead to improved benefits for them. Likewise, but at other times it may sometimes be welcomed by customers, but at other times it may make them feel rushed and unwanted)
Marketing’s interest in service quality is obvious when one thinks about it. Poor quality places a firm at a competitive disadvantage, potentially driving away-dissatisfied customers.
Customer satisfaction, a term frequently used in marketing, is a measure of how products and services supplied by a company meet or meet surpass expectation. Customer satisfaction is defined as “the number of customers, or percentage of total customers, whose reported experience with a firm, its products, or its services (ratings) exceeds specified satisfaction goals. Customer satisfaction provides a leading indicator of consumer purchase intentions and loyalty. “Management must think of itself not as producing products but as proving customer creating value satisfaction. “Customer satisfaction has a vital role in sustaining and improving hole on the market.
II. Theoretical Framework of the Study
a) Service Quality From the viewpoint of business administration,
“Service Quality is an achievement in customer service. It reflects at each service encounter. Customers form service expectations from experiences, word of mouth and advertisement. In general, Customers compare perceived service with expected service in which if the former falls short of the latter the customers are disappointed”.
The measurement of subjective aspects of customer service depends on the conformity of the
S
© 2015 Global Journals Inc. (US)
45
Globa
l Jo
urna
l of M
anag
emen
t an
d Bu
siness Resea
rch
Volum
e XV Issue
III
Ver
sion
IYe
ar
()
E20
15
Md. Zainal Abedin
Author α: Senior Lecturer World University of Bangladesh.e-mail: [email protected]

expected benefit with the perceived result. This in turns depends upon the customer's expectation in terms of service, they might receive and the service provider's ability and talent to present this expected service. Successful Companies add benefits to their offering that not only satisfy the customers but also surprise and delight them. Delighting customers is a matter of exceeding their expectations.
Pre-defined objective criteria may be unattainable in practice, in which case, the best possible achievable result becomes the ideal. The objective ideal may still be poor, in subjective terms.
Service quality can be related to service potential (for example, worker's qualifications); service process (for example, the quickness of service) and service result (customer satisfaction).
b) Importance of Service Quality The importance of service has obtained a
significant amount of attention by many managers and academic scholars in a variety of fields. Identifying the nature of the relationship between service quality and relevant constructs appears to be advantageous as it assists in the development of better managerial decisions. This realization is reflected by the increasing number of publications devoted to such topics as customer satisfaction, service quality, customer service, and service marketing . Prior to discussing the concept of service quality and its relationships with other constructs, it is necessary to be concerned with the three fundamental characteristics of a service product. In these circumstances it is very important to pay attention to study of service quality, its dimensions and measuring method in order to improve it continuously. Continuous offer of high quality service is extremely important to reach consumer satisfaction, which is reflected positively to competition and to profitable business of service companies. [Sources: Website, Zeithaml, V.A., Parasuraman, A. and Berry, L.L.(1990), Delivering quality service; Balancing customer perceptions and expectations, The Free Press, New York, NY].
c) Measuring of Service Quality Measuring the quality of a service can be a very
difficult exercise. Unlike product where there are specific specifications such as length, depth, width, weight, color etc. a service can have numerous intangible or qualitative specifications. In addition, there is there expectation of the customer with regards the service, which can vary considerably based on a range of factors such as prior experience, personal needs and what other people may have told them.
d) Method of analysis To analyze the result we use the SERVQUAL-
model statements (Parasuraman et al, (1990).That
means that we measure customer expectations and customer perceptions and make a comparison between different areas of service. Each answer alternative is given a score and the score for expectations is summarized and the score for perceptions is summarized. Then the difference between expectations and perceptions is counted and a judgment about the service quality is given. The overall service quality level is showed through counting the score of each dimension and then summarize them. Jannadi and Al Saggaf (2000) explains that the calculation shows a gap between perceptions and expectations and through that gap the service will be evaluated through the following formula.
ni
∑ Pi − Ei =1 SQi (feature) = Pi – Ei (1)
SQ (dimension) = (–) →1/ n (2)
When n = number of items in the dimension
Overall SQ = / =1 (3)
When n = total number of features
i = each feature
SQ = Service Quality
P = Perception score
E = Expectation score
Standard deviations are also used to measure dispersion of data around the mean. To be able to analyze the different answer options we gave each option different points, this method is called Likert scale. The expectations and perceptions are evaluated through 22 statements and the answer options are rated through five point Likert scale. The result is also linked with theory to identify which areas the company should improve. We used Microsoft Excel to transform the raw data from the questionnaires into diagrams and tables that are easier to facilitate.
Parasuraman later revises the SERVQUAL model, where the differences are shown as follows:
1. Firstly, the term “should” in its original version may lead to unrealistically high results related to expectations, so the new model introduces somewhat different terms. Revised terms focus on what users’ expectations should be from the company that delivers excellent service. For example, item “City Public Transportation should have accurate timetable“, has been modified into an item “Distinctive public transportation in the city will insist on accurate timetable“.
2.
Secondly, all negative items’ formulation in an original version of the SERVQUAL is changed by positive formulation. For example, “The employees
of XYZ are not always willing to help users“, has
Measuring Service Quality Level of Tuition Providers in Bangladesh: A Study on S@Ifur's
© 2015 Global Journals Inc. (US)1
46
Globa
l Jo
urna
l of M
anag
emen
t an
d Bu
siness Resea
rch
Volum
e XV Issue
III
Ver
sion
IYe
ar
()
E20
15

been changed into “Employees are not always willing to help you“.
3. Thirdly, two original items, one within the perceptibility, and another one within the safety, have been changed by two new ones that explain dimensions in a better way: perceptibility and safety.
4. In the fourth place, evaluation of significance of each of five dimensions in original model is gained indirectly by regressive analysis. Revised model introduces the third set of questions for users that directly measures relative significance of each of five dimensions for users. These results are then used to evaluate the indicator of each dimension o
5. arasuraman’s concept of five dimensions is mostly used. f perceptive service quality. The main purpose is to obtain the most accurate result of perceptive service quality.
e) Various Dimensions of Service Quality A Customer's expectation of a particular service
is determined by factors such as recommendations, personal needs and experiences. The expected service and the perceived service sometimes may not be equal, thus leaving a gap. The service quality model or the ‘GAP model’ developed by a group of authors- Parasuraman, Zeithaml and Berry at Texas and North Carolina in 1985, highlights the main requirements for delivering high service quality. It identifies five ‘gaps’ that cause unsuccessful delivery. Customers generally have a tendency to compare the service they 'experience' with the service they ‘expect’. If the experience does not match the expectation, there arises a gap. Parasuraman, Zeithaml and Berry described ten determinants that may influence the appearance of a gap. in the SERVQUAL model: reliability, responsiveness, competence, access, courtesy, communication, credibility, security, understanding the customer and tangibles.
Later, the determinants were reduced to five: tangibles; reliability; responsiveness; service assurance and empathy in the so-called RATER model.
Found that the following ten dimensions affect expectations and perception of service quality: 1. Reliability 2. Sensibility 3. Competitiveness 4. Accessibility 5. Politeness 6. Communicability 7. Credibility 8. Safety 9. Understanding and consumer commitment and 10. Tangibility [Sources: MA. Parasuraman, A., Zeithaml, V.A. and Berry, L. L.(1988),"SERVQUAL: a multi-item scale for measuring consumer perceptions of the service quality", Journal of Retailing,Vol.64,No.1,pp.12-40.]
Later development of a model for measuring service quality brought Parasuraman, Zeithaml and Berry to a conclusion that awareness solution is more acceptable for above-mentioned ten dimensions converted into the following five ones:
1. Tangibility (physical objects, equipment, appearance of service staff)
2. Reliability (potential to deliver a promised service) 3. Sensitivity (willingness to help consumers and to
provide fast service) 4. Safety (knowledge and politeness of the staff and
their capability of getting trust) 5. Empathy (care, individual attention for consumers)
Safety and empathy represent in fact seven original quality dimensions: competitiveness, accessibility, politeness, communicability, credibility, safety and understanding and commitment for consumers. Reducing number of dimensions has not reduced accuracy in quality measurement.
It is obvious that there are different opinions on dimensions of service quality. It would be hard to extinguish some of above approaches as the most acceptable in explanation and understanding the essence of perceived service quality; however, when speaking on quality measurement the P
f) Maintaining Service Quality After having attained the desired service level,
the next great challenge faced by service providers is to maintain service standards at levels of excellence. This is as important, and as tough, as establishing service standards and attaining to them in the first place.
There are two approaches that any organization can have towards maintaining service standards - a proactive approach or a reactive approach.
g) Proactive A proactive approach entails actively reaching
out to customers and trying to gather their feedback on service quality and suggested areas of improvement. This can be done by way of Surveys and administering questionnaires Gap Analysis, and Staff training
i. Surveys and questionnaires Such an approach helps a brand to anticipate
customer demands and expectations and align its service offering accordingly. In addition, the findings of such surveys can help to identify common issues and demands of customers hence helping a company to customize its service offering.
ii. Gap Analysis Another approach that is adopted for analyzing
service quality is that of the gap analysis. The company has an ideal service standard that it would like to offer to its customers. This is contrasted with the current level of service being offered. The gap thus identified serves both as a measure and as a basis for planning a future course of action to improve the service offering.
Measuring Service Quality Level of Tuition Providers in Bangladesh: A Study on S@Ifur's
© 2015 Global Journals Inc. (US)
47
Globa
l Jo
urna
l of M
anag
emen
t an
d Bu
siness Resea
rch
Volum
e XV Issue
III
Ver
sion
IYe
ar
()
E20
15

iii. Staff Training Another crucial aspect of the proactive
approach is staff training. Companies nowadays spend generously on training their personnel to adequately handle customer queries and/or complaints. This is particularly true if a company is changing its service offering or going in for a price hike of its existing services. For example, when a fast food chain increases the price of its existing products, the staff has to handle multiple customer queries regarding the hike. Lack of a satisfactory explanation would signify poor service standards and lead to customer dissatisfaction. iv. Reactive
A reactive approach consists of resorting to a predetermined service recovery mechanism once a
customer complains about poor service quality. It usually starts with apologizing to the customer and then taking steps to redeem the situation. The fundamental flaw with this approach is that, here the customer has already had a bad experience of the brand’s service.
[Sources: Internet, Management Study Guide. Maintaining & Measuring Service Quality]
h) Gaps Model of Service Quality i. Servqual Model
SERVQUAL or RATER is a service quality framework. Zeithaml, parasuraman and Berry, developed SERVQUAL in the mid 1980s. SERVQUAL means to measure the scale of Quality in the service sectors.
Customer
COMPANY GAP Gap-1
i) Concept The service quality model or the ’GAP model’
developed by a group of authors parasuraman, Zeithaml and Berry at Texas and north Carolina in 1985, highlights the main requirements for delivering high
service quality. It identifies five ‘gaps’ that cause unsuccessful delivery. SERVQUAL was originally measured on 10 aspects of service quality: It measures the gap between customer expectations and experience. The basic assumption of the measurement
Expected service
Perceived service
Service delivery External
Communication
Customer driven service designs and standards
Company perceptions of customer expectations
Gap-3
Gap-2
Gap-4
Measuring Service Quality Level of Tuition Providers in Bangladesh: A Study on S@Ifur's
© 2015 Global Journals Inc. (US)1
48
Globa
l Jo
urna
l of M
anag
emen
t an
d Bu
siness Resea
rch
Volum
e XV Issue
III
Ver
sion
IYe
ar
()
E20
15

was that customers could evaluate a firm’s service quality by comparing their perceptions with their expectations. SERVQUAL has its detractors and is considered overly complex, subjective and statistically unreliable.
Customers generally have a tendency have to compare the service they ‘experience’ with the service they ‘expect’. If the experience does not match the expectation, there arises a gap.
a. GAP 1 Gap between consumer expectation and
management perception: This gap arises when the management does not correctly perceive what the customers want. For instance- hospital administrators may think patients want food, but patients may be more concerned with the responsiveness of the nurse. Key factors leading to this gap are: Insufficient marketing research Poorly interpreted information about the audience’s
expectations Research not focused on demand quality Too many layers between the front personnel and
the top level management b. GAP 2
Gap between management perception and service quality specification: Here the management might correctly perceive what the wants, but may not set a performance standard. An example here would be that hospital administrators may tell the nurse to respond to a request ‘fast’ but may not specify ‘how fast’. Gap2 may occur due the following reasons: Insufficient planning procedures Lack of management commitment Unclear of ambiguous service design Unsystematic new service development process
c. GAP 3 Gap between service quality specification and
service delivery: This gap may arise owing to the service personnel. The reasons being poor training, incapability or unwillingness to meet the set service standard. The possible major reasons for this gap are: Deficiencies in human resource policies such as
ineffective recruitment, role ambiguity, role conflict, improper evaluation and compensation system.
Failure to manage customer expectations Failure to perform according to specification
d. GAP 4 Gap between service delivery and external
communication: Consumer expectation is highly influenced by statement made by company representatives and advertisements. The gap arises when these assumed expectations are not fulfilled at the time of delivery of the service. For example- The hospital
printed on the brochure may have clean and furnished rooms, but in reality it may be poorly maintained- in this case patient’s expectations are not met. The discrepancy between actual service and the promised one may occur due to the following reasons: Over-promising in external communication
campaign Failure to manage customer expectations Failure to perform according to specifications
e. GAP 5 Gap between expected service and
experienced service: This gap arises when the customer misinterprets the service quality. The physician may keep visiting the patient to show and ensure care, but the patient may interpret this as an indication that something is wrong. [Sources: Website, Integrated gaps model of service quality, Parasuraman, A., Zeithal, V. A. and Berry, L.L. (1985)]
III. Research Design (Methodology)
a) Research Approach This is a quantitative research, in some cases
qualitative approach has been applied. At first phase an exploratory research has been
conducted to understand the nature of problem and its subcomponents.
After analyzing all relevant data by excel and SPSS, a descriptic method has been applied to present the findings.
b) Sources of Data To meet the research objectives both primary
and secondary sources of data have been used. More emphasis is given on primary data to conduct the research program authentically.
a. Primary Source 1. A model questionnaire has been developed to elicit
essential data. The Questionnaire is structured in nature and is based on Likert Scale method.
Population All Customers of S@ifur’s (Students) and some
selective samples. (Approximate 35oo students) Sampling technique
Random sampling technique was used to select specific students who are students existing and ex-students. Sample Size
Total of 60 Students from three branch, each of 20 students are selected. Survey area: Dhaka, (Panthapath, Lalmatia and Mirpur branch). 2. Informal interviews with education service provider
experts and managers of S@ifur’s
Measuring Service Quality Level of Tuition Providers in Bangladesh: A Study on S@Ifur's
© 2015 Global Journals Inc. (US)
49
Globa
l Jo
urna
l of M
anag
emen
t an
d Bu
siness Resea
rch
Volum
e XV Issue
III
Ver
sion
IYe
ar
()
E20
15

3. Observation of students while taking services. b. Secondary Sources
Books and articles on service quality levels Various websites
c. Data Analysis Techniques Excel and SPSS software has been used to analyze
data Various statistical methods and formulae has been
used. (Mean, standard deviation, Correlations, Regressions and Frequency distributions.)
Different Graphs, Tables, Charts and others instruments are used to make presentable the research results (Findings).
IV. Analysis and Findings of Service Quality and Customer Satisfaction
Level
Descriptive analysis and frequency distribution to analysis the despondence answer.
a) Descriptive Analysis It refers the transformation of raw data into a
form and that will make them easy to understand and interpreted; rearranging, ordering manipulating data to provide descriptive information.
Table 4.1 : Gender Sample
Gender Frequency Percent Valid percent Cumulative Percent
Valid
Male 45 75 75 75
Female 15 25 25 100 Total 60 100 100
Sample size is 60. Among them, there are 75% male and 25% female. The ratio can be seen graphically in the pie chart.
Pie-Chart show participant’s Gender
4.1.2 : Age Group
Age
15 -
25
40
65
65
75%25%
0 0
Gender
Male
Female
Measuring Service Quality Level of Tuition Providers in Bangladesh: A Study on S@Ifur's
© 2015 Global Journals Inc. (US)1
50
Globa
l Jo
urna
l of M
anag
emen
t an
d Bu
siness Resea
rch
Volum
e XV Issue
III
Ver
sion
IYe
ar
()
E20
15
Valid 26 - 35 15 25 25
More Than 35 5 10 100
Total 60 100

Table: Age Group
Respondent’s age group divided into four classes. Among them 15-25 years old are 40 peoples, 26-35 years old are 15 peoples and more than 35 years
old are 05 peoples. So most of the respondents are between 15 – 25 years old. The ratio of the different age’s group people are follows in bar chart.
Bar Chart: Respondents According to Age
Table 4.1.3 : Professional Group
Profession
Frequency
Percent
Valid percent
Cumulative Percent
Valid
Student
40
70
70
75
Service Holder
15
22
22
Business Person
5
8
8
100
Total
60
100
100
Table: 4.1.3 :
Professional Sample
0
5
10
15
20
25
30
35
40
45
50
15-25 yrs 26-35 yrs More than 35
70
228
Sales
Student
Service Holder
Business Person
Measuring Service Quality Level of Tuition Providers in Bangladesh: A Study on S@Ifur's
© 2015 Global Journals Inc. (US)
51
Globa
l Jo
urna
l of M
anag
emen
t an
d Bu
siness Resea
rch
Volum
e XV Issue
III
Ver
sion
IYe
ar
()
E20
15
Pie-Chart show participant’s Profession

Respondent’s Profession group divided into three classes. Student 70%, Service Holder 22%, and
Business Person 8%.The ratio of the different professions in the chart is covering students.
b)
Perception Statement in the Reliability Dimension
i.
When S@ifur’s promise to do something by a certain time, it done so for its customers
Valid
Position
Frequency
Percent
Valid
Strongly disagree
6
10%
6
Disagree
8
13.33%
8
Neutral
21
35%
21
Agree
16
26.67%
16
Strongly Agree
9
15%
9
Total
60
100%
60
Sample size was 60,
with this statement most of the respondents were neutral. The numbers were 21, Here strongly agree were 9 and agree were 16 rest were, disagree and strongly disagree are the ratio
between there is shown below in the bar chart. From the below diagram we can say that maximum number of the customer are dissatisfied because they do not keep their promise.
Chart: S@ifur’s promise to do something by a certain time
ii.
When you got a problem with S@ifur’s, solving the problem by the organization is very fast.
Valid
Position
Frequency
Percent
Valid Strongly disagree
5
8.33%
5
Disagree
10
16.67%
10 Neutral
15
25%
15
Agree
20
33.33%
20 Strongly Agree
10
16.67%
10
Total
60
100%
60
Sample size was 60, with this statement most of the respondents were Agree. The numbers were 20, Here strongly agree were 10 and disagree were 10 rest were, disagree and strongly disagree were 5, the ratio between there is shown below in the bar chart. From the below diagram we can say that maximum number of the customer are satisfied because they solve problem very fast.
0%
10%
20%
30%
40%
Strongly Disagree
Disagree Neutral Agree Strongly Agree
10%13%
35%
27%
15%
Measuring Service Quality Level of Tuition Providers in Bangladesh: A Study on S@Ifur's
© 2015 Global Journals Inc. (US)1
52
Globa
l Jo
urna
l of M
anag
emen
t an
d Bu
siness Resea
rch
Volum
e XV Issue
III
Ver
sion
IYe
ar
()
E20
15

Chart: S@ifur’s solving the problem by the is very fast.
iii. People like S@ifur’s
Valid
Position Frequency Percent Valid
Strongly disagree 5 8.33% 5
Disagree 8 13.33% 8
Neutral 7 11.66% 7
Agree 28 46.67% 28
Strongly Agree 12 20% 12
Total 60 100% 60
Sample size was 60, with this statement most of the respondents were Agree. The numbers were 28, Here strongly agree were 12 and disagree were 8 rest were, disagree and strongly disagree were 5, the ratio
between there is shown below in the bar chart. From the below diagram we can say that maximum number of the customer are like S@ifur’s brand.
Chart: People like S@ifur’s
iv.
S@ifur’s communicate with their customer after completed their course
Valid
Position Frequency Percent Valid Strongly disagree 8 13.33% 8
Disagree 10 16.67% 10 Neutral 12 20% 12 Agree 18 30% 18
Strongly Agree 12 20% 12 Total 60 100% 60
Sample size was 60, with this statement most of the respondents were Agree. The numbers were 18, Here strongly agree were 12 and disagree were 10 rest were, disagree and strongly disagree were 8, the ratio
between there is shown below in the bar chart. From the below diagram we can say that maximum number of the customers are agree with their communication strategy.
8%
17%
25%
33%
17%
0%5%
10%15%20%25%30%35%
Strongly disagree
Disagree Neutral Agree Strongly agree
8%13% 12%
47%
20%
0%5%
10%15%20%25%30%35%40%45%50%
Stongly disagree
Disagree Neutral Agree Strongly Agree
Measuring Service Quality Level of Tuition Providers in Bangladesh: A Study on S@Ifur's
© 2015 Global Journals Inc. (US)
53
Globa
l Jo
urna
l of M
anag
emen
t an
d Bu
siness Resea
rch
Volum
e XV Issue
III
Ver
sion
IYe
ar
()
E20
15
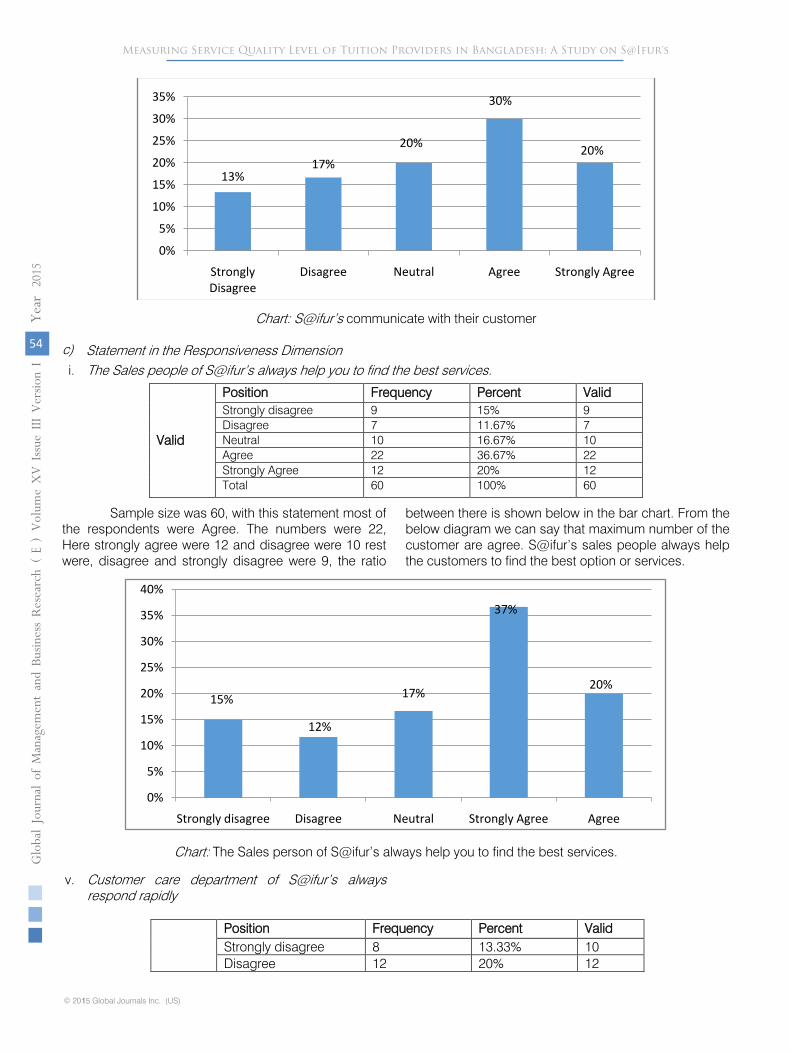
Chart: S@ifur’s
communicate with their customer
c)
Statement in the Responsiveness Dimension
i.
The Sales people of S@ifur’s always help you to find the best services.
Valid
Position Frequency Percent Valid Strongly disagree
9
15%
9
Disagree
7
11.67%
7 Neutral
10
16.67%
10
Agree
22
36.67%
22 Strongly Agree
12
20%
12
Total
60
100%
60
Sample size was 60, with this statement most of the respondents were Agree. The numbers were 22, Here strongly agree were 12 and disagree were 10 rest were, disagree and strongly disagree were 9, the ratio
between there is shown below in the bar chart. From the below diagram we can say that maximum number of the customer are agree. S@ifur’s sales people always help the customers to find the best option or services.
Chart: The Sales person of S@ifur’s always help you to find the best services.
v. Customer care department of S@ifur’s always respond rapidly
Position Frequency Percent Valid Strongly disagree 8 13.33% 10 Disagree 12 20% 12
13%17%
20%
30%
20%
0%
5%
10%
15%
20%
25%
30%
35%
Strongly Disagree
Disagree Neutral Agree Strongly Agree
15%
12%
17%
37%
20%
0%
5%
10%
15%
20%
25%
30%
35%
40%
Strongly disagree Disagree Neutral Strongly Agree Agree
Measuring Service Quality Level of Tuition Providers in Bangladesh: A Study on S@Ifur's
© 2015 Global Journals Inc. (US)1
54
Globa
l Jo
urna
l of M
anag
emen
t an
d Bu
siness Resea
rch
Volum
e XV Issue
III
Ver
sion
IYe
ar
()
E20
15

Valid Neutral 17 28.33% 15
Agree 13 21.67% 21
Strongly Agree 10 16.67% 12
Total 60 100% 60
Sample size was 60, with this statement most of the respondents were Neutral. The numbers were 17, Here strongly agree were 10 disagree were 12 rest were, disagree and strongly disagree were 8, the ratio
between there is shown below in the bar chart. From the below diagram we can say that maximum number of the customer are agree.
Chart: Customer care department of S@ifur’s always respond rapidly
d) Statement in the Assurance Dimension
i.
S@ifur’s employee’s behaviors for inspiring confidence on their services are very good.
Valid
Position
Frequency
Percent
Valid
Strongly disagree
5
8.33%
5
Disagree
10
16.67%
10
Neutral
15
25%
15
Agree
20
33.33%
20
Strongly Agree
10
16.67%
10
Total
60
100%
60
Sample size was 60, with this statement most of the respondents were Agree. The numbers were 22, Here, strongly agree were 12 disagree were 7 rest were, disagree and strongly disagree were 9, the ratio between there is shown below in the bar chart. From the
below diagram we can say that maximum number of the customer are agree about S@ifur’s employee’s behaviors for inspiring confidence on their services are very good..
Chart: Customer care department of S@ifur’s always respond rapidly
13.33%
20%
28.33%
21.67%
16.67%
0.00%
5.00%
10.00%
15.00%
20.00%
25.00%
30.00%
Strongly Disagree
Disagree Neutral Agree Strongly Agree
8%17%
25%33%
17%
0%
10%
20%
30%
40%
Strongly disagree
Disagree Neutral Agree Strongly agree
Measuring Service Quality Level of Tuition Providers in Bangladesh: A Study on S@Ifur's
© 2015 Global Journals Inc. (US)
55
Globa
l Jo
urna
l of M
anag
emen
t an
d Bu
siness Resea
rch
Volum
e XV Issue
III
Ver
sion
IYe
ar
()
E20
15

e) Statement in the Empathy Dimension
i. S@ifur’s understands your needs Valid
Position Frequency Percent Valid Strongly disagree 8 13.33% 8
Disagree 10 16.67% 10 Neutral 12 20% 12 Agree 18 30% 18
Strongly Agree 12 20% 12 Total 60 100% 60
Sample size was 60, with this statement most of the respondents were Agree. The numbers were 18, Here strongly agree were 10 disagree were 12 rest were, disagree and strongly disagree were 8, the ratio
between there is shown below in the bar chart. From the below diagram we can say that maximum number of the customer are neutral.
Chart: Customer care department of S@ifur’s always respond rapidly
ii. S@ifur’s services quality is good
Valid
Position Frequency Percent Valid Strongly disagree 5 8.33% 5
Disagree 10 16.67% 10 Neutral 15 25% 15 Agree 20 33.33% 20
Strongly Agree 10 16.67% 10 Total 60 100% 60
Sample size was 60, with this statement most of the respondents were Agree. The numbers were 20, Here strongly agree were 10 disagree were 10 rest were, disagree and strongly disagree were 5, the ratio
between there is shown below in the bar chart. From the below diagram we can say that maximum number of the customers are satisfied and positive of S@ifur’s quality.
Chart: Customer care department of S@ifur’s always respond rapidly
13%17%
20%
30%
20%
0%
5%
10%
15%
20%
25%
30%
35%
Strongly Disagree
Disagree Neutral Agree Strongly Agree
8%17%
25%33%
17%
0%10%20%30%40%
Strongly disagree
Disagree Neutral Agree Strongly agree
Measuring Service Quality Level of Tuition Providers in Bangladesh: A Study on S@Ifur's
© 2015 Global Journals Inc. (US)1
56
Globa
l Jo
urna
l of M
anag
emen
t an
d Bu
siness Resea
rch
Volum
e XV Issue
III
Ver
sion
IYe
ar
()
E20
15
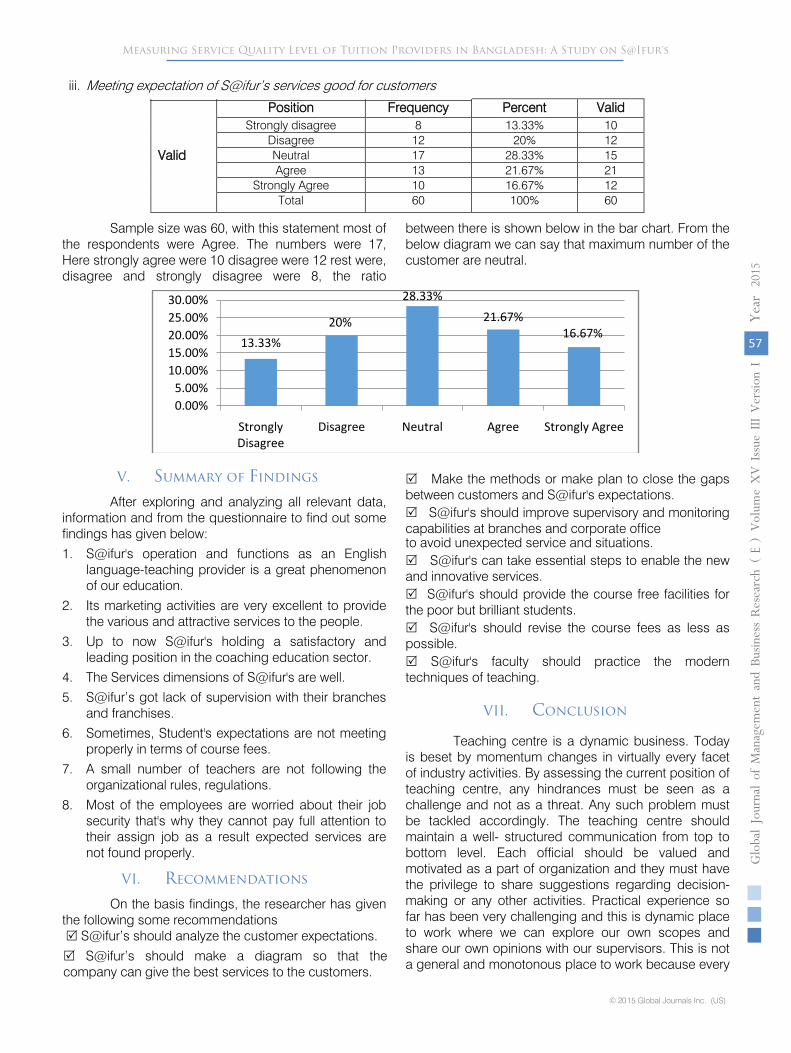
iii. Meeting expectation of S@ifur’s services good for customers
Valid
Position
Frequency
Percent
Valid
Strongly disagree
8
13.33%
10 Disagree
12
20%
12
Neutral
17
28.33%
15 Agree
13
21.67%
21 Strongly Agree
10
16.67%
12 Total
60
100%
60
Sample size was 60, with this statement most of the respondents were Agree. The numbers were 17, Here strongly agree were 10 disagree were 12 rest were, disagree and strongly disagree were 8, the ratio
between there is shown below in the bar chart. From the below diagram we can say that maximum number of the customer are neutral.
V. Summary of Findings After exploring and analyzing all relevant data,
information and from the questionnaire to find out some findings has given below: 1. S@ifur's operation and functions as an English
language-teaching provider is a great phenomenon of our education.
2. Its marketing activities are very excellent to provide the various and attractive services to the people.
3. Up to now S@ifur's holding a satisfactory and leading position in the coaching education sector.
4. The Services dimensions of S@ifur's are well. 5. S@ifur’s got lack of supervision with their branches
and franchises. 6. Sometimes, Student's expectations are not meeting
properly in terms of course fees. 7. A small number of teachers are not following the
organizational rules, regulations. 8. Most of the employees are worried about their job
security that's why they cannot pay full attention to their assign job as a result expected services are not found properly.
VI. Recommendations On the basis findings, the researcher has given
the following some recommendations S@ifur’s should analyze the customer expectations.
S@ifur’s
should make a diagram so that the company can give the best services to
the customers.
Make the methods or make plan to close the gaps between customers and S@ifur's expectations.
S@ifur's should improve supervisory and monitoring capabilities at branches and corporate office
to avoid unexpected service and situations.
S@ifur's can take essential steps to enable the new and innovative services.
S@ifur's should provide the course free facilities for the poor but brilliant students.
S@ifur's should revise the course fees as less as possible.
S@ifur's faculty should practice the modern
techniques of teaching.
VII.
Conclusion
Teaching centre is a dynamic business. Today is beset by momentum changes in virtually every facet of industry activities. By assessing the current position of teaching centre, any hindrances must be seen as a challenge and not as a threat. Any such problem must be tackled accordingly. The teaching centre should maintain a well- structured communication from top to bottom level. Each official should be valued and motivated as a part of organization and they must have the privilege to share suggestions regarding decision-making or any other activities. Practical experience so far has been very challenging and this is dynamic place to work where we can explore our own scopes and share our own opinions with our supervisors. This is not a general and monotonous place to work because every
13.33%20%
28.33%21.67%
16.67%
0.00%5.00%
10.00%15.00%20.00%25.00%30.00%
Strongly Disagree
Disagree Neutral Agree Strongly Agree
Measuring Service Quality Level of Tuition Providers in Bangladesh: A Study on S@Ifur's
© 2015 Global Journals Inc. (US)
57
Globa
l Jo
urna
l of M
anag
emen
t an
d Bu
siness Resea
rch
Volum
e XV Issue
III
Ver
sion
IYe
ar
()
E20
15
day there is something new to explore and feel great to be a part of this arena.
Teaching centre plays an important role in our education system by providing the couching facilities. In Bangladesh, both local and international S@ifur's has made a remarkable progress practically in every sphere of its activities. The activities of S@ifur's are very implicit and vast comparing to that of other teaching centre in the country today. To achieve the objectives S@ifur's works for improving the quality by identifying customer expectations as well as different problems related with management, employees and teachers. To achieve this desired goal it has intention to pursuit of excellence in the climate of continuous improvement. Because it believes the line of excellence is never ending, it also believes that its strategic plans and business will its strengths in competitive environment. Its motto is providing every single customer services available in today's teaching procedure for their students.
a) Limitation of the study Despite our sincere effort to keep flawless in our
survey, some limitations cannot be ruled out like, it is not possible to verify to what extent samples are representative. And if someone might have not expressed his/her heartfelt opinion, the same is also beyond scrutiny. However, we have made our sincere most endeavor to select in a neutral and proper way. Authors Details:
References Références Referencias
1.
Lovelock, C. and Wirtz, J. (2007) Service Marketing Sixth Edition:
Copyright by Pearson Education
International. Printed in the United States of America.
2.
Kotler, P. and Armstrong, G. (2010) Principle of Marketing 13 Edition:
Copyright by Pearson
Education International. Printed in Upper Saddle River, New Jerssy.
3.
M. Nurul Islam (2011)-Research Methods, Second Edition:
Published by Mullick & Brothers, Dhaka
New Market, Bangladesh.
4.
Parasuraman, A. zeithamal, VA and L.L. Berry, (2000) “ SERVAQUAL: A multiple item scale for measuring service quality and customer satisfaction”
5.
Valarie, A. Zeithmal & Mary Jo Bitner. (2009), International Edition 2006.- Service Marketing. Exclusive rights by McGraw-Hill Education (Asia). Published by The McGraw-Hill Companies, Inc. New York. Printed in Singapore.
6.
Website, Zeithaml, V.A., Parasuraman, A. and Berry, L.L.(1990), Delivering quality service; Balancing customer perceptions and expectations, The Free Press, New York, NY.
7.
MA.
Parasuraman,
A.,
Zeithaml,
V.
A. and Berry,
L.L. (1988),"SERVQUAL: a multi-item scale for measuring consumer perceptions of the service quality ",Journal of Retailing,Vol.64,No.1,pp.12-40.
8.
Baron, R.M. and Kenny, D.A. (1986), "The moderator-mediator variable distinction in social psychological research", Journal of Personality and Social Psychology, Vol. 51, pp. 1173-82. - See more at: http://www.emeraldgrouppublishing.com/-authors/guides/write/harvard.htm?part=2#sthash.4Kisg5c9.dpuf
9.
Stauss, B. and Weinlich, B. (1995), "Process-oriented measurement of service quality by applying the sequential incident technique", paper presented at the Fifth Workshop on Quality Management in Services, EIASM, Tilburg. - See more at: http://www.emeraldgrouppublishing.com/authors/guides/write/harvard.htm?part=2#sthash.4Kisg5c9.dpuf
10.
Strandvik, T. and Storbacka, K. (1996), "Managing relationship quality", paper presented at the QUIS5 Quality in Services Conference, University of Karlstad, Karlstad. - See more at: http://www.-emeraldgrouppublishing.com/authors/guides/write/harvard.htm?part=2#sthash.4Kisg5c9.dpuf
11.
S@ifur's Archive:
Course wise different prospectus of S@ifur's, Organizational Profile of S@ifur's; S@ifur’s website www.saifurs.org and www.saifurs.com.sg;Various reports & documents of Customer care department of S@ifur's
Measuring Service Quality Level of Tuition Providers in Bangladesh: A Study on S@Ifur's
© 2015 Global Journals Inc. (US)1
58
Globa
l Jo
urna
l of M
anag
emen
t an
d Bu
siness Resea
rch
Volum
e XV Issue
III
Ver
sion
IYe
ar
()
E20
15
2.
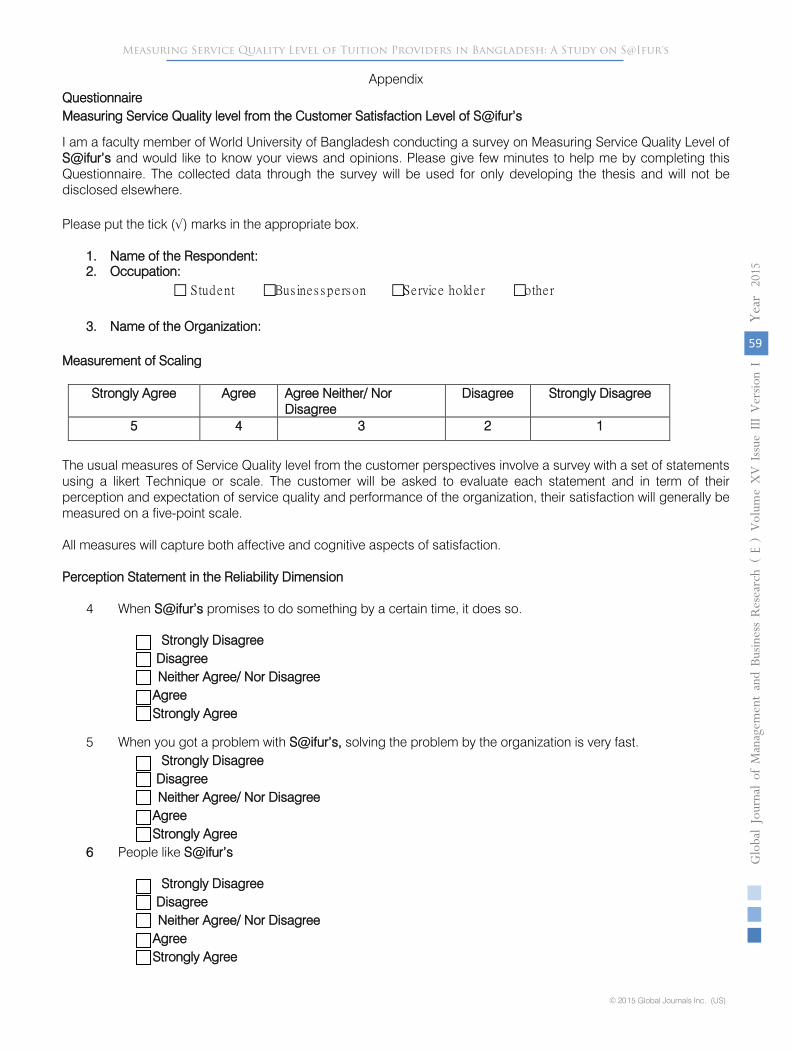
Occupation:
Student Bus ines spe rs on Service holde r othe r
3.
Name of the Organization:
Measurement of Scaling
Strongly Agree
Agree
Agree Neither/ Nor Disagree
Disagree
Strongly Disagree
5
4
3
2
1
The usual measures of Service Quality level from the customer perspectives involve a survey with a set of statements using a likert
Technique or scale. The customer will be asked to evaluate each statement and in term of their perception and expectation of service quality and performance of the organization, their satisfaction will generally be measured on a five-point scale.
All measures will capture both affective and cognitive aspects of satisfaction.
Perception Statement in the Reliability Dimension
4
When S@ifur’s
promises to do something by a certain time, it does so.
Strongly Disagree
Disagree
Neither Agree/ Nor Disagree
Agree
Strongly Agree
5
When you got a problem with
S@ifur’s, solving the problem by the organization is very fast.
Strongly Disagree
Disagree
Neither Agree/ Nor Disagree
Agree
Strongly Agree
6
People like
S@ifur’s
Strongly Disagree
Disagree
Neither Agree/ Nor Disagree
Agree
Strongly Agree
Measuring Service Quality Level of Tuition Providers in Bangladesh: A Study on S@Ifur's
© 2015 Global Journals Inc. (US)
59
Globa
l Jo
urna
l of M
anag
emen
t an
d Bu
siness Resea
rch
Volum
e XV Issue
III
Ver
sion
IYe
ar
()
E20
15
AppendixQuestionnaireMeasuring Service Quality level from the Customer Satisfaction Level of S@ifur’s
I am a faculty member of World University of Bangladesh conducting a survey on Measuring Service Quality Level of S@ifur’s and would like to know your views and opinions. Please give few minutes to help me by completing this Questionnaire. The collected data through the survey will be used for only developing the thesis and will not be disclosed elsewhere.
Please put the tick (√) marks in the appropriate box.
1. Name of the Respondent:
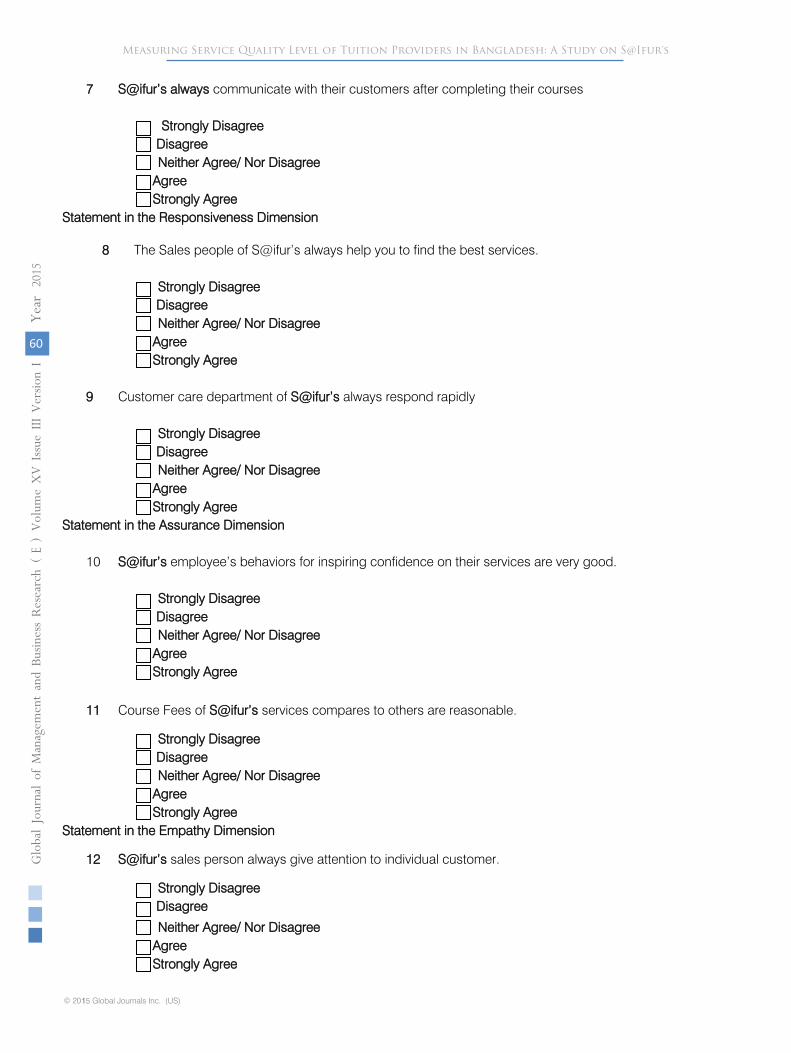
8
The Sales people of S@ifur’s always help you to find the best services.
Strongly Disagree
Disagree
Neither Agree/ Nor Disagree
Agree
Strongly Agree
9
Customer care department of S@ifur’s always respond rapidly
Strongly Disagree
Disagree
Neither Agree/ Nor Disagree
Agree
Strongly Agree
Statement in the Assurance Dimension
10
S@ifur’s employee’s behaviors for inspiring confidence on their services are very good.
Strongly Disagree
Disagree
Neither Agree/ Nor Disagree
Agree
Strongly Agree
11
Course Fees of
S@ifur’s services compares to others are reasonable.
Strongly Disagree
Disagree
Neither Agree/ Nor Disagree
Agree
Strongly Agree
Statement in the Empathy Dimension
Measuring Service Quality Level of Tuition Providers in Bangladesh: A Study on S@Ifur's
© 2015 Global Journals Inc. (US)1
60
Globa
l Jo
urna
l of M
anag
emen
t an
d Bu
siness Resea
rch
Volum
e XV Issue
III
Ver
sion
IYe
ar
()
E20
15
7 S@ifur’s always communicate with their customers after completing their courses
Strongly Disagree Disagree
Neither Agree/ Nor Disagree Agree Strongly Agree
Statement in the Responsiveness Dimension
12 S@ifur’s sales person always give attention to individual customer.
Strongly Disagree Disagree
Neither Agree/ Nor Disagree Agree Strongly Agree

Neither Agree/ Nor Disagree
Agree
Strongly Agree
Statement in the Satisfaction Dimension
14
S@ifur’s services quality is good.
Strongly Disagree
Disagree
Neither Agree/ Nor Disagree
Agree
Strongly Agree
15
S@ifur’s can meet the expectation of customers
Strongly Disagree
Disagree
Neither Agree/ Nor Disagree
Agree
Strongly Agree
Thank You
Measuring Service Quality Level of Tuition Providers in Bangladesh: A Study on S@Ifur's
© 2015 Global Journals Inc. (US)
61
Globa
l Jo
urna
l of M
anag
emen
t an
d Bu
siness Resea
rch
Volum
e XV Issue
III
Ver
sion
IYe
ar
()
E20
15
13 S@ifur’s understands your needs.
Strongly Disagree Disagree
This page is intentionally left blank
3
© 2015 Global Journals Inc. (US)1
62
Globa
l Jo
urna
l of M
anag
emen
t an
d Bu
siness Resea
rch
Volum
e XV Issue
III
Ver
sion
IYe
ar
()
E20
15Measuring Service Quality Level of Tuition Providers in Bangladesh: A Study on S@Ifur's