measuring speech intelligibility using dirac · tn002 measuring speech intelligibility using...
TRANSCRIPT
TN002TN002TN002TN002
TechnicalTechnicalTechnicalTechnical NoteNoteNoteNote
Copyright 2014 Acoustics Engineering www.acoustics-engineering.com April 2014
MEASURING SPEECH INTELLIGIBILITY USING DIRAC
Technical Note www.acoustics-engineering.com
TN002 Measuring Speech Intelligibility TN002 Measuring Speech Intelligibility TN002 Measuring Speech Intelligibility TN002 Measuring Speech Intelligibility Using DIRACUsing DIRACUsing DIRACUsing DIRAC
2 April 2014 Copyright 2014 Acoustics Engineering
This page intentionally left blank.
Technical Note www.acoustics-engineering.com
TN002 Measuring Speech Intelligibility Using DIRAC
Copyright 2014 Acoustics Engineering April 2014 3
Contents
1 Speech Intelligibility Basics .......................................................................... 4
1.1 Modulation Transfer Function MTF ...................................................................5
1.2 Modulation reduction matrix ..............................................................................6
1.3 Measuring MTF: modulated noise versus impulse response ............................7
1.4 MTF measurement conditions and limitations ...................................................7
2 Parameters Related to Speech Intelligibility .............................................. 9
2.1 Speech Transmission Index STI ........................................................................9
2.2 Room Acoustics Speech Transmission Index RASTI .......................................9
2.3 Speech Transmission Index for Telecommunication Systems STITEL ......... 10
2.4 Speech Transmission Index for PA Systems STIPA ...................................... 11
2.5 Percentage Articulation Loss of Consonants % ALC ..................................... 12
2.6 Signal to Noise Ratio SNR.............................................................................. 13
2.7 Early Decay Time EDT ................................................................................... 13
3 Measuring the Speech Intelligibility .......................................................... 14
3.1 Measurement techniques ............................................................................... 14
3.2 Sound Sources ............................................................................................... 15
3.3 Stimuli ............................................................................................................. 15
3.4 Speech levels and spectra ............................................................................. 16
3.5 Level calibration .............................................................................................. 17
3.6 System calibration .......................................................................................... 19
4 Measurement Scenarios .............................................................................. 21
4.1 Echo Speech Source measurements (IEC 60268-16) ................................... 21
4.2 Open plan office measurements (ISO 3382-3) ............................................... 21
4.3 Other speech intelligibility measurements ...................................................... 22
4.4 Situation 1: Talker and listeners in same room without sound system .......... 23
4.5 Situation 2: Talker and listeners in same room with sound system ............... 24
4.6 Situation 3: Talker and listeners in different areas ......................................... 26
5 Measurement Analysis ................................................................................ 29
5.1 Impulse response quality ................................................................................ 29
5.2 Parameter tables and graphs ......................................................................... 30
5.3 Changing signal and noise level values ......................................................... 32
6 Appendix: The impact of the SNR on speech intelligibility .................... 34
7 References .................................................................................................... 37

Technical Note www.acoustics-engineering.com
TN002 MeasurinTN002 MeasurinTN002 MeasurinTN002 Measuring Speech Intelligibility Using DIRACg Speech Intelligibility Using DIRACg Speech Intelligibility Using DIRACg Speech Intelligibility Using DIRAC
4 April 2014 Copyright 2014 Acoustics Engineering
This page intentionally left blank.
Technical Note www.acoustics-engineering.com
TN002 Measuring Speech Intelligibility Using DIRACTN002 Measuring Speech Intelligibility Using DIRACTN002 Measuring Speech Intelligibility Using DIRACTN002 Measuring Speech Intelligibility Using DIRAC
Copyright 2014 Acoustics Engineering April 2014 5
1 Speech Intelligibility Basics
1.1 Modulation Transfer Function MTF
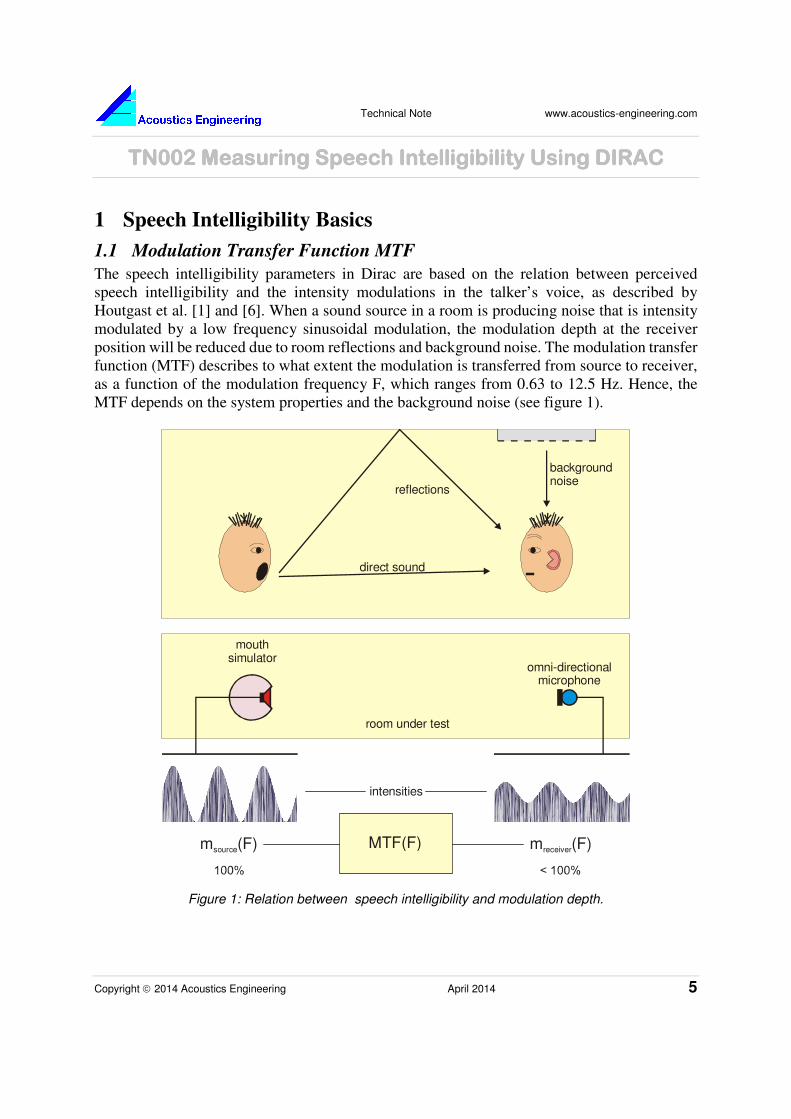
The speech intelligibility parameters in Dirac are based on the relation between perceived
speech intelligibility and the intensity modulations in the talker’s voice, as described by
Houtgast et al. [1] and [6]. When a sound source in a room is producing noise that is intensity
modulated by a low frequency sinusoidal modulation, the modulation depth at the receiver
position will be reduced due to room reflections and background noise. The modulation transfer
function (MTF) describes to what extent the modulation is transferred from source to receiver,
as a function of the modulation frequency F, which ranges from 0.63 to 12.5 Hz. Hence, the
MTF depends on the system properties and the background noise (see figure 1).
Figure 1: Relation between speech intelligibility and modulation depth.
backgroundnoise
direct sound
reflections
mouthsimulator
omni-directionalmicrophone
room under test
m (F)source m (F)receiverMTF(F)
intensities
Technical Note www.acoustics-engineering.com
TN002 MeasurinTN002 MeasurinTN002 MeasurinTN002 Measuring Speech Intelligibility Using DIRACg Speech Intelligibility Using DIRACg Speech Intelligibility Using DIRACg Speech Intelligibility Using DIRAC
6 April 2014 Copyright 2014 Acoustics Engineering
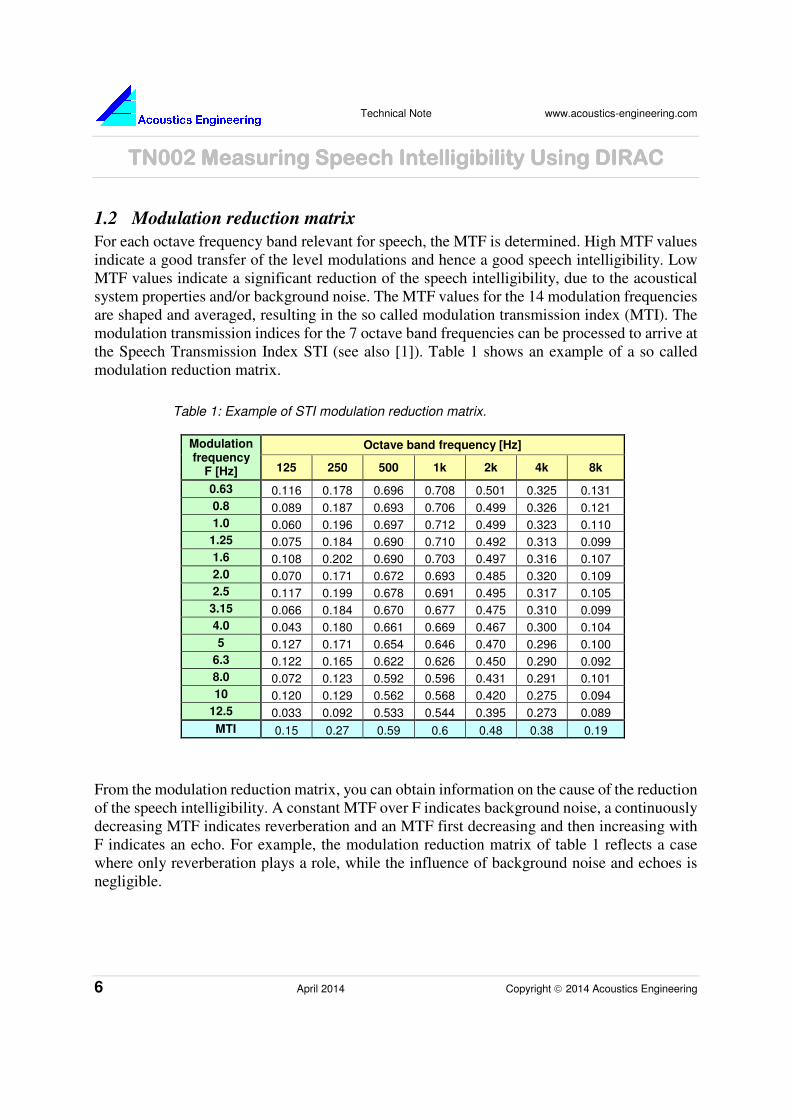
1.2 Modulation reduction matrix
For each octave frequency band relevant for speech, the MTF is determined. High MTF values
indicate a good transfer of the level modulations and hence a good speech intelligibility. Low
MTF values indicate a significant reduction of the speech intelligibility, due to the acoustical
system properties and/or background noise. The MTF values for the 14 modulation frequencies
are shaped and averaged, resulting in the so called modulation transmission index (MTI). The
modulation transmission indices for the 7 octave band frequencies can be processed to arrive at
the Speech Transmission Index STI (see also [1]). Table 1 shows an example of a so called
modulation reduction matrix.
Table 1: Example of STI modulation reduction matrix.
Modulation frequency
F [Hz]
Octave band frequency [Hz]
125 250 500 1k 2k 4k 8k
0.63 0.116 0.178 0.696 0.708 0.501 0.325 0.131
0.8 0.089 0.187 0.693 0.706 0.499 0.326 0.121
1.0 0.060 0.196 0.697 0.712 0.499 0.323 0.110
1.25 0.075 0.184 0.690 0.710 0.492 0.313 0.099
1.6 0.108 0.202 0.690 0.703 0.497 0.316 0.107
2.0 0.070 0.171 0.672 0.693 0.485 0.320 0.109
2.5 0.117 0.199 0.678 0.691 0.495 0.317 0.105
3.15 0.066 0.184 0.670 0.677 0.475 0.310 0.099
4.0 0.043 0.180 0.661 0.669 0.467 0.300 0.104
5 0.127 0.171 0.654 0.646 0.470 0.296 0.100
6.3 0.122 0.165 0.622 0.626 0.450 0.290 0.092
8.0 0.072 0.123 0.592 0.596 0.431 0.291 0.101
10 0.120 0.129 0.562 0.568 0.420 0.275 0.094
12.5 0.033 0.092 0.533 0.544 0.395 0.273 0.089
MTI 0.15 0.27 0.59 0.6 0.48 0.38 0.19
From the modulation reduction matrix, you can obtain information on the cause of the reduction
of the speech intelligibility. A constant MTF over F indicates background noise, a continuously
decreasing MTF indicates reverberation and an MTF first decreasing and then increasing with
F indicates an echo. For example, the modulation reduction matrix of table 1 reflects a case
where only reverberation plays a role, while the influence of background noise and echoes is
negligible.
Technical Note www.acoustics-engineering.com
TN002 Measuring Speech Intelligibility Using DIRACTN002 Measuring Speech Intelligibility Using DIRACTN002 Measuring Speech Intelligibility Using DIRACTN002 Measuring Speech Intelligibility Using DIRAC
Copyright 2014 Acoustics Engineering April 2014 7
The used octave frequency bands are related to the typical frequency range of a human voice.
A differentiation between male and female voice spectra is made in IEC 60268-16 [2]. The
female voice spectrum model does not include the 125 Hz octave band.
1.3 Measuring MTF: modulated noise versus impulse response
Two commonly used MTF measuring methods are the modulated noise method and the impulse
response method.
In the modulated noise method the excitation signal basically consists of 7 x 14 = 98 summed
noise signals, each of which is filtered and modulated according to the matrix in table 1. The
signal is picked up at the listener position and for each octave band and modulation frequency
the modulation reduction MTF(F) is measured. A complication for the full STI method
described here is that the modulations in one octave frequency band can influence the
modulations in other frequency bands. Not all 98 modulations can therefore be measured at
once. Also, due to the randomness of the excitation signal, it takes a relatively long time to
obtain reproducible results. In practice a single full STI measurement requires at least 15
minutes. The receiver can also misinterpret background noise fluctuations as signal
modulations, and overestimate the speech intelligibility at low SNR values.
Schroeder [3] has shown that the MTF, can also be derived from the Fourier transform of the
squared impulse response. Rife [4] has used [1] and [3] to include the impact of background
noise. If the impulse response is measured through deconvolution of a deterministic signal, such
as an MLS or sweep signal, the measurement takes far less time than with the modulated noise
method for the same reproducibility (some 5 s on average). The impulse response method does
however require more processing power.
1.4 MTF measurement conditions and limitations
The MTF as a basis for the speech intelligibility also has its limitations. Distortions in the
system under test may affect the MTF (hence the measured speech intelligibility) differently
from the real speech intelligibility. For instance, a recorded voice that is played back at a slightly
higher speed is still very intelligible, but the measured MTF may drop significantly. Centre
clipping (cross-over distortion) may affect the real speech intelligibility much more severely
than the measured MTF. The same holds for signal drop outs (Houtgast, Steeneken et al. [6]).
In general the deviation between real and measured speech intelligibility will be different for
the 2 measuring methods, mentioned in the previous section.
In the IEC 60268-16 standard [2], some conditions are given to avoid problems:
1. The system under test should not introduce frequency shifts or use frequency
multiplication.
2. The system under test should not contain vocoders, such as LPC, CELP and RELP.
Technical Note www.acoustics-engineering.com
TN002 MeasurinTN002 MeasurinTN002 MeasurinTN002 Measuring Speech Intelligibility Using DIRACg Speech Intelligibility Using DIRACg Speech Intelligibility Using DIRACg Speech Intelligibility Using DIRAC
8 April 2014 Copyright 2014 Acoustics Engineering
3. The speech transmission should be essentially linear, with amplitude compression or
expansion limited to 1 dB, and no peak clipping.
Obviously, we can add:
4. The system under test should not introduce center clipping.
5. The system under test should not introduce drop outs.
It is therefore important to be aware of any nonlinear behaviour when measuring the speech
intelligibility through a sound system. If the system is behaving linear, the measured and real
speech intelligibilities correlate very well for both methods.
Technical Note www.acoustics-engineering.com
TN002 Measuring Speech Intelligibility Using DIRACTN002 Measuring Speech Intelligibility Using DIRACTN002 Measuring Speech Intelligibility Using DIRACTN002 Measuring Speech Intelligibility Using DIRAC
Copyright 2014 Acoustics Engineering April 2014 9
2 Parameters Related to Speech Intelligibility
2.1 Speech Transmission Index STI
The speech transmission index STI is the most comprehensive and important speech
intelligibility parameter in Dirac. Although not usable for transmission channels that introduce
frequency shifts or frequency multiplication, or include vocoders, the STI takes into account
most effects that could cause deterioration of the speech intelligibility. For details, refer to [2].
Technically, the STI is calculated as the weighted sum of modulation transfer indices MTI, one
for each octave frequency band from 125 Hz through 8 kHz (where each MTI value is derived
from MTF values over 14 different modulation frequencies, see table 1) taking into account
auditory effects according to IEC 60268-16.
Through different MTI weighting factors, a differentiation has been made between male and
female STI values. The “STI male” is based on a standard male voice frequency spectrum.
Similarly, the “STI female” is based on a standard female voice frequency spectrum.
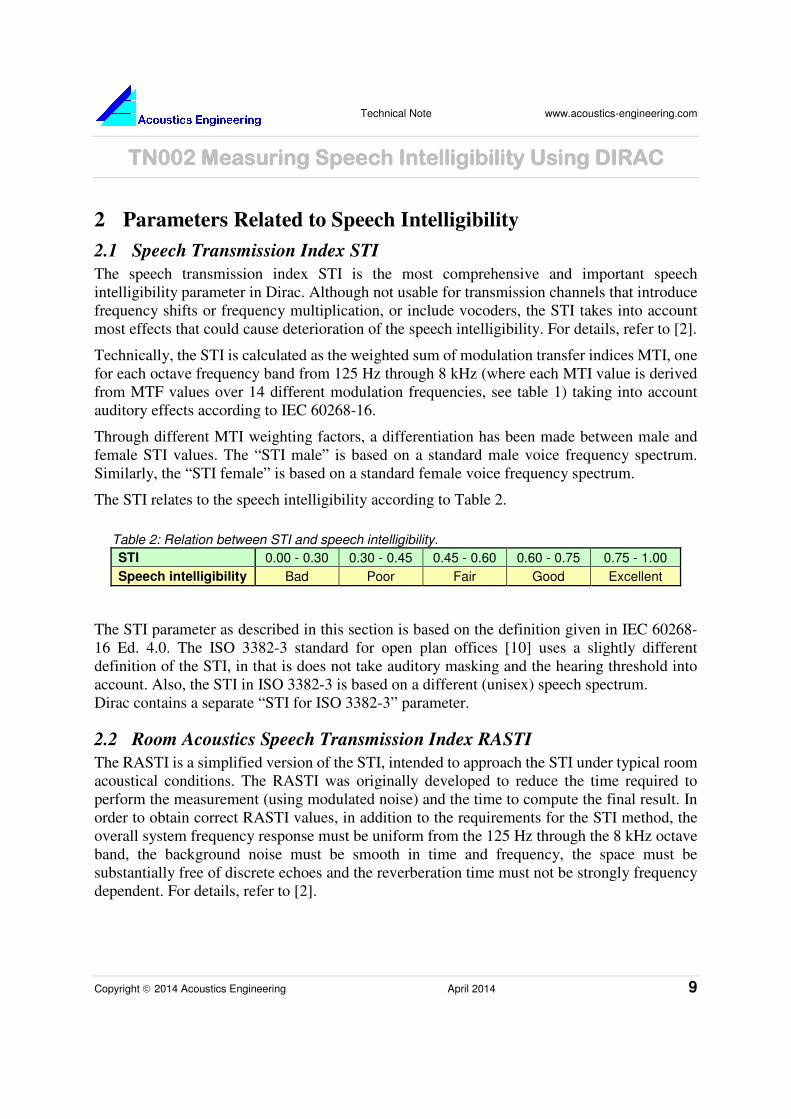
The STI relates to the speech intelligibility according to Table 2.
Table 2: Relation between STI and speech intelligibility.
STI 0.00 - 0.30 0.30 - 0.45 0.45 - 0.60 0.60 - 0.75 0.75 - 1.00
Speech intelligibility Bad Poor Fair Good Excellent
The STI parameter as described in this section is based on the definition given in IEC 60268-
16 Ed. 4.0. The ISO 3382-3 standard for open plan offices [10] uses a slightly different
definition of the STI, in that is does not take auditory masking and the hearing threshold into
account. Also, the STI in ISO 3382-3 is based on a different (unisex) speech spectrum.
Dirac contains a separate “STI for ISO 3382-3” parameter.
2.2 Room Acoustics Speech Transmission Index RASTI
The RASTI is a simplified version of the STI, intended to approach the STI under typical room
acoustical conditions. The RASTI was originally developed to reduce the time required to
perform the measurement (using modulated noise) and the time to compute the final result. In
order to obtain correct RASTI values, in addition to the requirements for the STI method, the
overall system frequency response must be uniform from the 125 Hz through the 8 kHz octave
band, the background noise must be smooth in time and frequency, the space must be
substantially free of discrete echoes and the reverberation time must not be strongly frequency
dependent. For details, refer to [2].
Technical Note www.acoustics-engineering.com
TN002 MeasurinTN002 MeasurinTN002 MeasurinTN002 Measuring Speech Intelligibility Using DIRACg Speech Intelligibility Using DIRACg Speech Intelligibility Using DIRACg Speech Intelligibility Using DIRAC
10 April 2014 Copyright 2014 Acoustics Engineering
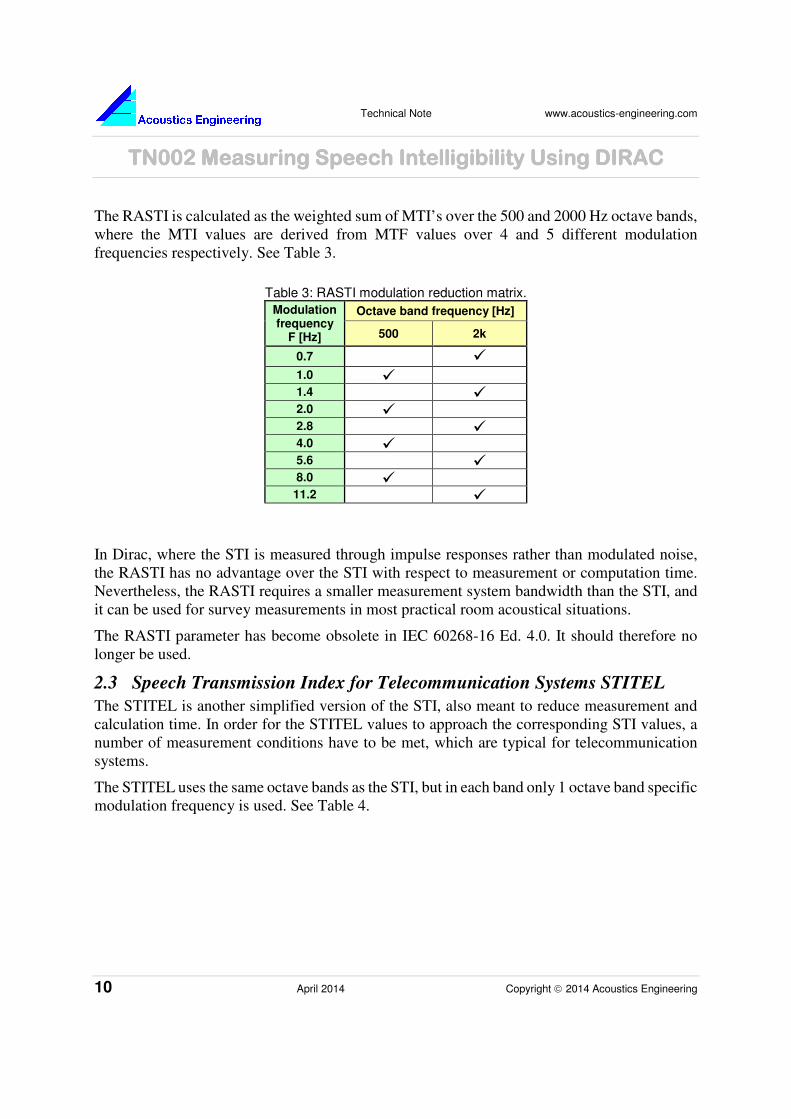
The RASTI is calculated as the weighted sum of MTI’s over the 500 and 2000 Hz octave bands,
where the MTI values are derived from MTF values over 4 and 5 different modulation
frequencies respectively. See Table 3.
Table 3: RASTI modulation reduction matrix.
Modulation frequency
F [Hz]
Octave band frequency [Hz]
500 2k
0.7 �
1.0 �
1.4 � 2.0 �
2.8 � 4.0 �
5.6 � 8.0 �
11.2 �
In Dirac, where the STI is measured through impulse responses rather than modulated noise,
the RASTI has no advantage over the STI with respect to measurement or computation time.
Nevertheless, the RASTI requires a smaller measurement system bandwidth than the STI, and
it can be used for survey measurements in most practical room acoustical situations.
The RASTI parameter has become obsolete in IEC 60268-16 Ed. 4.0. It should therefore no
longer be used.
2.3 Speech Transmission Index for Telecommunication Systems STITEL
The STITEL is another simplified version of the STI, also meant to reduce measurement and
calculation time. In order for the STITEL values to approach the corresponding STI values, a
number of measurement conditions have to be met, which are typical for telecommunication
systems.
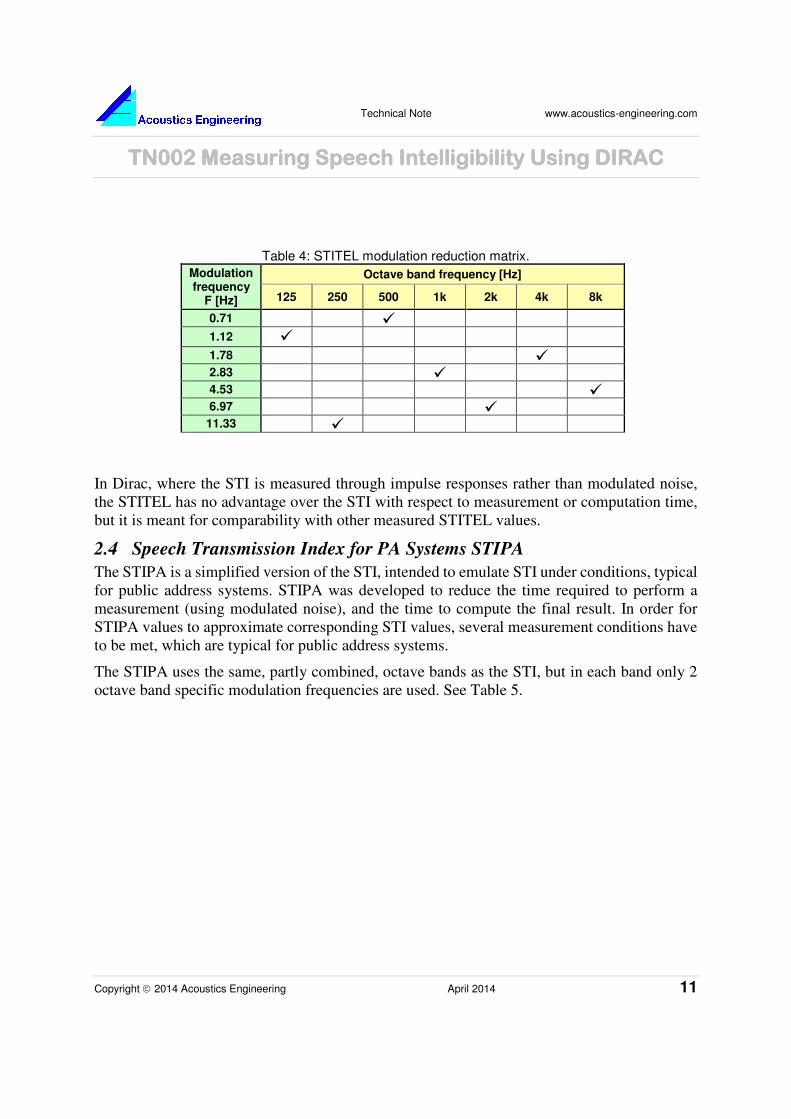
The STITEL uses the same octave bands as the STI, but in each band only 1 octave band specific
modulation frequency is used. See Table 4.
Technical Note www.acoustics-engineering.com
TN002 Measuring Speech Intelligibility Using DIRACTN002 Measuring Speech Intelligibility Using DIRACTN002 Measuring Speech Intelligibility Using DIRACTN002 Measuring Speech Intelligibility Using DIRAC
Copyright 2014 Acoustics Engineering April 2014 11
Table 4: STITEL modulation reduction matrix.
Modulation frequency
F [Hz]
Octave band frequency [Hz]
125 250 500 1k 2k 4k 8k
0.71 �
1.12 �
1.78 �
2.83 �
4.53 � 6.97 �
11.33 �
In Dirac, where the STI is measured through impulse responses rather than modulated noise,
the STITEL has no advantage over the STI with respect to measurement or computation time,
but it is meant for comparability with other measured STITEL values.
2.4 Speech Transmission Index for PA Systems STIPA
The STIPA is a simplified version of the STI, intended to emulate STI under conditions, typical
for public address systems. STIPA was developed to reduce the time required to perform a
measurement (using modulated noise), and the time to compute the final result. In order for
STIPA values to approximate corresponding STI values, several measurement conditions have
to be met, which are typical for public address systems.
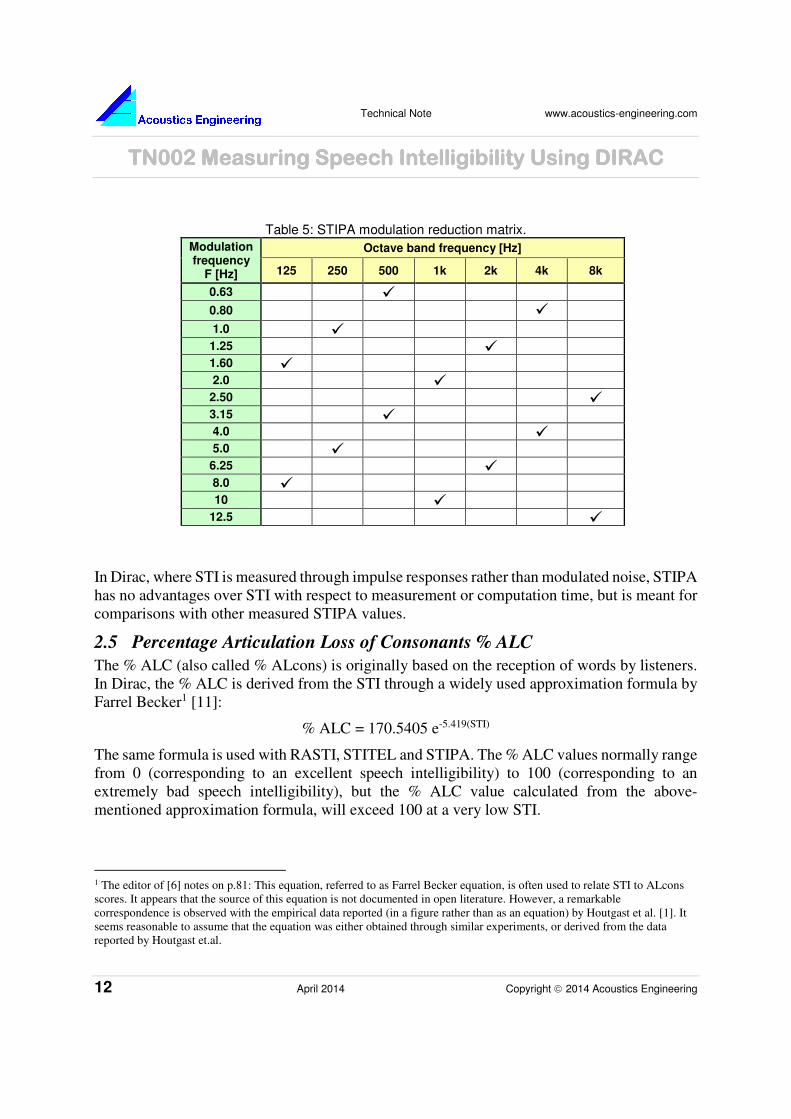
The STIPA uses the same, partly combined, octave bands as the STI, but in each band only 2
octave band specific modulation frequencies are used. See Table 5.
Technical Note www.acoustics-engineering.com
TN002 MeasurinTN002 MeasurinTN002 MeasurinTN002 Measuring Speech Intelligibility Using DIRACg Speech Intelligibility Using DIRACg Speech Intelligibility Using DIRACg Speech Intelligibility Using DIRAC
12 April 2014 Copyright 2014 Acoustics Engineering
Table 5: STIPA modulation reduction matrix.
Modulation frequency
F [Hz]
Octave band frequency [Hz]
125 250 500 1k 2k 4k 8k
0.63 �
0.80 �
1.0 �
1.25 �
1.60 �
2.0 �
2.50
� 3.15 �
4.0 �
5.0 �
6.25 �
8.0 �
10 �
12.5 �
In Dirac, where STI is measured through impulse responses rather than modulated noise, STIPA
has no advantages over STI with respect to measurement or computation time, but is meant for
comparisons with other measured STIPA values.
2.5 Percentage Articulation Loss of Consonants % ALC
The % ALC (also called % ALcons) is originally based on the reception of words by listeners.
In Dirac, the % ALC is derived from the STI through a widely used approximation formula by
Farrel Becker1 [11]:
% ALC = 170.5405 e-5.419(STI)
The same formula is used with RASTI, STITEL and STIPA. The % ALC values normally range
from 0 (corresponding to an excellent speech intelligibility) to 100 (corresponding to an
extremely bad speech intelligibility), but the % ALC value calculated from the above-
mentioned approximation formula, will exceed 100 at a very low STI.
1 The editor of [6] notes on p.81: This equation, referred to as Farrel Becker equation, is often used to relate STI to ALcons
scores. It appears that the source of this equation is not documented in open literature. However, a remarkable
correspondence is observed with the empirical data reported (in a figure rather than as an equation) by Houtgast et al. [1]. It
seems reasonable to assume that the equation was either obtained through similar experiments, or derived from the data
reported by Houtgast et.al.
Technical Note www.acoustics-engineering.com
TN002 Measuring Speech Intelligibility Using DIRACTN002 Measuring Speech Intelligibility Using DIRACTN002 Measuring Speech Intelligibility Using DIRACTN002 Measuring Speech Intelligibility Using DIRAC
Copyright 2014 Acoustics Engineering April 2014 13
The % ALC in Dirac is mainly meant for comparison with other calculated or measured % ALC
values.
2.6 Signal to Noise Ratio SNR
The SNR is defined as the logarithmic ratio of the signal level and the noise level, and is
therefore related to signals rather than systems. In Dirac, the SNR is the ratio of speech and
background noise signal levels as derived from the impulse response, or from the impulse
response and a separate background noise measurement (intermittent measurement). This is not
necessarily the same as the apparent SNR used in the speech intelligibility calculations. In
certain measurements scenarios (described later in this document), the measured signal levels
are modified to line up with prescribed speech spectra.
2.7 Early Decay Time EDT
Because the EDT relates more than the other reverberation parameters to the initial and highest
level part of the decaying energy, it also relates most to modulation reduction. The EDT is
derived from the decay curve section between 0 dB and 10 dB below the initial level. From the
corresponding slope, the EDT is calculated as the time to reach –60 dB.
Technical Note www.acoustics-engineering.com
TN002 MeasurinTN002 MeasurinTN002 MeasurinTN002 Measuring Speech Intelligibility Using DIRACg Speech Intelligibility Using DIRACg Speech Intelligibility Using DIRACg Speech Intelligibility Using DIRAC
14 April 2014 Copyright 2014 Acoustics Engineering
3 Measuring the Speech Intelligibility
3.1 Measurement techniques
There are two factors that determine the speech intelligibility. The background noise, or rather
the signal to noise ratio SNR, and the acoustics of the room (e.g. the sound reflections in the
room). In Appendix B the impact of the SNR on speech intelligibility is detailed, which leads
to the so called 15 dB SNR criterion:
The background noise is negligible if the SNR exceeds 15 dB in each relevant octave
frequency band and the STI does not exceed 0.8.
In practice, STI values rarely exceed 0.8 and therefore, in most practical cases it will be
sufficient to meet only the SNR > 15 dB condition, in which case a background noise
measurement is not required and the STI can be calculated from any impulse response
measurement. In many cases however the SNR is lower than 15 dB and the background noise
level is relevant. In the remainder of this document it is assumed the 15dB criterion is not met,
unless states otherwise.
Dirac derives the acoustics of a room from a measured impulse response. Rife [4] has found
that (under specific conditions) the SNR can also be calculated from the measured impulse
response. This means that both factors influencing the speech intelligibility can be measured
simultaneously in principle. The specific conditions that need to be fulfilled for an accurate
determination of the SNR from an impulse response are low distortion in the measurement
chain and time-invariant acoustics (no air movement, or people walking around), resulting in
system induced noise that is much lower than the background noise. Also, pre-averaging cannot
be used as this would artificially increase the SNR.
However, it is also possible to measure both factors independently. In fact, measuring the room
acoustics using an impulse response without the presence of (significant) background noise
gives much better results, as you can use pre-averaging, longer sequence lengths etc. to improve
the quality (INR) of the impulse response. Also, it is not always possible or even desirable to
measure the impulse response in the presence of background noise.
Measuring the background noise is also easier (and more accurate) through a direct level
measurement instead of indirectly through an impulse response measurement.
The preferred method of measuring the speech intelligibility using Dirac is therefore through
separate measurements of the impulse response and the background noise. These can then be
combined when calculating the speech intelligibility. This also makes it possible to use a single
impulse response measurement to study different scenarios with different SNR values.

Technical Note www.acoustics-engineering.com
TN002 Measuring Speech Intelligibility Using DIRACTN002 Measuring Speech Intelligibility Using DIRACTN002 Measuring Speech Intelligibility Using DIRACTN002 Measuring Speech Intelligibility Using DIRAC
Copyright 2014 Acoustics Engineering April 2014 15
3.2 Sound Sources
Mouth-directional loudspeaker sound sources
Mouth-directional loudspeaker sound sources, in short mouth simulators, have a directivity
similar to a human mouth. This directivity is relevant for the speech intelligibility, in that speech
intelligibility is highest on the axis of the source. An artificial mouth with directivity
characteristics according to ITU-T P.51 [5] is preferred. A small high quality loudspeaker with
diameter not exceeding 100 mm is also usable.
A mouth simulator is normally used in the situation of an unamplified talker or in a situation
with a sound system equipped with a close-talking microphone.
The B&K Echo Speech Source Type 4720 was specifically designed for speech intelligibility
measurements with Dirac. It features the proper directivity and fully calibrated sound levels and
sound spectrum. The use of the Echo with Dirac is described in later sections of this document.
Omni-directional loudspeaker sound sources
Omnidirectional sound sources are required for ISO 3382-3 compliant measurements. The
source must fulfill the requirements set out in ISO 3382-1, and must be used at a height of 1.2m.
The B&K OmniSource Type 4295 and the OmniPower Type 4292-L are both omnidirectional
sound sources that can be used for open plan office measurements.
3.3 Stimuli
Sweep versus MLS
For impulse response measurements any broadband signal can be used, but the most common
are MLS and sweep. The exponential sweep (e-sweep) in particular has a number of properties
making it very useful for impulse response measurements [12]. The disadvantage of e-sweeps
(or sweeps in general) is that they sound much more intrusive than MLS signals. There are
occasions where the use of sweeps is simply not allowed. Sweeps are also more difficult to
handle for sound sources. The MLS is therefore still a very useful alternative.
Intermittent stimulus
To facilitate the independent measurement of impulse response (IR) and background noise,
Dirac provides the intermittent stimulus. This stimulus consists of a standard deterministic MLS
or sweep stimulus followed by a period of silence. Both parts are treated as a single
measurement, and the resulting impulse response and background noise measurement are
combined in a single .wav file, with the IR in the first and the background noise in the second
channel. The intermittent stimulus also circumvents Rife’s condition regarding the artificial
increase of the SNR when using pre-averaging.
Technical Note www.acoustics-engineering.com
TN002 MeasurinTN002 MeasurinTN002 MeasurinTN002 Measuring Speech Intelligibility Using DIRACg Speech Intelligibility Using DIRACg Speech Intelligibility Using DIRACg Speech Intelligibility Using DIRAC
16 April 2014 Copyright 2014 Acoustics Engineering
3.4 Speech levels and spectra
Speech intelligibility measurements must be carried out using test signals that resemble human
speech in level and spectrum in order to capture the correct SNR values in each frequency band.
IEC 60268-16 specifies male and female speech spectra for use in STI, STIPA and STITEL
measurements. The STIPA is only measured for a male speech spectrum. The A-weighted level
of the speech signal should be 60 dB at 1 m from the source, and the octave bands should have
the relative levels as indicated in Table 6.
Table 6: Relative octave band levels [dB].
Octave band [Hz] 125 250 500 1000 2000 4000 8000
Male 2.9 2.9 -0.8 -6.8 -12.8 -18.8 -24.8
Female -- 5.3 -1.9 -9.1 -15.8 -16.7 -18.0
For RASTI measurements, where only 2 octave bands are relevant, the relative levels are as
follows:
Table 7: Relative octave band levels for the RASTI test signal.
Octave band [Hz] 500 2000
Level [dB] -1.0 -10.0
ISO 3382-3 uses a spectrum derived from averaged male and female spectra [13]. The total A-
weighted level is 57.4 dB at 1 m from the (omnidirectional) source with the levels for each
octave band given in Table 8.
Table 8: Sound pressure levels of speech for ISO 3382-3 [dB]
Octave band [Hz] 125 250 500 1000 2000 4000 8000
Omni source level 49.9 54.3 58.0 52.0 44.8 38.8 33.5
Although it is possible to create signals with the correct spectrum in Dirac, in most practical
measurement scenarios an arbitrary but known source spectrum is used for the measurements
and the measured SNR values are then recalculated for the desired speech spectrum.
Note that the frequency response of the source has to be taken into account when attempting to
generate signals with a predefined spectrum. Although in principle this can be done using an
equaliser or using a shaping filter created with Dirac, it is much easier to use a calibrated source.
When the signal is injected directly in an existing PA system, no equalisation is necessary, as
the response of the PA system always influences the speech signal, and is part of the system
that needs to be measured. Note however that the stimulus still needs to be speech shaped if the
15 dB criterion is not met.
Technical Note www.acoustics-engineering.com
TN002 Measuring Speech Intelligibility Using DIRACTN002 Measuring Speech Intelligibility Using DIRACTN002 Measuring Speech Intelligibility Using DIRACTN002 Measuring Speech Intelligibility Using DIRAC
Copyright 2014 Acoustics Engineering April 2014 17
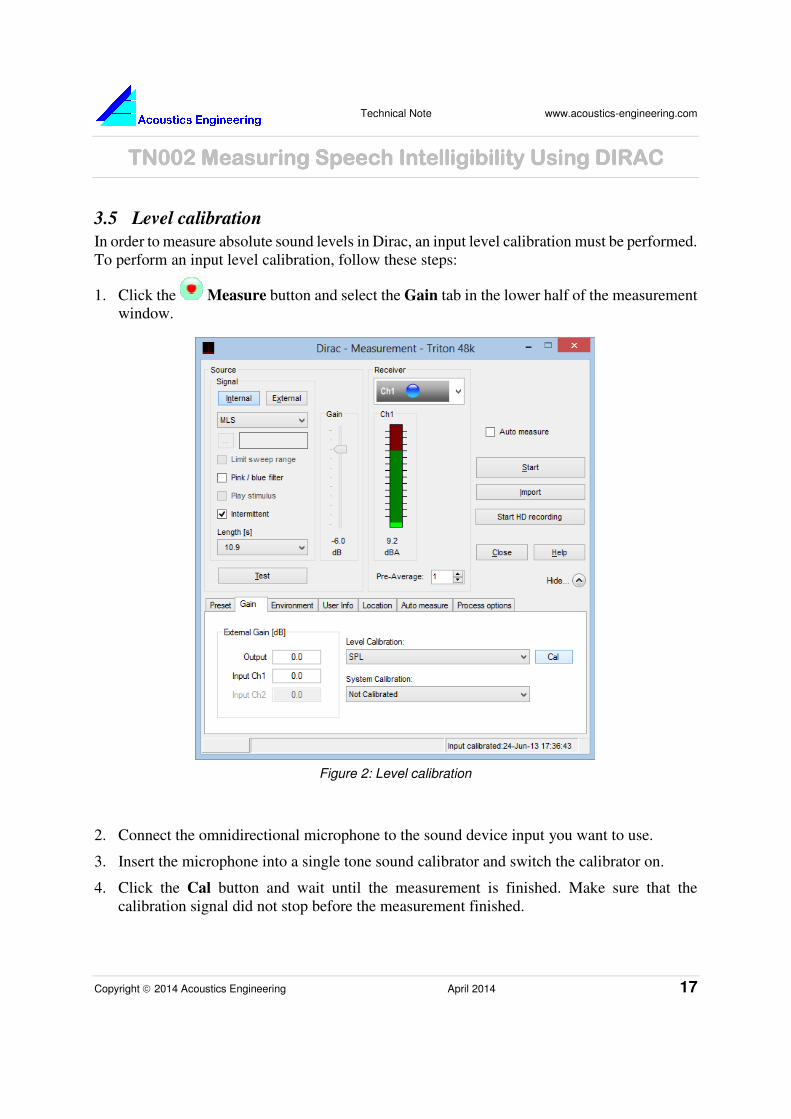
3.5 Level calibration
In order to measure absolute sound levels in Dirac, an input level calibration must be performed.
To perform an input level calibration, follow these steps:
1. Click the Measure button and select the Gain tab in the lower half of the measurement
window.
2. Connect the omnidirectional microphone to the sound device input you want to use.
3. Insert the microphone into a single tone sound calibrator and switch the calibrator on.
4. Click the Cal button and wait until the measurement is finished. Make sure that the
calibration signal did not stop before the measurement finished.
Figure 2: Level calibration
Technical Note www.acoustics-engineering.com
TN002 MeasurinTN002 MeasurinTN002 MeasurinTN002 Measuring Speech Intelligibility Using DIRACg Speech Intelligibility Using DIRACg Speech Intelligibility Using DIRACg Speech Intelligibility Using DIRAC
18 April 2014 Copyright 2014 Acoustics Engineering
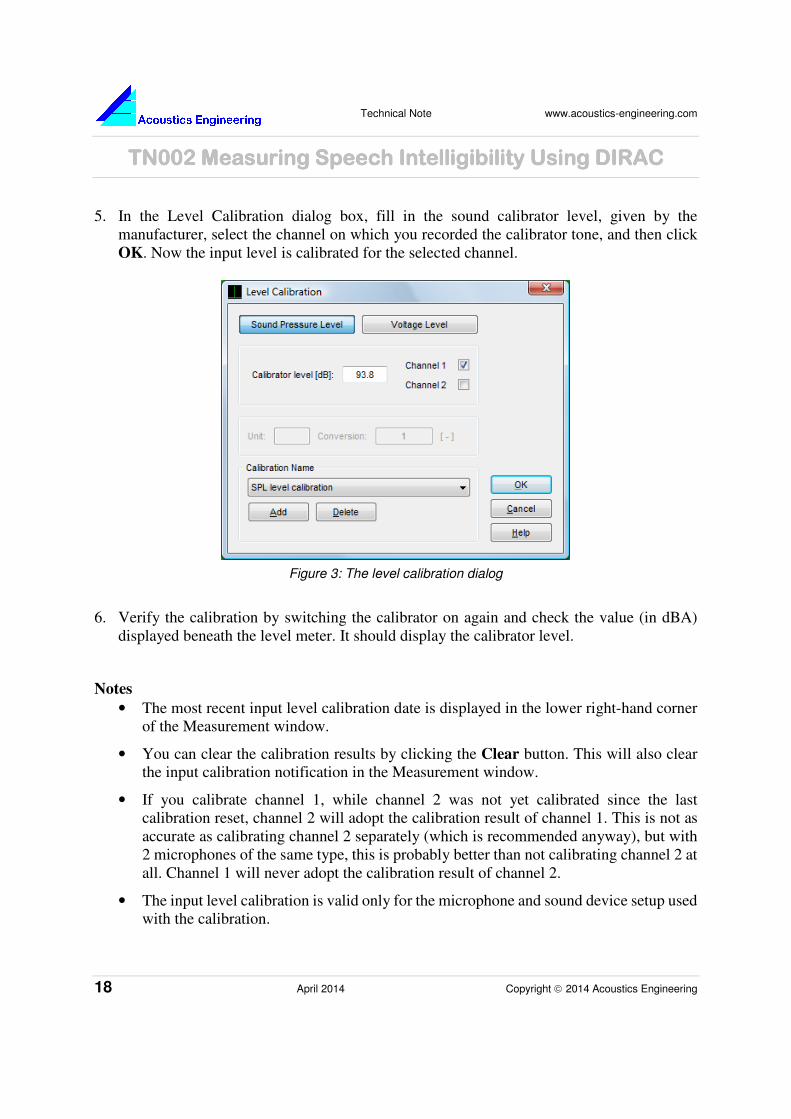
5. In the Level Calibration dialog box, fill in the sound calibrator level, given by the
manufacturer, select the channel on which you recorded the calibrator tone, and then click
OK. Now the input level is calibrated for the selected channel.
6. Verify the calibration by switching the calibrator on again and check the value (in dBA)
displayed beneath the level meter. It should display the calibrator level.
Notes
• The most recent input level calibration date is displayed in the lower right-hand corner
of the Measurement window.
• You can clear the calibration results by clicking the Clear button. This will also clear
the input calibration notification in the Measurement window.
• If you calibrate channel 1, while channel 2 was not yet calibrated since the last
calibration reset, channel 2 will adopt the calibration result of channel 1. This is not as
accurate as calibrating channel 2 separately (which is recommended anyway), but with
2 microphones of the same type, this is probably better than not calibrating channel 2 at
all. Channel 1 will never adopt the calibration result of channel 2.
• The input level calibration is valid only for the microphone and sound device setup used
with the calibration.
Figure 3: The level calibration dialog
Technical Note www.acoustics-engineering.com
TN002 Measuring Speech Intelligibility Using DIRACTN002 Measuring Speech Intelligibility Using DIRACTN002 Measuring Speech Intelligibility Using DIRACTN002 Measuring Speech Intelligibility Using DIRAC
Copyright 2014 Acoustics Engineering April 2014 19
• The procedure is described for 1 microphone. You can also calibrate 2 microphones
simultaneously, using a sound intensity microphone probe calibrator.
• Input level calibration is useful only if the sound device input frequency characteristic
is flat within ±1 dB over 88 Hz through 11.3 kHz.
• It is recommended to repeat the input level calibration before each speech intelligibility
measurement session.
3.6 System calibration
The sound source must deliver the speech signal at a prescribed sound level. For most speech
intelligibility measurements one can use the B&K Echo Speech Source Type 4720. Dirac is
equipped to recognize the (fully calibrated) Echo signals making the Echo-Dirac combination
the easiest option for accurate speech intelligibility measurements.
ISO 3382-3 compliant measurements require the use of an omnidirectional sound source that
needs to be calibrated. In Dirac this is handled through a system calibration. The system
calibration characterizes the complete measurement chain, including amplifiers and
microphones. The calibration is best performed in a reverberation room, but a free-field
calibration is also possible.
To perform the system calibration, follow these steps:
1. Set up the measurement window as you would for the speech intelligibility measurement.
Make sure you select the same stimulus and receiver type, but do not select an intermittent
stimulus. For instance, if you want to perform ISO 3382-3 measurements, load the ISO
3382-3 measurement preset, but uncheck the ‘Intermittent’ option.
2. Make a note of the gain settings on you amplifier(s). These settings will need to be the same
during the final measurement, or any changes will have to be entered on the Gain tab.
3. Perform impulse response measurements in a reverberation chamber or in a free-field
situation (f.i. on a large stage). In a reverberation chamber measure on at least 3 microphone
positions. In a free field, rotate the source over 5, 7 or 9 angles of 360/n degrees.
4. Choose Calibrate System… from the Setup menu.
5. Click Add and select the calibration measurements.
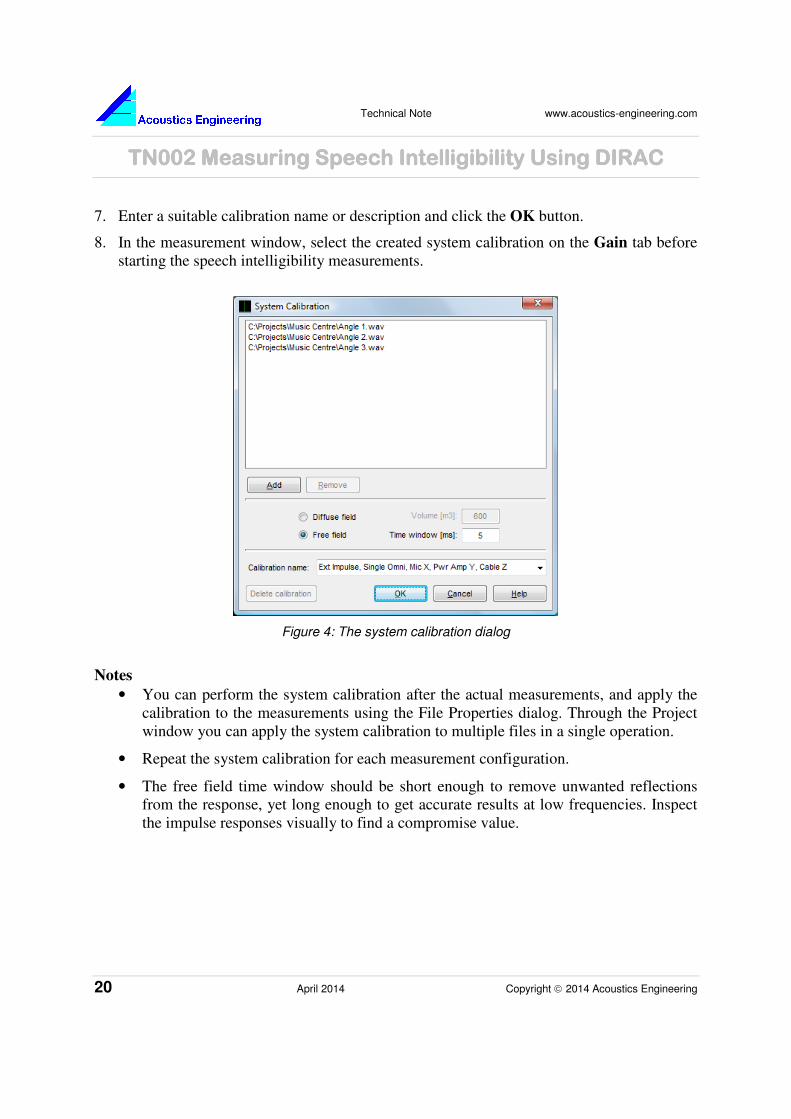
6. Select Diffuse field and enter a Volume for a reverberation chamber, otherwise select Free
field and enter an appropriate Time window to remove reflections from the signal.
Technical Note www.acoustics-engineering.com
TN002 MeasurinTN002 MeasurinTN002 MeasurinTN002 Measuring Speech Intelligibility Using DIRACg Speech Intelligibility Using DIRACg Speech Intelligibility Using DIRACg Speech Intelligibility Using DIRAC
20 April 2014 Copyright 2014 Acoustics Engineering
7. Enter a suitable calibration name or description and click the OK button.
8. In the measurement window, select the created system calibration on the Gain tab before
starting the speech intelligibility measurements.
Figure 4: The system calibration dialog
Notes
• You can perform the system calibration after the actual measurements, and apply the
calibration to the measurements using the File Properties dialog. Through the Project
window you can apply the system calibration to multiple files in a single operation.
• Repeat the system calibration for each measurement configuration.
• The free field time window should be short enough to remove unwanted reflections
from the response, yet long enough to get accurate results at low frequencies. Inspect
the impulse responses visually to find a compromise value.
Technical Note www.acoustics-engineering.com
TN002 Measuring Speech Intelligibility Using DIRACTN002 Measuring Speech Intelligibility Using DIRACTN002 Measuring Speech Intelligibility Using DIRACTN002 Measuring Speech Intelligibility Using DIRAC
Copyright 2014 Acoustics Engineering April 2014 21
4 Measurement Scenarios
4.1 Echo Speech Source measurements (IEC 60268-16)
The Echo Speech Source is delivered with software. After installation on a PC where a copy of
Dirac is installed, Dirac will provide the option to select the Echo signal as a stimulus, and it
contains an Echo preset. To perform an Echo measurement, follow these steps:
1. Perform a level calibration of the microphone.
2. Select the Echo preset on the Preset tab of the measurement window.
3. If the Echo is positioned in front of a microphone connected to a PA system, start the speech
signal and set the gain on the PA system such that the speech level appears normal.
4. Turn on the Echo Speech source and start the MLS signal.
5. Click the Start button in the Dirac measurement window.
Dirac will automatically recognize the continuous or intermittent signal and whether it is played
at a normal or raised level.
Use the intermittent signal where the reverberation time is relatively short and the background
noise has a significant impact. As a rule of thumb, use the intermittent signal when:
RT × SNR < 120 [dBs]
Otherwise use the continuous signal. Note that you can use pre-averaging with the intermittent
stimulus to increase the INR.
The raised Echo level can be used when the background noise is very high and pre-averaging
does not get the INR over 20dB for the normal signal level.
4.2 Open plan office measurements (ISO 3382-3)
Dirac contains a preset for ISO 3382-3 measurements. The procedure for open plan office
measurements is as follows:
1. Perform a system calibration with the measurement equipment (you only need to do this
once).
2. Perform a level calibration.
3. Select the ISO 3382-3 preset on the Preset tab of the measurement window.
4. The preset uses a pink filtered MLS stimulus. Change this to an e-sweep when desired, but
note that the system calibration must be performed with the same stimulus.
5. Use the Test button to find the correct output gain. Change the amplifier gains if necessary,
but be sure to enter the gain differences on the Gain tab.
Technical Note www.acoustics-engineering.com
TN002 MeasurinTN002 MeasurinTN002 MeasurinTN002 Measuring Speech Intelligibility Using DIRACg Speech Intelligibility Using DIRACg Speech Intelligibility Using DIRACg Speech Intelligibility Using DIRAC
22 April 2014 Copyright 2014 Acoustics Engineering
6. Click the Start button in the Dirac measurement window.
7. Repeat the measurement on 6 to 10 workstation positions along a line.
8. Analyse the impulse responses.
The ISO 3382-3 preset uses an intermittent stimulus. It is possible to set a higher pre-average
value with this measurement to increase the INR if necessary.
4.3 Other speech intelligibility measurements
When the 15 dB criterion (see Measurement techniques) is met, a speech intelligibility
measurement can be performed with the following procedure:
1. Connect the excitation signal to a mouth simulator at the talker position or to the sound
system input.
2. Connect an omnidirectional microphone at a listener position to sound device input 1.
3. In Dirac, select an excitation signal (e-sweep or MLS are common choices).
4. Set a capture length exceeding 2 s and the estimated reverberation time. Note that a
longer capture length generally results in a better INR.
5. Select a Pre-Average value. Higher pre-average values result in a higher INR.
6. Measure and save the impulse response.
7. If applicable, repeat the measurement with the receiver at different listener positions.
8. Analyse the impulse responses.
When the 15 dB criterion is not met, measuring an impulse response in the presence of
significant background noise to determine the speech intelligibility can be difficult without a
calibrated source. Dirac demands an INR higher than 20 dB to be able to reliably calculate the
SNR. At the same time, a low SNR value during the measurement is detrimental to the quality
of the impulse response and hence the INR. To add to these difficulties, the method devised by
Rife to calculate the SNR from the impulse response does not give the correct results when the
SNR is increased artificially through pre-averaging.
1. Calibrate the input level
2. Use an equalizer and a pink noise signal to flatten the response of a mouth simulator
when applicable. You can also use the Shaping Filter Designer (SFD) in Dirac to create
a filter with which to shape the stimulus for a specific sound source.
3. Generate an MLS or Lin-Sweep stimulus (Edit – Generate) and filter it with an
appropriate filter (Edit – Filter). Use the resulting signal as a User defined stimulus.
Select the filter depending on the parameter that needs to be calculated:
Technical Note www.acoustics-engineering.com
TN002 Measuring Speech Intelligibility Using DIRACTN002 Measuring Speech Intelligibility Using DIRACTN002 Measuring Speech Intelligibility Using DIRACTN002 Measuring Speech Intelligibility Using DIRAC
Copyright 2014 Acoustics Engineering April 2014 23
Table 9: Output filter versus speech intelligibility parameter.
Speech intelligibility parameter to be measured Output filter
STI Male or corresponding % ALC value
STI Female or corresponding % ALC value
RASTI or corresponding % ALC value
STIPA or corresponding % ALC value
Male
Female
RASTI
Male
4. Set the output level to a practical value or 60 dB(A).
5. Measure the IR with a pre-average value of 1 for a non-intermittent measurement, use
a higher pre-average value if necessary for intermittent measurements.
Note that it is possible to use either internally or externally generated stimuli. When using an
external stimulus, the stimulus type, source filter and sequence length of this external signal
need to conform to the settings in the measurement dialog. You can find a number of speech
filtered MLS and Lin-Sweep stimuli on the Dirac CD.
At this point it is important to note that the INR in all relevant octave bands of the measured
impulse response should be higher than 20 dB. This is required for Dirac to be able to calculate
the SNR and many other parameters. In most situations this requirement can easily be met by a
combination of techniques such as longer capture lengths, higher pre-average values and higher
stimulus output levels.
Hereafter, for several situations the measurement setup will be described in more detail.
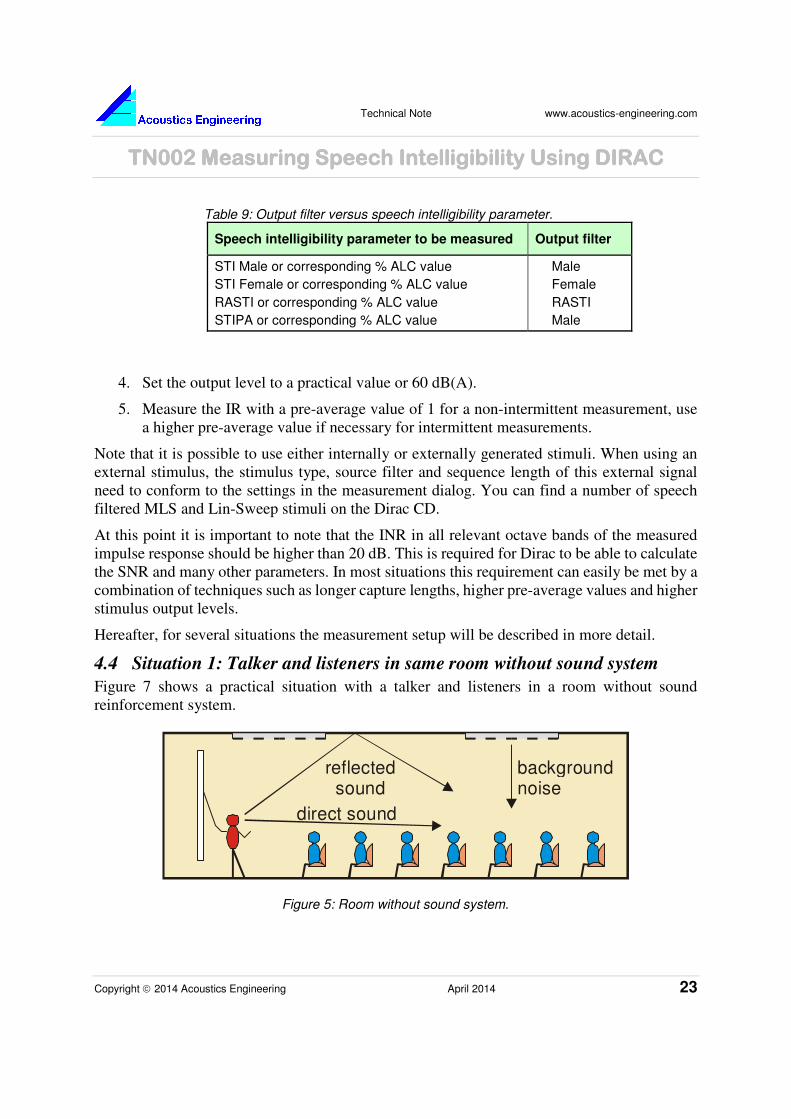
4.4 Situation 1: Talker and listeners in same room without sound system
Figure 7 shows a practical situation with a talker and listeners in a room without sound
reinforcement system.
Figure 5: Room without sound system.
reflectedsound
backgroundnoise
direct sound
Technical Note www.acoustics-engineering.com
TN002 MeasurinTN002 MeasurinTN002 MeasurinTN002 Measuring Speech Intelligibility Using DIRACg Speech Intelligibility Using DIRACg Speech Intelligibility Using DIRACg Speech Intelligibility Using DIRAC
24 April 2014 Copyright 2014 Acoustics Engineering
The listeners receive direct sound from the talker, reflected sound, such as reverberation or
echoes, and background noise, for instance from an HVAC system. The direct sound
contributes positively to the speech intelligibility. Reflected sound may contribute positively
(e.g. via the front board) or negatively to the speech intelligibility. Background noise
contributes negatively to the speech intelligibility.
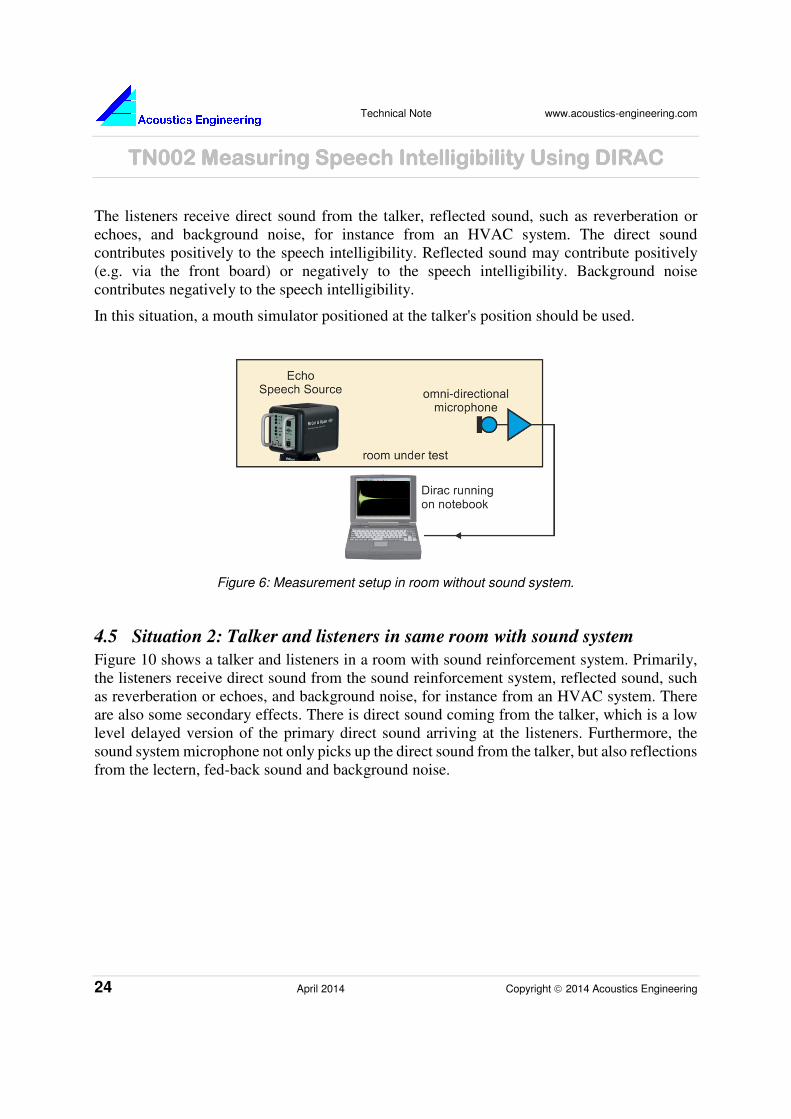
In this situation, a mouth simulator positioned at the talker's position should be used.
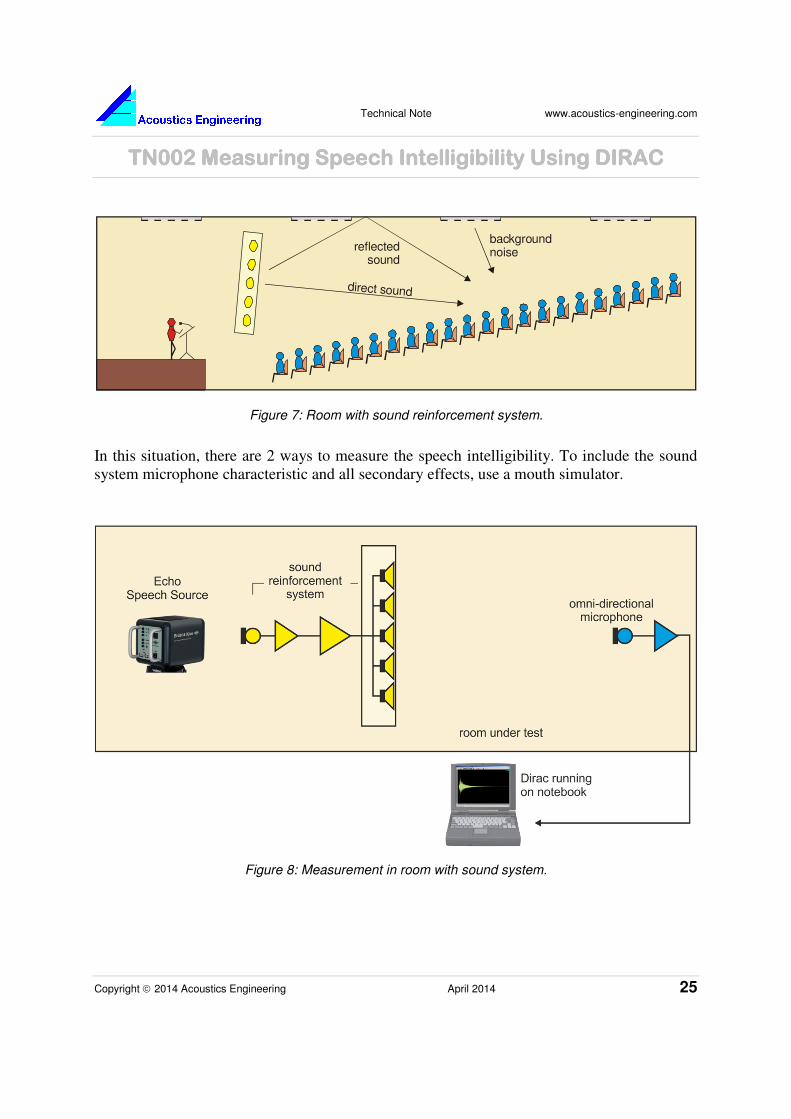
4.5 Situation 2: Talker and listeners in same room with sound system
Figure 10 shows a talker and listeners in a room with sound reinforcement system. Primarily,
the listeners receive direct sound from the sound reinforcement system, reflected sound, such
as reverberation or echoes, and background noise, for instance from an HVAC system. There
are also some secondary effects. There is direct sound coming from the talker, which is a low
level delayed version of the primary direct sound arriving at the listeners. Furthermore, the
sound system microphone not only picks up the direct sound from the talker, but also reflections
from the lectern, fed-back sound and background noise.
Figure 6: Measurement setup in room without sound system.
Technical Note www.acoustics-engineering.com
TN002 Measuring Speech Intelligibility Using DIRACTN002 Measuring Speech Intelligibility Using DIRACTN002 Measuring Speech Intelligibility Using DIRACTN002 Measuring Speech Intelligibility Using DIRAC
Copyright 2014 Acoustics Engineering April 2014 25
In this situation, there are 2 ways to measure the speech intelligibility. To include the sound
system microphone characteristic and all secondary effects, use a mouth simulator.
Figure 7: Room with sound reinforcement system.
direct sound
reflectedsound
backgroundnoise
Figure 8: Measurement in room with sound system.
Technical Note www.acoustics-engineering.com
TN002 MeasurinTN002 MeasurinTN002 MeasurinTN002 Measuring Speech Intelligibility Using DIRACg Speech Intelligibility Using DIRACg Speech Intelligibility Using DIRACg Speech Intelligibility Using DIRAC
26 April 2014 Copyright 2014 Acoustics Engineering
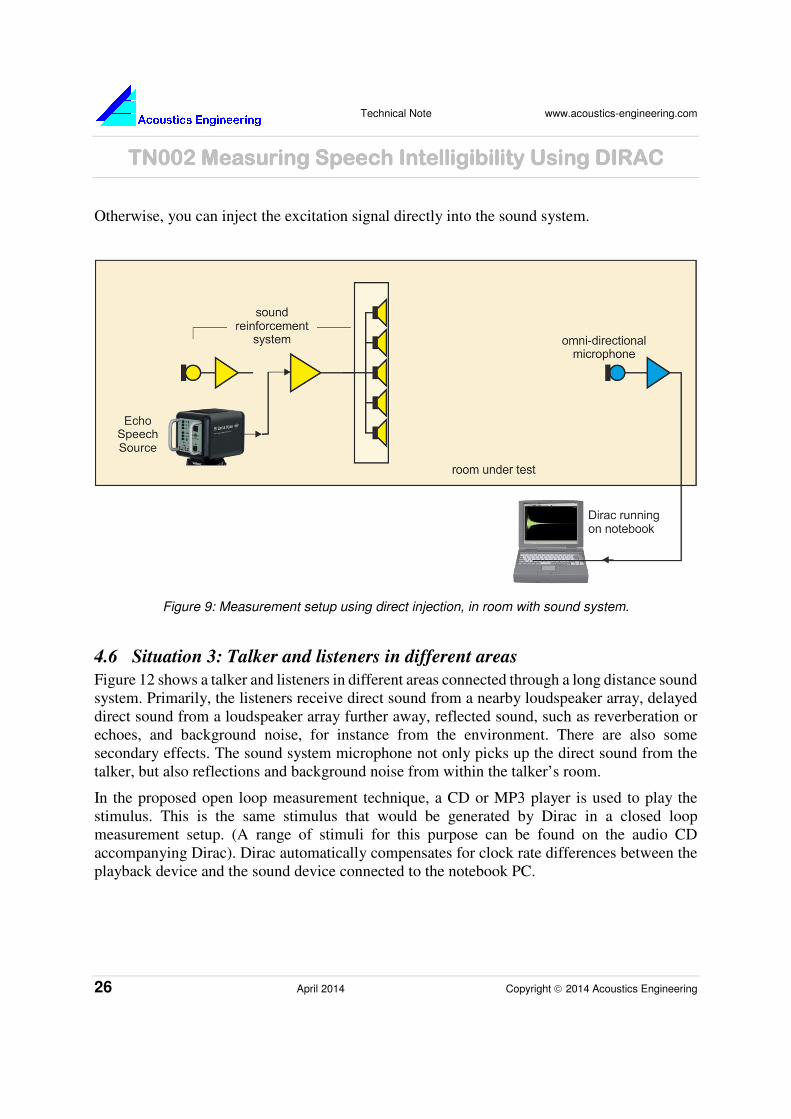
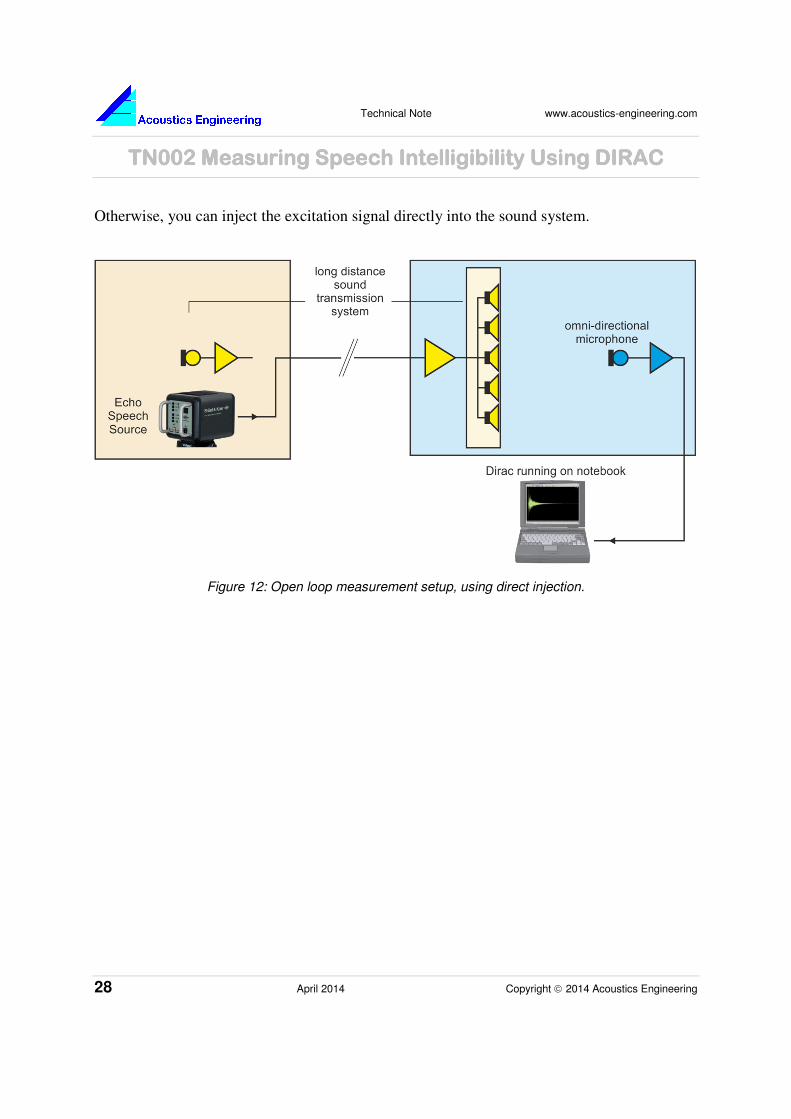
Otherwise, you can inject the excitation signal directly into the sound system.
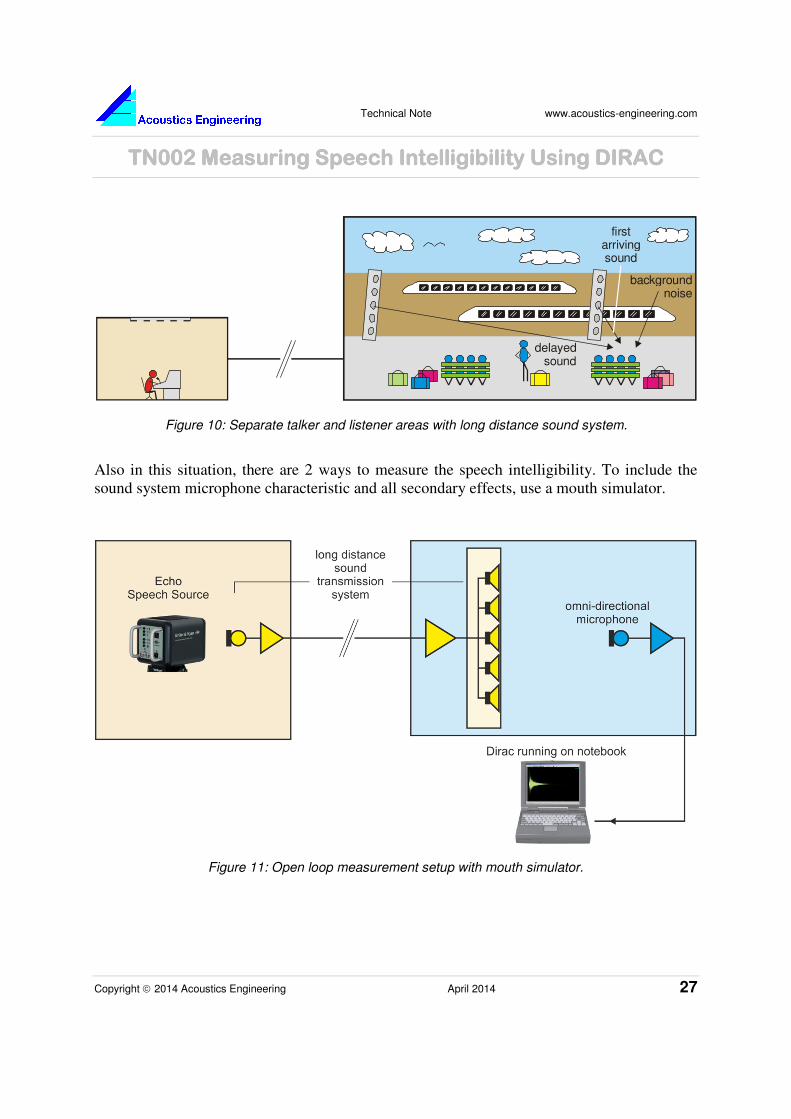
4.6 Situation 3: Talker and listeners in different areas
Figure 12 shows a talker and listeners in different areas connected through a long distance sound
system. Primarily, the listeners receive direct sound from a nearby loudspeaker array, delayed
direct sound from a loudspeaker array further away, reflected sound, such as reverberation or
echoes, and background noise, for instance from the environment. There are also some
secondary effects. The sound system microphone not only picks up the direct sound from the
talker, but also reflections and background noise from within the talker’s room.
In the proposed open loop measurement technique, a CD or MP3 player is used to play the
stimulus. This is the same stimulus that would be generated by Dirac in a closed loop
measurement setup. (A range of stimuli for this purpose can be found on the audio CD
accompanying Dirac). Dirac automatically compensates for clock rate differences between the
playback device and the sound device connected to the notebook PC.
Figure 9: Measurement setup using direct injection, in room with sound system.
Technical Note www.acoustics-engineering.com
TN002 Measuring Speech Intelligibility Using DIRACTN002 Measuring Speech Intelligibility Using DIRACTN002 Measuring Speech Intelligibility Using DIRACTN002 Measuring Speech Intelligibility Using DIRAC
Copyright 2014 Acoustics Engineering April 2014 27
Also in this situation, there are 2 ways to measure the speech intelligibility. To include the
sound system microphone characteristic and all secondary effects, use a mouth simulator.
Figure 10: Separate talker and listener areas with long distance sound system.
backgroundnoise
delayedsound
firstarrivingsound
Figure 11: Open loop measurement setup with mouth simulator.
Technical Note www.acoustics-engineering.com
TN002 MeasurinTN002 MeasurinTN002 MeasurinTN002 Measuring Speech Intelligibility Using DIRACg Speech Intelligibility Using DIRACg Speech Intelligibility Using DIRACg Speech Intelligibility Using DIRAC
28 April 2014 Copyright 2014 Acoustics Engineering
Otherwise, you can inject the excitation signal directly into the sound system.
Figure 12: Open loop measurement setup, using direct injection.
Technical Note www.acoustics-engineering.com
TN002 Measuring Speech Intelligibility Using DIRACTN002 Measuring Speech Intelligibility Using DIRACTN002 Measuring Speech Intelligibility Using DIRACTN002 Measuring Speech Intelligibility Using DIRAC
Copyright 2014 Acoustics Engineering April 2014 29
5 Measurement Analysis
5.1 Impulse response quality
It is important to check the quality of the measured impulse responses after each measurement,
as low quality impulse responses can lead to erroneous results. There are 3 properties of an
impulse response that can be checked easily and will give a good impression of the quality and
usability of the impulse response.
The first thing to check is the Impulse to Noise Ratio (INR). The INR can be interpreted as the
decay range of the impulse response. In general, the INR should be as high as possible. A
minimum of 20 dB is barely acceptable. Values over 40 dB should be obtainable. Note that the
INR can be improved by using higher signal levels, longer capture lengths and/or pre-averaging.
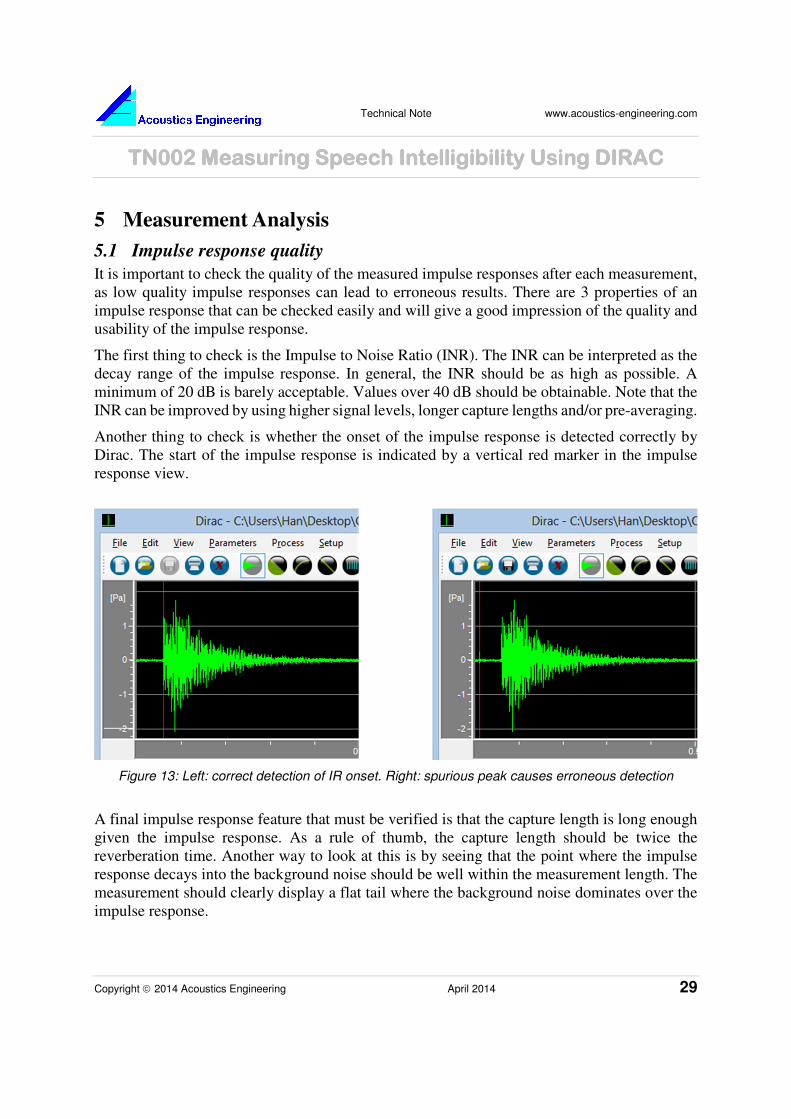
Another thing to check is whether the onset of the impulse response is detected correctly by
Dirac. The start of the impulse response is indicated by a vertical red marker in the impulse
response view.
Figure 13: Left: correct detection of IR onset. Right: spurious peak causes erroneous detection
A final impulse response feature that must be verified is that the capture length is long enough
given the impulse response. As a rule of thumb, the capture length should be twice the
reverberation time. Another way to look at this is by seeing that the point where the impulse
response decays into the background noise should be well within the measurement length. The
measurement should clearly display a flat tail where the background noise dominates over the
impulse response.
Technical Note www.acoustics-engineering.com
TN002 MeasurinTN002 MeasurinTN002 MeasurinTN002 Measuring Speech Intelligibility Using DIRACg Speech Intelligibility Using DIRACg Speech Intelligibility Using DIRACg Speech Intelligibility Using DIRAC
30 April 2014 Copyright 2014 Acoustics Engineering
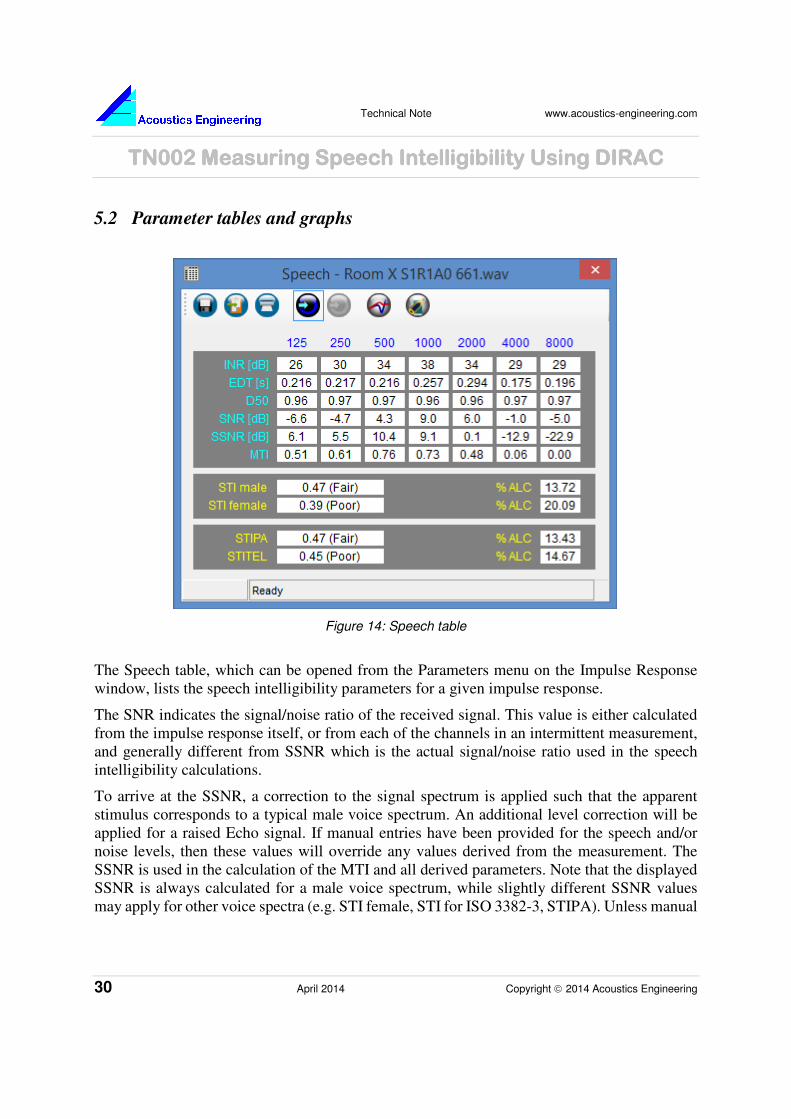
5.2 Parameter tables and graphs
The Speech table, which can be opened from the Parameters menu on the Impulse Response
window, lists the speech intelligibility parameters for a given impulse response.
The SNR indicates the signal/noise ratio of the received signal. This value is either calculated
from the impulse response itself, or from each of the channels in an intermittent measurement,
and generally different from SSNR which is the actual signal/noise ratio used in the speech
intelligibility calculations.
To arrive at the SSNR, a correction to the signal spectrum is applied such that the apparent
stimulus corresponds to a typical male voice spectrum. An additional level correction will be
applied for a raised Echo signal. If manual entries have been provided for the speech and/or
noise levels, then these values will override any values derived from the measurement. The
SSNR is used in the calculation of the MTI and all derived parameters. Note that the displayed
SSNR is always calculated for a male voice spectrum, while slightly different SSNR values
may apply for other voice spectra (e.g. STI female, STI for ISO 3382-3, STIPA). Unless manual
Figure 14: Speech table
Technical Note www.acoustics-engineering.com
TN002 Measuring Speech Intelligibility Using DIRACTN002 Measuring Speech Intelligibility Using DIRACTN002 Measuring Speech Intelligibility Using DIRACTN002 Measuring Speech Intelligibility Using DIRAC
Copyright 2014 Acoustics Engineering April 2014 31
speech and noise levels have been provided, the SSNR is only valid for level calibrated
measurements.
From the speech table you can quickly access the file properties using the Properties button
where you can modify the signal and noise levels (see section 5.3).
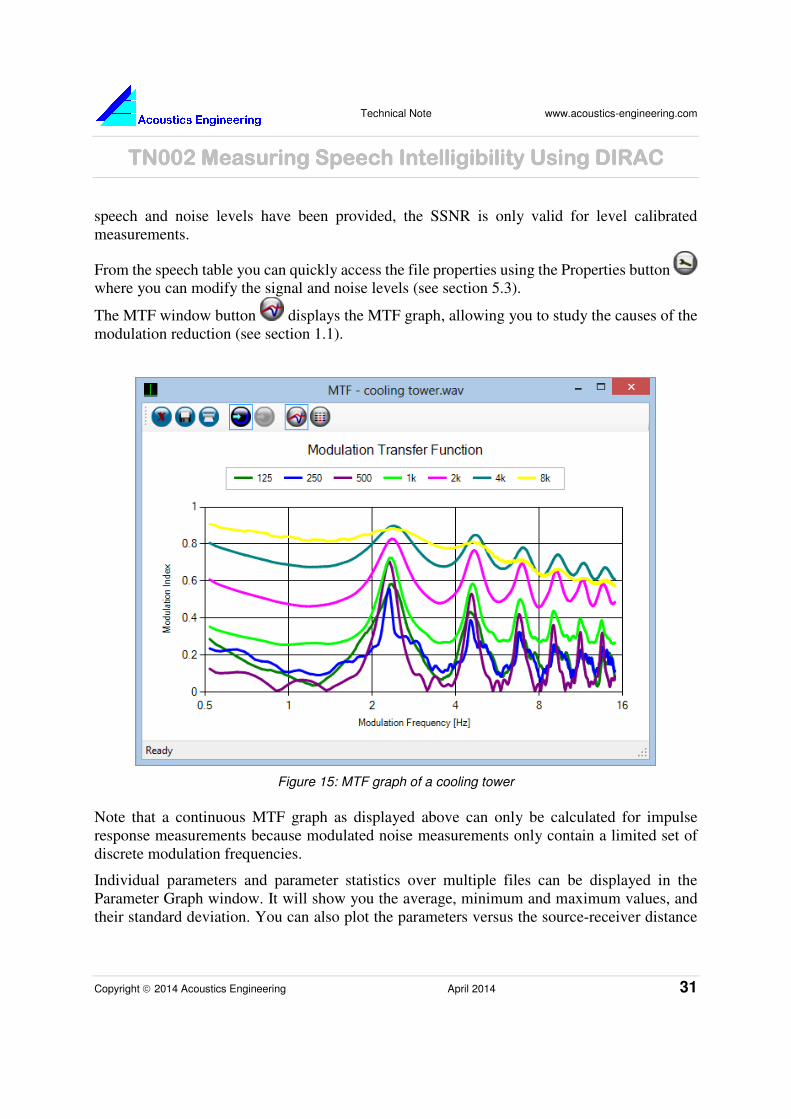
The MTF window button displays the MTF graph, allowing you to study the causes of the
modulation reduction (see section 1.1).
Figure 15: MTF graph of a cooling tower
Note that a continuous MTF graph as displayed above can only be calculated for impulse
response measurements because modulated noise measurements only contain a limited set of
discrete modulation frequencies.
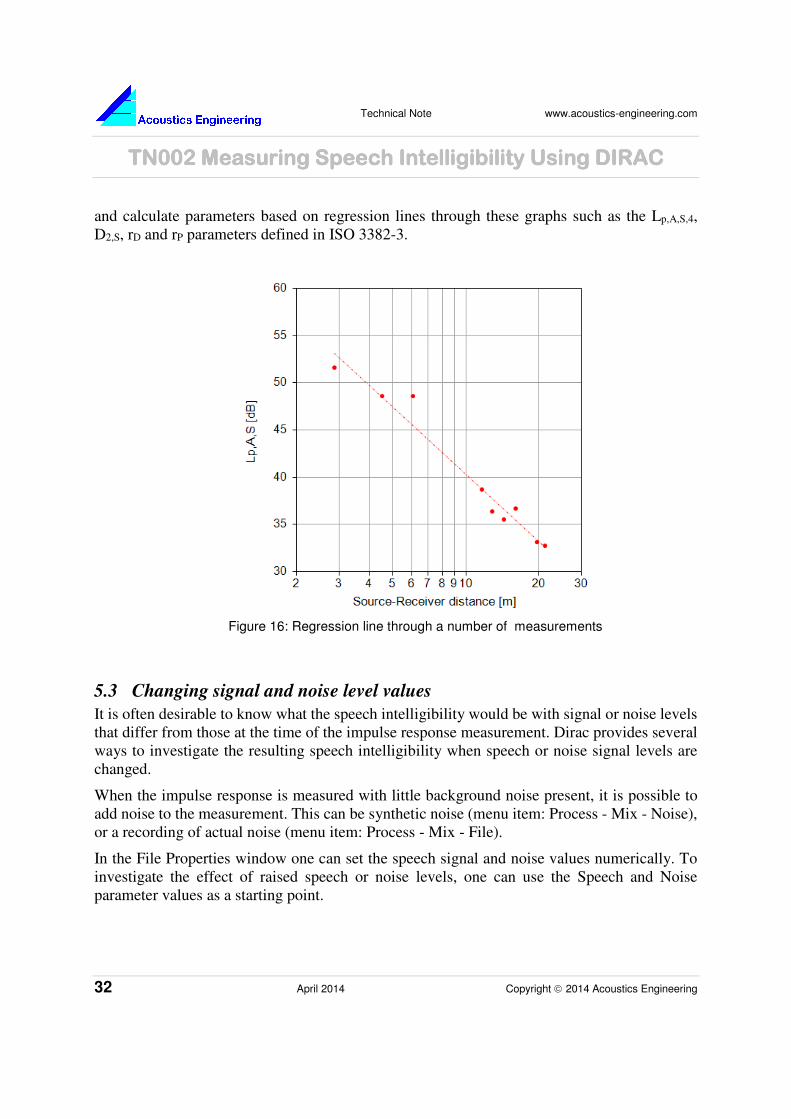
Individual parameters and parameter statistics over multiple files can be displayed in the
Parameter Graph window. It will show you the average, minimum and maximum values, and
their standard deviation. You can also plot the parameters versus the source-receiver distance
Technical Note www.acoustics-engineering.com
TN002 MeasurinTN002 MeasurinTN002 MeasurinTN002 Measuring Speech Intelligibility Using DIRACg Speech Intelligibility Using DIRACg Speech Intelligibility Using DIRACg Speech Intelligibility Using DIRAC
32 April 2014 Copyright 2014 Acoustics Engineering
and calculate parameters based on regression lines through these graphs such as the Lp,A,S,4,
D2,S, rD and rP parameters defined in ISO 3382-3.
5.3 Changing signal and noise level values
It is often desirable to know what the speech intelligibility would be with signal or noise levels
that differ from those at the time of the impulse response measurement. Dirac provides several
ways to investigate the resulting speech intelligibility when speech or noise signal levels are
changed.
When the impulse response is measured with little background noise present, it is possible to
add noise to the measurement. This can be synthetic noise (menu item: Process - Mix - Noise),
or a recording of actual noise (menu item: Process - Mix - File).
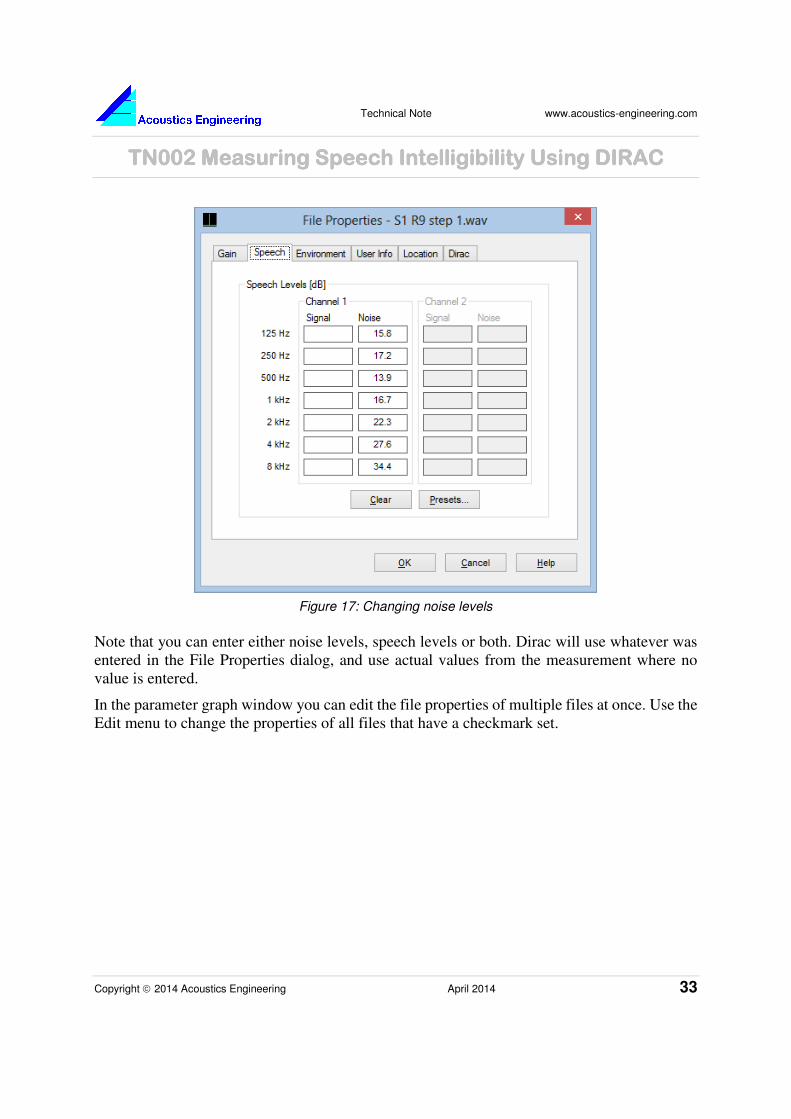
In the File Properties window one can set the speech signal and noise values numerically. To
investigate the effect of raised speech or noise levels, one can use the Speech and Noise
parameter values as a starting point.
Figure 16: Regression line through a number of measurements
Technical Note www.acoustics-engineering.com
TN002 Measuring Speech Intelligibility Using DIRACTN002 Measuring Speech Intelligibility Using DIRACTN002 Measuring Speech Intelligibility Using DIRACTN002 Measuring Speech Intelligibility Using DIRAC
Copyright 2014 Acoustics Engineering April 2014 33
Note that you can enter either noise levels, speech levels or both. Dirac will use whatever was
entered in the File Properties dialog, and use actual values from the measurement where no
value is entered.
In the parameter graph window you can edit the file properties of multiple files at once. Use the
Edit menu to change the properties of all files that have a checkmark set.
Figure 17: Changing noise levels
Technical Note www.acoustics-engineering.com
TN002 MeasurinTN002 MeasurinTN002 MeasurinTN002 Measuring Speech Intelligibility Using DIRACg Speech Intelligibility Using DIRACg Speech Intelligibility Using DIRACg Speech Intelligibility Using DIRAC
34 April 2014 Copyright 2014 Acoustics Engineering
6 Appendix: The impact of the SNR on speech intelligibility If the background noise level is negligible, there is no need to measure the SNR and incorporate
it in the speech intelligibility calculations. Therefore it may be worthwhile to take a closer look
at the impact of the SNR on the speech intelligibility in practical situations, and formulate the
exact condition under which the SNR is relevant.
The background noise is assumed to be negligible if its presence results in a STI decrease of
less than 5% of the STI without background noise. To figure out what the consequence is for
the allowed SNR, we write the MTF as a product of 2 modulation reduction factors, m0(k,F)
due to system properties (reverberation, echoes) and mSNR(k,F) due to background noise:
10
)(
0
0
101
),()(),(),(
kSNRSNR
FkmkmFkmFkMTF
−
+
=⋅= (1)
where k is the octave number. By definition, the so-called effective SNR, SNReff(k,F) relates to
MTF(k,F) as does the SNR to mSNR:
−=
),(1
),(log10),(
FkMTF
FkMTFFkSNReff
Hence, SNReff equals SNR if the modulation is reduced by background noise only. For each k
from a set of octave frequency bands, and each F from a set of modulation frequencies,
SNReff(k,F) is calculated, and clipped to ±15 dB, before being further processed to calculate the
STI. The clipping operation reflects that SNReff values exceeding 15 dB cannot have any
negative impact on the speech intelligibility, while SNReff values lower than –15 dB cannot
have any positive impact on the speech intelligibility. The clipped SNReff values are converted
to transmission indices TI(k,F) that range from 0 to 1, and each contribute to the STI.
30
15),(),(
+=
FkSNRFkTI
For the final STI, the TI values are averaged over the modulation and octave band frequencies
in a special way, thereby taking into account auditory masking and the absolute hearing
threshold. However, to get an idea of the impact of the SNR on the STI, it is sufficient to
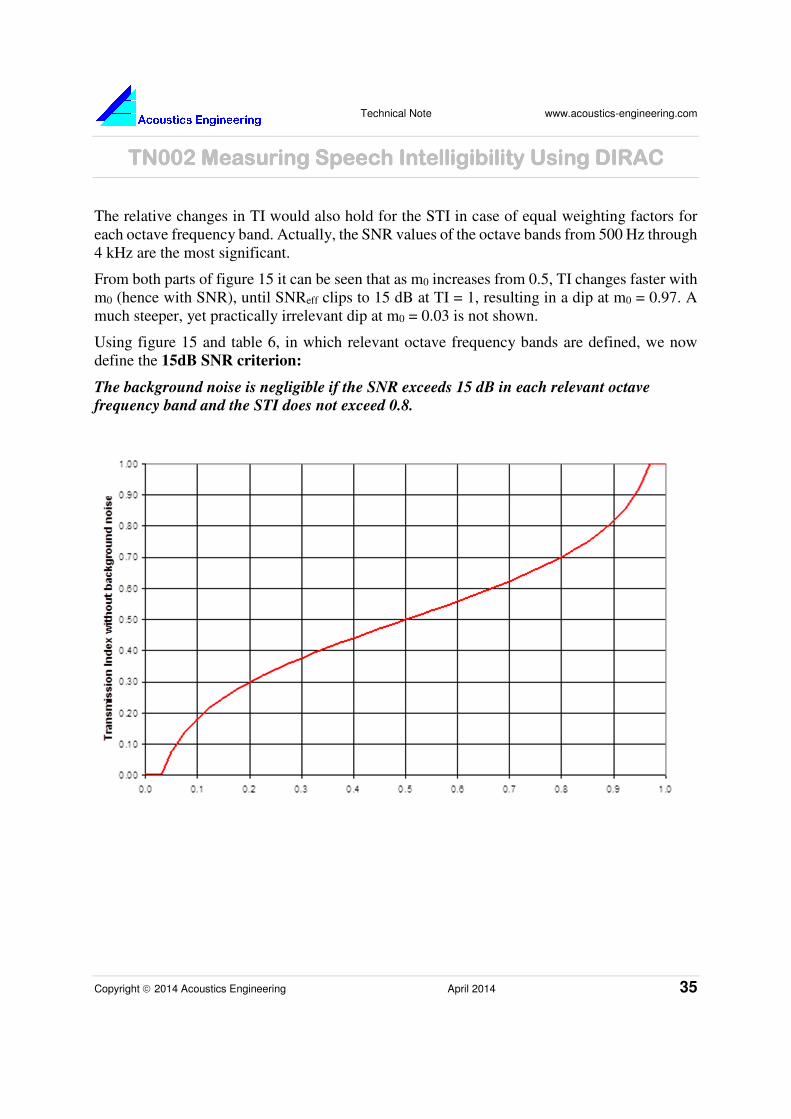
evaluate TI for several values of m0 and SNR. Figure 15 shows the relative change of TI when
going from a situation with SNR = ∞ to a situation with the given finite SNR:
%100⋅−
=∆
∞
∞
TI
TITITI SNR
Technical Note www.acoustics-engineering.com
TN002 Measuring Speech Intelligibility Using DIRACTN002 Measuring Speech Intelligibility Using DIRACTN002 Measuring Speech Intelligibility Using DIRACTN002 Measuring Speech Intelligibility Using DIRAC
Copyright 2014 Acoustics Engineering April 2014 35
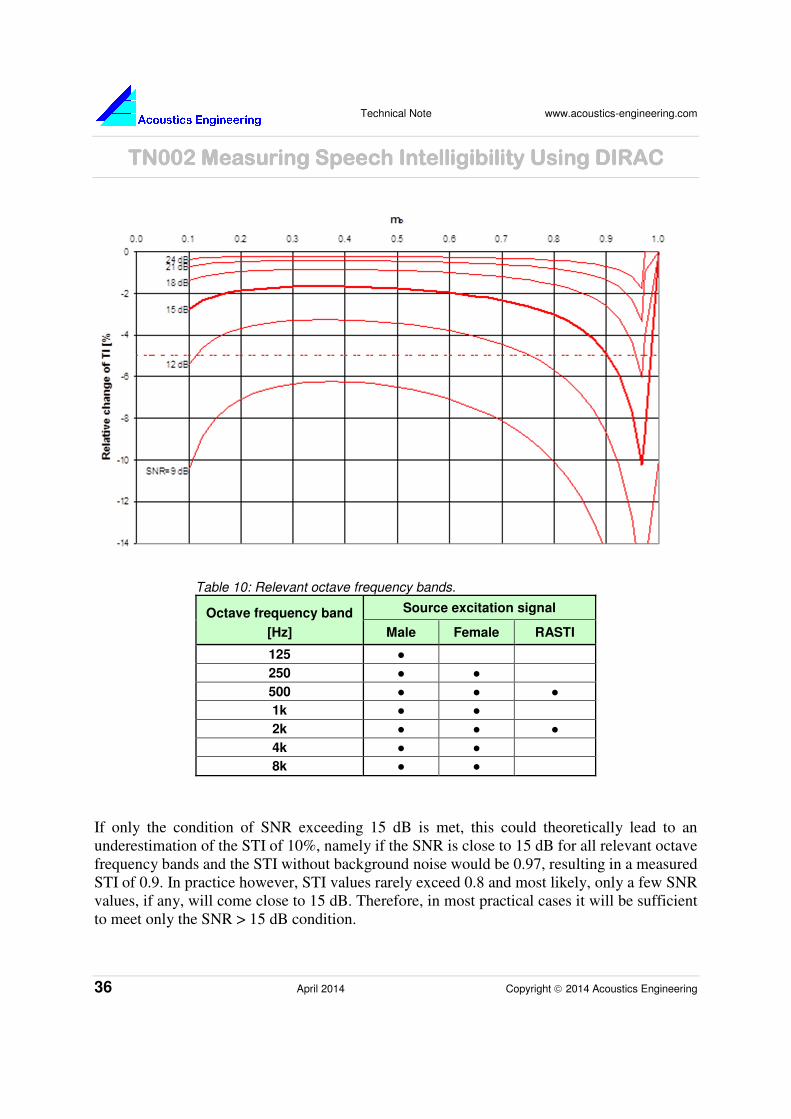
The relative changes in TI would also hold for the STI in case of equal weighting factors for
each octave frequency band. Actually, the SNR values of the octave bands from 500 Hz through
4 kHz are the most significant.
From both parts of figure 15 it can be seen that as m0 increases from 0.5, TI changes faster with
m0 (hence with SNR), until SNReff clips to 15 dB at TI = 1, resulting in a dip at m0 = 0.97. A
much steeper, yet practically irrelevant dip at m0 = 0.03 is not shown.
Using figure 15 and table 6, in which relevant octave frequency bands are defined, we now
define the 15dB SNR criterion:
The background noise is negligible if the SNR exceeds 15 dB in each relevant octave
frequency band and the STI does not exceed 0.8.
Technical Note www.acoustics-engineering.com
TN002 MeasurinTN002 MeasurinTN002 MeasurinTN002 Measuring Speech Intelligibility Using DIRACg Speech Intelligibility Using DIRACg Speech Intelligibility Using DIRACg Speech Intelligibility Using DIRAC
36 April 2014 Copyright 2014 Acoustics Engineering
Table 10: Relevant octave frequency bands.
Octave frequency band
[Hz]
Source excitation signal
Male Female RASTI
125 ●
250 ● ●
500 ● ● ●
1k ● ●
2k ● ● ●
4k ● ●
8k ● ●
If only the condition of SNR exceeding 15 dB is met, this could theoretically lead to an
underestimation of the STI of 10%, namely if the SNR is close to 15 dB for all relevant octave
frequency bands and the STI without background noise would be 0.97, resulting in a measured
STI of 0.9. In practice however, STI values rarely exceed 0.8 and most likely, only a few SNR
values, if any, will come close to 15 dB. Therefore, in most practical cases it will be sufficient
to meet only the SNR > 15 dB condition.
Technical Note www.acoustics-engineering.com
TN002 Measuring Speech Intelligibility Using DIRACTN002 Measuring Speech Intelligibility Using DIRACTN002 Measuring Speech Intelligibility Using DIRACTN002 Measuring Speech Intelligibility Using DIRAC
Copyright 2014 Acoustics Engineering April 2014 37
7 References [1] T. Houtgast, H.J.M. Steeneken and R. Plomp, “Predicting Speech Intelligibility in Rooms from
the Modulation Transfer Function. I. General Room Acoustics,” Acustica 46, 60 – 72 (1980).
[2] IEC 60268-16 Edition 4.0 (2011) Sound system equipment. Part 16: Objective rating of speech intelligibility by speech transmission index.
[3] M.R. Schroeder, “Modulation Transfer Functions: Definition and Measurement,” Acustica 49, 179 – 182 (1981).
[4] D.D. Rife, “Modulation Transfer Function Measurement with Maximum-Length Sequences”, J. Audio Eng. Soc. 40, 779 – 790 (1992).
[5] ITU-T Recommendation P.51 (03/93), Telephone Transmission Quality Objective Measuring Apparatus - Artificial Mouth
[6] T. Houtgast, H.J.M. Steeneken et al., “Past, present and future of the Speech Transmission Index”, TNO Human Factors, Soesterberg, The Netherlands, © 2002, ISBN 90-76702-02-0.
[7] C.C.J.M. Hak and J.P.M. Hak, Effect of Stimulus Speed Error on Measured Room Acoustic Parameters, Proceedings ICA 2007.
[8] C.C.J.M. Hak and J.S. Vertegaal, MP3 Stimuli in Room Acoustics, Proceedings ICA 2007.
[9] A New DIRAC, Measuring Speech Intelligibility. Brüel & Kjær Magazine No. 1, 2008, p26-27.
[10] ISO 3382 (2012) Acoustics – Measurement of room acoustics parameters – Part 3: Open plan offices.
[11] http://www.synaudcon.com/site/articles/a-do-it-yourselfers-guide-to-computing-the-speech-transmission-index/
[12] A. Farina – “Simultaneous measurement of impulse response and distortion with a swept-sine technique”, 110th AES Convention, February 2000.
[13] “Guidance on computer prediction models to calculate the speech transmission index for BB93.” Version 1.0. Department for Education and Skills, Schools Capital and Building Division, 2004.
Acoustics EngineeringAcoustics EngineeringAcoustics EngineeringAcoustics Engineering develops systems for the prediction and measurement of
acoustical parameters, resulting in user-friendly tools that enable you to perform fast and
accurate acoustical measurements and calculations.
For information on our products, please contact
Acoustics Engineering Email: [email protected] Website: www.acoustics-engineering.com Phone: +31 485 520996 Address: Acoustics Engineering
Groenling 43-45 5831 MZ Boxmeer The Netherlands
Brüel & Kjær is the sole worldwide distributor of DIRAC. For information on DIRAC, please
contact your local B&K representative or the B&K headquarters in Denmark:
Brüel & Kjær Email: [email protected] Website: www.bksv.com
Phone: +45 45 80 05 00 Fax: +45 45 80 14 05
Address: Brüel & Kjær A/S
Skodsborgvej 307 DK-2850 Nærum Denmark
Copyright © Acoustics Engineering 2014 All rights reserved. No part of this document may be reproduced or transmitted in any form or by any means, electronic or mechanical, without the prior written permission of Acoustics Engineering.