measuring success:data analytics and the enrollment services technology group
TRANSCRIPT


Measuring Success:
Data Analytics and the Enrollment Services Technology Group
Melissa HutsonGus Monzon
July 27, 2015

Enrollment Services Technology Group
Inbound/Outbound Contact Center
Support
Application Development
Business Intelligence, Analytics, and
Strategic Planning
Process Automation
Student Data Expertise

The University of Texas at El Paso

Listening to the Student Voice
A case study of the Office for Student Financial Aid (OSFA)

For the period between Oct. 2012 – Sep. 2013, 111,450 calls were made to the Office of Student Financial Aid.
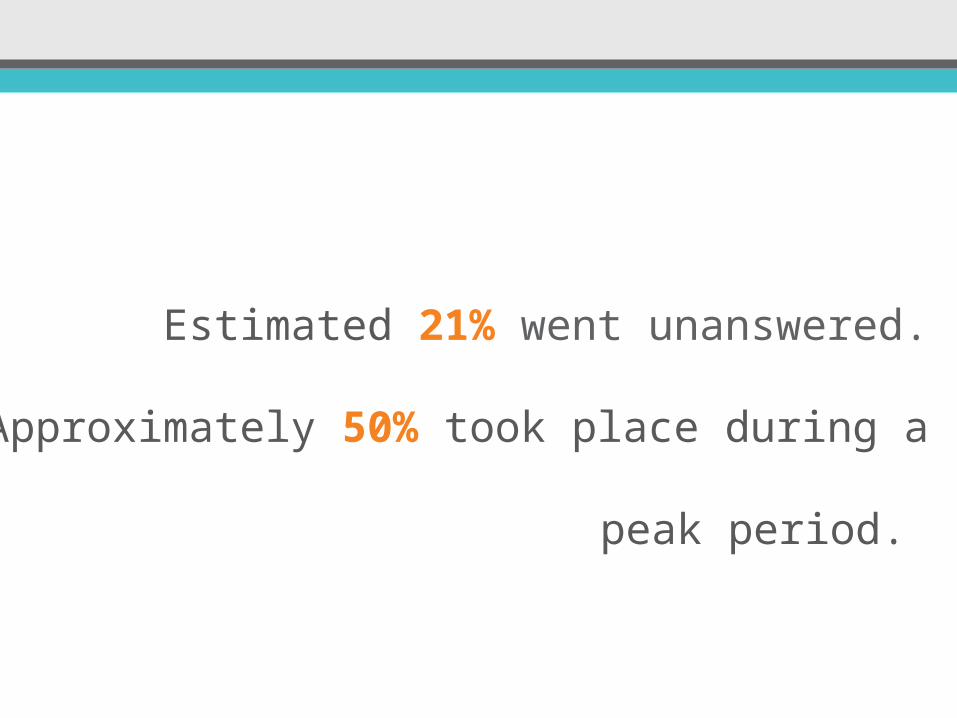
Estimated 21% went unanswered.
Approximately 50% took place during a peak period.

OSFA Call Volume – October 2012 to October 2013
Peak PeriodPeak Period

For a similar period, 16,850 walk-in visits were logged.

Financial Aid Customer Service Survey
“…calling into the FA office is always a problem.”
-Frustrated Student

Inspiration

Telecenter as a Touch Point
• Complete, FAFSA No Admissions Application
• Incomplete, FAFSANo Admissions Application
Unique Count in Target Group = 2,007
Yield = 21 (1%)
FAFSA, No Admissions Application
• Applied, Not Admitted• Admitted, Not Signed Up for
Orientation• Signed Up for Orientation, Did
Not Attend• Attended Orientation, Did Not
Enroll
Unique Count in Target Group =
8,046
Yield = 449 (5.6%)
Freshman, Not Enrolled
• Applied, Not Admitted• Admitted, Not Signed Up for
Orientation• Signed Up for Orientation, Did
Not Attend• Attended Orientation, Did Not
Enroll
Unique Count in Target Group =
1,736
Yield = 329 (19.0%)
Transfer, Not Enrolled
By Target Pop. – Summer 2013 Campaign

UTEP Strategic Plan

Overarching Goals
Use the CRM to re-establish mutual
goals:
Increase success in new student
enrollment
First-year retention
Persistence
Completion

Evaluating Departmental Goals
Targeted use of constituent relationship
management
systems
Promote use of self-service systems
Improve OSFA web experience
Establish Contact Center inbound call
services

OSFA Customer Service Pre-Evaluation

Major Triggers of Service Demand
Pendin
g Req
uirem
ents
Summ
er A
id
Refun
d
Financ
ial A
id Awar
d Sta
tus
Financ
ial A
id App
licat
ion S
tatu
s
Appea
l Pro
cess
Satisf
acto
ry A
cade
mic
Progr
ess
Emer
genc
y Lo
an
Call T
rans
ferre
dHold
Credit
Hou
rs
Stude
nt L
oan
Conso
rtium
Agr
eem
ent
Disbur
sem
ent
Accep
t Awar
ds
Balanc
e Due
Paym
ent P
lan
UTEP Pro
mise
Wor
k Stu
dy0.00%
2.00%
4.00%
6.00%
8.00%
10.00%
12.00%
14.00%
16.00%
Triggers Contributing to Peak Period Service Demand

Sub-Analysis of Pending Requirements
Inco
me
Verific
atio
n Fo
rm
IRS T
rans
crip
t
Gener
al
Term
s And
Con
ditio
ns
Loan
Adj
ustm
ent F
orm
Electr
onic
Corre
ction
s
Mas
ter P
rom
isary
Not
e/ E
ntra
nce
Couns
elin
g
KEYS Ses
sion
FAFS
A Cor
recti
ons
TEXAS G
rant
Inco
me
Adjus
tmen
t For
m0.00%
5.00%
10.00%
15.00%
20.00%
25.00%
Pending Requirements (13.95%)
Verific
atio
n
Aid S
tatu
s
Stude
nt L
oan
Inqu
iry
Satisf
acto
ry A
cade
mic
Progr
ess
Summ
er A
id
Pendi
ng Ite
ms
Fina
ncia
l Aid
App
licat
ion
Inqu
iry
Award
Statu
s
Balan
ce D
ue
Conso
rtium
Agr
eem
ent
Loan
Am
ount
Req
uest
Form
0
5000
10000
15000
20000
25000
30000
0%
10%
20%
30%
40%
50%
60%
70%
80%
90%
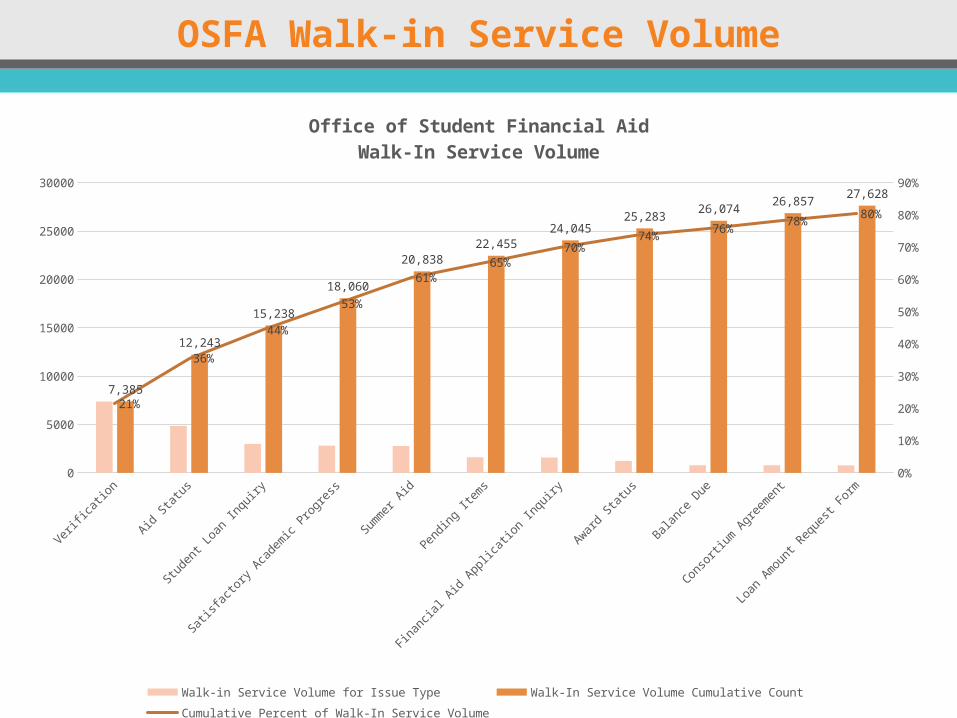
7,385
12,243
15,238
18,060
20,838
22,455
24,04525,283
26,07426,857
27,628
21%
36%
44%
53%
61%
65%
70%74%
76%78%
80%
Office of Student Financial AidWalk-In Service Volume
Walk-in Service Volume for Issue Type Walk-In Service Volume Cumulative Count Cumulative Percent of Walk-In Service Volume
OSFA Walk-in Service Volume

Areas of Analysis: E-mail Inquiries
Pendi
ng
Sta
tus
Acc
ount
Issu
es
Disb
urse
men
t
Elig
ibilit
y
Pro
cess
Ref
und
Am
ount
Awar
ded
Sum
mer
Aid
Awar
d Le
tter
Other
Dep
artm
ent
0
500
1000
1500
2000
2500
3000
3500
4000
4500
5000
0%
10%
20%
30%
40%
50%
60%
70%
80%
90%
1,410
2,094
2,724
3,190
3,558
3,7743,917
4,0574,187
4,2994,404
26%
38%
49%
58%
65%
69%71%
74%76%
78%80%
E-mail Inquiry Volume for Issue Type E-mail Inquiry Volume Cumulative Count Cumulative Percent of Walk-In Service Volume
OSFA E-mail Inquiry Volume
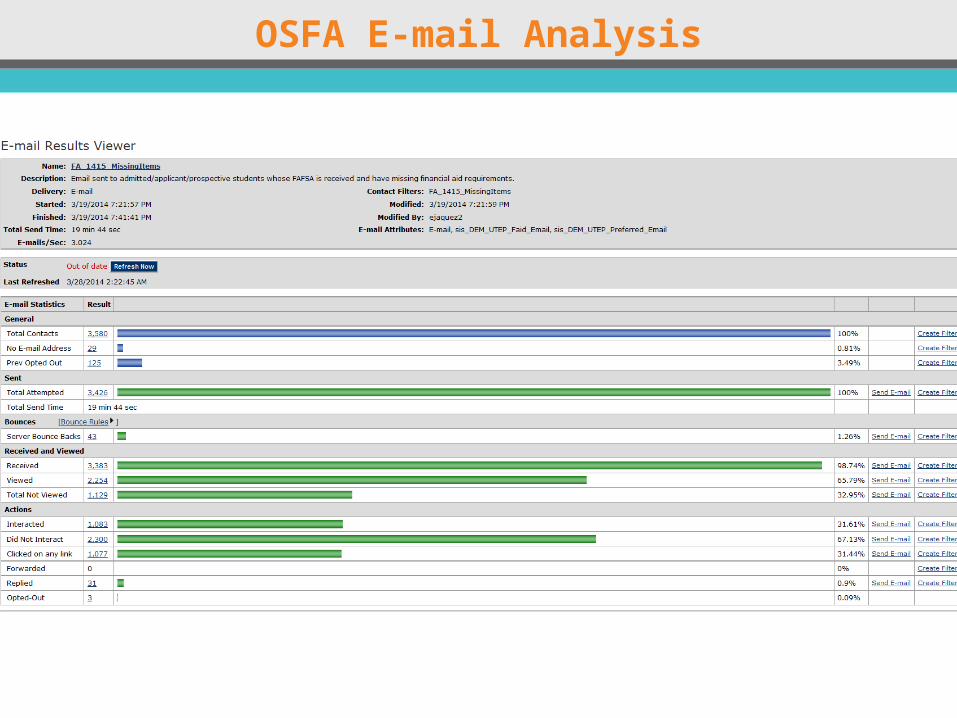
OSFA E-mail Analysis

Financial Aid Process Evaluation

Financial Aid Process Evaluation

Planning

Strategy
Manage peaks in service demands
Leveraging outreach capacity with
multi-channel communication
Break down departmental silos

Managing Peak Service Demand
Peak PeriodPeak Period

Leveraging Outreach Capacity with Multi-Channel Communication
Multi-Channel Communication ESTG Contact
Center
Knowledge Base
Student Portals
Inbound/Outbound
Calls
Walk-in Service
Phone Blasts
WebsiteSurvey

Break Down Departmental Silos
CRM
ContactCenter
SBS OSFA

Implementation

Implementation Plan
CRM Revitalization
Develop/redesign enrollment applications
Contact Center
Demonstrate impact of data driven
decision making
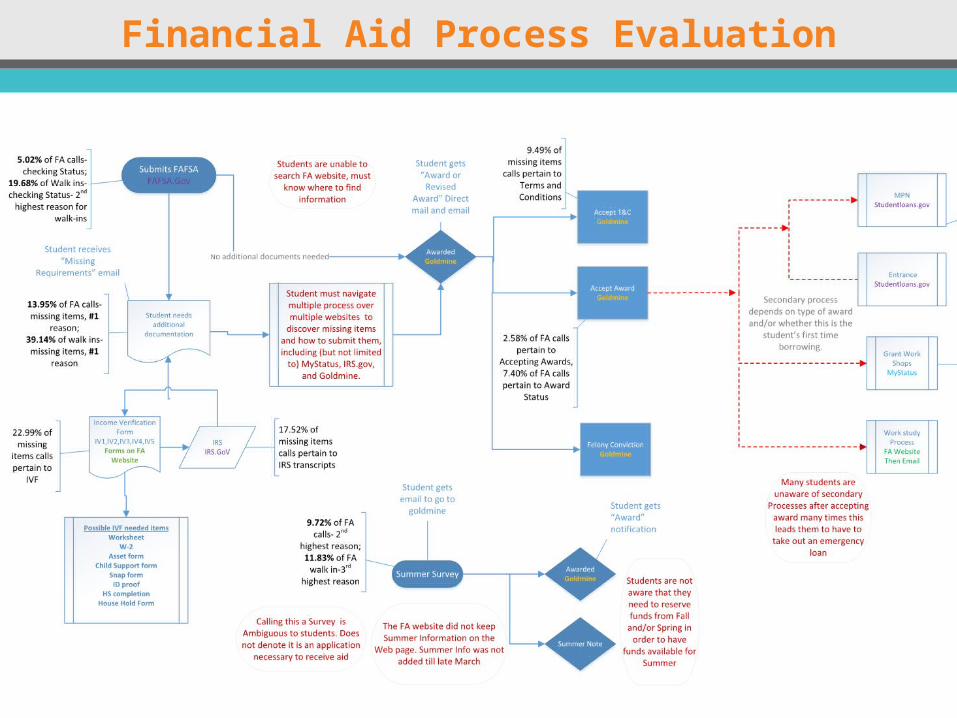
Financial Aid Process Evaluation

CRM Revitalization
Communication Mapping
Communication Analysis
Communication Planning
Organizing and Archiving
Departmental CRM Use and Training

CRM Revitalization
CRMSIS
Pearson
ApplyTexas Qualtrics
Student Search
Contact Center App


Contact Center
Contact Center Representatives
Subject matter
experts
Sharepoint
Knowledge Base
Accurately collecting
and recording data
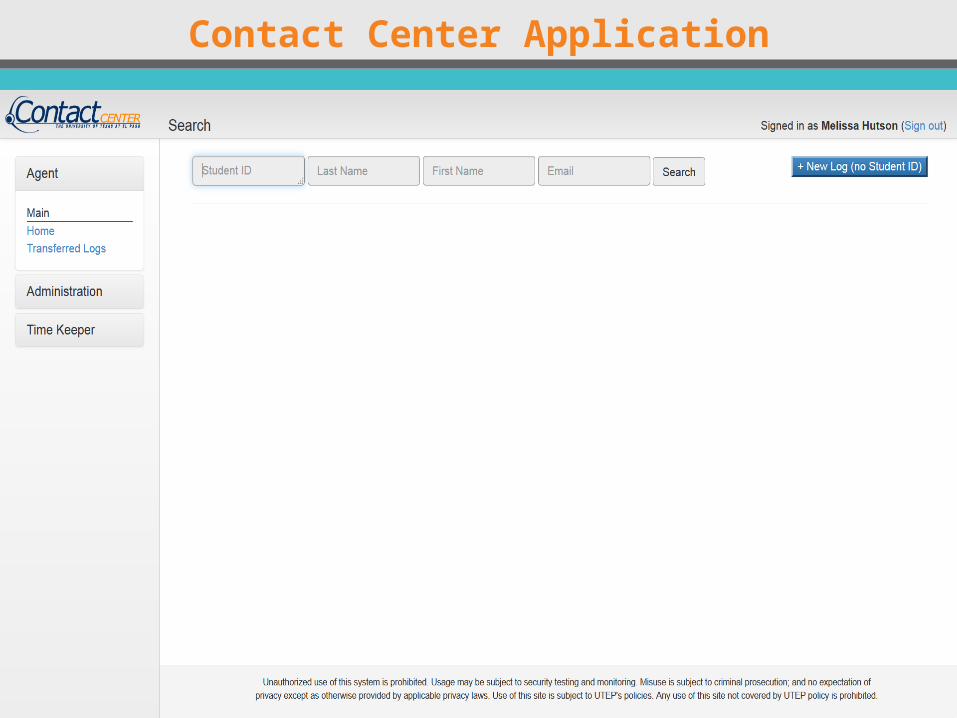
Contact Center Application

Contact Center Application

Contact Center Application

Contact Center Application
OSFA Customer Service Post-Evaluation

Reevaluation of OSFA Communication

Reevaluation of OSFA Communication
Contact Center Monthly Report: August 2014
Contact Center Customer Inquiries Contact Center Efficiency Contributions
Total Inbound Calls 19,159 Total Contact Hours 1,267
Level 1 Resolved 13,655Overall Average Daily Capacity Gain (Hrs)
57.6
Level 1 Call Resolution Rate 71%
Before CRM Revitalization Average Call Hold Times >30 minutes (Peak Period)
After CRM RevitalizationAverage Peak Period Call Hold Times ~ 1.5 minutes (Peak Period)W/ Average Call Duration ~ 4 minutes (Peak Period)

Summary of Outcomes
Requires communication, coordination, and
collaboration among all stakeholders (across
departments/divisions)
Makes use of multi-channel customer
communication
Effective customer service strategy

Summary of Outcomes
Current Prospective Ind. Avg.0%
10%
20%
30%
40%
50%
60%
70%
80%
90%85%
69%
23%
27% 28%
3%
OSFA Email View and Interaction Rates
View Rates Interaction Rates
CRM E-mail Reliable Mode of Communication

Summary of Outcomes
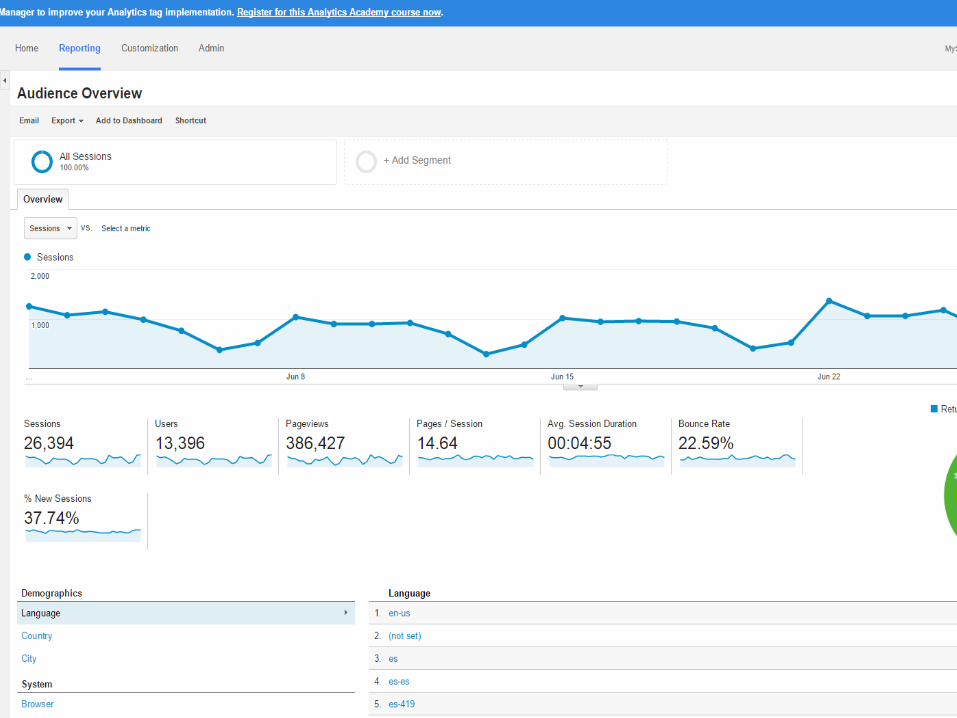
Web Services
MyStatus provides timely, relevant, targeted, and
actionable information
Supports student decisions through significant
stages of the student lifecycle
Platform has become an integral part of the multi-
channel communication strategy, supporting
Undergraduate and Graduate student populations

Summary of Outcomes
Efficiency Contributions
Contact Center operations has provided increased human
resource capacity (data below represent June 2014
results)
392 Hours – Total Contact Hours handled by the Contact
Center
17.8 Hours – Average Daily Capacity Gain (slightly more
than two FTEs contributed to OSFA operations)
New Developments

HUGS
Academic Colleges
Business Administration
Liberal Arts
Hobsons CRM Stakeholders

Break Down of Departmental Silos
CRM
ContactCenter
SBS OSFA
CommunicationCollaborationCoordination
Integrated Approach to Student Outreach
Unified Message toConstituents

MPN Threshold 7/24/15
Disbursement 8/14/15
Refund Processing Begins8/17/15 Census Day 9/9/15
RNP campaign
launch
Fall 2015 OSFA Communication Planning

Contact Center Information Dashboard

Contact Center Information Dashboard

Inspiration

Planning Future Communications
ESTG process centers on customer service and
satisfaction
At the heart of this process is the CRM, helping us to:
enhance departmental relationships
bridge broken processes
assess the strategic gap
facilitate the delivery of relevant, timely, targeted,
and actionable information

Summary
Operational Efficiency &
Effectiveness
Analytics
Communication Plan
Execution
Enhanced Customer
ExperienceCRM

Questions?