measuring surface offsets from high-resolution digital topography · measuring earthquake-generated...
TRANSCRIPT
Measuring earthquake-generated surface offsets from high-resolution digital topography
July 19, 2011
David E. Haddad [email protected]
Active Tectonics, Quantitative Structural Geology, and Geomorphology
Arizona State University http://activetectonics.asu.edu
Table of Contents INTRODUCTION .......................................................................................................................... 2 COMPUTING CONSIDERATIONS ............................................................................................. 2 WORKFLOW OVERVIEW........................................................................................................... 2 DETAILED WORKFLOW ............................................................................................................ 4
Step 1: Generate a DEM in OpenTopography............................................................................ 4 Step 2: Download the DEM from OpenTopography.................................................................. 7 Step 3: DEM visualization .......................................................................................................... 7 Step 4: Map fault traces .............................................................................................................. 8 Step 5: Mark offset locations ...................................................................................................... 9 Step 6: Calculate lateral offsets................................................................................................... 9
Step 6a: Download the software ............................................................................................. 9 Step 6b: Prepare the DEM using LiDARimager................................................................... 10 Step 6c: Calculate lateral offsets using LaDiCaoz................................................................ 11
REFERENCES CITED................................................................................................................. 11
Page 1 of 11
INTRODUCTION
High-resolution digital topographic data products such as LiDAR-derived digital elevation models (DEMs) provide unprecedented insights into the geomorphic response of earthquake-induced surface deformation. By measuring m-scale offsets of geologic and geomorphic markers, we can understand the surface slip history associated with recent earthquake ruptures, their spatiotemporal distributions, magnitudes, and recurrences. Surface offsets also facilitate physical constraints for surface slip distributions, thus providing physical guides to earthquake forecast models such as the Working Group on California Earthquake Probabilities’ (WGCEP) Uniform California Earthquake Rupture Forecasts (UCERF; http://www.wgcep.org/goals).
The goal of this document is to provide an overview of the workflow involved in calculating surface slip offsets using LiDAR-derived DEMs. The workflow is comprised of modules that use different software suites, and so it is not intended to replace the already comprehensive documentation available for each software suite. Where appropriate, we provide information on how to access the documentation that typically accompanies each software.
COMPUTING CONSIDERATIONS
The workflow presented herein requires the following computing considerations and software:
1. High-speed Internet access and a Web browser. 2. Access to the ArcGIS suite (ArcMap, ArcToolbox, and ArcCatalog), or alternatively... 3. ...access to the paid version of Global Mapper. 4. MATLAB numerical computing environment. 5. LaDiCaoz lateral displacement calculator and LiDARimager from Zielke et al. (2010). 6. Access to a spreadsheet software (e.g., MS Excel). 7. Google Earth (optional).
WORKFLOW OVERVIEW
The following is a brief overview of the workflow that goes through the steps of generating DEMs and computing surface offsets. Each screenshot is representative of the software/website application. A more detailed graphical workflow is presented in the following section of this document.
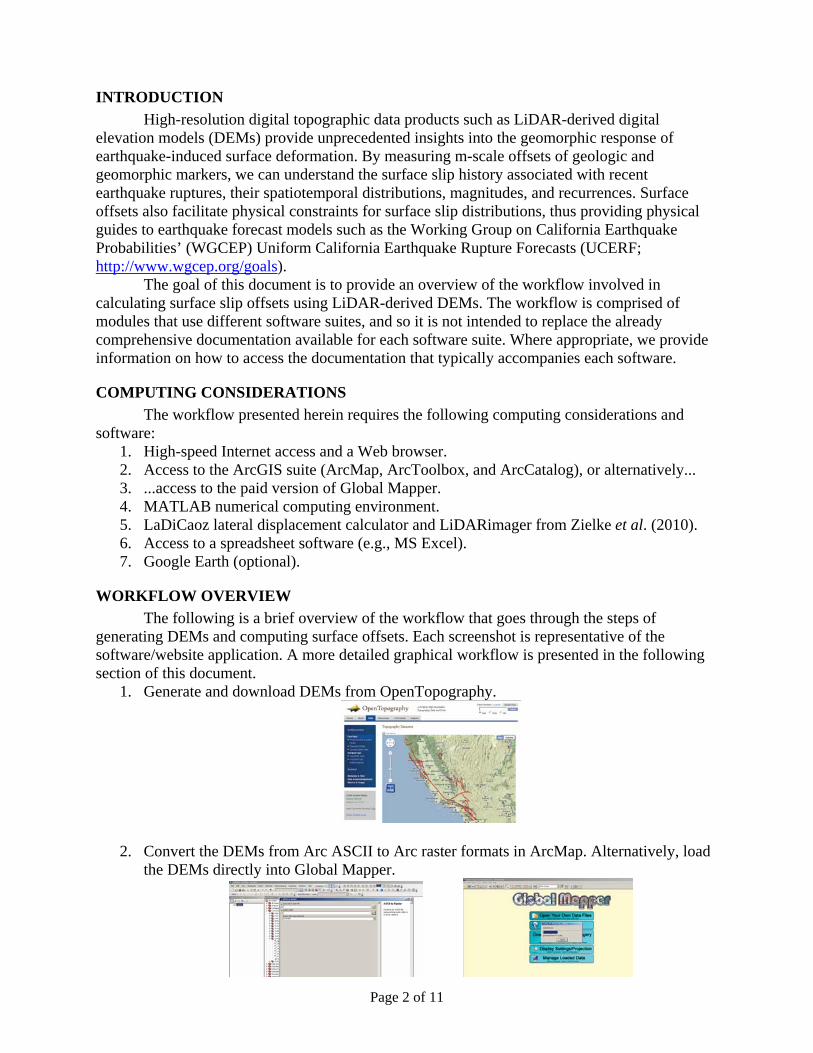
1. Generate and download DEMs from OpenTopography.
2. Convert the DEMs from Arc ASCII to Arc raster formats in ArcMap. Alternatively, load the DEMs directly into Global Mapper.
Page 2 of 11
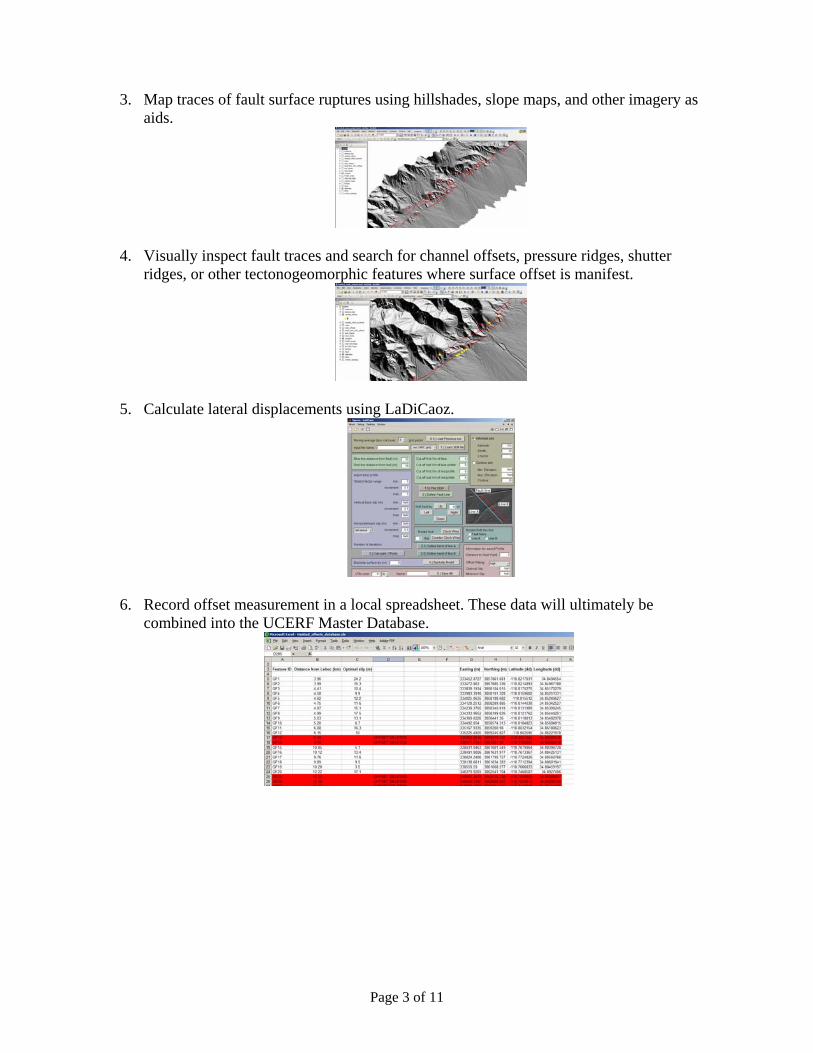
3. Map traces of fault surface ruptures using hillshades, slope maps, and other imagery as
aids.
4. Visually inspect fault traces and search for channel offsets, pressure ridges, shutter ridges, or other tectonogeomorphic features where surface offset is manifest.
5. Calculate lateral displacements using LaDiCaoz.
6. Record offset measurement in a local spreadsheet. These data will ultimately be combined into the UCERF Master Database.
Page 3 of 11
DETAILED WORKFLOW
This section describes, in detail, the workflow associated with calculating an offset measurement.
Step 1: Generate a DEM in OpenTopography
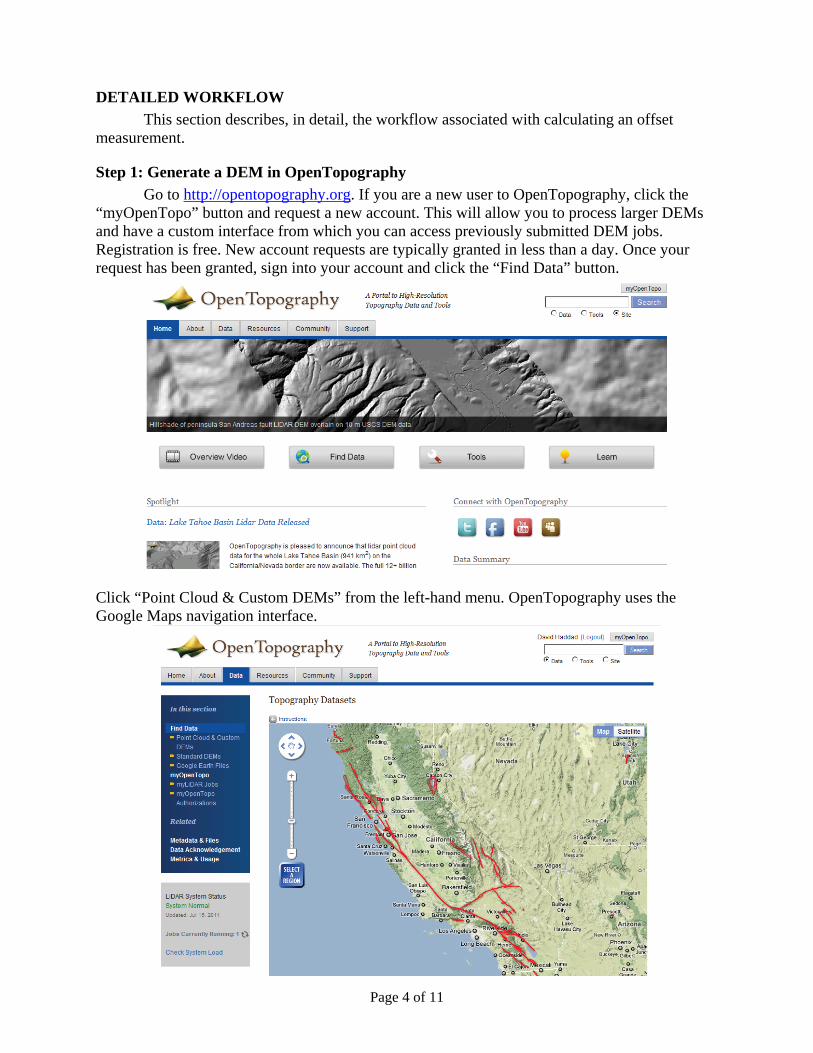
Go to http://opentopography.org. If you are a new user to OpenTopography, click the “myOpenTopo” button and request a new account. This will allow you to process larger DEMs and have a custom interface from which you can access previously submitted DEM jobs. Registration is free. New account requests are typically granted in less than a day. Once your request has been granted, sign into your account and click the “Find Data” button.
Click “Point Cloud & Custom DEMs” from the left-hand menu. OpenTopography uses the Google Maps navigation interface.
Page 4 of 11
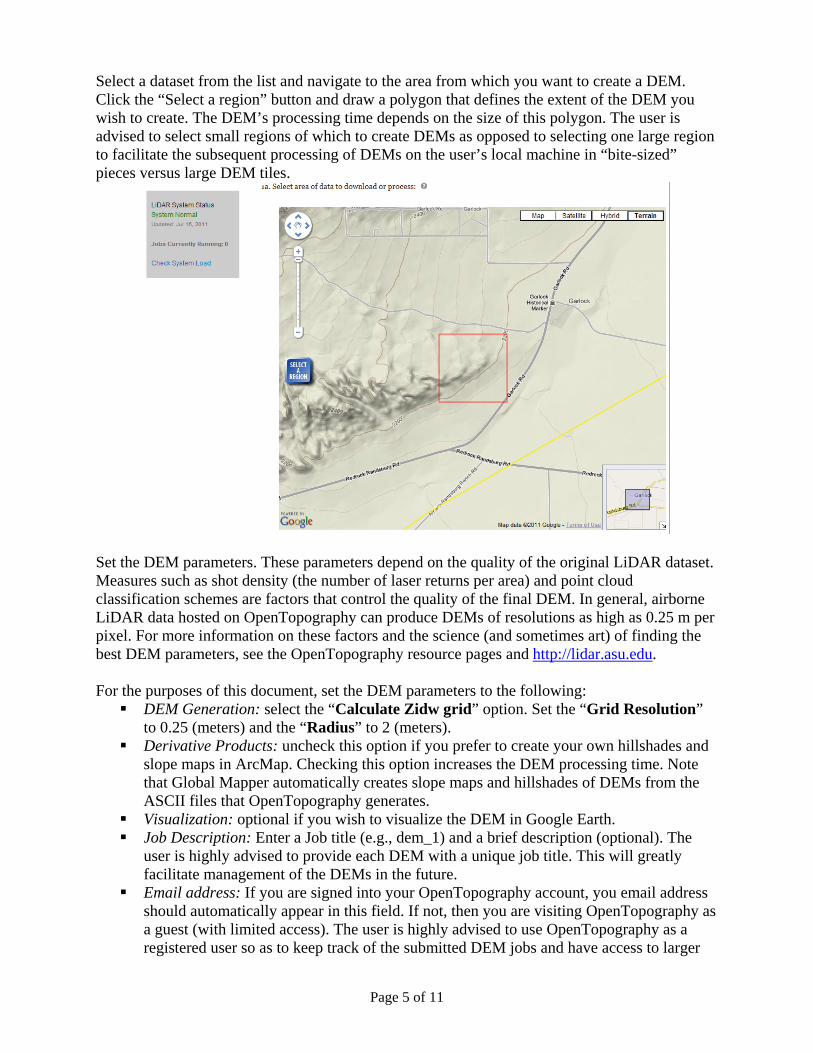
Select a dataset from the list and navigate to the area from which you want to create a DEM. Click the “Select a region” button and draw a polygon that defines the extent of the DEM you wish to create. The DEM’s processing time depends on the size of this polygon. The user is advised to select small regions of which to create DEMs as opposed to selecting one large region to facilitate the subsequent processing of DEMs on the user’s local machine in “bite-sized” pieces versus large DEM tiles.
Set the DEM parameters. These parameters depend on the quality of the original LiDAR dataset. Measures such as shot density (the number of laser returns per area) and point cloud classification schemes are factors that control the quality of the final DEM. In general, airborne LiDAR data hosted on OpenTopography can produce DEMs of resolutions as high as 0.25 m per pixel. For more information on these factors and the science (and sometimes art) of finding the best DEM parameters, see the OpenTopography resource pages and http://lidar.asu.edu. For the purposes of this document, set the DEM parameters to the following: DEM Generation: select the “Calculate Zidw grid” option. Set the “Grid Resolution”
to 0.25 (meters) and the “Radius” to 2 (meters). Derivative Products: uncheck this option if you prefer to create your own hillshades and
slope maps in ArcMap. Checking this option increases the DEM processing time. Note that Global Mapper automatically creates slope maps and hillshades of DEMs from the ASCII files that OpenTopography generates.
Visualization: optional if you wish to visualize the DEM in Google Earth. Job Description: Enter a Job title (e.g., dem_1) and a brief description (optional). The
user is highly advised to provide each DEM with a unique job title. This will greatly facilitate management of the DEMs in the future.
Email address: If you are signed into your OpenTopography account, you email address should automatically appear in this field. If not, then you are visiting OpenTopography as a guest (with limited access). The user is highly advised to use OpenTopography as a registered user so as to keep track of the submitted DEM jobs and have access to larger
Page 5 of 11
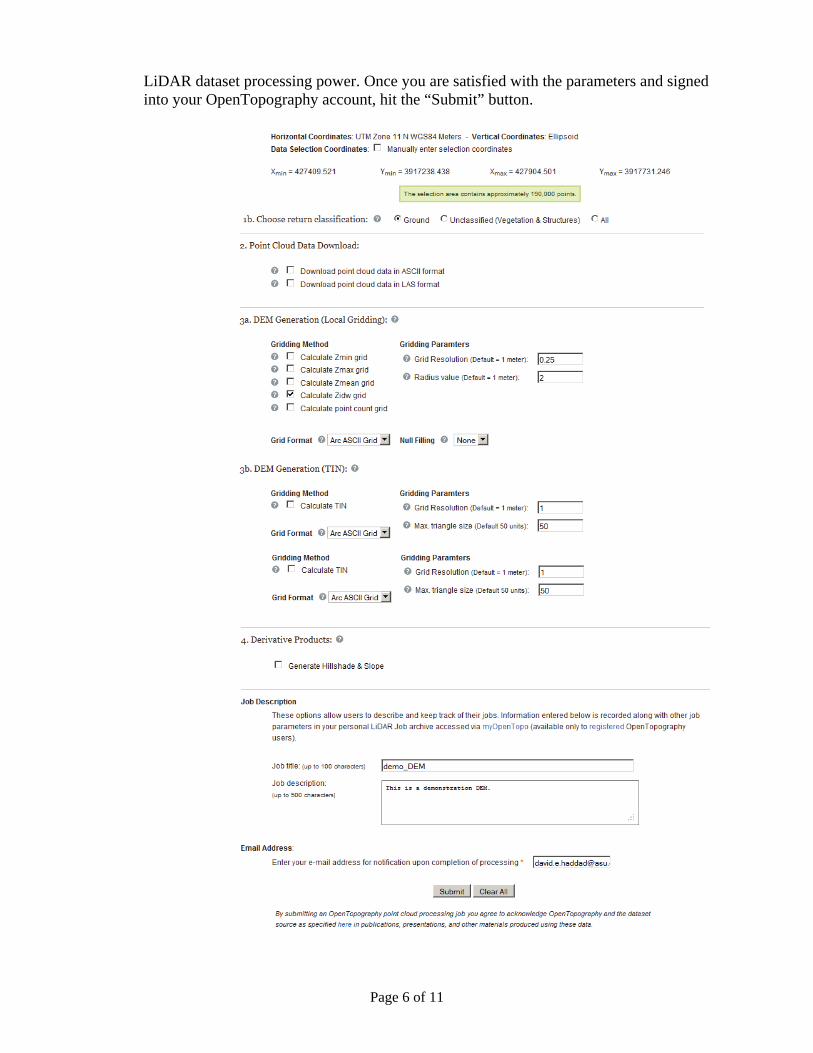
LiDAR dataset processing power. Once you are satisfied with the parameters and signed into your OpenTopography account, hit the “Submit” button.
Page 6 of 11
Step 2: Download the DEM from OpenTopography
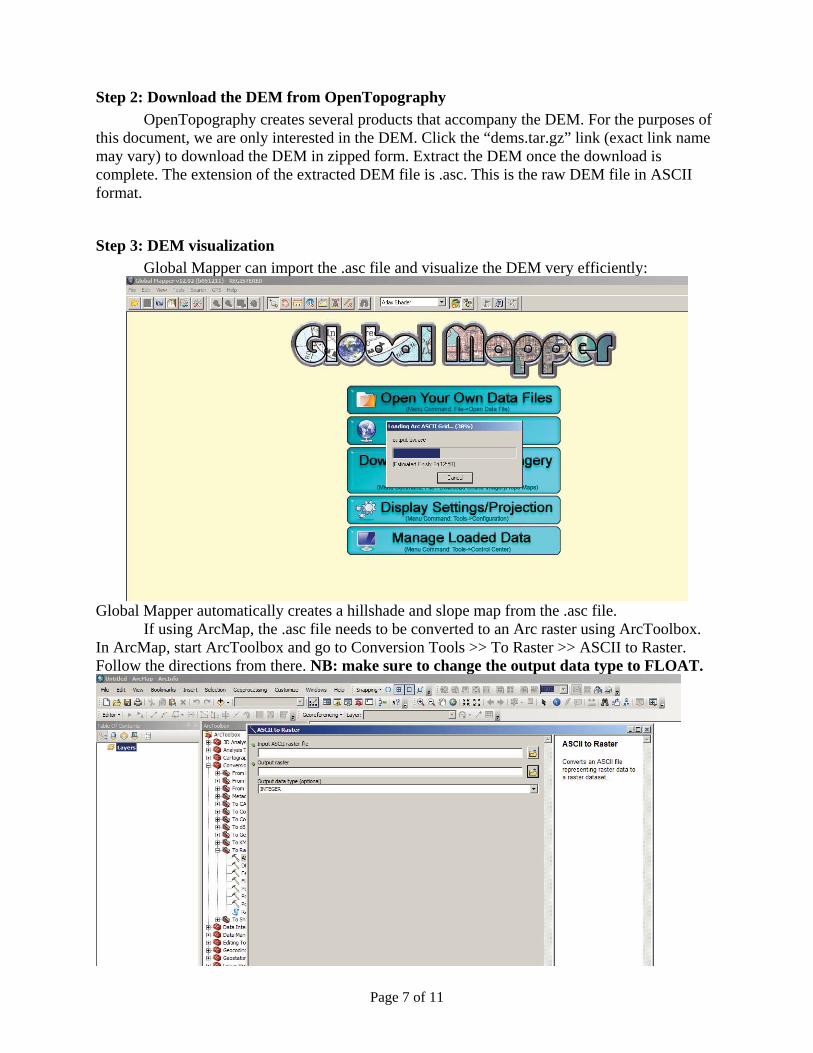
OpenTopography creates several products that accompany the DEM. For the purposes of this document, we are only interested in the DEM. Click the “dems.tar.gz” link (exact link name may vary) to download the DEM in zipped form. Extract the DEM once the download is complete. The extension of the extracted DEM file is .asc. This is the raw DEM file in ASCII format.
Step 3: DEM visualization
Global Mapper can import the .asc file and visualize the DEM very efficiently:
Global Mapper automatically creates a hillshade and slope map from the .asc file.
If using ArcMap, the .asc file needs to be converted to an Arc raster using ArcToolbox. In ArcMap, start ArcToolbox and go to Conversion Tools >> To Raster >> ASCII to Raster. Follow the directions from there. NB: make sure to change the output data type to FLOAT.
Page 7 of 11
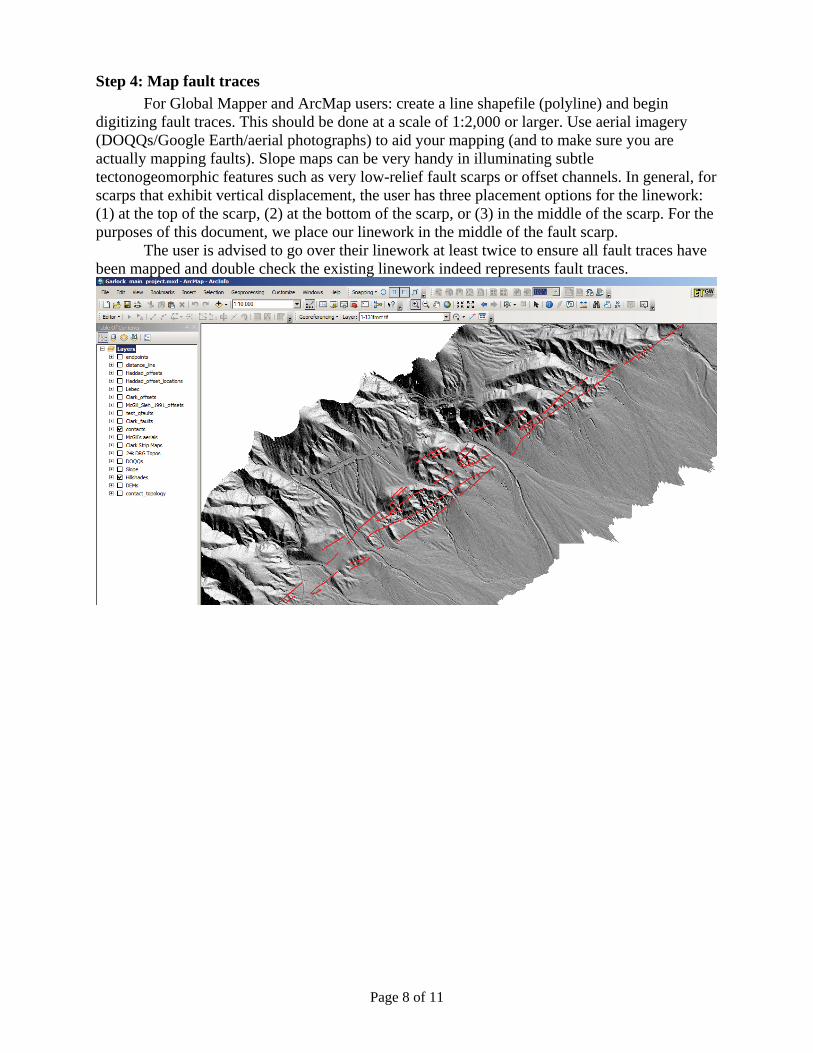
Step 4: Map fault traces
For Global Mapper and ArcMap users: create a line shapefile (polyline) and begin digitizing fault traces. This should be done at a scale of 1:2,000 or larger. Use aerial imagery (DOQQs/Google Earth/aerial photographs) to aid your mapping (and to make sure you are actually mapping faults). Slope maps can be very handy in illuminating subtle tectonogeomorphic features such as very low-relief fault scarps or offset channels. In general, for scarps that exhibit vertical displacement, the user has three placement options for the linework: (1) at the top of the scarp, (2) at the bottom of the scarp, or (3) in the middle of the scarp. For the purposes of this document, we place our linework in the middle of the fault scarp.
The user is advised to go over their linework at least twice to ensure all fault traces have been mapped and double check the existing linework indeed represents fault traces.
Page 8 of 11
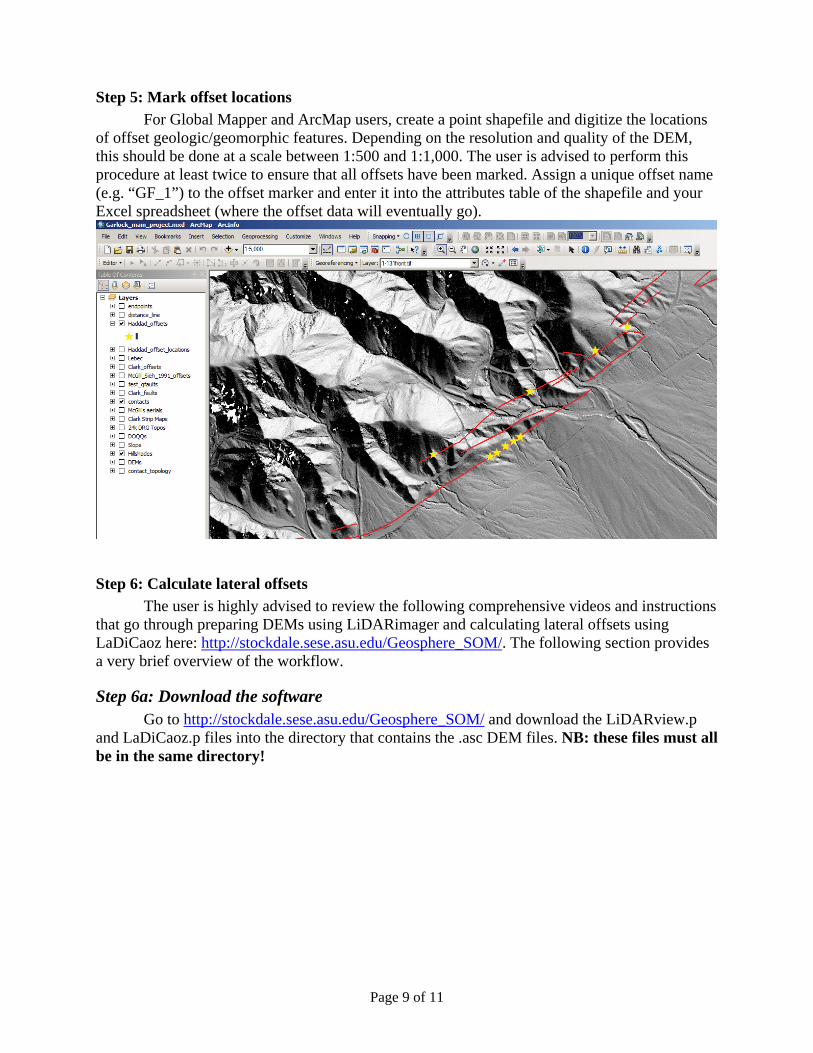
Step 5: Mark offset locations
For Global Mapper and ArcMap users, create a point shapefile and digitize the locations of offset geologic/geomorphic features. Depending on the resolution and quality of the DEM, this should be done at a scale between 1:500 and 1:1,000. The user is advised to perform this procedure at least twice to ensure that all offsets have been marked. Assign a unique offset name (e.g. “GF_1”) to the offset marker and enter it into the attributes table of the shapefile and your Excel spreadsheet (where the offset data will eventually go).
Step 6: Calculate lateral offsets
The user is highly advised to review the following comprehensive videos and instructions that go through preparing DEMs using LiDARimager and calculating lateral offsets using LaDiCaoz here: http://stockdale.sese.asu.edu/Geosphere_SOM/. The following section provides a very brief overview of the workflow.
Step 6a: Download the software Go to http://stockdale.sese.asu.edu/Geosphere_SOM/ and download the LiDARview.p
and LaDiCaoz.p files into the directory that contains the .asc DEM files. NB: these files must all be in the same directory!
Page 9 of 11
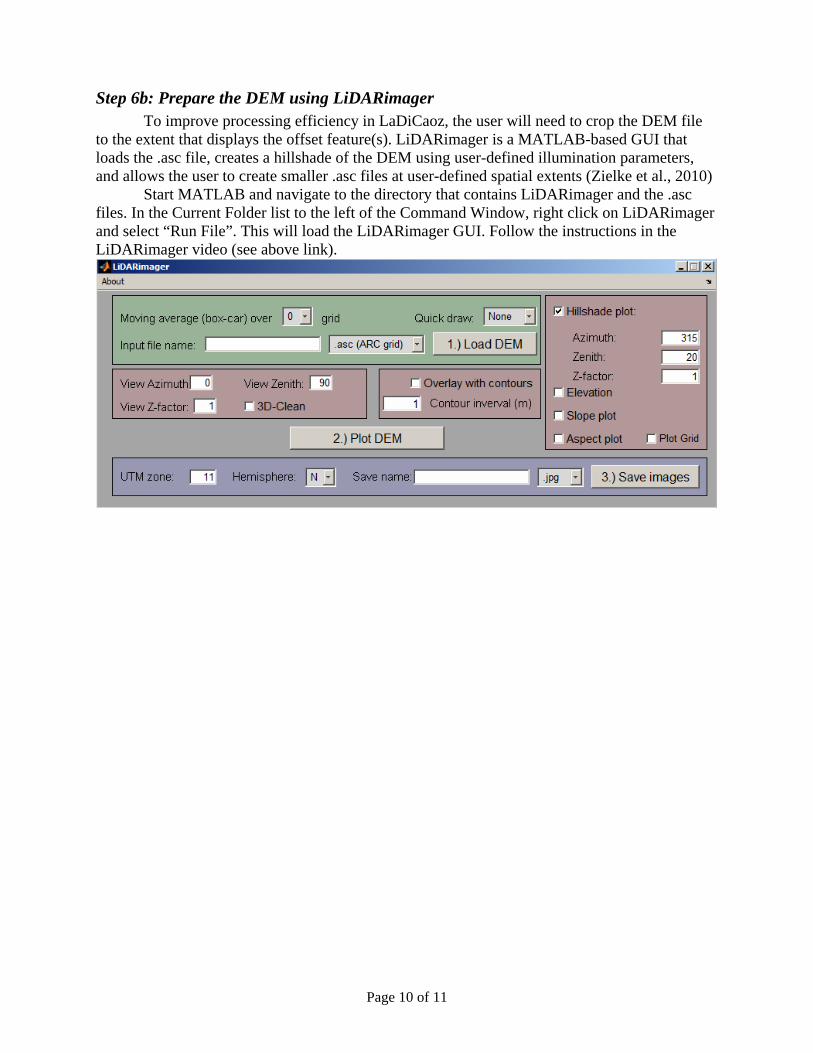
Step 6b: Prepare the DEM using LiDARimager To improve processing efficiency in LaDiCaoz, the user will need to crop the DEM file
to the extent that displays the offset feature(s). LiDARimager is a MATLAB-based GUI that loads the .asc file, creates a hillshade of the DEM using user-defined illumination parameters, and allows the user to create smaller .asc files at user-defined spatial extents (Zielke et al., 2010) Start MATLAB and navigate to the directory that contains LiDARimager and the .asc files. In the Current Folder list to the left of the Command Window, right click on LiDARimager and select “Run File”. This will load the LiDARimager GUI. Follow the instructions in the LiDARimager video (see above link).
Page 10 of 11
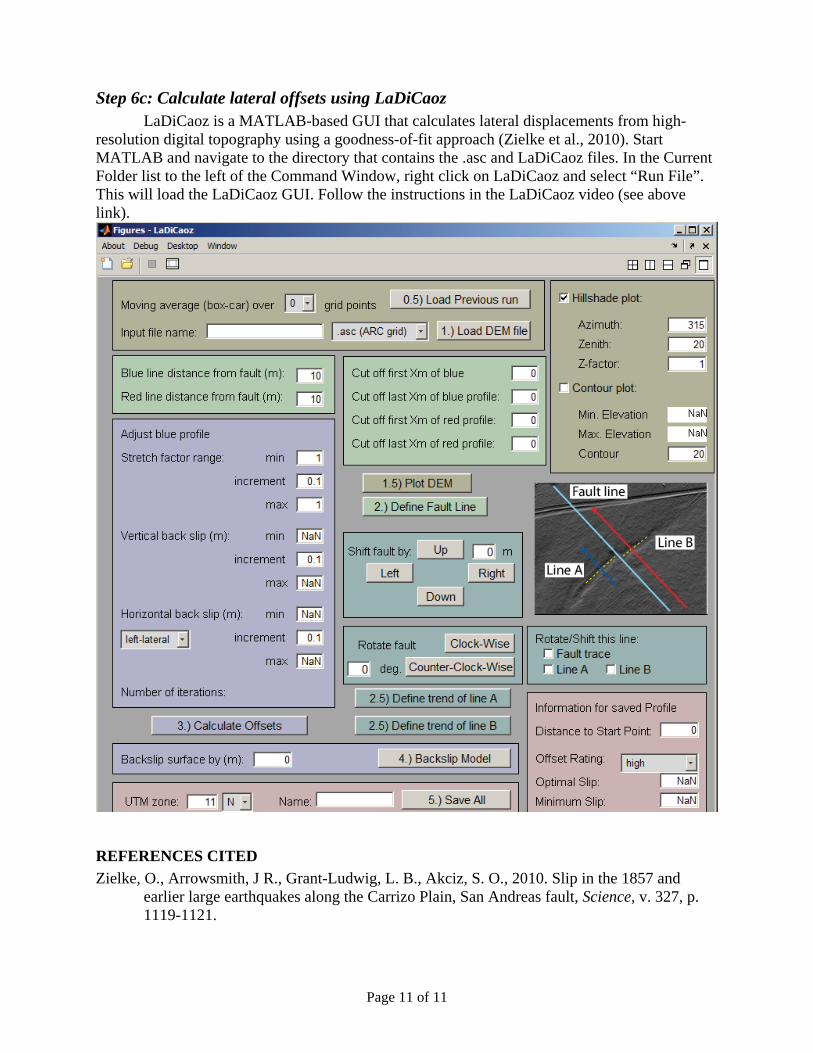
Step 6c: Calculate lateral offsets using LaDiCaoz LaDiCaoz is a MATLAB-based GUI that calculates lateral displacements from high-
resolution digital topography using a goodness-of-fit approach (Zielke et al., 2010). Start MATLAB and navigate to the directory that contains the .asc and LaDiCaoz files. In the Current Folder list to the left of the Command Window, right click on LaDiCaoz and select “Run File”. This will load the LaDiCaoz GUI. Follow the instructions in the LaDiCaoz video (see above link).
REFERENCES CITED
Zielke, O., Arrowsmith, J R., Grant-Ludwig, L. B., Akciz, S. O., 2010. Slip in the 1857 and earlier large earthquakes along the Carrizo Plain, San Andreas fault, Science, v. 327, p. 1119-1121.
Page 11 of 11