measuring systemic and climate diversity in ontario’s ... · measuring systemic and climate...
TRANSCRIPT

CJHE / RCES Volume 45, No. 4, 2015
63Systemic and Climate Diversity / P. G. Piché
Canadian Journal of Higher Education Revue canadienne d’enseignement supérieur
Volume 45, No. 4, 2015, pages 63 - 80
CSSHE SCÉES
Measuring Systemic and Climate Diversity in Ontario’s University SectorPierre Gilles PichéUniversity of Toronto
Abstract
This article proposes a methodology for measuring institutional diversity and applies it to Ontario’s university sector. This study first used hierarchical cluster analysis, which suggested there has been very little change in diver-sity between 1994 and 2010 as universities were clustered in three groups for both years. However, by adapting Birnbaum’s (1983) diversity matrix meth-odology to Ontario’s university sector, the author appears to have found a decrease in systemic diversity (differences in the type of institution and size of institution; Birnbaum, 1983) and climate diversity (differences in campus environment and culture; Birnbaum, 1983) between 1994 and 2010. Policy implications resulting from this study are also considered.
Résumé
Cet article propose une méthodologie pour mesurer la diversité institutionnelle, et l’applique au secteur universitaire de l’Ontario. De prime abord, l’étude a utilisé une analyse de classification hiérarchique suggérant un faible taux de changement de diversité entre 1994 et 2010, période durant laquelle les universités se divisaient en trois groupes. Toutefois, en adaptant la méthodologie de mesure de la diversité de Birnbaum (1983) aux universités de l’Ontario, l’auteur semble avoir décelé une diminution de la diversité systémique (différence dans le type et la grandeur de l’institution, Birnbaum, 1983) et de la diversité climatique (différence dans l’environnement et la culture d’un campus, Birnbaum, 1983) entre 1994 et 2010. L’auteur a également pris en compte les effets de cette étude sur les politiques.

CJHE / RCES Volume 45, No. 4, 2015
64Systemic and Climate Diversity / P. G. Piché
Introduction
The extent and nature of institutional differentiation are one design choice among many that must be considered by policy makers when developing a higher education sys-tem or when dealing with an increased number of students and growing societal demands for undergraduate and graduate education. While the worldwide process of institutional differentiation in higher education is not a new phenomenon, it has received increased attention recently in Ontario as the current environment of fiscal restraint (and calls for greater efficiency) due to the 2008 global economic crisis restricts the province’s ability to increase funding to its university sector; meanwhile, public pressure to increase access continues unabated. Quality advances that have been made in the past 10 years as a result of the provincial government’s significant investment in higher education also need to be maintained. Ontario has recently moved to reconsider the design of its higher education system by adopting a differentiation policy framework as “the foundation for the minis-try’s decision making and ongoing dialogue with institutions, students, and all stakehold-ers going forward” (Ontario Ministry of Training, Colleges and Universities, 2013, p. 9). This framework is in need of a model to quantify the level of diversity, to form the basis for policy development and move the sector forward in these difficult economic times. This article proposes a methodology for measuring institutional diversity and applies it to Ontario’s university sector.
Only a few studies worldwide have measured the level of diversity and differentia-tion in higher education systems (Birnbaum, 1983; Huisman, 2000; Huisman, Meek, & Wood, 2007; Morphew, 2009; Stanley & Reynolds, 1994; Zha, 2009). While some stud-ies have used programmatic diversity—differences in degree level, mission, and program emphasis (Birnbaum, 1983)—as a proxy for institutional diversity (Lepori, Huisman, & Seeber, 2014; Rossi, 2010; Teixeira, Rocha, Biscaia, & Cardoso, 2012), no studies have attempted to quantify the level of systemic and climate diversity in Ontario’s university sector or any other province in Canada. In this study, diversity refers to the number of types of universities within Ontario’s university sector, derived from classifying universi-ties according to one or more characteristics, and to the dispersion of universities across types at a point in time (as informed by Huisman, 1998).
This article will focus on institutional diversity and more specifically on systemic di-versity, because governments around the world are concerned about increasing or main-taining diversity in their higher education systems as a means of increasing access or managing the increased demand for higher education. Systemic diversity is important because it provides a variety of choices to diverse groups of learners that can ensure a better match between the needs of students and the types of institutions. Some students may seek the personal attention offered at a small campus, while others may seek more cosmopolitan campuses. Systemic diversity also ensures that the purposes and functions of institutions are more efficiently discharged. Systemic diversity in this study refers to the number of types of universities within Ontario’s university sector, derived from clas-sifying universities according to their institutional type and size, and to the dispersion of universities across types at a point in time (as informed by Huisman, 1998).
This article will also focus on climate diversity, because Ontario universities have re-cently become increasingly aware of the importance of increased student-faculty interac-

CJHE / RCES Volume 45, No. 4, 2015
65Systemic and Climate Diversity / P. G. Piché
tions to an outstanding student experience; at the same time, they are being provided with additional funding to expand graduate enrolment in the province. Climate diversity is also important because it provides a variety of environments that can better meet the needs of a diverse student body, thereby increasing student satisfaction and engagement. Student needs and abilities can also be met through the characteristics of the other stu-dents attending the same institution, by the various levels of interactions with faculty, or by the research or educational focus of institutions. Climate diversity refers to the num-ber of types of universities within Ontario’s university sector, derived from classifying universities according to their social environment and culture, and to the dispersion of universities across types at a point in time (as informed by Huisman, 1998).
Overview of Ontario’s Higher Education Sector
In 2010, Ontario’s public higher education system consisted of 21 provincially-assist-ed universities and their affiliates, 24 publicly assisted colleges of applied arts and tech-nology, three agricultural colleges affiliated with a university, one applied health science institute, and one military college.
Ontario universities are autonomous not-for-profit corporations, each created by a separate provincial act that, in almost all instances, provides it with the authority to grant both undergraduate and graduate degrees. The province essentially has a monopoly on degree granting by its ability to provide the right to publicly supported universities to of-fer degrees through legislation. All universities provide graduate programs, with the ex-ception of Algoma, the newest university in Ontario. There are differences in the program mixes offered by the various universities but their missions, as stated in their legislation, are very similar. Ontario universities operate, like those in many other countries, within a neo-liberal political framework characterized by an increased focus on the private ben-efits of higher education, the use of competition in funding allocation models, and in-creased accountability measures.
Colleges in Ontario were all established under a single statute and focus mainly on vocational education. In 2000, they were provided with the authority to offer applied bac-calaureate programs in applied fields of study. “College degree granting represents 4% of college enrolment (2011), and 2% of overall Ontario degree-level enrolment” (Hicks, We-ingarten, Jonker, & Liu, 2013, p. 3). Colleges also engage in applied research in varying degrees and seek to provide programs in response to their local communities. Starting in 2003, five colleges were differentiated from the others by being assigned the status of in-stitute of technology and advanced learning, which allows them to offer up to 15% of their programs in applied degrees, as compared with 5% for those without this status. Colleges do not have statutory authority to grant degrees; they must obtain approval for each pro-gram from the Ontario Minister of Training, Colleges and Universities, who grants ap-proval for a limited time.
Using the boundaries established for Ontario’s demographic forecasts by the On-tario Ministry of Finance, Fallis (2013) observed that universities are well distributed geographically across the province. The distribution speaks to Ontario’s commitment to providing post-secondary education to all qualified students who wish to attend without forcing them to leave their regions. Table 1 replicates the geographical distribution of uni-versities by region, as followed by Fallis, and adds their associated institutional type. Stu-

CJHE / RCES Volume 45, No. 4, 2015
66Systemic and Climate Diversity / P. G. Piché
dents in each region have access to all four types of institutions, except in the Southwest region, which lacks a special-purpose institution, and the Northern region, which lacks a comprehensive institution and a medical/doctoral institution.
Theoretical Framework and Methodology
The changes in institutional diversity in Ontario were examined using population ecology, derived from organizational theory, as the study’s main theoretical framework. Population ecology theory focuses “on the sources of variability and homogeneity of or-ganizational forms. It pays considerable attention to population dynamics, especially the processes of competition among diverse organizations for limited resources such as mem-bership, capital and legitimacy” (Hannan & Freeman, 1989, p. 13). This study also made limited use of institutional isomorphism perspectives in its policy analysis. As shown in the work of DiMaggio and Powell (1983), organizations take into account the survival of other organizations in their environments, leading them to adopt similar behaviour, thereby decreasing systemic diversity.
Huisman (1998) derived the concept of diversity from its biological and ecological origins and determined the level of diversity by examining not only the number of species in a community but also the evenness of the distribution of organisms across species. A species is a population of organisms with the ability to interbreed freely and bring forth fertile offspring. Huisman transferred these concepts to provide insights about the level of diversity in higher education systems, where the system is the community, institutional types are the species, and higher education institutions are the organisms. The level of diversity in this study was therefore measured in reference to the variety of types (spe-cies) in the university sector in Ontario (biosystem) and the dispersion of universities (organisms) across types, by adopting a biological analogy similar to that of Huisman et al. (2007) for the purpose of data analysis and classification.
Quantitative research measures were used to determine the extent of diversity in On-tario’s university sector in 1994 and 2010 by first using hierarchical cluster analysis. More specifically, this study determined the extent of systemic diversity and climate diversity during 1994 and 2010 by adapting Birnbaum’s (1983) diversity matrix methodology to categorize institutions into institutional types; then it determined their concentration and
Table 1.Ontario Universities by Region and Type, 2010
Southwest Central Greater Toronto East NorthernBrock (1)Western (3)Windsor (2)
Guelph (2)Laurier (1)McMaster (3)Waterloo (2)Redeemer (4)
OCAD (4)Ryerson (1)Toronto (3)UOIT (1)York (2)
Carleton (2)Trent (1)Ottawa (3)Queen’s (3)Dominican (4)Royal Military (4)
Algoma (4)Lakehead (1)Laurentian (1)Nipissing (1)
Note: (1) Primarily undergraduate, (2) Comprehensive, (3) Medical/doctoral, (4) Special-purpose.

CJHE / RCES Volume 45, No. 4, 2015
67Systemic and Climate Diversity / P. G. Piché
dispersion by type. Simpson’s λ, an indicator often used in ecology to measure diversity, was also used as another measure of systemic and climate diversity for 1994 and 2010.
The period 1994 to 2010 was selected because at that time, the higher education en-vironment experienced a large number of changes including enrolment growth. The year 1994 was selected as a starting point for this study, as not only does it provide a long enough period to allow the system to change, but it captures the end of the New Demo-cratic Party government’s policies for higher education before the election of a Conserva-tive government in June of 1995. The year 2010 was selected as it represents the end of the Liberal government’s Reaching Higher Plan (even though the Liberals have remained in power since 2003) and is the latest year for which complete data were available.
An institution was included in the definition of Ontario’s university sector if, during the period 1994 to 2010, the institution either held membership in the Association of Universities and Colleges of Canada (currently Universities Canada) or held membership (full or associate) in the Council of Ontario Universities. This study excluded institutions that had affiliation or federation arrangements with a comprehensive institution as these institutions formed an integral part of the comprehensive institution.
Following Morphew (2009), who limited his study to degree-granting institutions, this study focused on Ontario’s university sector instead of its entire higher education system. The non-degree or college sector was excluded because a number of studies have already clearly laid out the differences between the college and university sectors (Jones, 1996, 2006; Skolnik, 1986, 2005). The university sector also operates in an environment that is quite distinct from that of the college or non-degree sector.
This study first used hierarchical cluster analysis, a technique used “for portioning objects into optimally homogenous groups on the basis of empirical measures of simi-larity among those objects” (Johnson, 1967, p. 241), to group together universities (unit of analysis) with similar characteristics (response variables). The practical result of the analysis was two branching diagrams (dendrograms), one for 1994 and one for 2010, that were compared to determine the extent of diversity in the university sector for these two years and the changes between them.
Nine response variables were used in the cluster analysis for both years, including vari-ables used to operationalize systemic and climate diversity; these variables differentiate in-stitutions and reflect their varying characters. They include the numbers of full-time facul-ty, full-time and part-time graduate enrolment, and full-time and part-time undergraduate enrolment. Financial characteristics that differentiate institutions by their main functions of education and research were also used: tuition fee revenue, operating grants, funding for sponsored research, and non-credit funding. Tuition fee revenue is a differentiating charac-teristic as it is impacted by the institution’s tuition policy, the number of students, student mix by program, level of study, and proportion of international students served. Operat-ing grant funding is impacted by the number of students enrolled and the student mix of programs. Since not all institutions offer the same extent and type of non-credit courses or conduct the same amount of research, these variables also differentiate institutions.
The hierarchical cluster analysis used Ward’s method as its clustering algorithm, as suggested by Huisman (2000), and the (squared) Euclidean distance as its distance index, as recommended and favoured by Huberty, Jordan, and Brandt (2005). Ward’s method uses an analysis of variance approach to evaluate the distances between clusters;
CJHE / RCES Volume 45, No. 4, 2015
68Systemic and Climate Diversity / P. G. Piché
it groups all cases into groups and proceeds until there is only one group. This method was more suitable for this study than the k-mean clustering algorithm, as it made no hy-potheses concerning the number of clusters in 1994 and 2010. The subjectivity related to the choice of Ward’s clustering algorithm over other algorithms was minimized since the same method was used for both 1994 and 2010. The Euclidean distance in univariate analysis is the arithmetical difference between two values. The squared Euclidean dis-tance was used in order to place progressively greater weight on variables that are farther apart. As recommended by Milligan and Cooper (as cited in Huberty et al., 2005), since there is no common metric to the measurement of all variables, each variable was stan-dardized using z scores before the analysis was conducted using SPSS. It is acknowledged that an approach that uses a selection of meaningful dimensions by definition implies a loss of information.
The study more specifically assessed the change in systemic and climate diversity by adapting Birnbaum’s (1983) methodology, which categorizes institutions into institution-al types to determine their concentration and dispersion by type. Birnbaum’s methodol-ogy was applied in two stages. The first stage consisted of determining the appropriate aspects of diversity to be measured that are consistent with education policy discourse in Ontario; the second stage involved applying various quantitative measures.
Systemic diversity was operationalized using two variables: size (small, medium, large) and type (primarily undergraduate, comprehensive, medical/doctoral, special-pur-pose). Climate diversity was operationalized using the following three variables: enrol-ment profile (low graduate, medium graduate, high graduate), undergraduate profile (low full-time, medium full-time, high full-time), and student-faculty contact (high contact, medium contact, low contact). The variables selected were limited to those that can be objectively quantified; they provided face validity, as they were generally accepted as vari-ables reflecting differences among institutional forms and function in an Ontario context.
It should be noted that the method employed and the variables selected in this study differ from those used by Birnbaum (1983). First, Birnbaum used a matrix that yielded a total of 768 possible institutional types by categorizing each institution by control (four values); size (three values); sex of students (two values); curriculum (four values); highest degree level (four variables); and minority enrolment (two values). For the purposes of this study, the variables were adapted to accommodate the number of universities in Ontario, with a focus on systemic and climate diversity. While the control variable may be a differ-entiating factor in the United States, this is not the case in Ontario since most institutions (except Dominican University College and Redeemer University College) have the same form of control as publicly funded universities. A small number of private religious col-leges operate in Ontario in a niche market, but they receive little attention in public discus-sions of higher education (Jones & Young, 2004). For these reasons, this study did not use the control variable to assess systemic diversity. The sex of students variable is not relevant in Ontario since all universities are essentially coeducational public institutions. The high-est degree level offered is not a discriminating variable in Ontario since only one small in-stitution in the study does not offer graduate degrees. Categorizing institutions as minority institutions if more than 50% of their enrolment is non-white would not have differenti-ated institutions in Ontario as the student population is extremely ethnically diverse, and institutions in Ontario do not define themselves as minority-serving institutions.
CJHE / RCES Volume 45, No. 4, 2015
69Systemic and Climate Diversity / P. G. Piché
The distribution by institutional types was completed by assigning each institution to one cell of the diversity matrix using only the two variables assessing systemic diversity and only the three variables assessing climate diversity. The possible number of institu-tional types to categorize each institution was determined to be the product of the values of each variable. For systemic diversity, the possible number of institutional types is 12 (3 x 4), and for climate diversity, the possible number of institutional types is 27 (3 x 3 x 3). Each institution in the study was categorized using each of the five variables and identified to belong to one and only one of the possible institutional types. Therefore, institutions having the same identical values for all variables were viewed as belonging to the same institutional type, or sharing the same cell in the matrix. It should be noted that institutions belonging to the same institutional type are not identical in all aspects but share characteristics of their basic form and structure.
Quantitative measures of systemic and climate diversity were calculated using four in-dices, as suggested by Birnbaum (1983), to identify any significant change between 1994 and 2010.
• Index A measured the dispersion of institutions over the number of types. Index A was calculated by dividing the number of institutions in the province by the number of types they represent. The higher the index, the less the diversity.
• Index B measured the extent to which institutions were clustered together by exam-ining the most densely populated cell of the diversity matrix. Index B was calculated by dividing the number of institutions in the most densely populated cell by the total number of institutions in the province (multiplied by 100 for ease of calcula-tion). The higher the index, the less the diversity.
• Index C measured the extent to which institutions were concentrated within types. Index C was calculated by taking the proportion of institutions in the most highly populated 10% of the cells of the diversity matrix (multiplied by 100 for ease of cal-culation). The higher the index, the less the diversity.
• Index D measured the extent to which there were unique institutions in the sector. Index D was calculated by dividing the number of unique institutions (single insti-tution in a cell in the matrix) by the total number of institutions (multiplied by 100 for ease of calculation). The higher the index, the more the diversity.
In the categorization of institutions by size and by type, the computed index values may have varied by year, depending on how each variable was defined. Since the categori-zation method was consistent for both 1994 and 2010, the yearly index values were not as significant by themselves but were calculated purely to determine the change over time. All differences were treated as equally important.
In ecology, the level of diversity is obtained from Simpson’s λ (∑pi²), which calculates “the probability that two institutions drawn at random from the population of higher edu-cation belong to the same institutional type” (Huisman et al., 2007, p. 569), where pi repre-sents the proportional abundance of the ith institutional type. It was used in this study as a measure of systemic and climate diversity for 1994 and 2010. This measure used the num-ber of institutional types as determined by adapting Birnbaum’s (1983) methodology to the Ontario university sector and the total number of institutions. The closer the indicator was to 0, the higher the diversity; the closer the indicator was to 1, the lower the diversity.
CJHE / RCES Volume 45, No. 4, 2015
70Systemic and Climate Diversity / P. G. Piché
Operationalizing the Variables: Systemic Diversity
The classification of institutions by role and function facilitates the understanding of differences that exist among institutions (Altbach, 2002). This study assessed systemic diversity by classifying institutions by size and type, as is common in studies of diversity.
Institutional size is a variable that can be used to differentiate institutions. The Ameri-can literature “consistently supports the existence of strong relationships between insti-tutional size and other variables relating to activities, goals, campus climate and student outcomes” (Birnbaum, 1983, p. 88). This view was also shared by the Carnegie Founda-tion for the Advancement of Teaching, which stated that size does matter: “It is related to institutional structure, complexity, culture, finances, and other factors” (Carnegie Clas-sification of Institutions of Higher Learning, n.d.-b, para. 2). Huisman et al. (2007) and the Carnegie Foundation for the Advancement of Teaching (Carnegie Classification of Institutions of Higher Learning, n.d.-b) defined large institutions as those with more than 10,000 students. Large institutions in a European context were defined as those insti-tutions having 15,000 or more students; small institutions were those with fewer than 5,000 students (U-Map, 2011). This study accepted that students would probably have similar experiences in institutions with more than 10,000 students; therefore it catego-rized institutions as small, if they had fewer than 5,000 students; medium, if they had between 5,000 and 10,000 students; or large, if they had more than 10,000 students.
In a Canadian context, universities have been differentiated by type for many years by Maclean’s magazine when it ranks Canadian universities in November each year. The cur-rent categorization by Maclean’s (primarily undergraduate, comprehensive, and medical/doctoral) is well understood and generally accepted by universities and the public. Orton (2003) suggested using the Maclean’s categorization and expanding it by two types, First Nations and Métis institutions and special-purpose organizations. This study accepted the categorization by Maclean’s with the addition of Orton’s (2003) two additional types, which were grouped together under the label special-purpose in an effort to minimize the number of values that could unduly inflate the number of institutional types.
Operationalizing the Variables: Climate Diversity
The variables used to assess climate diversity were enrolment profile, undergraduate profile, and student-faculty contact. The selection of values for each variable permitted dif-ferentiation between institutions while allowing similar institutions to be clustered together.
The enrolment profile variable categorized students according to the proportion en-rolled in undergraduate and graduate programs and provided insight into the mission and climate of the institution. The Carnegie Foundation for the Advancement of Teaching stated that the mix of graduate and undergraduate students “reflects important differ-ences with respect to educational mission as well as institutional climate and culture—dif-ferences that can have implications for infrastructure, services, and resource allocation” (Carnegie Classification of Institutions of Higher Learning, n.d.-a, para. 1). It classified in-stitutions as exclusively undergraduate (two- and four-year institutions with no graduate programs), combined undergraduate and graduate/professional, or exclusively graduate/professional (no undergraduate programs). Institutions that provided both undergraduate and graduate programs (all Ontario universities except Algoma University) were further
CJHE / RCES Volume 45, No. 4, 2015
71Systemic and Climate Diversity / P. G. Piché
characterized as having very high undergraduate enrolment (graduate students accounted for less than 10% of full-time equivalent, or FTE, enrolment), high undergraduate enrol-ment (graduate students accounted for between 10% and less than 25% of FTE enrolment), majority undergraduate enrolment (graduate students accounted for between 25% and less than 50% of FTE enrolment), and majority graduate/professional enrolment (gradu-ate students accounted for at least 50% of FTE enrolment). The European Classification of Higher Education Institutions, known as U-Map, chose not to use an indicator of graduate intensity in its teaching and learning profile dimension to avoid its hierarchical connota-tion. Instead, it used the following degree attributions, of which one or more may be at-tributed to a single institution: doctorate focus (more than 5% of all qualifications awarded were doctorate degrees), master focus (more than 25% of all qualifications awarded were master’s degrees), bachelor focus (more than 40% of all qualifications awarded were bach-elor’s degrees), and sub-degree focus (more than 5% of all qualifications awarded were sub-degree qualifications) (U-Map, 2011). In Canada and in Ontario, few institutions have more than 25% of their student population in graduate studies. This study accepted that students would have a different experience in institutions where graduate students made up less than 10% of total enrolment than in institutions where graduate students made up more than 20% of total enrolment. Institutions were therefore categorized as low gradu-ate, if they had less than 10% full-time graduate students as a percentage of total full-time enrolment; medium graduate, if their graduate enrolment was between 10% and 20%; or high graduate, if their graduate enrolment was above 20%.
The undergraduate profile variable provided insight into the undergraduate climate and culture of the institution by distinguishing between the undergraduate students who attended on a full-time basis and those who attended on a part-time basis. The Carnegie Foundation for the Advancement of Teaching stated that part-time students were usually older and had a great zeal for learning but had competing obligations to juggle (Carnegie Classification of Institutions of Higher Learning, n.d.-c, para. 2). Institutions were cat-egorized using the same values used by the Carnegie Foundation for the Advancement of Teaching for its examination of the undergraduate profile. An institution was categorized as low full-time, if full-time undergraduate students made up less than 60% of total un-dergraduate enrolment; medium full-time, if the percentage was between 60% and less than 80%; or high full-time, if the percentage was 80% or higher.
The student-faculty contact variable was used because there is a widely held belief in the literature that one of the factors that lead to improved student engagement, satisfac-tion, and learning is increased student-faculty contact (e.g., Astin, 1985, 1993; Jacob, 1957; Lundberg & Schreiner, 2004; Pascarella & Terenzini, 1979; Wilson, Gaff, Dienst, Wood, & Bavry, 1975). Kokkelenberg, Dillon, and Christy (2008), in their study of a public univer-sity, controlled for a number of variables such as student ability, level of student, gender, minority status, and academic department and determined that the grade point average declined as class size increased, precipitously up to a class size of 20 and more gradually through larger class sizes. Following these parameters, this study categorized institutions as high contact, if the ratio of total enrolment to full-time faculty was below 20; medium contact, if the ratio was between 20 and 30; or low contact, if the ratio was above 30.

CJHE / RCES Volume 45, No. 4, 2015
72Systemic and Climate Diversity / P. G. Piché
Research Findings
Figures 1 and 2 display the results of the hierarchical cluster analysis for 1994 and 2010.
A comparison of both dendrograms suggests that there has been very little change in diversity between 1994 and 2010, since universities in Ontario were clustered in three groups for both 1994 and 2010 and remained in the same cluster grouping in 2010 as they did in 1994. These results are further summarized in Figure 3: Universities were charac-terized as mainly undergraduate or research-intensive, with the University of Toronto sit-ting in a cluster of its own as it surpassed all universities on almost all of the variables con-sidered. Weingarten et al. (2013) used a limited number of variables without the rigour of cluster analysis to arrive at similar clusters but determined that York, Carleton, Windsor, and Ryerson “do not fall easily into the two broad clusters of ‘more research intensive’ and ‘mainly undergraduate’” (p. 17).
Figure 1. Dendrogram of Ontario Universities, 1994

CJHE / RCES Volume 45, No. 4, 2015
73Systemic and Climate Diversity / P. G. Piché
Figure 2. Dendrogram of Ontario Universities, 2010
Mainly Undergraduate Research-Intensive
BrockDominicanLakehead
LaurentianNipissing
OCADRedeemer
Trent
CarletonGuelph
McMasterOttawaQueen’sRyersonWaterlooWestern
Universityof
Toronto
Figure 3. Clusters of Ontario Universities, 1994 and 2010
CJHE / RCES Volume 45, No. 4, 2015
74Systemic and Climate Diversity / P. G. Piché
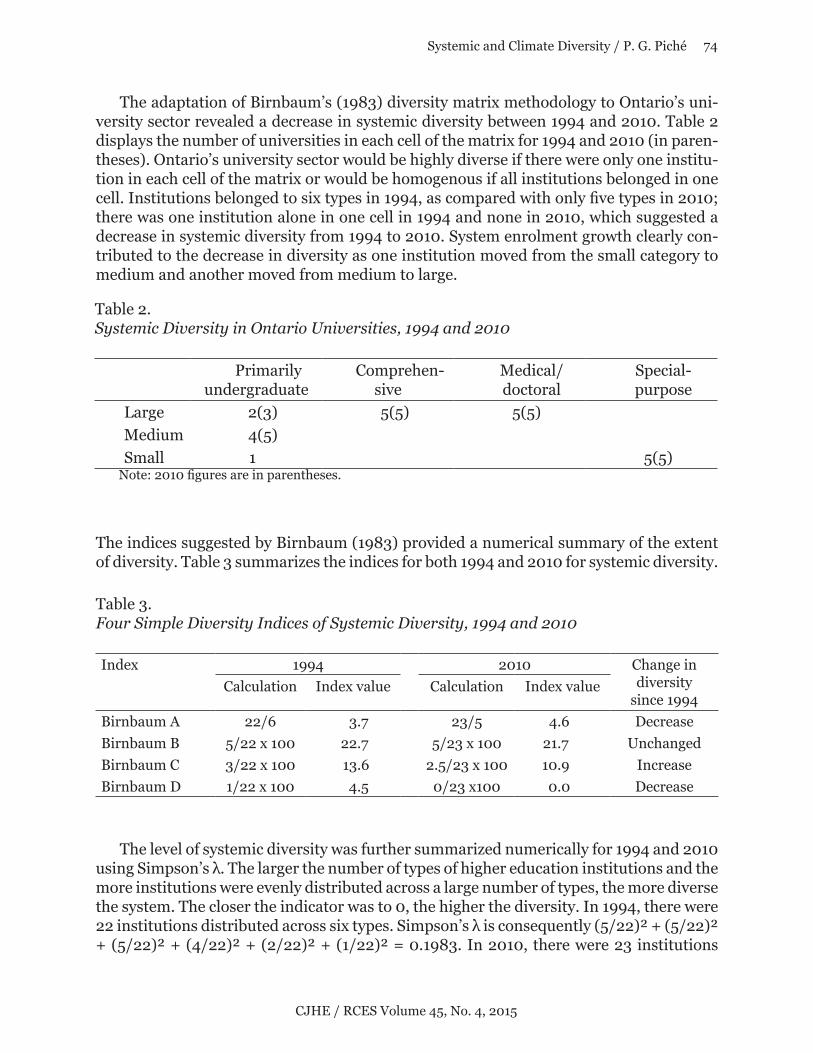
The adaptation of Birnbaum’s (1983) diversity matrix methodology to Ontario’s uni-versity sector revealed a decrease in systemic diversity between 1994 and 2010. Table 2 displays the number of universities in each cell of the matrix for 1994 and 2010 (in paren-theses). Ontario’s university sector would be highly diverse if there were only one institu-tion in each cell of the matrix or would be homogenous if all institutions belonged in one cell. Institutions belonged to six types in 1994, as compared with only five types in 2010; there was one institution alone in one cell in 1994 and none in 2010, which suggested a decrease in systemic diversity from 1994 to 2010. System enrolment growth clearly con-tributed to the decrease in diversity as one institution moved from the small category to medium and another moved from medium to large.
The indices suggested by Birnbaum (1983) provided a numerical summary of the extent of diversity. Table 3 summarizes the indices for both 1994 and 2010 for systemic diversity.
The level of systemic diversity was further summarized numerically for 1994 and 2010 using Simpson’s λ. The larger the number of types of higher education institutions and the more institutions were evenly distributed across a large number of types, the more diverse the system. The closer the indicator was to 0, the higher the diversity. In 1994, there were 22 institutions distributed across six types. Simpson’s λ is consequently (5/22)² + (5/22)² + (5/22)² + (4/22)² + (2/22)² + (1/22)² = 0.1983. In 2010, there were 23 institutions
Table 2. Systemic Diversity in Ontario Universities, 1994 and 2010
Primarily undergraduate
Comprehen-sive
Medical/doctoral
Special-purpose
Large 2(3) 5(5) 5(5)Medium 4(5)Small 1(0) 5(5)
Note: 2010 figures are in parentheses.
Table 3.Four Simple Diversity Indices of Systemic Diversity, 1994 and 2010
Index 1994 2010 Change in diversity
since 1994Calculation Index value Calculation Index value
Birnbaum A 22/6 3.7 23/5 4.6 DecreaseBirnbaum B 5/22 x 100 22.7 5/23 x 100 21.7 UnchangedBirnbaum C 3/22 x 100 13.6 2.5/23 x 100 10.9 IncreaseBirnbaum D 1/22 x 100 4.5 0/23 x100 0.0 Decrease

CJHE / RCES Volume 45, No. 4, 2015
75Systemic and Climate Diversity / P. G. Piché
distributed across five types. Simpson’s λ is consequently (5/23)² + (5/23)² + (5/23)² + (5/23)² + (3/23)² = 0.2060. Using Birnbaum’s indices and the calculation of Simpson’s λ, there appeared to be a decrease in systemic diversity between 1994 and 2010.
The adaptation of Birnbaum’s (1983) diversity matrix methodology to Ontario’s uni-versity sector revealed a decrease in climate diversity between 1994 and 2010. Figure 5 displays the number of universities in each cell of the matrix for 1994 and 2010. Institu-tions belonged to 10 types in 1994 and 2010 (suggesting no change in diversity) but were more concentrated in 2010: One type had six institutions in 2010 compared with four institutions in 1994 (suggesting less diversity); in 2010, five institutions were alone in the matrix, compared with four in 1994 (suggesting more diversity).
Table 4 summarizes the indices for both 1994 and 2010 for systemic diversity.
1994 2010
4 4
3 3
2 2
1 1 1 1
4
3 3
2
1 1 1 1 1
6
Figure 5. Climate Diversity in Ontario Universities, 1994 and 2010
Table 4.Four Simple Diversity Indices of Climate Diversity, 1994 and 2010
Index 1994 2010 Change in diversity
since 1994Calculation Index value Calculation Index value
Birnbaum A 22/10 2.2 23/10 2.3 UnchangedBirnbaum B 4/22 x 100 18.2 6/23 x 100 26.1 DecreaseBirnbaum C 4/22 x 100 18.2 6/23 x 100 26.1 DecreaseBirnbaum D 4/22 x 100 18.2 5/23 x100 21.7 Increase

CJHE / RCES Volume 45, No. 4, 2015
76Systemic and Climate Diversity / P. G. Piché
The level of climate diversity was further summarized numerically for 1994 and 2010 using Simpson’s λ. In 1994, there were 22 institutions distributed across 10 types. Simp-son’s λ is consequently (4/22)² + (4/22)² + (3/22)² + (3/22)² + (2/22)² + (2/22)² + (1/22)² + (1/22)² + (1/22)² + (1/22)² = 0.1281. In 2010, there were 23 institutions distrib-uted across 10 types. Simpson’s λ is consequently (6/23)² + (4/23)² + (3/23)² + (3/23)² + (2/23)² + (1/23)² + (1/23)² + (1/23)² + (1/23)² + (1/23)² = 0.1493. Using Birnbaum’s indices and the calculation of Simpson’s λ, there appeared to be a decrease in climate di-versity between 1994 and 2010.
Discussion and Policy Implications
It is understood that Ontario is experiencing a slow economic recovery, with increased demand for baccalaureate education. The Ontario government has already signalled that it is ready “to steer the system in ways that align with provincial priorities while respect-ing the autonomy and supporting the strengths of our institutions” (Ontario Ministry of Training, Colleges and Universities, 2013, p. 6) through the use of a number of metrics. It has also identified that its key goals in differentiating the post-secondary sector in Ontario are to “support student success and access to a high-quality Ontario postsecondary edu-cation, improve the global competitiveness of Ontario’s postsecondary education system, build on and help focus the well-established strengths of Ontario colleges and universi-ties while avoiding unnecessary duplication, [and] maintain an efficient and financially sustainable postsecondary education system” (Ontario Ministry of Training, Colleges and Universities, 2013, p. 9). Detailed implementation plans have not been developed as of January 2014.
While an in-depth analysis of the factors that contributed to the convergence of univer-sities in Ontario is beyond the scope of this study (for an analysis of factors that promoted or hindered processes of diversity in Ontario’s university sector, see Piché, 2015), broad policy implications will be considered here by drawing on the work of Codling and Meek (2006) and their observations of Australia’s and New Zealand’s higher education systems.
Codling and Meek (2006) contended that strong government policies are required to sustain differences between institutions. Without these policies, institutional convergence would occur when institutions were subjected to uniform environmental conditions. The Ontario government’s differentiation framework provides a foundation to further diver-sify the post-secondary sector by strategically managing institutional enrolment growth with provincial policies. The government will need to take a more central planning role that will recognize program strengths while accepting that universities cannot be every-thing to everyone. The Strategic Mandate Agreement process that unfolded in early 2014 recognizes the need for increased planning.
Codling and Meek (2006) also contended that financial incentives should have clear diversity objectives; the creation of a competitive environment promotes convergence tendencies, as institutions tend to copy one another in periods of increased financial re-sources. Diversification in Ontario’s university sector can be achieved only by providing the required incentives to autonomous institutions with clear diversity objectives (effi-ciency, effectiveness, accessibility, instructional quality, and/or research quality). This will require the government to prioritize its diversity objectives before allocating any funding.

CJHE / RCES Volume 45, No. 4, 2015
77Systemic and Climate Diversity / P. G. Piché
While funding policies could be individually determined for each university, “many differentiation frameworks cluster like-minded institutions into categories in that institu-tions share the same rights and responsibilities as others in their cluster” (Weingarten et al., 2013, p. 7). As previously illustrated through hierarchical cluster analysis (see Figure 3), institutions in Ontario can be grouped in three clusters. The University of Toronto is in a cluster of its own. The primarily undergraduate cluster includes Algoma, Redeemer, Dominican, Laurentian, Nipissing, Lakehead, Trent, OCAD, UOIT, Brock, Wilfrid Lau-rier, and Windsor; and the research-intensive cluster includes Guelph, Queen’s, Carleton, Waterloo, McMaster, Ottawa, Western, York, and Ryerson. It is understood that grouping institutions into three clusters may be contested by institutions, as these clusters were derived purely from a limited number of quantitative indicators without the benefit of any relevant qualitative factors (regional preferences or the need to address social or econom-ic benefits). A different funding formula could be determined for each cluster that would allocate funding on a competitive basis within each cluster (forcing the convergence of institutions within a cluster), with institutions providing detailed proposals (with perfor-mance indicators) while specifically addressing government diversity objectives set for each cluster. Proposals could be reviewed by an international panel of experts that would advise the government on funding allocations by institution. Different funding formu-las by cluster would also allow, for example, the primarily undergraduate cluster to be funded in such a way as to reduce class size, while the University of Toronto cluster could receive funding for its international graduate students.
Limitations and Future Research
This study quantitatively examined systemic and climate diversity in Ontario’s uni-versity sector. While the research design selected for this study does not permit the ex-trapolation of the results to other university sectors in Canada or elsewhere, the measure-ment methodology employed in this study could be applied in other university sectors in Canada in order to assess diversity from a pan-Canadian perspective. This approach and methodology could also be applied to other countries; in doing so, it would be necessary for researchers elsewhere to determine the variables that would be most relevant to the higher education policy context in their jurisdictions.
Future research in this area could consider whether this model can be applied to On-tario’s higher education system as a whole instead of being limited to its university sec-tor. The model could also be extended to consider the impact of satellite campuses on systemic and climate diversity by disaggregating institutional data by campus. A detailed examination of Ontario’s programmatic diversity through empirical analysis (see, for ex-ample, Lepori et al., 2014; Rossi, 2010; Teixeira et al., 2011) could also add to the limited literature of diversity and continue to fuel the debate about institutional diversity.
This study operationalized institutional climate from a student profile and experience perspective. Further studies may wish to consider a broader definition of institutional climate by considering other variables such as research intensity (number of publications or citations, share of federal granting council funding) or through an examination of in-stitutional missions that go beyond teaching and research.

CJHE / RCES Volume 45, No. 4, 2015
78Systemic and Climate Diversity / P. G. Piché
Acknowledgements
I would like to thank Professor Glen Jones, Professor Michael Skolnik, and Dr. Stacey Young for the guidance and thoughtful advice they gave throughout my doctoral studies that contributed to the overall quality of this study.
References
Altbach, P. G. (2002). Differentiation requires definition: The need for classification in complex academic systems. International Higher Education, 26, 2–3.
Astin, A. W. (1985). Achieving educational excellence. San Francisco, CA: Jossey-Bass.Astin, A. W. (1993). What matters in college: Four critical years revisited. San
Francisco, CA: Jossey-Bass.Birnbaum, R. (1983). Maintaining diversity in higher education. San Francisco, CA:
Jossey-Bass.Carnegie Classification of Institutions of Higher Learning. (n.d.-a). Classification
description: Enrollment profile classification. Retrieved from http://carnegieclassifications.iu.edu/descriptions/enrollment_profile.php
Carnegie Classification of Institutions of Higher Learning. (n.d.-b). Classification description: Size & setting. Retrieved from http://carnegieclassifications.iu.edu/descriptions/size_setting.php
Carnegie Classification of Institutions of Higher Learning. (n.d.-c). Classification description: Undergraduate profile classification. Retrieved from http://carnegieclassifications.iu.edu/descriptions/undergraduate_profile.php
Codling, A., & Meek, V. L. (2006). Twelve propositions on diversity in higher education. Higher Education Management and Policy, 18(3), 1–24.
DiMaggio, P. J., & Powell, W. W. (1983). The iron cage revisited: Institutional isomorphism and collective rationality in organizational fields. American Sociological Review, 48, 147–160.
Fallis, G. (2013). Rethinking higher education: Participation, research and differentiation. Montreal, QC, and Kingston, ON: Queen’s Policy Studies Series, McGill-Queen’s University Press.
Hannan, M. T., & Freeman, J. (1989). Organizational ecology. Cambridge, MA: Harvard University Press.
Hicks, M., Weingarten, H. P., Jonker, L., & Liu, S. (2013). The diversity of Ontario’s colleges: A data set to inform the differentiation discussion. Toronto, ON: Higher Education Quality Council of Ontario.
Huberty, C. J., Jordan, E. M., & Brandt, W. C. (2005). Cluster analysis in higher education research. In J. C. Smart (Ed.), Higher education: Handbook of theory and research, Vol. 20 (pp. 437–457). Dordecht, Netherlands: Springer.
Huisman, J. (1998). Differentiation and diversity in higher education systems. In J. C. Smart (Ed.), Higher education: Handbook of theory and research, Vol. 13 (pp. 75–110). New York, NY: Agathon Press.

CJHE / RCES Volume 45, No. 4, 2015
79Systemic and Climate Diversity / P. G. Piché
Huisman, J. (2000). Higher education institutions: As different as chalk and cheese? Higher Education Policy, 13(1), 41–53.
Huisman, J., Meek, L., & Wood, F. (2007). Institutional diversity in higher education: A cross-sectional and longitudinal analysis. Higher Education Quarterly, 61(4), 563–77.
Jacob, P. (1957). Changing values in college: An exploratory study of the impact of college teaching. New York, NY: Harper.
Johnson, S. C. (1967). Hierarchical clustering schemes. Psychometrika, 32(3), 241–254.
Jones, G. A. (1996). Diversity within a decentralized higher education system: The case for Canada. In V. L. Meek, L. Goedegebuure, O. Kivinen, & R. Rinne (Eds.), The mockers and mocked: Comparative perspectives on differentiation, convergence and diversity in higher education (pp. 79–94). Oxford, UK: Pergamon.
Jones, G. A. (2006). Canada. In J. J. F. Forest & P. G. Altbach (Eds.), International handbook of higher education, Pt. 1 (pp. 627–645). Dordecht, Netherlands: Springer.
Jones, G. A., & Young, S. J. (2004). “Madly off in all directions”: Higher education, marketization and Canadian federalism. In P. Teixeira, B. Jongbloed, D. D. Dill, & A. Amaral (Eds.), Markets and higher education (pp. 185–205). London, UK: Kluwer Academic Publishers.
Kokkelenberg, E. C., Dillon, M., & Christy, S. M. (2008). The effects of class size on student grades at a public university. Economics of Education Review, 27(2), 221–233.
Lepori, B., Huisman, J., & Seeber, M. (2014). Convergence and differentiation processes in Swiss higher education: An empirical analysis. Studies in Higher Education, 39(2), 197–218.
Lundberg, C. A., and Schreiner, L. A. (2004). Quality and frequency of faculty-student interactions as a predictor of learning: An analysis by student race/ethnicity. Journal of College Student Development, 45(5), 549–566.
Morphew, C. C. (2009). Conceptualizing change in the institutional diversity of U.S. colleges and universities. The Journal of Higher Education, 80(3), 243–269.
Ontario Ministry of Training, Colleges and Universities. (2013). Ontario’s differentiation policy framework for postsecondary education. Toronto, ON: Queen’s Printer for Ontario.
Orton, L. (2003). A new understanding of postsecondary education in Canada: A discussion paper. Ottawa, ON: Statistics Canada. Catalogue No. 81-595-MIE2003011.
Pascarella, E. T., & Terenzini, P. T. (1979). Student-faculty informal contact and college persistence: A further investigation. Journal of Educational Research, 72, 214–218.
Piché, P. G. (2015). Institutional diversity and funding universities in Ontario: Is there a link? Journal of Higher Education Policy and Management, 37(1), 52–68.
Rossi, F. (2010). Massification, competition and organizational diversity in higher education: Evidence from Italy. Studies in Higher Education, 35(3), 277–300.
Skolnik, M. L. (1986). Diversity in higher education: The Canadian case. Higher Education in Europe, 11(2), 19–32.

CJHE / RCES Volume 45, No. 4, 2015
80Systemic and Climate Diversity / P. G. Piché
Skolnik, M. L. (2005). A discussion of some issues pertaining to the structure of postsecondary education in Ontario and some suggestions for addressing them. College Quarterly, 8(1). Retrieved from http://collegequarterly.ca/index.html
Stanley, G., & Reynolds, P. (1994). Similarity grouping of Australian universities. Higher Education, 27(3), 359–366.
Teixeira, P. N., Rocha, V., Biscaia, R., & Cardoso, M. F. (2012). Competition and diversity in higher education: An empirical approach to specialization patterns of Portuguese institutions. Higher Education, 63(3), 337–352.
U-Map. (2011).Overview of indicators and data-elements, by dimension. Retrieved from http://www.u-map.eu/U-Map%20dimensions%20and%20indicators%20detail.pdf
Weingarten, H. P., Hicks, M., Jonker, L., & Liu, S. (2013). The diversity of Ontario’s universities: A data set to inform the differentiation discussion. Toronto, ON: Higher Education Quality Council of Ontario.
Wilson, R., Gaff, J., Dienst, E., Wood, L., & Bavry, J. (1975). College professors and their impact on students. New York, NY: Wiley & Sons.
Zha, Q. (2009). Diversification or homogenization: How governments and markets have combined to (re)shape Chinese higher education in its recent massification process. Higher Education, 58(1), 41–58.
Contact Information
Pierre Gilles PichéFinancial Services DepartmentUniversity of [email protected]
Pierre Gilles Piché is a chartered professional accountant and controller and director of financial services at the University of Toronto. He holds a doctor of philosophy degree in higher education from the University of Toronto. He is an active member of the Council of Ontario Finance Officers and the Canadian Association of University Business Officers. His research interests include issues of institutional diversity, finance, and accountability.