measuring tax gaps - 2016 edition - ragged university€¦ · income tax, national insurance ... 4...
TRANSCRIPT

Measuring tax gaps 2016 editionTax gap estimates for 2014-15
An Official Statistics release 20 October 2016

2 Measuring tax gaps 2016 edition
Introduction
3 Introduction
4 At a glance
6 1. Summary
24 2. VAT
33 3. Excise
3.1. Alcohol
3.2. Tobacco
3.3. Oils
3.4. Other excise duties
50 4. Income tax, National Insurance Contributions and Capital Gains Tax
64 5. Corporation Tax
76 6. Other taxes
80 Glossary
82 Abbreviations
83 Index of tables and figures
Contacts
Heather Whicker [email protected] 03000 589520
Andrea White [email protected] 03000 586372
HMRC Press Office (Individuals) 03000 585020 (Business) 03000 585028 Out-of-hours: 07860 359544
Contents
Look out for these icons throughout this report
Read more content online
Read more content within this report

HM Revenue and Customs 3
Introduction
What is the tax gap?
The ‘tax gap’ is the difference between the amount of tax that should, in theory, be collected by HMRC, against what is actually collected.
Why do we measure it?
The tax gap provides a useful tool for understanding the relative size and nature of non-compliance. This understanding can be applied in many different ways:
• Firstly, it provides a foundation for HMRC’s strategy. Thinking about the tax gap helps the department to understand how non-compliance occurs and how the causes can be addressed.
• Secondly, drawing on information on how other countries manage their tax gaps, our tax gap analysis provides insight into which strategies are most effective at reducing the tax gap.
• Thirdly, although the tax gap isn’t sufficiently timely or precise enough to set performance targets, it provides important information that helps us to understand our long-term performance.
Why is there a tax gap?
The tax gap reflects tax lost for a variety of reasons, from taxpayers simply not taking enough care with their tax returns to criminal attacks on the tax system.
How is it calculated?
It has been produced by government analysts working within HMRC, in line with the values, principles and protocols set out in the Code of Practice for Official Statistics. We use a range of internal and external data and different analytical techniques to produce annual estimates, which we revise as more accurate data becomes available. These are our best estimates based on the information available, but there are many sources of uncertainty and potential error.
6.5% The tax gap is estimated to be £36 billion, which is 6.5% of theoretical tax liabilities.

4 Measuring tax gaps 2016 edition
At a glance
6.5%Tax gap and percentage of theoretical tax liabilities: 2005-06 to 2014-15
UK tax gap at a glance in 2014-15
£0bn 2005-06 2006-07 2007-08 2008-09 2009-10 2010-11 2011-12 2012-13 2013-14
30
20
10
40
50
60
4.5
3.0
1.5
0%
6.0
7.5
9.0
£37
bn
£37
bn
£35
bn
£36
bn
£35
bn
£32
bn
£33
bn
£33
bn
£35
bn
8.3%
7.6%7.3% 7.2% 7.2%
6.8%6.6%
6.9% 6.9%
The tax gap is estimated to be £36 billion, which is 6.5% of theoretical tax liabilities.
2014-15
£36
bn
6.5%

HM Revenue and Customs 5
At a glance
What is the tax gap? The ‘tax gap’ is the difference between the amount of tax that should, in theory, be collected by HMRC, against what is actually collected.
Why measure it? Tax gap analysis helps us to understand the reasons for losses in the tax system.
How is it calculated? It’s an Official Statistic produced using many different approaches that have been endorsed by the International Monetary Fund.
The tax gap is difficult to measure — there are many sources of uncertainty and error. However, it gives an indication of our long-term performance — we have seen that the tax gap has decreased since 2005-06.
Value of the tax gap
By customer group
By type of tax
By behaviour
£15.5bn IT, NICs and CGT
£12.7bn Value Added Tax
£3.7bn
£18.3bn SMEs
£9.5bn
£4.8bn Criminals
£3.4bn Individuals
Corporation Tax
£2.8bn Excise duties
£1.3bn Other taxes
£5.2bn Legal interpretation
£6.2bn Hidden economy
£4.8bn Criminal attacks
£3.6bn Non-payment
£3.2bn Error
£5.5bn Failure to take reasonable care
Evasion
£2.2bn Avoidance
Large businesses
A full time series for tables is available on our website www.gov.uk/government/statistics/measuring-tax-gaps-tables
£5.2bn

6 Measuring tax gaps 2016 edition
Summary
Key findings
• The UK tax gap for 2014-15 is estimated at 6.5% of liabilities (£36 billion). The tax gap has reduced from 6.9% of liabilities in 2013-14.
• There is an overall downward trend from 8.3% in 2005-06 to 6.5% in 2014-15, however the tax gap has levelled out in recent years.
• The tax gap estimate of £36 billion is £11 billion lower than it would have been if the percentage tax gap had remained at the 2005-06 level of 8.3%.
• There has been a large reduction in the Pay As You Earn (PAYE) tax gap estimate from £4.0 billion in 2013-14 to £2.8 billion in 2014-15. The introduction of Real Time Information is likely to have made a significant contribution towards this reduction.
• The VAT tax gap is at its lowest level of 10.3% for 2014-15.
• There is a long-term reduction between 2005-06 and 2014-15 for the excise duty tax gap (8.0% to 5.3%) and the Corporation Tax gap (13.5% to 7.6%).
• The tax gap estimate for 2013-14 has been revised upwards by £2.8 billion. The latest data from random tax enquiries investigations suggests that the scale and amount of non-compliance is higher than we had previously estimated, particularly for Self Assessment customers. This revision is within the confidence interval of the previous year’s estimate.
Summary
HM Revenue and Customs 7
Summary
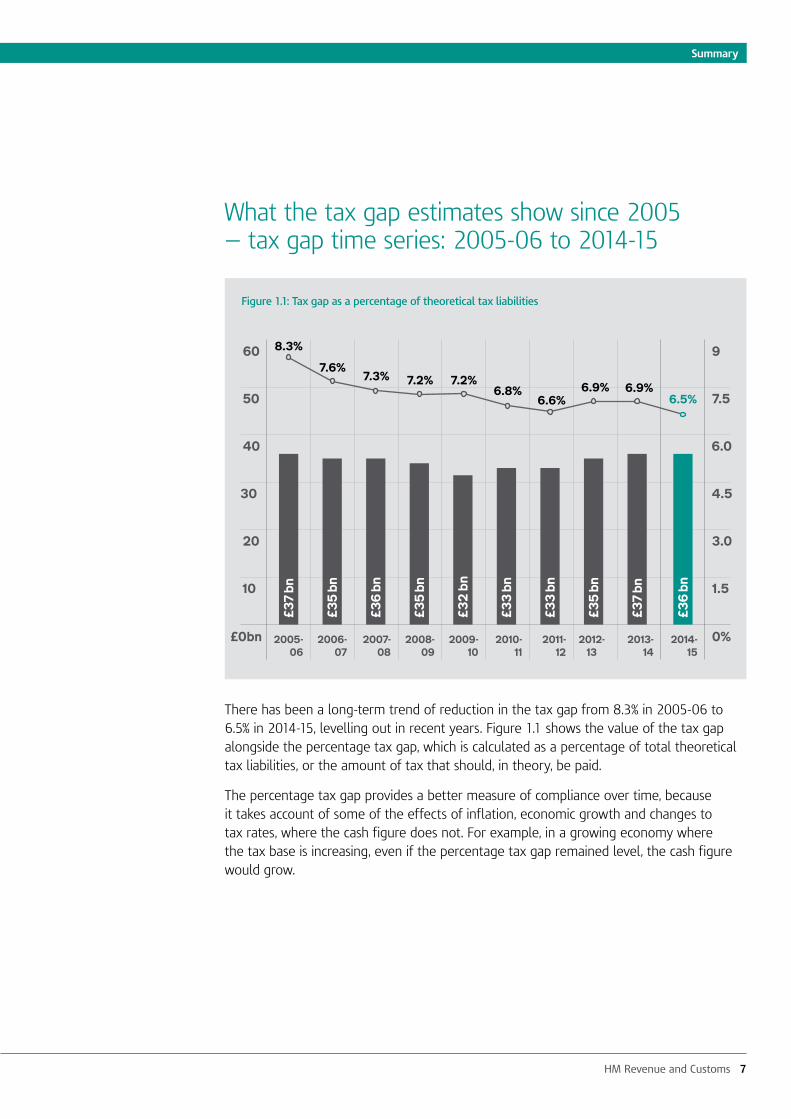
What the tax gap estimates show since 2005 — tax gap time series: 2005-06 to 2014-15
There has been a long-term trend of reduction in the tax gap from 8.3% in 2005-06 to 6.5% in 2014-15, levelling out in recent years. Figure 1.1 shows the value of the tax gap alongside the percentage tax gap, which is calculated as a percentage of total theoretical tax liabilities, or the amount of tax that should, in theory, be paid.
The percentage tax gap provides a better measure of compliance over time, because it takes account of some of the effects of inflation, economic growth and changes to tax rates, where the cash figure does not. For example, in a growing economy where the tax base is increasing, even if the percentage tax gap remained level, the cash figure would grow.
Figure 1.1: Tax gap as a percentage of theoretical tax liabilities
£0bn 2005-06
2006- 07
2007- 08
2008- 09
2009- 10
2010- 11
2011- 12
2012- 13
2013- 14
30
20
10
40
50
60
4.5
3.0
1.5
0%
6.0
7.5
9
£37
bn
£37
bn
£35
bn
£36
bn
£35
bn
£32
bn
£33
bn
£33
bn
£35
bn
8.3%
7.6%7.3% 7.2% 7.2%
6.8%6.6%
6.9% 6.9%
2014- 15
£36
bn
6.5%
8 Measuring tax gaps 2016 edition
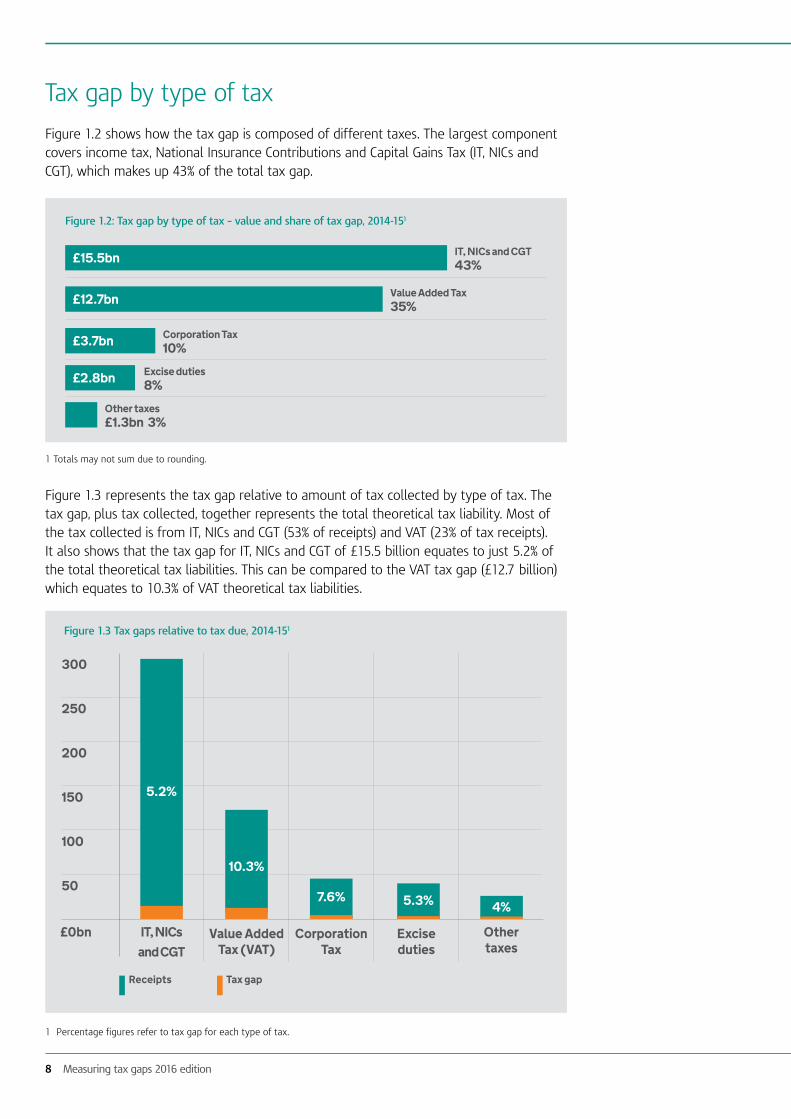
Tax gap by type of tax
Figure 1.2 shows how the tax gap is composed of different taxes. The largest component covers income tax, National Insurance Contributions and Capital Gains Tax (IT, NICs and CGT), which makes up 43% of the total tax gap.
1 Totals may not sum due to rounding.
Figure 1.3 represents the tax gap relative to amount of tax collected by type of tax. The tax gap, plus tax collected, together represents the total theoretical tax liability. Most of the tax collected is from IT, NICs and CGT (53% of receipts) and VAT (23% of tax receipts). It also shows that the tax gap for IT, NICs and CGT of £15.5 billion equates to just 5.2% of the total theoretical tax liabilities. This can be compared to the VAT tax gap (£12.7 billion) which equates to 10.3% of VAT theoretical tax liabilities.
1 Percentage figures refer to tax gap for each type of tax.
£15.5bn
£12.7bn
£3.7bn
£2.8bn
Figure 1.2: Tax gap by type of tax – value and share of tax gap, 2014-151
IT, NICs and CGT43%
Value Added Tax35%
Corporation Tax10%
Excise duties8%
Other taxes£1.3bn 3%
Receipts Tax gap
Figure 1.3 Tax gaps relative to tax due, 2014-151
IT, NICs and CGT
Value Added Tax (VAT)
Corporation Tax
Excise duties
Other taxes
£0bn
50
100
150
200
250
300
5.2%
10.3%
7.6% 5.3% 4%
HM Revenue and Customs 9
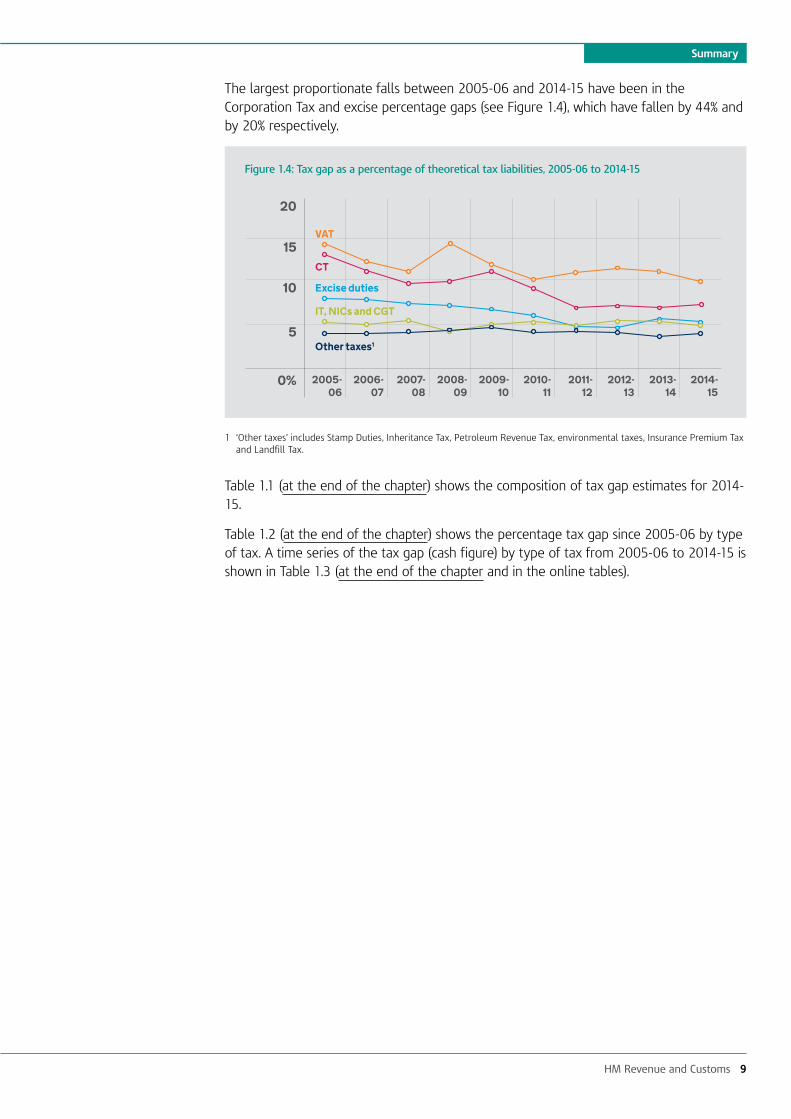
The largest proportionate falls between 2005-06 and 2014-15 have been in the Corporation Tax and excise percentage gaps (see Figure 1.4), which have fallen by 44% and by 20% respectively.
1 ‘Other taxes’ includes Stamp Duties, Inheritance Tax, Petroleum Revenue Tax, environmental taxes, Insurance Premium Tax and Landfill Tax.
Table 1.1 (at the end of the chapter) shows the composition of tax gap estimates for 2014-15.
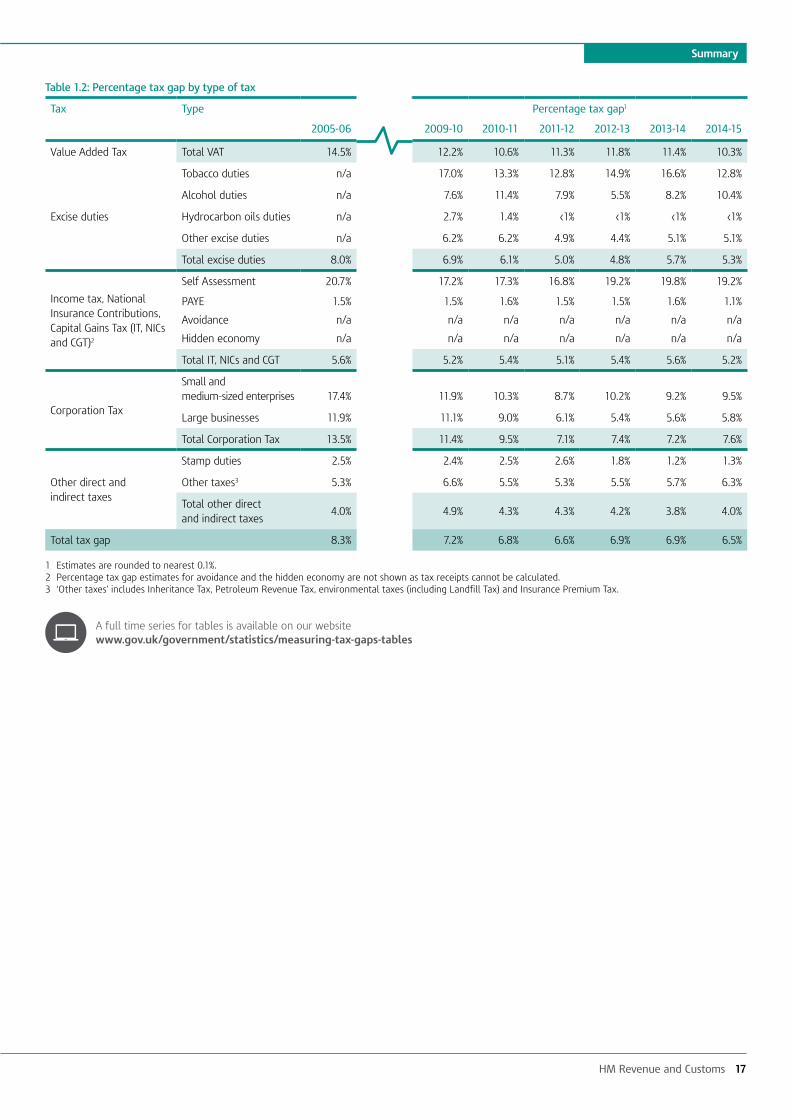
Table 1.2 (at the end of the chapter) shows the percentage tax gap since 2005-06 by type of tax. A time series of the tax gap (cash figure) by type of tax from 2005-06 to 2014-15 is shown in Table 1.3 (at the end of the chapter and in the online tables).
Summary
Figure 1.4: Tax gap as a percentage of theoretical tax liabilities, 2005-06 to 2014-15
10
5
CT
VAT
0%
Excise duties
IT, NICs and CGT
Other taxes1
15
2005-06
2006-07
2007-08
2008-09
2009-10
2010- 11
2011- 12
2012- 13
2013- 14
2014- 15
20

10 Measuring tax gaps 2016 edition
Tax gap by customer group
Figure 1.5 shows estimates of the 2013-14 and 2014-15 tax gaps by customer group. Just over half of the 2014-15 tax gap can be attributed to small and medium-sized enterprises, known as SMEs and just over a quarter from large businesses. The remainder is split between criminals and individuals. An element of judgement is used in compiling these estimates.
1 Totals may not sum due to rounding.
Table 1.4 (at the end of the chapter) shows a time series of tax gap by customer group, as a percentage of total theoretical tax liabilities. This shows that the breakdown of the tax gap by customer group over the past five years has been broadly stable.
Figure 1.5: Tax gap by customer group — value and share of tax gap, 2013-14 and 2014-151
2013-14
SMEs£18.6bn 51%
Large business£9.5bn 26%
Criminals£5.5bn 15%
Individuals£3.2bn 9%
2014-15
SMEs£18.3bn 51%
Large business£9.5bn 26%
Criminals£4.8bn 13%
Individuals£3.4bn 10%

HM Revenue and Customs 11
Tax gap by behaviour
The tax gap covers a range of behaviours which include: the tax that is lost through non-payment, use of avoidance schemes, interpretation of the tax effects of complex transactions, error, failure to take reasonable care, evasion, the hidden economy and criminal attack on the tax system.
Figure 1.6 shows an estimate of taxpayer behaviours within the tax gaps for 2014-15. These estimates give a broad indication of behaviours and are calculated using assumptions and judgment.
The behaviours are defined in Table 1.7 (at the end of the chapter).
Table 1.5 (at the end of the chapter) shows a time series of tax gap by behaviour. As with the headline figures, the percentage tax gap for behaviours provides a better measure of compliance over time, because it takes account of some of the effects of changes to tax base. It shows that non-compliant customer behaviours over the past five years have been broadly consistent across the behaviours, with some downward movement in criminal attacks, avoidance and non-payment.
We do not have a comparable series for all elements prior to 2009-10. However, reductions in successful criminal attacks on the tax system and avoidance are the main behavioural reasons for the reduction in the tax gap since 2005-06.
Summary
Figure 1.6: Tax gap by behaviour — value and share of tax gap, 2014-15
£4.8bn
£5.2bn
£6.2bn
£2.2bn
£5.2bn
£3.6bn
£5.5bn
£3.2bn
Criminal attacks13%
Evasion14%
Hidden economy 17%
Avoidance6%
Legal interpretation15%
Non-payment10%
Failure to take reasonable care 15%
Error9%

12 Measuring tax gaps 2016 edition
Avoidance
Avoidance is bending the rules of the tax system to gain a tax advantage that Parliament never intended. It often involves contrived, artificial transactions that serve little or no purpose other than to produce a tax advantage. It involves operating within the letter but not the spirit of the law.
The published avoidance tax gap is an annual estimate of the tax lost to the UK due to avoidance schemes. These estimates reflect the laws that were in place at the time and do not include any subsequent changes to the tax law to prevent further use of avoidance schemes.
The estimated avoidance tax gap was £2.2 billion for 2014-15. Figure 1.7 shows how this is split by type of tax. Table 1.6 (at the end of the chapter) shows the breakdown of the avoidance tax gap by type of tax for 2012-13 to 2014-15. The estimate for 2013-14 published last year was £2.7 billion, but has been revised down to £2.4 billion as data sources have improved and more recent data is used.
1 ‘Other direct taxes’ includes stamp duties, Inheritance Tax and Petroleum Revenue Tax.
The definition of avoidance used to produce the tax gap estimates is described in Table 1.7 (at the end of the chapter).
The methodologies used to produce the avoidance tax gap estimates differ according to the type of tax. They are summarised in the relevant chapters and in the ‘Methodological annex’ published alongside this document.
The methodological annex is available on our website www.gov.uk/government/statistics/measuring-tax-gaps
Tax gap measurement
Definition
The ‘tax gap’ is the difference between the amount of tax that should, in theory, be collected by HMRC, against what is actually collected. The ‘theoretical tax liability’ represents the tax that would be paid if all individuals and companies complied with both the letter of the law and our interpretation of Parliament’s intention in setting law (referred to as the spirit of the law). The total theoretical tax liability is calculated as the tax gap plus the amount of tax actually received, from HMRC receipts.
Figure 1.7 Avoidance tax gap by type of tax, 2014-15 (£ billion)
IT, NICs and CGT£1.3bn
Corporation Tax£0.7bn
VAT£0.1bn
Other direct taxes1
>£0.1bn

HM Revenue and Customs 13
Summary
The tax gap estimates only cover the taxes administered by HMRC, so exclude taxes and duties administered elsewhere (council tax, business rates, congestion charge and vehicle excise duty). These estimates also exclude error and fraud in tax credits.
Tax gaps are calculated net of compliance yield, that is, they reflect the gap remaining after our compliance efforts. More information on compliance yield is available in HMRC’s Annual Report and Accounts. The ‘Methodological annex’ sets out how compliance yield is reflected in estimation for each component of the tax gap. Information in HMRC’s Annual Report and Accounts and Measuring Tax Gap publication are not directly comparable.
The annual report and accounts is available on our website www.gov.uk/government/collections/hmrcs-annual-report-and-accounts
Measurement methods
VAT and Excise tax gaps are estimated using a ‘top-down’ approach by comparing consumption expenditure data with tax receipts. Most other components are estimated using a ‘bottom-up’ approach building up from our own operational data and management information. The way we estimate each tax gap component and the data we use is set out in the relevant chapters, with additional information in the ‘Methodological annex’.
The methodological annex is available on our website www.gov.uk/government/statistics/measuring-tax-gaps
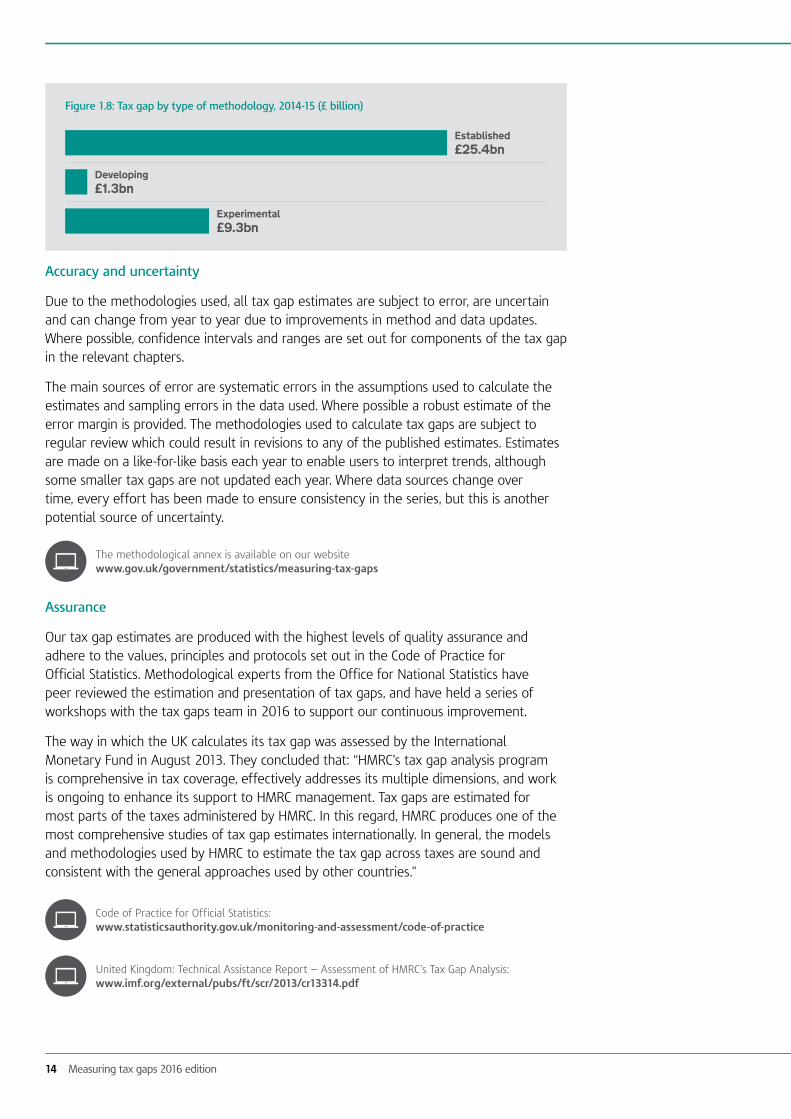
Figure 1.8 shows that more than two-thirds of the 2014-15 tax gap is estimated using established methods. Developing methods are used where new data sources are emerging which can be used to estimate tax gaps, but the sources and methods are not yet established and replicable. Experimental methodologies are used to produce illustrative estimates where there is no direct measurement data. Illustrative estimates are calculated using the best available data, simple models and assumptions.
Top-down estimates
Independent, external data on consumption is used to estimate tax base.
This tax base is used to calculate a theoretical value of tax that should be collected.
The actual amount of tax collected is subtracted from this theoretical value to estimate the tax gap.
These estimates are combined to estimate the tax gap
Different methods and data sources are used, depending on best available, to estimate how much tax is lost within each area
HMRC uses internal data and operational knowledge to identify areas of potential tax loss
Bottom-up estimates
Tax Gap Measurement – the Error and Fraud in Tax Credits publication can be found here: www.gov.uk/government/statistics/child-and-working-tax-credits-error-and-fraud-statistics-2014-to-2015
14 Measuring tax gaps 2016 edition
Accuracy and uncertainty
Due to the methodologies used, all tax gap estimates are subject to error, are uncertain and can change from year to year due to improvements in method and data updates. Where possible, confidence intervals and ranges are set out for components of the tax gap in the relevant chapters.
The main sources of error are systematic errors in the assumptions used to calculate the estimates and sampling errors in the data used. Where possible a robust estimate of the error margin is provided. The methodologies used to calculate tax gaps are subject to regular review which could result in revisions to any of the published estimates. Estimates are made on a like-for-like basis each year to enable users to interpret trends, although some smaller tax gaps are not updated each year. Where data sources change over time, every effort has been made to ensure consistency in the series, but this is another potential source of uncertainty.
The methodological annex is available on our website www.gov.uk/government/statistics/measuring-tax-gaps
Assurance
Our tax gap estimates are produced with the highest levels of quality assurance and adhere to the values, principles and protocols set out in the Code of Practice for Official Statistics. Methodological experts from the Office for National Statistics have peer reviewed the estimation and presentation of tax gaps, and have held a series of workshops with the tax gaps team in 2016 to support our continuous improvement.
The way in which the UK calculates its tax gap was assessed by the International Monetary Fund in August 2013. They concluded that: “HMRC’s tax gap analysis program is comprehensive in tax coverage, effectively addresses its multiple dimensions, and work is ongoing to enhance its support to HMRC management. Tax gaps are estimated for most parts of the taxes administered by HMRC. In this regard, HMRC produces one of the most comprehensive studies of tax gap estimates internationally. In general, the models and methodologies used by HMRC to estimate the tax gap across taxes are sound and consistent with the general approaches used by other countries.”
Code of Practice for Official Statistics: www.statisticsauthority.gov.uk/monitoring-and-assessment/code-of-practice
United Kingdom: Technical Assistance Report — Assessment of HMRC’s Tax Gap Analysis: www.imf.org/external/pubs/ft/scr/2013/cr13314.pdf
Figure 1.8: Tax gap by type of methodology, 2014-15 (£ billion)
Established£25.4bn
Developing£1.3bn
Experimental£9.3bn

HM Revenue and Customs 15
Summary
Revisions to tax gap estimates
Many tax gap component estimates have been revised since ‘Measuring tax gaps 2015 edition’. This is due to improvements in the way they are calculated, the availability of more up-to-date data and projections based on more recent years. This is in line with the best statistical practice.
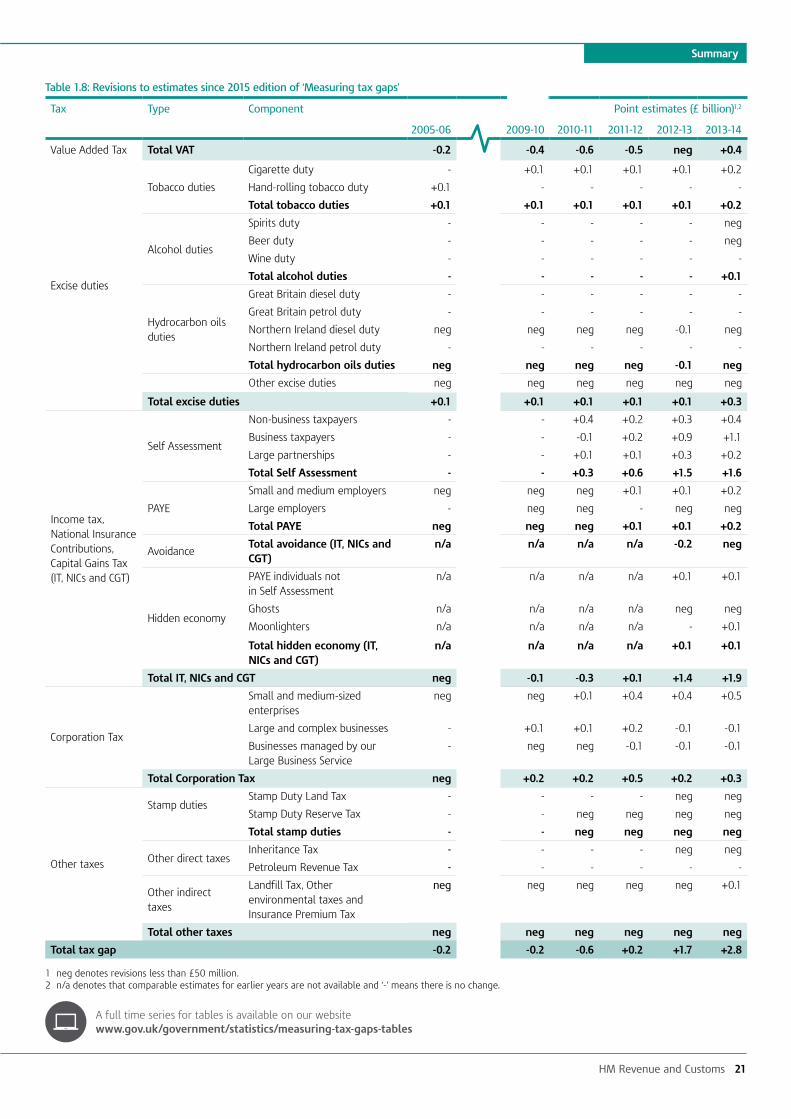
Table 1.8 (at the end of the chapter) summarises the amount of revisions for each component of the tax gap and Table 1.9 (at the end of the chapter) summarises the reasons. Further information is available within the relevant chapters.
Figure 1.9 shows the revisions made to the overall tax gap estimates for editions published since ‘Measuring tax gaps 2010’. This illustrates the uncertainty around the estimation of tax gaps, which are best used as a long-term indicator.
1 MTG stands for ‘Measuring tax gaps’
Figure 1.9: Revisions to the tax gap as a percentage of theoretical tax liabilities compared to previous editions1
8
MTG 2010
0%
9
2005-06
2006-07
2007-08
2008-09
2009-10
2010- 11
2011- 12
2012- 13
2013- 14
2014- 15
10
7
6
5
4
3
2
1
MTG 2011
MTG 2012
MTG 2013
MTG 2014 MTG 2015
MTG 2016

16 Measuring tax gaps 2016 edition
Table 1.1: Tax gap components
Tax Type Component 2014-15
Percentage tax gap1 Point estimate (£ billion)2
Value Added Tax Total VAT 10.3% 12.7
Excise duties3
Tobacco duties
Cigarette duty 7% 0.7
Hand-rolling tobacco duty 35% 0.7
Total tobacco duties 12.8% 1.4
Alcohol duties
Spirits duty 12% 0.4Beer duty 15% 0.7Wine duty 3% 0.1Total alcohol duties 10.4% 1.2
Hydrocarbon oils duties
Total hydrocarbon oils duties <1% <0.1
Other excise duties3 5% 0.1
Total excise duties3 5.3% 2.8
Income tax, National Insurance Contributions, Capital Gains Tax (IT, NICs and CGT)
Self Assessment
Non-business taxpayers 8% 1.0
Business taxpayers 26% 5.0
Large partnerships 11% 1.0
Total Self Assessment 19.2% 7.0
PAYE
Small and medium employers 1% 0.9
Large employers 1% 1.9
Total PAYE 1.1% 2.8
Avoidance Total avoidance (IT, NICs and CGT) n/a 1.3
Hidden economy
PAYE individuals not in Self Assessment n/a 1.2
Ghosts n/a 1.2
Moonlighters n/a 2.0
Total hidden economy (IT, NICs and CGT) n/a 4.4
Total IT, NICs and CGT 5.2% 15.5
Corporation Tax
Small and medium-sized enterprises 10% 2.2
Large businesses4 6% 1.5
Total Corporation Tax 7.6% 3.7
Other taxes
Stamp duties
Stamp Duty Land Tax 1% 0.2
Stamp Duty Reserve Tax 1% <0.1
Total stamp duties 1.3% 0.2
Other direct taxesInheritance Tax 11% 0.5
Petroleum Revenue Tax 2% <0.1
Other indirect taxes Landfill Tax 12% 0.1
Environmental taxes, Insurance Premium Tax 4% 0.5
Total other taxes 4.0% 1.3
Total tax gap5 6.5% 36
1 Tax gap as a proportion of theoretical tax liability which is defined as the tax gap plus the amount of tax actually received. Total percentage tax gap estimates are rounded to the nearest 0.1% with individual estimates rounded to the nearest 1%. Percentages cannot be calculated for components where there is no measure of the corresponding liability.
2 The overall tax gap is rounded to the nearest £1 billion. Other estimates are rounded to the nearest £100 million.3 All excise tax gap point estimates are for duty only. Percentage tax gaps for total tobacco, total alcohol, total hydrocarbon oils and other excise are also duty only.
Percentage tax gaps for cigarette, hand-rolling tobacco, spirits, beer and wine are for combined duty and VAT.4 The Corporation Tax gap estimate for large businesses is derived from two methodologies. An established methodology exists for businesses managed by our Large
Business Service and an experimental methodology is used for businesses managed by HMRC’s Large and Complex unit.5 We will be looking to incorporate emerging data sources as a result of offshore disclosure facilities and related work.
Developing methodology.
Experimental methodology, illustrative indicators for gaps with no direct measure.
HM Revenue and Customs 17
Summary
Table 1.2: Percentage tax gap by type of tax
Tax Type Percentage tax gap1
2005-06 2009-10 2010-11 2011-12 2012-13 2013-14 2014-15
Value Added Tax Total VAT 14.5% 12.2% 10.6% 11.3% 11.8% 11.4% 10.3%
Excise duties
Tobacco duties n/a 17.0% 13.3% 12.8% 14.9% 16.6% 12.8%
Alcohol duties n/a 7.6% 11.4% 7.9% 5.5% 8.2% 10.4%
Hydrocarbon oils duties n/a 2.7% 1.4% <1% <1% <1% <1%
Other excise duties n/a 6.2% 6.2% 4.9% 4.4% 5.1% 5.1%
Total excise duties 8.0% 6.9% 6.1% 5.0% 4.8% 5.7% 5.3%
Income tax, National Insurance Contributions, Capital Gains Tax (IT, NICs and CGT)2
Self Assessment 20.7% 17.2% 17.3% 16.8% 19.2% 19.8% 19.2%
PAYE 1.5% 1.5% 1.6% 1.5% 1.5% 1.6% 1.1%
Avoidance n/a n/a n/a n/a n/a n/a n/a
Hidden economy n/a n/a n/a n/a n/a n/a n/a
Total IT, NICs and CGT 5.6% 5.2% 5.4% 5.1% 5.4% 5.6% 5.2%
Corporation Tax
Small and medium-sized enterprises 17.4% 11.9% 10.3% 8.7% 10.2% 9.2% 9.5%
Large businesses 11.9% 11.1% 9.0% 6.1% 5.4% 5.6% 5.8%
Total Corporation Tax 13.5% 11.4% 9.5% 7.1% 7.4% 7.2% 7.6%
Other direct and indirect taxes
Stamp duties 2.5% 2.4% 2.5% 2.6% 1.8% 1.2% 1.3%
Other taxes3 5.3% 6.6% 5.5% 5.3% 5.5% 5.7% 6.3%
Total other direct and indirect taxes
4.0% 4.9% 4.3% 4.3% 4.2% 3.8% 4.0%
Total tax gap 8.3% 7.2% 6.8% 6.6% 6.9% 6.9% 6.5%
1 Estimates are rounded to nearest 0.1%.2 Percentage tax gap estimates for avoidance and the hidden economy are not shown as tax receipts cannot be calculated. 3 ‘Other taxes’ includes Inheritance Tax, Petroleum Revenue Tax, environmental taxes (including Landfill Tax) and Insurance Premium Tax.
A full time series for tables is available on our website www.gov.uk/government/statistics/measuring-tax-gaps-tables

18 Measuring tax gaps 2016 edition
Table 1.3: Tax gap (cash figure) by type of tax
Tax Type Point estimates (£ billion)1
2005-06 2009-10 2010-11 2011-12 2012-13 2013-14 2014-15
Value Added Tax Total VAT 12.3 9.9 10.1 12.5 13.5 13.5 12.7
Excise duties
Tobacco duties 2.2 1.8 1.4 1.4 1.7 1.9 1.4
Alcohol duties 0.5 0.7 1.2 0.8 0.6 0.9 1.2
Hydrocarbon oils duties 0.7 0.7 0.4 0.2 <0.1 <0.1 <0.1
Other excise duties 0.1 0.1 0.1 0.1 0.1 0.1 0.1
Total excise duties 3.5 3.4 3.1 2.5 2.4 3.0 2.8
Income tax,
National Insurance Contributions,
Capital Gains Tax (IT, NICs and CGT)2
Self Assessment 5.5 5.0 5.4 5.0 5.9 6.2 7.0
PAYE 3.1 3.2 3.7 3.6 3.5 4.0 2.8
Avoidance n/a n/a n/a n/a 1.2 1.4 1.3
Hidden economy n/a n/a n/a n/a 4.3 4.3 4.4
Total IT, NICs and CGT 13.1 13.4 14.4 13.9 14.8 15.9 15.5
Corporation Tax
Small and medium- sized enterprises 2.6 1.9 1.7 1.7 1.9 1.8 2.2
Large businesses 4.1 2.8 2.8 1.8 1.5 1.4 1.5
Total Corporation Tax 6.6 4.7 4.5 3.4 3.3 3.3 3.7
Other direct and indirect taxes
Stamp duties 0.3 0.2 0.2 0.2 0.2 0.2 0.2
Other taxes3 0.7 0.8 0.8 0.9 0.9 1.0 1.1
Total other direct and indirect taxes
1.0 1.0 1.0 1.1 1.1 1.1 1.3
Total tax gap 37 32 33 33 35 37 36
Total theoretical tax liabilities 439 447 487 506 509 530 551
Total percentage tax gap (%) 8.3% 7.2% 6.8% 6.6% 6.9% 6.9% 6.5%
1 The overall tax gap is rounded to the nearest £1 billion. Other estimates are rounded to the nearest £100 million. Figures may not appear to sum due to rounding.
2 Tax gap estimates for avoidance and the hidden economy are not shown prior to 2012-13.3 ‘Other taxes’ includes Inheritance Tax, Petroleum Revenue Tax, environmental taxes (including Landfill Tax) and Insurance Premium Tax.
Estimates for these years are projections and will be revised when operational data becomes available.
A full time series for tables is available on our website www.gov.uk/government/statistics/measuring-tax-gaps-tables

HM Revenue and Customs 19
Summary
Table 1.4: Tax gap time series by customer group, percentage of total theoretical tax liabilities
Customer group Percentage tax gap
2009-10 2010-11 2011-12 2012-13 2013-14 2014-15
Small and medium-sized enterprises 3.4% 3.3% 3.3% 3.5% 3.5% 3.3%
Large business 1.9% 1.8% 1.8% 1.9% 1.8% 1.7%
Criminals 1.3% 1.1% 1.0% 0.9% 1.0% 0.9%
Individuals 0.6% 0.6% 0.6% 0.6% 0.6% 0.6%
Total 7.2% 6.8% 6.6% 6.9% 6.9% 6.5%
Table 1.5: Tax gap time series by behaviour, percentage of total theoretical tax liabilities and £ billion
Behaviour Percentage tax gap
2009-10 2010-11 2011-12 2012-13 2013-14 2014-15
% £bn % £bn % £bn % £bn % £bn % £bn
Criminal attacks 1.3% 5.9 1.1% 5.6 1.0% 5.0 0.9% 4.7 1.0% 5.5 0.9% 4.8
Evasion 0.8% 3.8 0.9% 4.3 0.9% 4.4 1.0% 4.9 1.0% 5.1 0.9% 5.2
Hidden economy 1.1% 4.8 1.1% 5.2 1.1% 5.7 1.2% 6.3 1.2% 6.4 1.1% 6.2
Avoidance 0.7% 2.9 0.7% 3.5 0.5% 2.5 0.4% 2.2 0.5% 2.4 0.4% 2.2
Legal interpretation 1.0% 4.5 0.9% 4.4 0.9% 4.7 1.0% 5.1 1.0% 5.1 1.0% 5.2
Non-payment 1.0% 4.5 0.8% 3.8 0.9% 4.5 0.8% 4.0 0.8% 4.1 0.7% 3.6
Failure to take reasonable care
0.8% 3.7 0.8% 4.0 0.8% 4.0 0.9% 4.8 1.0% 5.1 1.0% 5.5
Error 0.5% 2.3 0.5% 2.4 0.5% 2.7 0.6% 3.1 0.6% 3.1 0.6% 3.2
Total 7.2% 32 6.8% 33 6.6% 33 6.9% 35 6.9% 37 6.5% 36
Table 1.6: Avoidance tax gap by type of tax (£ billion)
Type of tax 2012-13 2013-14 2014-15
IT, NICs and CGT 1.2 1.4 1.3
Corporation Tax 0.8 0.8 0.7
VAT 0.1 0.2 0.1
Other direct taxes1 0.1 0.1 <0.1
Total2 2.2 2.4 2.2
1 ‘Other direct taxes’ includes stamp duties, Inheritance Tax and Petroleum Revenue Tax.2 Figures may not appear to sum due to rounding.

20 Measuring tax gaps 2016 edition
Table 1.7: Description of behaviours
Behaviour Description
Criminal attacks Organised criminal gangs undertake co-ordinated and systematic attacks on the tax system. This includes smuggling goods such as alcohol or tobacco, VAT repayment fraud and VAT Missing Trader Intra-Community (MTIC) fraud.
Evasion Tax evasion is illegal activity, where registered individuals or businesses deliberately omit, conceal or misrepresent information in order to reduce their tax liabilities.
Hidden economy Undeclared economic activity that involves what we call ‘ghosts’ – whose entire income is unknown to HMRC, and ‘moonlighters’ – who are known to us in relation to part of their income, but have other sources of income that HMRC does not know about. There is a difference between the hidden economy and tax evasion:
• Hidden economy – where an entire source of income is not declared.
• Tax evasion – where a declared net source of income is deliberately understated.
Avoidance Avoidance is exploiting the tax rules to gain a tax advantage that Parliament never intended. It often involves contrived, artificial transactions that serve little or no commercial purpose other than to produce a tax advantage. It involves operating within the letter but not the spirit of the law.
It does not include international tax arrangements that cannot be challenged under the UK law, including some forms of base erosion and profit shifting (BEPS). These are being addressed multilaterally through the Organisation for Economic Co-operation and Development (OECD). The OECD defines BEPS as “tax planning strategies that exploit gaps and mismatches in tax rules to make profits disappear for tax purposes or to shift profits to locations where there is little or no real activity but the taxes are low resulting in little or no overall corporate tax being paid”.
Tax avoidance is not the same as tax planning. Tax planning involves using tax reliefs for the purpose for which they were intended. For example, claiming tax relief on capital investment, saving in a tax-exempt ISA or saving for retirement by making contributions to a pension scheme are all forms of tax planning.
Legal interpretation
Legal interpretation losses arise where the customer’s and HMRC’s interpretation of the law and how it applies to the facts in a particular case, result in a different tax outcome. Examples include the correct categorisation of an asset for allowances, the allocation of profits within a group of companies, or VAT liability of a particular supply.
Non-payment For direct taxes, non-payment refers to tax debts that are written off by HMRC and result in a permanent loss of tax – mainly as a result of insolvency. It does not include debts that are eventually paid.
VAT non-payment differs as it is based on the difference between new debts arising and debt payments (see Chapter 2 of the main publication).
Failure to take reasonable care
Failure to take reasonable care results from a customer’s carelessness and/or negligence in adequately recording their transactions and/or in preparing their tax returns. Judgments of ‘reasonable care’ should consider and reflect a customer’s knowledge, abilities and circumstances.
Error Errors result from mistakes made in preparing tax calculations, completing returns or in supplying other relevant information, despite the customer taking reasonable care.
HM Revenue and Customs 21
Summary
Table 1.8: Revisions to estimates since 2015 edition of ‘Measuring tax gaps’
Tax Type Component Point estimates (£ billion)1,2
2005-06 2009-10 2010-11 2011-12 2012-13 2013-14
Value Added Tax Total VAT -0.2 -0.4 -0.6 -0.5 neg +0.4
Excise duties
Tobacco duties
Cigarette duty - +0.1 +0.1 +0.1 +0.1 +0.2
Hand-rolling tobacco duty +0.1 - - - - -
Total tobacco duties +0.1 +0.1 +0.1 +0.1 +0.1 +0.2
Alcohol duties
Spirits duty - - - - - neg
Beer duty - - - - - neg
Wine duty - - - - - -
Total alcohol duties - - - - - +0.1
Hydrocarbon oils duties
Great Britain diesel duty - - - - - -
Great Britain petrol duty - - - - - -
Northern Ireland diesel duty neg neg neg neg -0.1 neg
Northern Ireland petrol duty - - - - - -
Total hydrocarbon oils duties neg neg neg neg -0.1 neg
Other excise duties neg neg neg neg neg neg
Total excise duties +0.1 +0.1 +0.1 +0.1 +0.1 +0.3
Income tax, National Insurance Contributions, Capital Gains Tax (IT, NICs and CGT)
Self Assessment
Non-business taxpayers - - +0.4 +0.2 +0.3 +0.4
Business taxpayers - - -0.1 +0.2 +0.9 +1.1
Large partnerships - - +0.1 +0.1 +0.3 +0.2
Total Self Assessment - - +0.3 +0.6 +1.5 +1.6
PAYE
Small and medium employers neg neg neg +0.1 +0.1 +0.2
Large employers - neg neg - neg neg
Total PAYE neg neg neg +0.1 +0.1 +0.2
AvoidanceTotal avoidance (IT, NICs and CGT)
n/a n/a n/a n/a -0.2 neg
Hidden economy
PAYE individuals not in Self Assessment
n/a n/a n/a n/a +0.1 +0.1
Ghosts n/a n/a n/a n/a neg neg
Moonlighters n/a n/a n/a n/a - +0.1
Total hidden economy (IT, NICs and CGT)
n/a n/a n/a n/a +0.1 +0.1
Total IT, NICs and CGT neg -0.1 -0.3 +0.1 +1.4 +1.9
Corporation Tax
Small and medium-sized enterprises
neg neg +0.1 +0.4 +0.4 +0.5
Large and complex businesses - +0.1 +0.1 +0.2 -0.1 -0.1
Businesses managed by our Large Business Service
- neg neg -0.1 -0.1 -0.1
Total Corporation Tax neg +0.2 +0.2 +0.5 +0.2 +0.3
Other taxes
Stamp dutiesStamp Duty Land Tax - - - - neg neg
Stamp Duty Reserve Tax - - neg neg neg neg
Total stamp duties - - neg neg neg neg
Other direct taxesInheritance Tax - - - - neg neg
Petroleum Revenue Tax - - - - - -
Other indirect taxes
Landfill Tax, Other environmental taxes and Insurance Premium Tax
neg neg neg neg neg +0.1
Total other taxes neg neg neg neg neg neg
Total tax gap -0.2 -0.2 -0.6 +0.2 +1.7 +2.8
1 neg denotes revisions less than £50 million.2 n/a denotes that comparable estimates for earlier years are not available and ‘-’ means there is no change.
A full time series for tables is available on our website www.gov.uk/government/statistics/measuring-tax-gaps-tables

22 Measuring tax gaps 2016 edition
Table 1.9: Description of revisions since last edition
Tax gap component Revisions
Value Added Tax Revisions have been made to the VAT gap estimates since last year’s publication ‘Measuring tax gaps 2015 edition’. This has resulted in a decrease in the level of the VAT gap for all years except 2012-13, which had a negligible increase, and 2013-14 which had an increase of £400 million (see Figure 2.5 in Chapter 2).
These revisions are a result of incorporating new and revised independent data from the Office for National Statistics and methodological improvements. For more detail, see the ‘Revisions’ section in Chapter 2.
Excise duties and other indirect taxes
Alcohol New data for final quarter alcohol consumption in 2013-14 has become available. The alcohol tax gap figures for 2013-14 have been revised as a result. Final quarter consumption for 2014-15 are forecasted and estimates should be considered provisional.
Due to changes in underlying data sources used to estimate commercial wine consumption the 2013-14 and 2014-15 tax gaps were not possible to estimate directly. An illustrative example has been provided for 2013-14 and 2014-15 using the average of the 2011-12 and 2012-13 estimates.
Tobacco Updated information became available on the number of people who falsely deny whether they smoke, which we have used to update the tax gap series.
Income tax, National Insurance Contributions, Capitals Gains Tax
Self Assessment (SA) We have made substantial revisions to SA data due to an improved casework management system being used to record compliance yield, better data capture and replacing projections with actual data.
2010-11 and 2011-12 are revised due to:
• an improved casework management system being used to record compliance yield for random enquiry programme cases, and better data capture
• long-running cases relating to these years that were previously open and had to have their outcomes forecast, have now been settled
• data on small partnerships has been smoothed from 2010-11, due to the sampling approach for this strata.
2012-13 is revised as it is now using actual data rather than being projected from the 2011-12 estimate.
2013-14 is revised as it is now projected from the 2012-13 estimate rather than from the 2011-12 estimate.
PAYE small employers 2011-12 to 2013-14 are revised due to an improved casework management system being used to record compliance yield, and better data capture. Additionally in 2013-14 there was an improved method for identifying PAYE non-payments.
PAYE large employers No revisions
Avoidance 2012-13 has been revised slightly to reflect more recent internal data and improved data to annualise risks.
Hidden economy Hidden Economy tax gap estimates for previous years are updated to reflect the latest available data, but remain illustrative.

HM Revenue and Customs 23
Summary
Tax gap component Revisions
Corporation Tax
Businesses managed by our Large Business Service (LBS)
2008-09 and 2011-12 have been revised with data from the closure of more risks, better estimates of tax under consideration and a small increase in compliance yield estimates.
2012-13 has been revised as it is now estimated from case management system data rather than projected from 2011-12.
2013-14 has been revised as it is now projected from 2012-13 data instead of 2011-12 data.
Large and complex businesses (L&C)
2009-10 to 2012-13 have been revised because they are estimated using updated tax under consideration estimate for businesses managed by our Large Business Service.
2013-14 has been revised as it is now projected from 2012-13 data instead of 2011-12 data.
Small and medium-sized enterprises
2010-11 to 2012-13 are revised due to an improved casework management system being used to record compliance yield, and better data capture. Additionally, long running cases relating to 2011-12 that were previously open and had to have their outcomes forecast have now been settled.
2013-14 is revised as it now uses actual data rather than being projected.
Other direct and indirect taxes
Landfill Tax, other environmental taxes and Insurance Premium Tax
A new methodology has been developed to estimate the Landfill Tax gap, which has led to revisions to this combined category. For more information see Chapter 6: Other taxes

24 Measuring tax gaps 2016 edition
VAT
2. VAT
Key findings
The VAT gap is estimated to be £12.7 billion in 2014-15. This equates to 10.3% of the estimated net VAT total theoretical liability (in other words, the net VAT total that should, in theory, be paid).
There is a downward trend in the VAT gap, from 14.5% in 2005-06 to 10.3% in 2014-15.
The VAT gap estimates are prone to change, from both new and revised independent data and methodological improvements. In this publication, there are new and revised independent data from the Office for National Statistics National Accounts Blue Book 2015 and Consumer Trends up to and including 2016 quarter 1 (consistent with Blue Book 2016). This has resulted in a decrease in the level of the VAT gap for all years except 2012-13, which had a negligible increase, and 2013-14 which had an increase of £400 million (see Figure 2.5).
The Missing Trader Intra-Community (MTIC) fraud estimate for 2014-15 has remained within the same range as 2013-14, of between £0.5 billion and £1.0 billion (see the ‘Methodology and data issues’ section for the definition of MTIC).
VAT debt is estimated at £1.5 billion in 2014-15. This is the difference between new debt and paid and adjusted debt (see Figure 2.2).
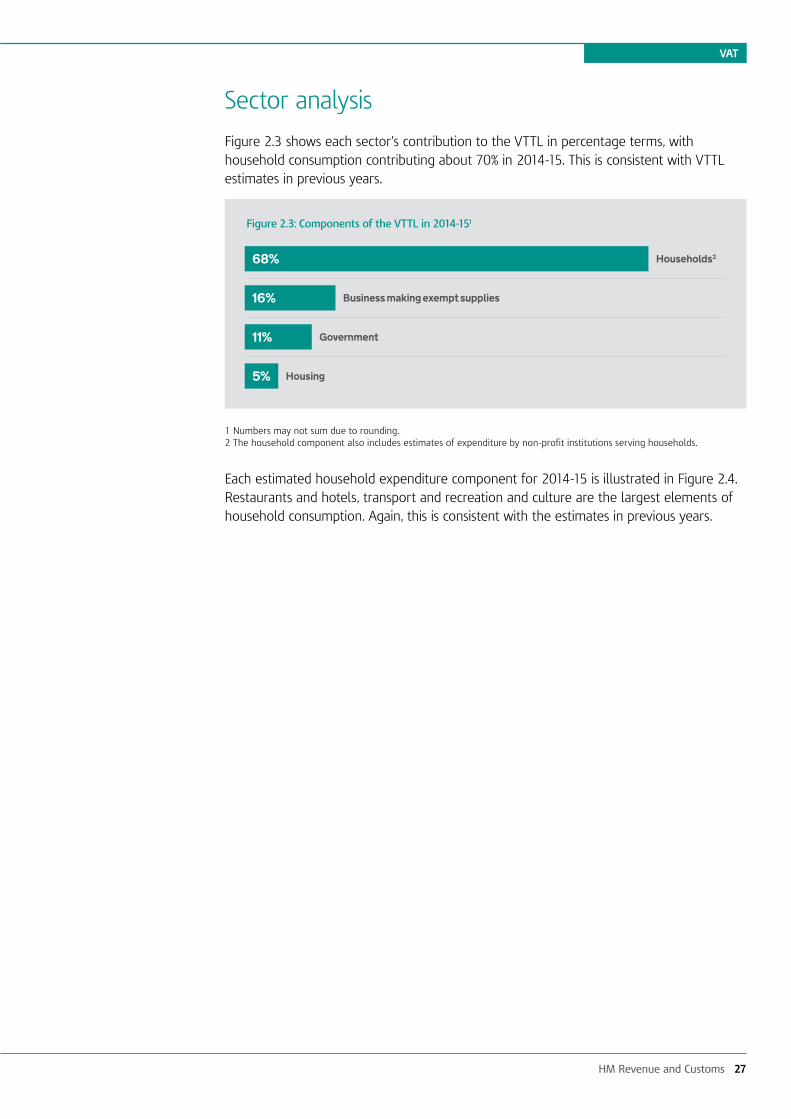
Around 70% of the VAT total theoretical liability in 2014-15 was from household consumption, with the remaining proportion from consumption by businesses making exempt supplies, and from the government and housing sectors (see Figure 2.3).
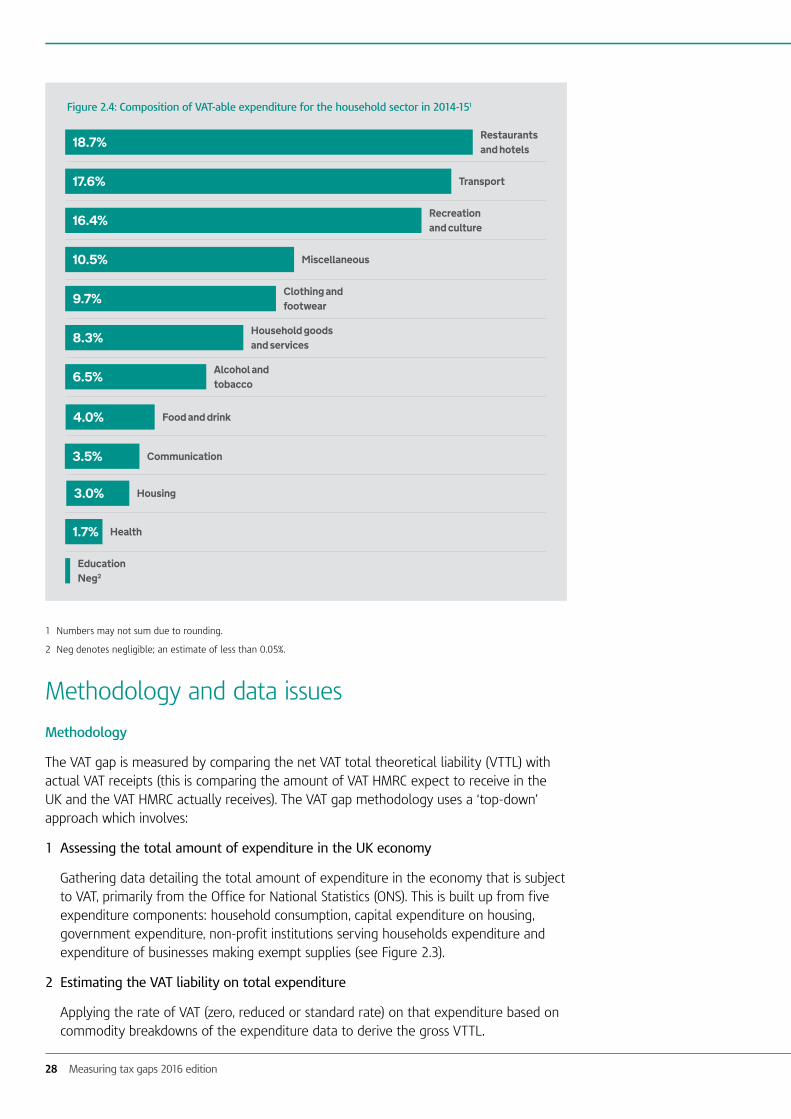
Around half of household expenditure that is liable to VAT comes from restaurants and hotels, transport and recreation and culture (see Figure 2.4). This is consistent with estimates in previous years.
£15.5bn
£12.7bn
£3.7bn
£2.8bn
Tax gap by type of tax, 2014-15
IT, NICs and CGT
Value Added Tax
Corporation Tax
Excise duties
Other taxes£1.3bn

HM Revenue and Customs 25
VAT
Results and tables
Table 2.1 shows the estimated net VAT total theoretical liability (VTTL), net VAT receipts and the estimated VAT gap for years 2005-06 to 2014-15.
The VAT gap shows a downward trend from 2005-06 to 2014-15, falling from 14.5% in 2005-06 to 10.3% in 2014-15. Over this period, the standard rate of VAT has fluctuated between 15% and 20%. For this reason, the VAT gap expressed as a percentage of VTTL provides a like-for-like comparison and takes account of the impact of any rate change.
The VAT gap decreased between 2013-14 and 2014-15 from 11.4% to 10.3%, which equates to a decrease from £13.5 billion to £12.7 billion.
Table 2.1: Estimated VAT gap (£ billion)1
2005-06 2009-10 2010-11 2011-12 2012-13 2013-14 2014-15
Net VTTL 85.3 81.5 95.5 111.0 114.3 118.2 124.1
Net VAT receipts2 73.0 71.6 85.4 98.4 100.7 104.8 111.4
VAT gap (point estimate)
12.3 9.9 10.1 12.5 13.5 13.5 12.7
of which MTIC fraud 2.5-3.5 1.0-1.5 0.5-1.0 0.5-1.0 0.5-1.0 0.5-1.0 0.5-1.0
of which debt n/a 1.8 0.9 1.8 1.3 1.2 1.5
VAT gap % 3 14.5% 12.2% 10.6% 11.3% 11.8% 11.4% 10.3%
1 The amounts are rounded to the nearest £0.1 billion.2 Net VAT receipts are expressed net of payments and repayments.3 The VAT gap as a percentage of VTTL has been rounded to the nearest 0.1%.
A full time series for tables is available on our website www.gov.uk/government/statistics/measuring-tax-gaps-tables
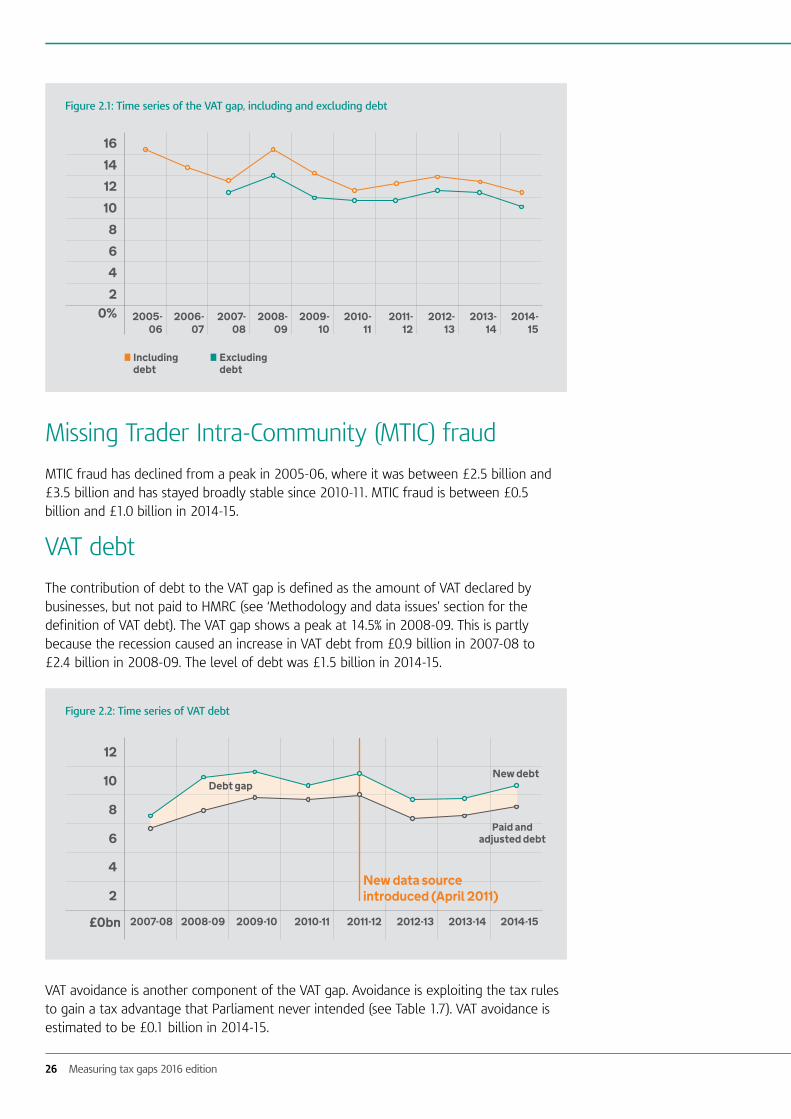
Figure 2.1 shows a time series of the VAT gap over the period 2005-06 to 2014-15. The VAT gap excluding debt remained broadly stable from 2009-10 onwards, at around 10% of VTTL. Due to data quality issues, the debt contribution can only be measured from 2007-08.
26 Measuring tax gaps 2016 edition
Missing Trader Intra-Community (MTIC) fraud
MTIC fraud has declined from a peak in 2005-06, where it was between £2.5 billion and £3.5 billion and has stayed broadly stable since 2010-11. MTIC fraud is between £0.5 billion and £1.0 billion in 2014-15.
VAT debt
The contribution of debt to the VAT gap is defined as the amount of VAT declared by businesses, but not paid to HMRC (see ‘Methodology and data issues’ section for the definition of VAT debt). The VAT gap shows a peak at 14.5% in 2008-09. This is partly because the recession caused an increase in VAT debt from £0.9 billion in 2007-08 to £2.4 billion in 2008-09. The level of debt was £1.5 billion in 2014-15.
VAT avoidance is another component of the VAT gap. Avoidance is exploiting the tax rules to gain a tax advantage that Parliament never intended (see Table 1.7). VAT avoidance is estimated to be £0.1 billion in 2014-15.
Figure 2.1: Time series of the VAT gap, including and excluding debt
2
Including debt
0%
Excluding debt
2005-06
2006-07
2007-08
2008-09
2009-10
2010- 11
2011- 12
2012- 13
2013- 14
2014- 15
4
6
8
10
12
14
16
Figure 2.2: Time series of VAT debt
2
New debt
£0bn
Paid and adjusted debt
2007-08 2008-09 2009-10 2010-11 2011-12 2012-13 2013-14 2014-15
4
6
8
10
12
New data source introduced (April 2011)
Debt gap
HM Revenue and Customs 27
VAT
Sector analysis
Figure 2.3 shows each sector’s contribution to the VTTL in percentage terms, with household consumption contributing about 70% in 2014-15. This is consistent with VTTL estimates in previous years.
1 Numbers may not sum due to rounding.2 The household component also includes estimates of expenditure by non-profit institutions serving households.
Each estimated household expenditure component for 2014-15 is illustrated in Figure 2.4. Restaurants and hotels, transport and recreation and culture are the largest elements of household consumption. Again, this is consistent with the estimates in previous years.
68%
16%
11%
5%
Households2
Business making exempt supplies
Government
Housing
Figure 2.3: Components of the VTTL in 2014-151
28 Measuring tax gaps 2016 edition
1 Numbers may not sum due to rounding.
2 Neg denotes negligible; an estimate of less than 0.05%.
Methodology and data issues
Methodology
The VAT gap is measured by comparing the net VAT total theoretical liability (VTTL) with actual VAT receipts (this is comparing the amount of VAT HMRC expect to receive in the UK and the VAT HMRC actually receives). The VAT gap methodology uses a ‘top-down’ approach which involves:
1 Assessing the total amount of expenditure in the UK economy
Gathering data detailing the total amount of expenditure in the economy that is subject to VAT, primarily from the Office for National Statistics (ONS). This is built up from five expenditure components: household consumption, capital expenditure on housing, government expenditure, non-profit institutions serving households expenditure and expenditure of businesses making exempt supplies (see Figure 2.3).
2 Estimating the VAT liability on total expenditure
Applying the rate of VAT (zero, reduced or standard rate) on that expenditure based on commodity breakdowns of the expenditure data to derive the gross VTTL.
18.7%
17.6%
16.4%
10.5%
Restaurants and hotels
Recreation and culture
Miscellaneous
Figure 2.4: Composition of VAT-able expenditure for the household sector in 2014-151
Transport
9.7%
8.3%
6.5%
Household goods and services
Alcohol and tobacco
3.0%
4.0%
3.5%
Food and drink
Communication
1.7%
EducationNeg2
Clothing and footwear
Housing
Health

HM Revenue and Customs 29
VAT
3 Deducting any legitimate reductions
Deducting any legitimate refunds occurring through schemes and reliefs to calculate the net VTTL.
4 Subtracting actual VAT receipts
Subtracting actual VAT receipts from the net VTTL. Comparing the net VTTL for the calendar year to VAT receipts for the corresponding financial year. This assumes a three-month lag between the economic activity and payment of the associated VAT to HMRC.
5 Calculating the VAT gap
Calculating the residual element – the VAT gap – which is assumed to be the total VAT gap including fraud, debt and other losses.
Data
This publication includes both new data and data revisions from the Office for National Statistics National Accounts Blue Book 2015 and Consumer Trends up to and including 2016 quarter 1 (consistent with Blue Book 2016).
Due to the timing of the Blue Book 2016 publication, which was published in July 2016, it has not been possible to take on data for 2014 for the housing, government and businesses making exempt supplies in the VAT gap model (around 30% of the VTTL as shown in Figure 2.3). Therefore, these sectors VTTLs are forecast for 2014-15 using the Office for Budget Responsibility’s determinants and will be updated once HMRC incorporates the new outturn data into these estimates.
VAT gap estimates are included in the total tax gap as part of the ‘Measuring tax gaps’ publication. These estimates will be subject to further revision as more data become available and methodological improvements are implemented.
The VAT gap preliminary estimate for 2015-16 is expected to be published on the day of the Chancellor’s Autumn Statement and a second estimate is expected to be published at next year’s Budget. The exact release date will be available on the HMRC website (schedule of updates).
Missing Trader Intra-Community (MTIC) fraud
MTIC fraud is an organised criminal attack on the European Union’s VAT system involving fraudulent traders acquiring goods or services VAT free from EU member states. They charge VAT on their onward sale and go ‘missing’ to avoid paying the VAT charged to the relevant tax authorities. One form of the fraud – known as carousel fraud – involves a series of contrived transactions within and beyond the EU, with the aim of creating large unpaid VAT liabilities and in some cases invalid VAT repayment claims.
The method used to estimate MTIC fraud was reviewed and updated for estimates from 2011-12 with changes that better reflect the way MTIC fraud is carried out. It is not possible to calculate previous years using this updated methodology, as the data is not available before this point. This means a break in the time series occurs between 2010-11 and 2011-12, with estimates up to and including 2010-11 calculated using the previous methodology. The estimates for the years before 2011-12 will not be revised.
We do not reveal how we calculate MTIC fraud estimates, for operational reasons.
30 Measuring tax gaps 2016 edition
VAT debt
For VAT, debt is defined as new debts arising in the financial year deducting debt paid and debt adjustments. This differs to direct taxes, where non-payment is equated to debt written off. Debt adjustments refer to the difference between the amount initially declared by the trader and the finalised amount due.
The debt contribution to the VAT gap is estimated using our own data, with debt adjustments made to exclude MTIC debt and to reflect the deferral of payments under the ‘Time to Pay’ arrangements. Due to data quality issues, the debt contribution can only be measured from 2007-08.
This methodology does not relate to the stock of debt or debt written off. This means that estimates shown will differ from the VAT debt balance contained in HMRC’s Annual Report and Accounts.
Avoidance
The VAT avoidance tax gap is estimated using HMRC’s risk register data of avoidance schemes relating to VAT. The methodology remains unchanged from ‘Measuring tax gaps 2015 edition’. No change was made to the assumption on the length of time that VAT avoidance schemes operate.
Revisions
Revisions have been made to the VAT gap estimates since last year’s publication ‘Measuring tax gaps 2015 edition’. This has resulted in a decrease in the level of the VAT gap for all years except 2012-13, which had a negligible increase, and 2013-14 which had an increase of £400 million (see Figure 2.5).
These revisions are a result of incorporating new and revised independent data from the Office for National Statistics (ONS) and methodological improvements. The main reasons are summarised as follows:
a) Taking on data from ‘Blue Book 2015’ (October 2015), the changes are outlined in a series of articles published by the ONS:
b) Taking on data from ‘ONS Consumer Trends’ data up to and including 2016 quarter 1 (consistent with Blue Book 2016), which is used to calculate the household sector.
c) Making improvements to the VTTL model to incorporate new data and methodology changes.
d) Taking on the latest forecast from the Office for Budget Responsibility, which are used to forecast parts of the VAT gap where data is unavailable.
The United Kingdom National Accounts, The Blue Book: 2015 Edition is available at www.ons.gov.uk/economy/grossdomesticproductgdp/compendium/unitedkingdomnationalaccountsthebluebook/2015-10-30

HM Revenue and Customs 31
VAT
As part of the regular cycle of the VAT gap publications, HMRC continues to review the methodologies it uses to estimate the VAT gap to ensure these use best available data and assumptions, and are in line with current VAT policies.
Sensitivity of the VAT gap
The VAT gap estimates are prone to change from both new and revised data and methodological improvements. Plus, the VAT gap is basically derived from two very large numbers (the VTTL and the VAT receipts) so any change to either of these numbers will have a large impact on the VAT gap estimates. It is for this reason that the trend in the time series is considered a better indicator of the VAT gap rather than its year-on-year changes.
Figure 2.5: Revisions to the VAT gap estimates compared to the previous edition
0% 2005-06
2006- 07
2007- 08
2008- 09
2009- 10
2010- 11
2011- 12
2012- 13
2013- 14
2
4
6
8
10
12
14
16
£0bn
2
4
6
8
10
12
14
16
Measuring tax gaps 2015 £bn
Measuring tax gaps 2016 £bn
Measuring tax gaps 2015 %
Measuring tax gaps 2016 %
2014- 15

32 Measuring tax gaps 2016 edition
Figure 2.6 shows how the VAT gap time series has changed in each of the ‘Measuring tax gaps’ publications. Although the VAT gap per cent fluctuates for example, 2005-06 varies from 13.1% to 15.4%, the trend is unchanged.
1 MTG stands for ‘Measuring tax gaps’
Revisions policy for VAT gap estimates
HMRC only publish a revised historical VAT gap series once a year, within the ‘Measuring tax gaps’ publication, incorporating both new and revised data and methodological improvements together.
The preliminary and second estimate of the VAT gap will only include revisions for new data and required methodology improvements to ensure the correct treatment of this new data. For example, the estimates may be updated with the latest Consumer Trends or Blue Book data as published by the ONS.
Figure 2.6 Revisions to the VAT gap as a percentage of theoretical tax liabilities compared to previous editions1
0% 2005-06
2006-07
2007-08
2008-09
2009-10
2010- 11
2011- 12
2012- 13
2013- 14
2014- 15
MTG 2010
MTG 2011
MTG 2012 MTG 2013MTG 2014
MTG 2015
MTG 2016
12
14
16
18
8
10
6
4
2
HM Revenue and Customs 33
Excise
3. Excise (including alcohol, tobacco and oils)
Key findings
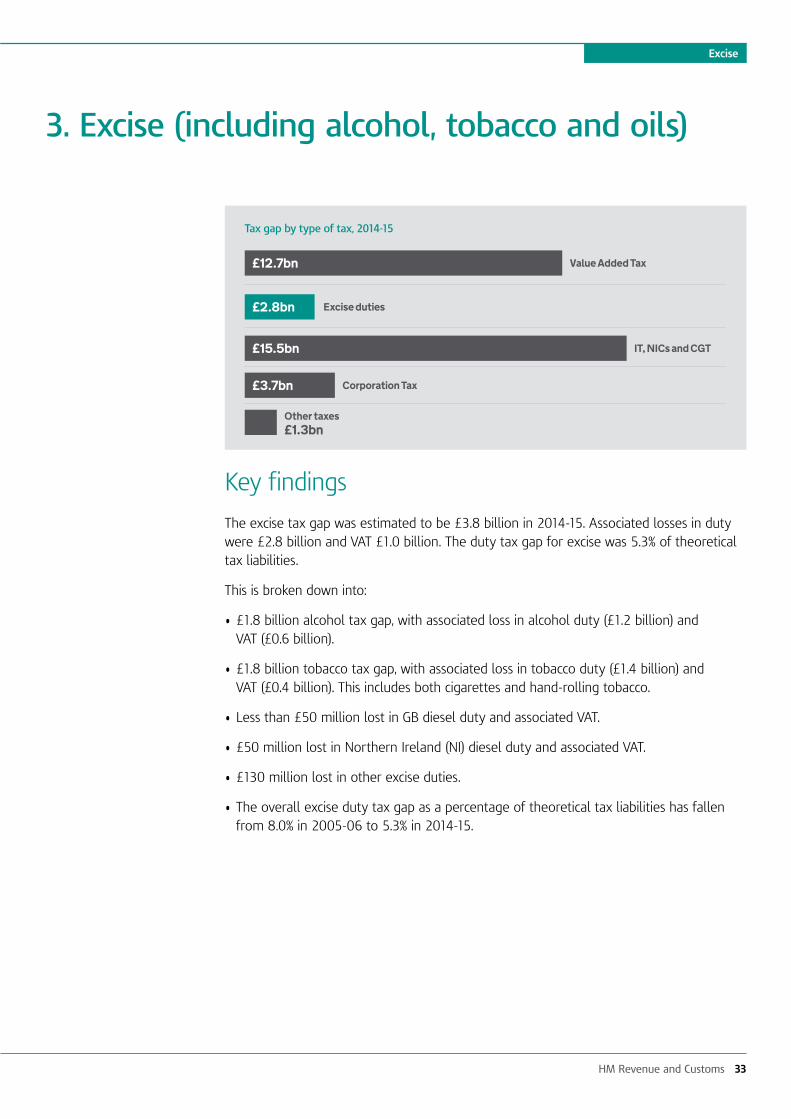
The excise tax gap was estimated to be £3.8 billion in 2014-15. Associated losses in duty were £2.8 billion and VAT £1.0 billion. The duty tax gap for excise was 5.3% of theoretical tax liabilities.
This is broken down into:
• £1.8 billion alcohol tax gap, with associated loss in alcohol duty (£1.2 billion) and VAT (£0.6 billion).
• £1.8 billion tobacco tax gap, with associated loss in tobacco duty (£1.4 billion) and VAT (£0.4 billion). This includes both cigarettes and hand-rolling tobacco.
• Less than £50 million lost in GB diesel duty and associated VAT.
• £50 million lost in Northern Ireland (NI) diesel duty and associated VAT.
• £130 million lost in other excise duties.
• The overall excise duty tax gap as a percentage of theoretical tax liabilities has fallen from 8.0% in 2005-06 to 5.3% in 2014-15.
£15.5bn
£12.7bn
£3.7bn
£2.8bn
Tax gap by type of tax, 2014-15
IT, NICs and CGT
Value Added Tax
Corporation Tax
Excise duties
Other taxes£1.3bn
34 Measuring tax gaps 2016 edition
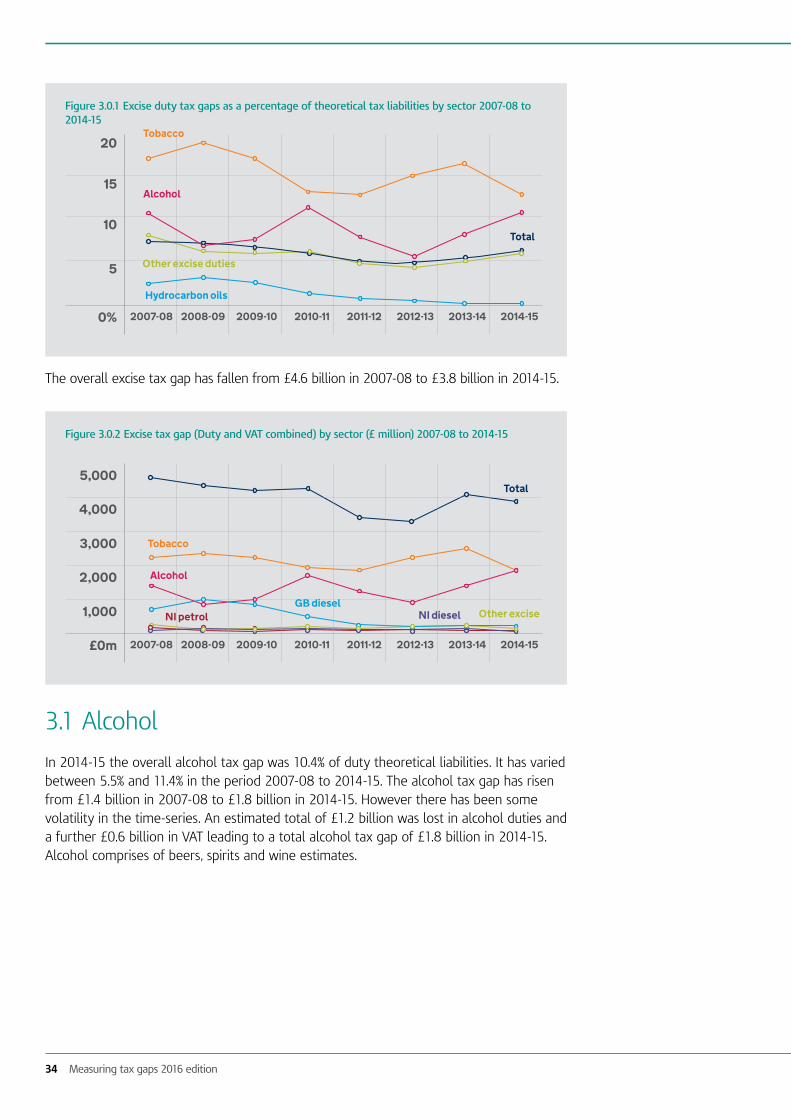
The overall excise tax gap has fallen from £4.6 billion in 2007-08 to £3.8 billion in 2014-15.
3.1 Alcohol
In 2014-15 the overall alcohol tax gap was 10.4% of duty theoretical liabilities. It has varied between 5.5% and 11.4% in the period 2007-08 to 2014-15. The alcohol tax gap has risen from £1.4 billion in 2007-08 to £1.8 billion in 2014-15. However there has been some volatility in the time-series. An estimated total of £1.2 billion was lost in alcohol duties and a further £0.6 billion in VAT leading to a total alcohol tax gap of £1.8 billion in 2014-15. Alcohol comprises of beers, spirits and wine estimates.
Figure 3.0.2 Excise tax gap (Duty and VAT combined) by sector (£ million) 2007-08 to 2014-15
1,000
Alcohol
Tobacco
£0m
GB dieselNI diesel
2007-08 2008-09 2009-10 2010-11 2011-12 2012-13 2013-14 2014-15
2,000
3,000
4,000
5,000
Other exciseNI petrol
Total
Figure 3.0.1 Excise duty tax gaps as a percentage of theoretical tax liabilities by sector 2007-08 to 2014-15
10
5
Alcohol
Tobacco
0%
Hydrocarbon oils
Other excise duties
Total
15
2007-08 2008-09 2009-10 2010-11 2011-12 2012-13 2013-14 2014-15
20

HM Revenue and Customs 35
Excise
Users of tax gap estimates should note that the methodology used for beer differs from that of spirits and wine in two key areas:
• in estimating the upper and lower bounds
• in calculating an additional uplift factor for under-reporting of consumption
Information on the different methodologies can be found in the ‘Methodological annex’.
The methodological annex is available on our website www.gov.uk/government/statistics/measuring-tax-gaps
Due to the uncertainty in the methodology used, the central estimates presented should be interpreted as an indicator of long-term trends rather than a precise estimate of year-on-year changes.
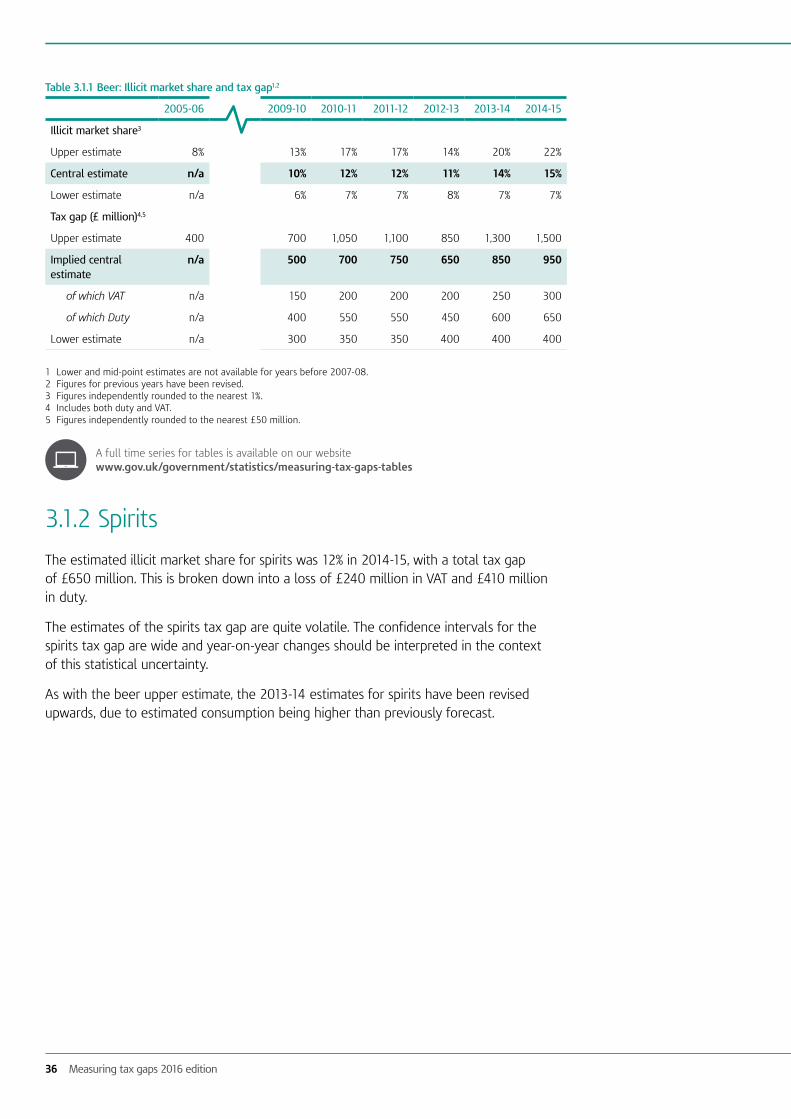
3.1.1 Beer
The beer illicit market share was estimated at 15% in 2014-15. This resulted in estimated losses of £650 million in duty and a further £300 million in Value Added Tax (VAT) giving a total loss of £950 million.
The illicit market share in beer has increased from 9% in 2007-08 to 15% in 2014-15.
HMRC uses two different methods to estimate the beer tax gap. These methods provide an upper estimate and lower estimate. The true tax gap could be anywhere between these two estimates. The implied central estimate is intended to be an indicator of long-term trends.
The lower estimate has remained relatively stable fluctuating between 6% and 8%. The upper estimate has risen from 12% in 2007-08 to 22% in 2014-15.
The beer upper estimates for 2013-14 have been revised upwards, due to estimated consumption being higher than previously forecast.
Figure 3.1.1 Alcohol tax gap (duty and VAT combined) (£ million) 2007-08 to 2014-15
1,000
500
£0m
1,500
2007-08 2008-09 2009-10 2010-11 2011-12 2012-13 2013-14 2014-15
2,000
Spirits
BeerWine
Alcohol
36 Measuring tax gaps 2016 edition
Table 3.1.1 Beer: Illicit market share and tax gap1,2
2005-06 2009-10 2010-11 2011-12 2012-13 2013-14 2014-15
Illicit market share3
Upper estimate 8% 13% 17% 17% 14% 20% 22%
Central estimate n/a 10% 12% 12% 11% 14% 15%
Lower estimate n/a 6% 7% 7% 8% 7% 7%
Tax gap (£ million)4,5
Upper estimate 400 700 1,050 1,100 850 1,300 1,500
Implied central estimate
n/a 500 700 750 650 850 950
of which VAT n/a 150 200 200 200 250 300
of which Duty n/a 400 550 550 450 600 650
Lower estimate n/a 300 350 350 400 400 400
1 Lower and mid-point estimates are not available for years before 2007-08.2 Figures for previous years have been revised.3 Figures independently rounded to the nearest 1%.4 Includes both duty and VAT.5 Figures independently rounded to the nearest £50 million.
A full time series for tables is available on our website www.gov.uk/government/statistics/measuring-tax-gaps-tables
3.1.2 Spirits
The estimated illicit market share for spirits was 12% in 2014-15, with a total tax gap of £650 million. This is broken down into a loss of £240 million in VAT and £410 million in duty.
The estimates of the spirits tax gap are quite volatile. The confidence intervals for the spirits tax gap are wide and year-on-year changes should be interpreted in the context of this statistical uncertainty.
As with the beer upper estimate, the 2013-14 estimates for spirits have been revised upwards, due to estimated consumption being higher than previously forecast.

HM Revenue and Customs 37
Excise
Table 3.1.2 Spirits: Illicit market share and tax gap1
2005-06 2009-10 2010-11 2011-12 2012-13 2013-14 2014-15
Illicit market share2
Upper estimate 12% 11% 13% 11% 10% 14% 20%
Central estimate 6% 4% 6% 4% 2% 6% 12%
Lower estimate3 0% 0% 0% 0% 0% 0% 3%
Tax gap (£ million)4,5
Upper estimate 440 440 580 580 500 750 1,160
Central estimate 230 160 270 200 90 280 650
of which VAT 70 50 90 70 30 100 240
of which Duty 150 120 180 130 50 180 410
Lower estimate3 10 0 0 0 0 0 140
1 Figures for previous years have been revised.2 Figures independently rounded to the nearest 1%.3 Negative numbers have been truncated at zero.4 Includes both duty and VAT.5 Figures independently rounded to the nearest £10 million.
A full time series for tables is available on our website www.gov.uk/government/statistics/measuring-tax-gaps-tables
3.1.3 Wine
It has not been possible to estimate the illicit market share for wine, due to a change in one of the underlying commercial data sources previously used to estimate the wine tax gap. An illustrative estimate of 3% is provided for 2013-14 and 2014-15 by taking the average illicit market share of 2011-12 and 2012-13. This would indicate a total wine tax gap of around £200 million in 2013-14 and 2014-15. HMRC is exploring alternative data sources in order to develop a new method to estimate the wine tax gap in the future.
Table 3.1.3 shows that since 2009-10, the illicit market share for wine has been between 2% and 6%, with the exception of an increase to 12% in 2010-11.

38 Measuring tax gaps 2016 edition
Table 3.1.3: Wine: Illicit market share and tax gap1
2009-10 2010-11 2011-12 2012-13 2013-142 2014-152
Illicit market share3
Upper estimate4 11% 18% 9% 8% 9% 9%
Central estimate 6% 12% 4% 2% 3% 3%
Lower estimate4,5 1% 6% 0% 0% 0% 0%
Tax gap (£ million)6,7
Upper estimate4 590 1,110 600 540 630 630
Implied central estimate 310 710 250 130 200 200
of which VAT 110 270 100 50 80 80
of which Duty 200 440 150 80 120 120
Lower estimate4,5 20 300 0 0 0 0
1 Figures for previous years have been revised.2 Estimates for 2013-14 and 2014-15 are illustrative.3 Figures independently rounded to the nearest 1%.4 Confidence intervals are experimental and should be taken as illustrative.5 Negative numbers have been truncated at zero.6 Includes both duty and VAT.7 Figures independently rounded to the nearest £10 million.
3.2 Tobacco
The tobacco tax gap is made up of the illicit market in cigarettes and hand-rolling tobacco and is estimated to be £1.8 billion in 2014-15. An estimated total of £1.4 billion was lost in tobacco duties and a further £0.4 billion in VAT. The cigarette tax gap and the hand-rolling tobacco tax gap were estimated to be £900 million each in 2014-15.
Due to the uncertainty inherent in the methodology, the central estimate should be interpreted as an indicator of long-term trends rather than a precise estimate of year-on-year changes.
Information on tobacco tax gaps is shown up to and including 2014-15 in this chapter. The separate publication ‘Tobacco tax gap estimates 2015-16’, published alongside Measuring tax gaps 2016, contains estimates up to and including 2015-16.
Tobacco tax gap estimates 2015-16 is available on our website www.gov.uk/government/statistics/tobacco-tax-gap-estimates

HM Revenue and Customs 39
Excise
Patterns of both legitimate and illicit tobacco consumption have changed over time in the UK. Although overall tobacco consumption is declining, hand-rolling tobacco consumption has remained relatively stable in recent years while cigarette consumption has declined.
The illicit market has declined in the long-term, but the composition of the tax gap has changed. The share of the tax gap which can be associated with hand-rolling tobacco was under a third in 2005-06, but it represents half of the tax gap in 2014-15.
The historical time series has been revised, as new data on people who falsely deny whether they smoke (from the Health Survey England) has become available. This information affects total consumption and tax gaps for both cigarettes and hand-rolling tobacco. See section 3.6.2 for more details of this revision.
The combined tobacco tax gap is the sum of the central estimates for cigarettes and hand-rolling tobacco. However, it is not possible simultaneously to combine both upper (or equivalently, lower) estimates for cigarettes and hand-rolling tobacco so there is no upper or lower bound estimate for the combined tobacco tax gap. More detail on upper and lower bounds is covered in section 3.5.4 and in the ‘Methodological annex’.
The methodological annex is available on our website www.gov.uk/government/statistics/measuring-tax-gaps
Table 3.2: Tobacco Tax Gap (£ million) 1,2,3
2005-06 2009-10 2010-11 2011-12 2012-13 2013-14 2014-15
Cigarette illicit market4
Upper estimate 2,400 1,900 1,700 1,600 1,900 2,000 1,400
Central estimate 1,900 1,500 1,200 1,000 1,300 1,400 900
of which VAT 300 200 200 200 300 300 200
of which Duty 1,500 1,200 900 800 1,000 1,100 700
Lower estimate 1,400 1,000 700 400 600 800 300
Hand-rolling tobacco illicit market5
Upper estimate 1,000 900 900 1,000 1,100 1,200 1,100
Central estimate 800 700 700 800 900 1,100 900
of which VAT 200 200 200 200 200 300 200
of which Duty 700 600 500 600 700 800 700
Lower estimate 700 600 500 600 700 900 700
Combined tobacco illicit market6
2,700 2,200 1,900 1,800 2,200 2,500 1,800
1 Figures for previous years have been revised.2 Figures are independently rounded to the nearest £100 million.3 Includes both duty and VAT.4 Based on the weighted average price (WAP) of all UK duty paid cigarettes.5 Weighted average price (WAP) data for all UK duty paid hand-rolling tobacco is not available prior to 2012-13, so the losses
are based on the price of a ‘typical brand’.6 The upper (or lower) bounds for both cigarette and hand-rolling tobacco cannot be combined. Only the central estimates
are simultaneously possible.
A full time series for tables is available on our website www.gov.uk/government/statistics/measuring-tax-gaps-tables
40 Measuring tax gaps 2016 edition
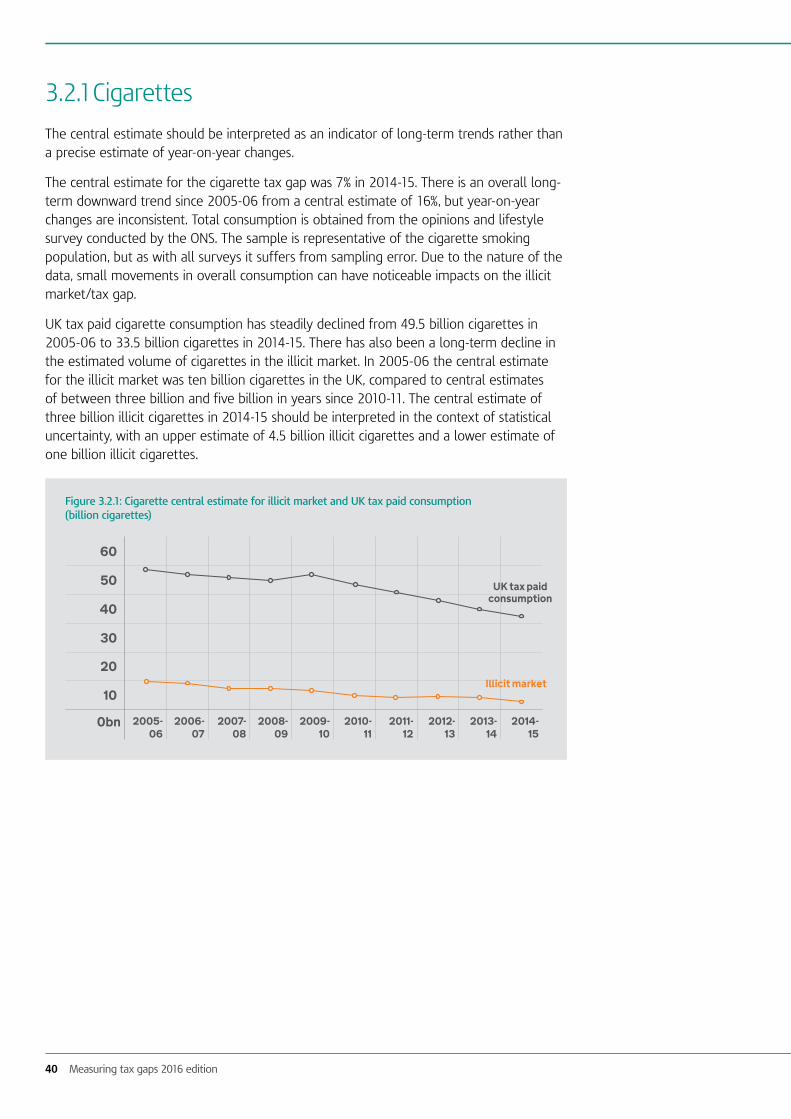
3.2.1 Cigarettes
The central estimate should be interpreted as an indicator of long-term trends rather than a precise estimate of year-on-year changes.
The central estimate for the cigarette tax gap was 7% in 2014-15. There is an overall long-term downward trend since 2005-06 from a central estimate of 16%, but year-on-year changes are inconsistent. Total consumption is obtained from the opinions and lifestyle survey conducted by the ONS. The sample is representative of the cigarette smoking population, but as with all surveys it suffers from sampling error. Due to the nature of the data, small movements in overall consumption can have noticeable impacts on the illicit market/tax gap.
UK tax paid cigarette consumption has steadily declined from 49.5 billion cigarettes in 2005-06 to 33.5 billion cigarettes in 2014-15. There has also been a long-term decline in the estimated volume of cigarettes in the illicit market. In 2005-06 the central estimate for the illicit market was ten billion cigarettes in the UK, compared to central estimates of between three billion and five billion in years since 2010-11. The central estimate of three billion illicit cigarettes in 2014-15 should be interpreted in the context of statistical uncertainty, with an upper estimate of 4.5 billion illicit cigarettes and a lower estimate of one billion illicit cigarettes.
Figure 3.2.1: Cigarette central estimate for illicit market and UK tax paid consumption (billion cigarettes)
10
UK tax paid consumption
0bn
20
30
40
50
60
2005-06
2006-07
2007-08
2008-09
2009-10
2010- 11
2011- 12
2012- 13
2013- 14
2014- 15
Illicit market
HM Revenue and Customs 41
Excise
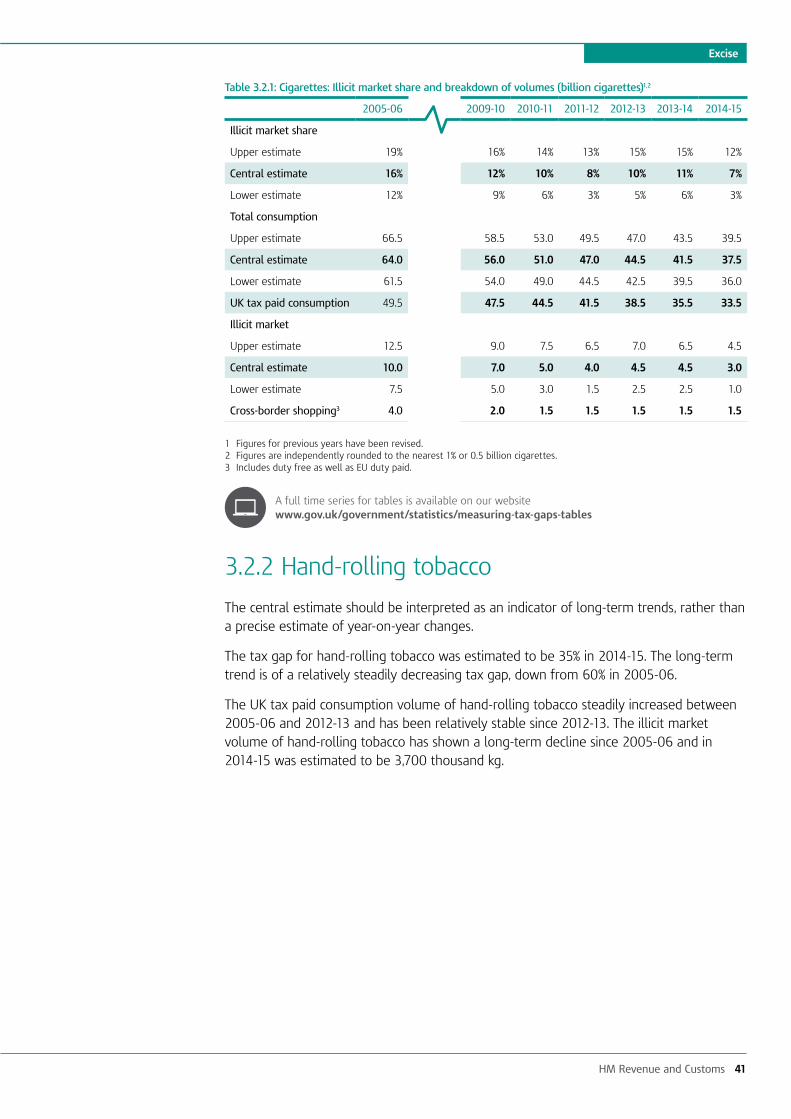
Table 3.2.1: Cigarettes: Illicit market share and breakdown of volumes (billion cigarettes)1,2
2005-06 2009-10 2010-11 2011-12 2012-13 2013-14 2014-15
Illicit market share
Upper estimate 19% 16% 14% 13% 15% 15% 12%
Central estimate 16% 12% 10% 8% 10% 11% 7%
Lower estimate 12% 9% 6% 3% 5% 6% 3%
Total consumption
Upper estimate 66.5 58.5 53.0 49.5 47.0 43.5 39.5
Central estimate 64.0 56.0 51.0 47.0 44.5 41.5 37.5
Lower estimate 61.5 54.0 49.0 44.5 42.5 39.5 36.0
UK tax paid consumption 49.5 47.5 44.5 41.5 38.5 35.5 33.5
Illicit market
Upper estimate 12.5 9.0 7.5 6.5 7.0 6.5 4.5
Central estimate 10.0 7.0 5.0 4.0 4.5 4.5 3.0
Lower estimate 7.5 5.0 3.0 1.5 2.5 2.5 1.0
Cross-border shopping3 4.0 2.0 1.5 1.5 1.5 1.5 1.5
1 Figures for previous years have been revised.2 Figures are independently rounded to the nearest 1% or 0.5 billion cigarettes. 3 Includes duty free as well as EU duty paid.
A full time series for tables is available on our website www.gov.uk/government/statistics/measuring-tax-gaps-tables
3.2.2 Hand-rolling tobacco
The central estimate should be interpreted as an indicator of long-term trends, rather than a precise estimate of year-on-year changes.
The tax gap for hand-rolling tobacco was estimated to be 35% in 2014-15. The long-term trend is of a relatively steadily decreasing tax gap, down from 60% in 2005-06.
The UK tax paid consumption volume of hand-rolling tobacco steadily increased between 2005-06 and 2012-13 and has been relatively stable since 2012-13. The illicit market volume of hand-rolling tobacco has shown a long-term decline since 2005-06 and in 2014-15 was estimated to be 3,700 thousand kg.

42 Measuring tax gaps 2016 edition
1 Thousand kg
Table 3.2.2: Hand-rolling tobacco: Illicit market share and breakdown of volumes (thousand kg)1,2
2005-06 2009-10 2010-11 2011-12 2012-13 2013-14 2014-15
Illicit market share
Upper estimate 65% 49% 46% 43% 43% 44% 40%
Central estimate 60% 44% 39% 37% 37% 40% 35%
Lower estimate 55% 39% 33% 31% 32% 36% 30%
Total consumption3
Upper estimate 11,200 11,400 11,400 11,400 12,100 12,300 11,200
Central estimate 10,200 10,600 10,400 10,600 11,200 11,500 10,500
Lower estimate 9,100 9,700 9,500 9,700 10,300 10,800 9,800
UK tax paid consumption
3,200 5,100 5,500 6,000 6,200 6,300 6,300
Illicit market
Upper estimate 7,200 5,600 5,200 4,900 5,200 5,500 4,400
Central estimate 6,100 4,700 4,200 4,000 4,200 4,700 3,700
Lower estimate 5,000 3,800 3,200 3,100 3,300 3,900 3,000
Cross-border shopping3
Associated with upper estimate
700 700 600 600 700 500 400
Associated with central estimate
800 700 700 700 700 500 500
Associated with lower estimate
900 800 800 700 800 600 500
1 Figures for previous years have been revised.2 Figures are independently rounded to the nearest 1% or 100,000kg.3 Includes duty-free as well as EU duty paid.
A full time series for tables is available on our website www.gov.uk/government/statistics/measuring-tax-gaps-tables
Figure 3.2.2: Hand-rolling tobacco central estimate for illicit market and UK tax paid consumption (thousand kg)
1,000
UK tax paid consumption
0kg1
Illicit market
2,000
3,000
4,000
5,000
6,000
2005-06
2006-07
2007-08
2008-09
2009-10
2010- 11
2011- 12
2012- 13
2013- 14
2014- 15
7,000
HM Revenue and Customs 43
Excise
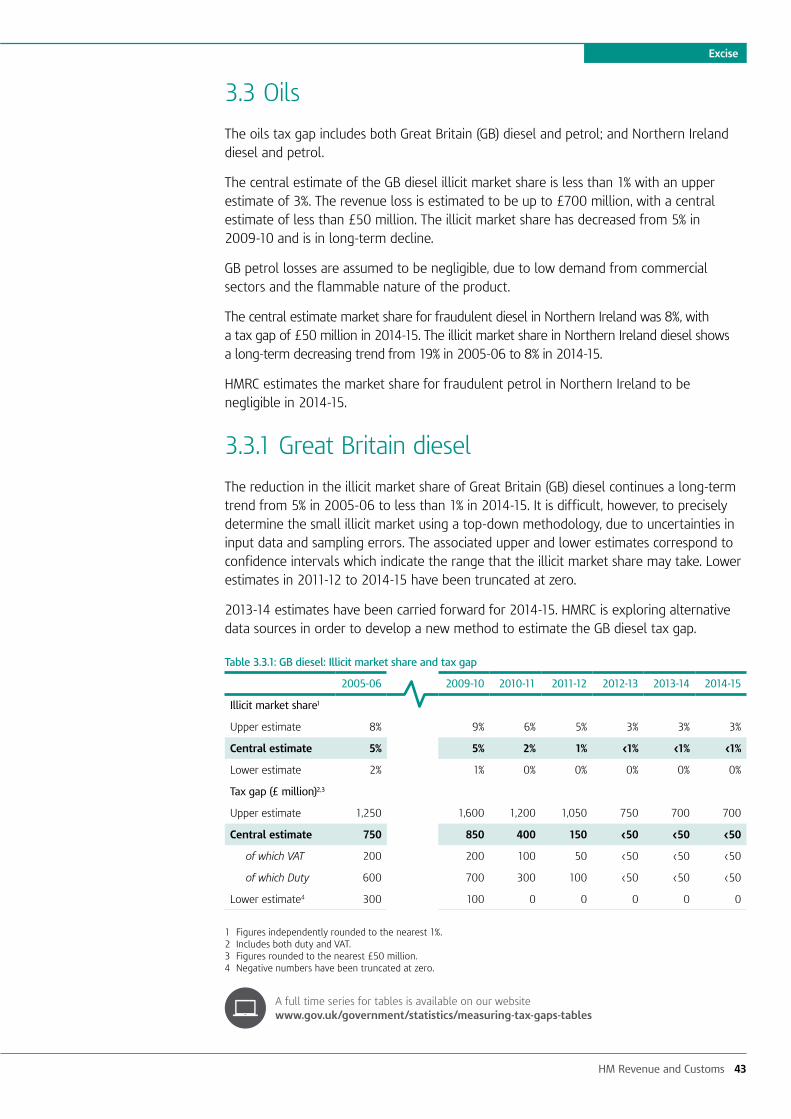
3.3 Oils
The oils tax gap includes both Great Britain (GB) diesel and petrol; and Northern Ireland diesel and petrol.
The central estimate of the GB diesel illicit market share is less than 1% with an upper estimate of 3%. The revenue loss is estimated to be up to £700 million, with a central estimate of less than £50 million. The illicit market share has decreased from 5% in 2009-10 and is in long-term decline.
GB petrol losses are assumed to be negligible, due to low demand from commercial sectors and the flammable nature of the product.
The central estimate market share for fraudulent diesel in Northern Ireland was 8%, with a tax gap of £50 million in 2014-15. The illicit market share in Northern Ireland diesel shows a long-term decreasing trend from 19% in 2005-06 to 8% in 2014-15.
HMRC estimates the market share for fraudulent petrol in Northern Ireland to be negligible in 2014-15.
3.3.1 Great Britain diesel
The reduction in the illicit market share of Great Britain (GB) diesel continues a long-term trend from 5% in 2005-06 to less than 1% in 2014-15. It is difficult, however, to precisely determine the small illicit market using a top-down methodology, due to uncertainties in input data and sampling errors. The associated upper and lower estimates correspond to confidence intervals which indicate the range that the illicit market share may take. Lower estimates in 2011-12 to 2014-15 have been truncated at zero.
2013-14 estimates have been carried forward for 2014-15. HMRC is exploring alternative data sources in order to develop a new method to estimate the GB diesel tax gap.
Table 3.3.1: GB diesel: Illicit market share and tax gap
2005-06 2009-10 2010-11 2011-12 2012-13 2013-14 2014-15
Illicit market share1
Upper estimate 8% 9% 6% 5% 3% 3% 3%
Central estimate 5% 5% 2% 1% <1% <1% <1%
Lower estimate 2% 1% 0% 0% 0% 0% 0%
Tax gap (£ million)2,3
Upper estimate 1,250 1,600 1,200 1,050 750 700 700
Central estimate 750 850 400 150 <50 <50 <50
of which VAT 200 200 100 50 <50 <50 <50
of which Duty 600 700 300 100 <50 <50 <50
Lower estimate4 300 100 0 0 0 0 0
1 Figures independently rounded to the nearest 1%.2 Includes both duty and VAT.3 Figures rounded to the nearest £50 million.4 Negative numbers have been truncated at zero.
A full time series for tables is available on our website www.gov.uk/government/statistics/measuring-tax-gaps-tables
44 Measuring tax gaps 2016 edition
3.3.2 Northern Ireland diesel
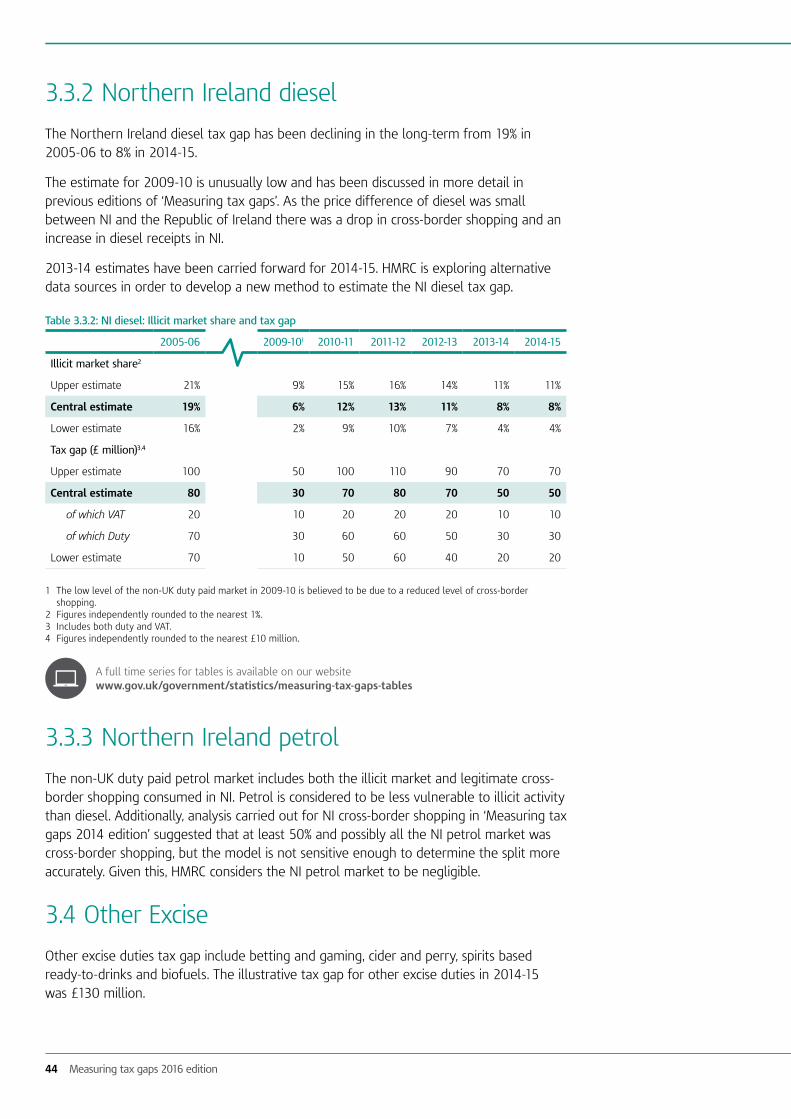
The Northern Ireland diesel tax gap has been declining in the long-term from 19% in 2005-06 to 8% in 2014-15.
The estimate for 2009-10 is unusually low and has been discussed in more detail in previous editions of ‘Measuring tax gaps’. As the price difference of diesel was small between NI and the Republic of Ireland there was a drop in cross-border shopping and an increase in diesel receipts in NI.
2013-14 estimates have been carried forward for 2014-15. HMRC is exploring alternative data sources in order to develop a new method to estimate the NI diesel tax gap.
Table 3.3.2: NI diesel: Illicit market share and tax gap
2005-06 2009-101 2010-11 2011-12 2012-13 2013-14 2014-15
Illicit market share2
Upper estimate 21% 9% 15% 16% 14% 11% 11%
Central estimate 19% 6% 12% 13% 11% 8% 8%
Lower estimate 16% 2% 9% 10% 7% 4% 4%
Tax gap (£ million)3,4
Upper estimate 100 50 100 110 90 70 70
Central estimate 80 30 70 80 70 50 50
of which VAT 20 10 20 20 20 10 10
of which Duty 70 30 60 60 50 30 30
Lower estimate 70 10 50 60 40 20 20
1 The low level of the non-UK duty paid market in 2009-10 is believed to be due to a reduced level of cross-border shopping.
2 Figures independently rounded to the nearest 1%.3 Includes both duty and VAT.4 Figures independently rounded to the nearest £10 million.
A full time series for tables is available on our website www.gov.uk/government/statistics/measuring-tax-gaps-tables
3.3.3 Northern Ireland petrol
The non-UK duty paid petrol market includes both the illicit market and legitimate cross-border shopping consumed in NI. Petrol is considered to be less vulnerable to illicit activity than diesel. Additionally, analysis carried out for NI cross-border shopping in ‘Measuring tax gaps 2014 edition’ suggested that at least 50% and possibly all the NI petrol market was cross-border shopping, but the model is not sensitive enough to determine the split more accurately. Given this, HMRC considers the NI petrol market to be negligible.
3.4 Other Excise
Other excise duties tax gap include betting and gaming, cider and perry, spirits based ready-to-drinks and biofuels. The illustrative tax gap for other excise duties in 2014-15 was £130 million.

HM Revenue and Customs 45
Excise
Table 3.4: Other Excise Tax Gap (£ million)1
2005-06 2009-10 2010-11 2011-12 2012-13 2013-14 2014-15
Other excise duties 140 120 120 100 90 130 130
1 Figures rounded to nearest £10 million.
A full time series for tables is available on our website www.gov.uk/government/statistics/measuring-tax-gaps-tables
3.5 Methodology and data issues
More detailed description of methodologies used in calculating Excise Taxes tax gap are covered in the ‘Methodological annex’ publication.
The methodological annex is available on our website www.gov.uk/government/statistics/measuring-tax-gaps
3.5.1 Beer
Upper estimate
The beer tax gap upper estimate is produced using a ‘top-down’ methodology: total consumption is estimated, and then the legitimate consumption is subtracted, with the remainder being the illicit market.
Total consumption is estimated using the Office for National Statistics (ONS) Living Costs and Food (LCF) survey. Legitimate consumption is based on the returns that HMRC receives from the volumes of alcohol on which duty have been paid and estimates of cross-border shopping and duty free.
Lower estimate
The beer tax gap lower estimate is produced using a ‘bottom-up’ methodology. This means estimates of illicit beer are made directly, using HMRC data. This type of methodology is less comprehensive than the ‘top-down’ approach, as it does not cover all types of fraud. The lower estimate includes only estimates of the diversion of UK-produced beer and drawback fraud and is therefore an underestimate.
Difficulty in estimating a number of beer frauds means they are not included in this methodology and is one of the reasons it is described as a lower-bound estimate. The types of frauds not covered include smuggled beer, diversion of foreign-produced beer and counterfeit beer.
Implied central estimate
The implied central estimate is calculated as the average of the upper and lower estimates. Taking the mid-point of both estimates is the best approach, where we are unable to measure appropriate confidence intervals. The central estimate is only intended as an indicator of long-term trend – the true tax gap could lie anywhere within these bounds.
46 Measuring tax gaps 2016 edition
The upper and lower estimates should be interpreted as indicators of the long-term trend, rather than precise estimates of the level or year-on-year changes. They do not take account of any systematic tendency to over or under estimate the tax gap that might arise from the modelling assumptions.
3.5.2 Spirits
The spirits tax gap estimate is produced using a ‘top-down’ methodology that involves estimating total consumption from which legitimate consumption is then subtracted — with the remainder being the illicit market.
Total consumption is estimated using data from the ONS Living Costs and Food (LCF) survey. Legitimate consumption is based on the returns HMRC receives from the volumes of alcohol on which duty have been paid and an estimate of cross-border shopping and duty free.
For spirits, the central estimate should be interpreted as an indicator of the long-term trends in the illicit market share, rather than a precise estimate of the level or year-on-year changes. The confidence intervals indicate the uncertainty surrounding the estimate due to sampling error. They do not account for additional types of error that may arise from the assumptions made in the calculations.
3.5.3 Wine
The wine tax gap was previously estimated using an experimental ‘top-down’ methodology. As with spirits and the beer upper bound estimate, legitimate consumption is subtracted from estimated total consumption with the remainder being the illicit market.
Wine presents a unique challenge for estimating total consumption. Whereas HMRC is able to use the Living Costs and Food (LCF) survey to estimate consumption of beer and spirits, the LCF is a survey of households and there is a sizeable non-household component of spending on wine. For example, businesses will spend money on wine entertaining clients and potential clients. This business expenditure is not captured by the LCF survey of households.
Furthermore, although the LCF is a representative survey of households, it may not adequately capture infrequent, but high volume, expenditure on wine for example, the cost of providing wine at a wedding or other large function. HMRC previously used commercial data to estimate these additional components of wine expenditure. However, due to a change in the underlying data source used, we cannot use existing methodology to estimate the wine tax gap for 2013-14 and 2014-15. An illustrative estimate is provided using the average of the 2011-12 and 2012-13 estimates instead. HMRC is exploring alternative data sources in order to develop a new method to estimate the wine tax gap.

HM Revenue and Customs 47
Excise
3.5.4 Tobacco
The estimates are produced using a ‘top-down’ methodology: total consumption is estimated, from which legitimate consumption is subtracted, the remainder being the illicit market.
Total consumption is estimated using data from the ONS Opinions and Lifestyle survey. Legitimate consumption is based on the returns that HMRC receives from the volumes of tobacco on which duty have been paid and an estimate of cross-border shopping and duty free.
In addition to the uplift that accounts for under-reporting, there is an uplift that accounts for people who falsely deny smoking, which comes from the Health Survey for England.
The estimates are presented within a range defined by the upper and lower estimates. The range provides an indication of the size of both the illicit markets in cigarettes and hand-rolling tobacco depending on how dual smoker survey respondents are treated. The upper bound for cigarettes corresponds to a scenario where the majority of dual smokers consume cigarettes. The lower bound for cigarettes is calculated when cigarettes consumption by dual smokers is at a minimum. The upper and lower bounds for hand-rolling tobacco are calculated in a similar way. This means that the upper (or lower) bounds for both cigarettes and hand-rolling tobacco cannot be possible at the same time.
3.5.5 Oils
The central point estimates are best interpreted as an indicator of long-term trends in the illicit market share rather than precise estimates of the level or year-on-year changes. The upper and lower estimates corresponding to confidence intervals indicate the range where the true value of the illicit market may lie and arises because of random sampling error and the uncertainties associated with model input data.
For example, to estimate total fuel consumption we use estimates of how many kilometres are driven in total by different types of vehicle on different types of road and estimates of fuel efficiency corresponding to those journeys, as we cannot directly observe how much fuel is used in a year. If our estimate of distance travelled is too high or too low, or our estimates of fuel efficiency are too generous or too conservative, this will have an impact on the tax gap. The confidence intervals reflect the uncertainty in model inputs such as these.
Great Britain diesel
The Great Britain (GB) diesel tax gap estimates are produced using a ‘top-down’ methodology; total consumption is estimated, from which legitimate consumption is subtracted, with the remainder being the illicit market.
Estimates of GB diesel and petrol consumption are taken from a number of data sources, including sample surveys, vehicle testing and our own data.
The illicit market share in GB petrol is assumed to be negligible and this assumption lies behind the calculation for GB diesel. It remains difficult to estimate a comparatively small illicit market using top-down methods.

48 Measuring tax gaps 2016 edition
2013-14 estimates have been carried forward for 2014-15. HMRC is exploring alternative data sources in order to develop a new method to estimate the GB diesel tax gap.
Northern Ireland diesel
Estimates of Northern Ireland (NI) diesel and petrol consumption are based on the average consumption per vehicle in Great Britain.
The non-UK duty paid market is estimated and then cross-border shopping is subtracted to determine the illicit market. The non-UK duty paid market includes both the illicit market and legitimate cross-border shopping consumed in NI. It is difficult to separate these two markets and HMRC did not have an estimate of cross-border shopping between NI and the Republic of Ireland. Exploratory modelling was carried out in 2013 which gave us an indication of the cross-border shopping element. This estimate clearly indicates that in most years about half of the non-UK duty paid figure is from completely legitimate cross-border shopping and has been carried forward for the 2013-14 estimates.
2013-14 estimates have been carried forward for 2014-15. HMRC is exploring alternative data sources in order to develop a new method to estimate the NI diesel tax gap.
Northern Ireland petrol
Estimates of NI consumption are based on the average consumption per vehicle in Great Britain. The estimates for NI petrol relate to the non-UK duty paid market, rather than the illicit market.
3.5.6 Other excise duties
A proxy indicator for the scale of revenue losses across other excise duties has been produced by estimating the average percentage of tax gaps for similar taxes each year and multiplying this by total theoretical tax liabilities (receipts plus tax gap).
The average percentage revenue losses should not be considered estimates of the true percentage loss across the taxes listed in section 3.4 under ‘Other excise duties’ as this is unknown. Many of the taxes listed are very different from one another in their nature, each being subject to different rules. The true percentage tax gaps are therefore likely to vary across the taxes listed.
3.6 Revisions
3.6.1 Beer, spirits and wine
The Living Cost and Food survey results are published 18 months after the survey takes place. For this reason, the 2014-15 tax gap estimates for beer and spirits published last year in ‘Measuring tax gaps 2015 edition’ have all been revised with new data on consumption for the final quarter replacing previously forecast information. The latest estimates for 2014-15 are provisional, as forecasted data on consumption has been used for the final quarter of 2014-15.
There are also minor revisions to some historical data sources.

HM Revenue and Customs 49
Excise
3.6.2 Tobacco
Information on people who falsely deny tobacco use from Health Survey England has been updated. This affects total consumption estimates and has led to revisions to previously published estimates. The update was due to an improvement to the methodology rather than a shift in behaviour (i.e. an increase or decrease in people falsely denying tobacco use). Therefore the time series has been updated. For more information please refer to the ‘Methodological annex’.
The methodological annex is available on our website www.gov.uk/government/statistics/measuring-tax-gaps

50 Measuring tax gaps 2016 edition
Key findings
In 2014-15 the total estimated tax gap for income tax, National Insurance Contributions and Capital Gains Tax was £15.5 billion. This equates to 5.2% of total theoretical tax liabilities. It accounts for 43% of the overall tax gap in 2014-15.
Individuals and partnerships in Self Assessment
The 2014-15 SA tax gap of £7.0 billion is equivalent to 19% of Self Assessment (SA) theoretical tax liabilities.
The tax gap from business taxpayers (sole traders and small partnerships) contributes the majority of the total SA tax gap (£5.0 billion), with non-business taxpayers accounting for £1.0 billion and large partnerships accounting for £1.0 billion.
The proportion of SA taxpayers who under-declared their tax liabilities has fallen from 29% in 2005-06 to 22% in 2012-13.
Business taxpayers are more likely to under-declare their tax liabilities than non-business taxpayers (30% for business compared to 12% for non-business in the latest year).
£7.0bn
£4.4bn
£2.8bn
£1.3bn
Components of income tax, National Insurance Contributions and Capital Gains Tax, 2014-15
Self Assessment
Hidden economy
Employers
Avoidance
Income tax, NICs and Capital Gains Tax
4. Income tax, NICs and Capital Gains Tax
£15.5bn
£12.7bn
£3.7bn
£2.8bn
Tax gap by type of tax, 2014-15
IT, NICs and CGT
Value Added Tax
Corporation Tax
Excise duties
Other taxes£1.3bn
HM Revenue and Customs 51
Income tax, NICs and Capital Gains Tax
Employers
The 2014-15 employers tax gap of £2.8 billion is equivalent to 1.1% of employer Pay As You Earn (PAYE) theoretical tax liabilities.
The tax gap from small and medium-sized enterprise (SME) employers was £0.9 billion (1.3% of SME employer PAYE theoretical tax liabilities). The tax gap from large employers was £1.9 billion (1.1% of large employer PAYE theoretical tax liabilities).
The proportion of SME employers failing to correctly operate their PAYE scheme has decreased from 41% in 2005-06 to 24% in 2014-15.
Avoidance
The avoidance tax gap for income tax, National Insurance Contributions and Capital Gains Tax for 2014-15 is estimated to be £1.3 billion.
Hidden economy
The direct tax hidden economy estimate is £4.4 billion in 2014-15. This consists of ghosts (£1.2 billion), moonlighters (£2.0 billion) and PAYE individuals not in SA (£1.2 billion).
Results and tables
Self Assessment and employers
The overall tax gap for income tax, National Insurance Contributions and Capital Gains Tax (IT, NICs and CGT) is estimated in a number of different ways. The estimates for individuals and small partnerships who complete SA returns, and small and medium-sized employers are both from the results of random enquiry programmes (REPs). The tax gaps for large partnerships and large employers are illustrative estimates of the tax gap produced by assuming the tax at risk will represent a similar proportion of theoretical tax liabilities to all other SA or employer taxpayers. For more information, see the ‘Methodology and data issues section’.
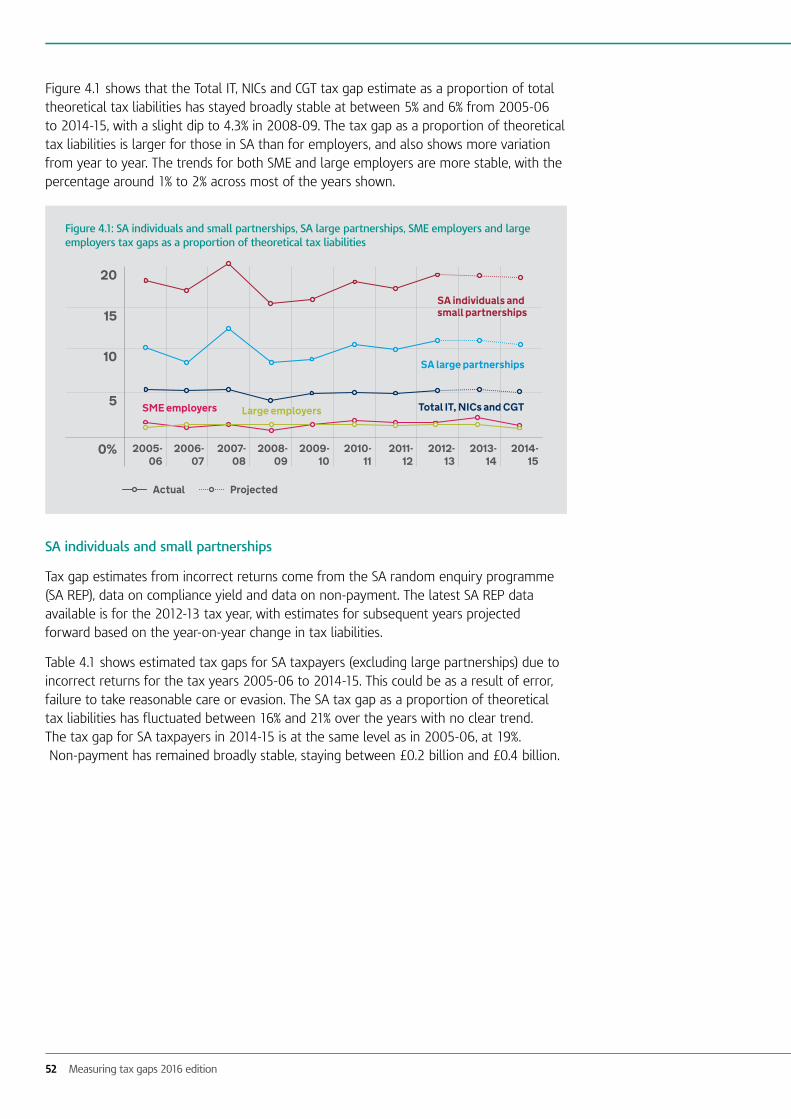
52 Measuring tax gaps 2016 edition
Figure 4.1 shows that the Total IT, NICs and CGT tax gap estimate as a proportion of total theoretical tax liabilities has stayed broadly stable at between 5% and 6% from 2005-06 to 2014-15, with a slight dip to 4.3% in 2008-09. The tax gap as a proportion of theoretical tax liabilities is larger for those in SA than for employers, and also shows more variation from year to year. The trends for both SME and large employers are more stable, with the percentage around 1% to 2% across most of the years shown.
SA individuals and small partnerships
Tax gap estimates from incorrect returns come from the SA random enquiry programme (SA REP), data on compliance yield and data on non-payment. The latest SA REP data available is for the 2012-13 tax year, with estimates for subsequent years projected forward based on the year-on-year change in tax liabilities.
Table 4.1 shows estimated tax gaps for SA taxpayers (excluding large partnerships) due to incorrect returns for the tax years 2005-06 to 2014-15. This could be as a result of error, failure to take reasonable care or evasion. The SA tax gap as a proportion of theoretical tax liabilities has fluctuated between 16% and 21% over the years with no clear trend. The tax gap for SA taxpayers in 2014-15 is at the same level as in 2005-06, at 19%. Non-payment has remained broadly stable, staying between £0.2 billion and £0.4 billion.
Figure 4.1: SA individuals and small partnerships, SA large partnerships, SME employers and large employers tax gaps as a proportion of theoretical tax liabilities
10
5
SA individuals and small partnerships
0%
SA large partnerships
Total IT, NICs and CGT SME employers
15
2005-06
2006-07
2007-08
2008-09
2009-10
2010- 11
2011- 12
2012- 13
2013- 14
2014- 15
20
Large employers
Actual Projected

HM Revenue and Customs 53
Income tax, NICs and Capital Gains Tax
Table 4.1: SA tax gap (excluding large partnerships) (£ billion)1
2005-06 2009-10 2010-11 2011-12 2012-13 2013-142 2014-152
Under-declared liabilities due to incorrect returns
Upper estimate 9.6 10.2 10.4 8.7 10.4 11.0 12.6
Central estimate 5.4 5.0 5.1 4.6 5.5 5.8 6.6
Lower estimate 2.6 2.6 2.0 2.2 2.5 2.7 3.1
Compliance yield3 0.6 0.9 0.7 0.6 0.7 0.7 0.8
Non-payment 0.2 0.3 0.3 0.2 0.2 0.2 0.2
Total tax gap
Upper estimate 9.1 9.6 10.0 8.3 9.9 10.5 12.0
Central estimate 4.9 4.4 4.6 4.2 5.0 5.3 6.0
Lower estimate 2.1 2.0 1.6 1.8 2.1 2.2 2.5
Total theoretical tax liabilities
26.5 27.2 25.3 24.4 26.0 28.0 31.3
Proportion of liabilities
19% 16% 18% 17% 19% 19% 19%
1 Figures rounded to the nearest £0.1 billion. As a result components may not appear to sum.2 Tax gap estimates for 2013-14 and 2014-15 are projected based on SA liabilities figures for the respective years and will be
revised when operational data becomes available.3 By period of settlement of enquiry.
A full time series for tables is available on our website www.gov.uk/government/statistics/measuring-tax-gaps-tables
Table 4.2 shows estimated tax gaps for SA taxpayers (excluding large partnerships) split by business and non-business taxpayers for the tax years 2005-06 to 2014-15. Business taxpayers accounted for 83% to 90% of the total tax gap between 2005-06 and 2014-15, except for 2007-08 when the level decreased to 73%. The full data series can be seen in the online tables.
Table 4.2: SA tax gap by type of taxpayer (£ billion)1
2005-06 2009-10 2010-11 2011-12 2012-13 2013-142 2014-152
Business taxpayers 4.4 3.9 3.9 3.6 4.2 4.5 5.0
Non-business taxpayers 0.5 0.6 0.7 0.7 0.8 0.8 1.0
Total tax gap 4.9 4.4 4.6 4.2 5.0 5.3 6.0
1 Figures rounded to the nearest £0.1 billion. As a result components may not appear to sum.2 Tax gap estimates for 2013-14 and 2014-15 are projected based on SA liabilities figures for the respective years and will be
revised when operational data becomes available.
A full time series for tables is available on our website www.gov.uk/government/statistics/measuring-tax-gaps-tables
Table 4.3 shows the estimated proportion of incorrect SA returns leading to under-declaration of liabilities. This decreased from 29% to 22% between 2005-06 and 2012-13. The reduction is seen most clearly for lower amounts of under-declaration; the proportion where under-declaration is more than £1,000 is broadly unchanged over time.

54 Measuring tax gaps 2016 edition
Table 4.3: Proportion of SA returns with under-declared tax liability1
2005-06 2009-10 2010-11 2011-12 2012-13
Proportion of SA returns 29% 25% 21% 22% 22%
of which, size of under-declaration
£1 to £500 15% 12% 9% 10% 9%
£501 to £1,000 5% 5% 3% 4% 3%
over £1,000 9% 9% 8% 8% 9%
1 Figures rounded to the nearest 1%. As a result components may not appear to sum.
A full time series for tables is available on our website www.gov.uk/government/statistics/measuring-tax-gaps-tables
The proportion of under-declarations shown in Table 4.3 can be further split by business and non-business taxpayers. Table 4.4 shows the estimated proportion of incorrect SA returns leading to under-declaration of liabilities for 2005-06 to 2012-13 for business taxpayers only. The proportion of incorrect SA returns from business taxpayers has fallen from 49% to 30% between 2005-06 and 2012-13. The reduction is again seen most clearly for lower amounts of under-declaration.
Table 4.4: Business taxpayers: Proportion of SA returns with under-declared tax liability1
2005-06 2009-10 2010-11 2011-12 2012-13
Proportion of SA returns 49% 38% 33% 28% 30%
of which, size of under-declaration
£1 to £500 21% 15% 13% 11% 12%
£501 to £1,000 10% 8% 6% 5% 4%
over £1,000 18% 15% 15% 15% 16%
1 Figures rounded to the nearest 1%. As a result components may not appear to sum
A full time series for tables is available on our website www.gov.uk/government/statistics/measuring-tax-gaps-tables
Table 4.5 shows that between 2005-06 and 2012-13 the proportion of non-business taxpayers with under-declared liabilities is lower for non-business taxpayers than business taxpayers. This is because the majority of income tax paid by these non-business taxpayers is deducted at source under PAYE, leading to lower levels of incorrect SA returns.
Table 4.5: Non-business taxpayers: Proportion of SA returns with under-declared tax liability1
2005-06 2009-10 2010-11 2011-12 2012-13
Proportion of SA returns 14% 13% 11% 16% 12%
of which, size of under-declaration
£1 to £500 10% 8% 6% 10% 7%
£501 to £1,000 2% 2% 1% 3% 2%
over £1,000 2% 3% 3% 3% 4%
1 Figures rounded to the nearest 1%. As a result components may not appear to sum.
A full time series for tables is available on our website www.gov.uk/government/statistics/measuring-tax-gaps-tables
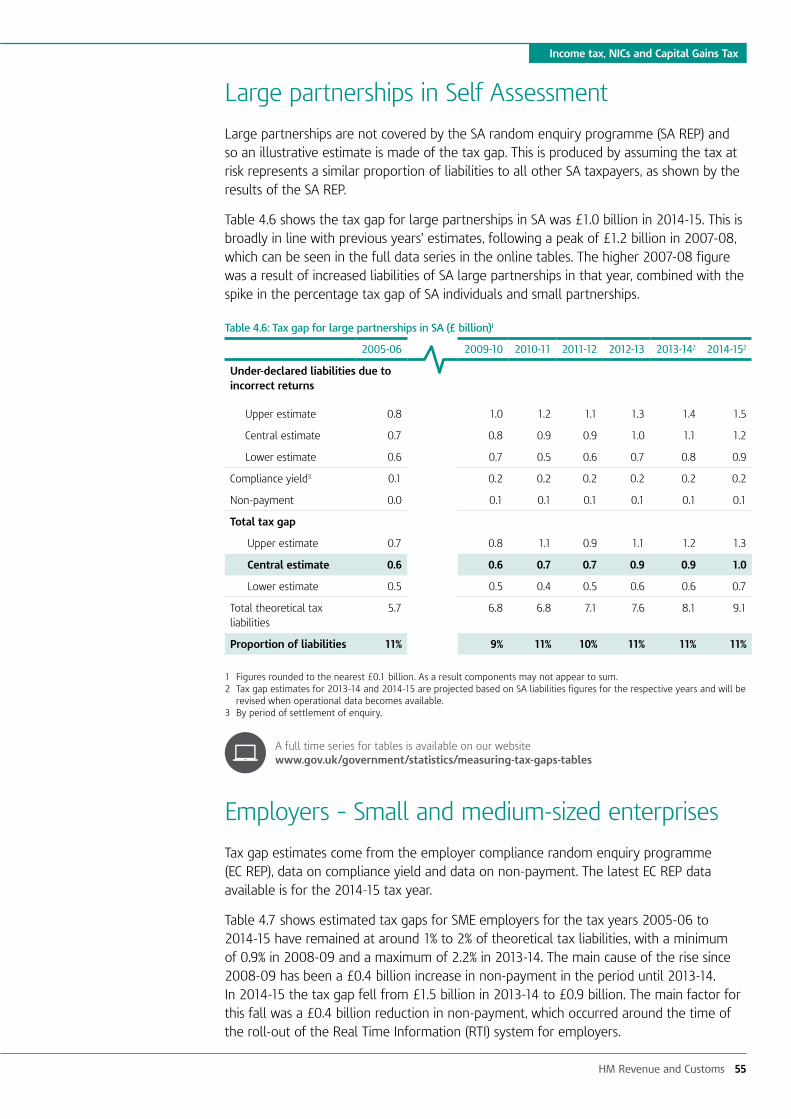
HM Revenue and Customs 55
Large partnerships in Self Assessment
Large partnerships are not covered by the SA random enquiry programme (SA REP) and so an illustrative estimate is made of the tax gap. This is produced by assuming the tax at risk represents a similar proportion of liabilities to all other SA taxpayers, as shown by the results of the SA REP.
Table 4.6 shows the tax gap for large partnerships in SA was £1.0 billion in 2014-15. This is broadly in line with previous years’ estimates, following a peak of £1.2 billion in 2007-08, which can be seen in the full data series in the online tables. The higher 2007-08 figure was a result of increased liabilities of SA large partnerships in that year, combined with the spike in the percentage tax gap of SA individuals and small partnerships.
Table 4.6: Tax gap for large partnerships in SA (£ billion)1
2005-06 2009-10 2010-11 2011-12 2012-13 2013-142 2014-152
Under-declared liabilities due to incorrect returns
Upper estimate 0.8 1.0 1.2 1.1 1.3 1.4 1.5
Central estimate 0.7 0.8 0.9 0.9 1.0 1.1 1.2
Lower estimate 0.6 0.7 0.5 0.6 0.7 0.8 0.9
Compliance yield3 0.1 0.2 0.2 0.2 0.2 0.2 0.2
Non-payment 0.0 0.1 0.1 0.1 0.1 0.1 0.1
Total tax gap
Upper estimate 0.7 0.8 1.1 0.9 1.1 1.2 1.3
Central estimate 0.6 0.6 0.7 0.7 0.9 0.9 1.0
Lower estimate 0.5 0.5 0.4 0.5 0.6 0.6 0.7
Total theoretical tax liabilities
5.7 6.8 6.8 7.1 7.6 8.1 9.1
Proportion of liabilities 11% 9% 11% 10% 11% 11% 11%
1 Figures rounded to the nearest £0.1 billion. As a result components may not appear to sum.2 Tax gap estimates for 2013-14 and 2014-15 are projected based on SA liabilities figures for the respective years and will be
revised when operational data becomes available.3 By period of settlement of enquiry.
A full time series for tables is available on our website www.gov.uk/government/statistics/measuring-tax-gaps-tables
Employers – Small and medium-sized enterprises
Tax gap estimates come from the employer compliance random enquiry programme (EC REP), data on compliance yield and data on non-payment. The latest EC REP data available is for the 2014-15 tax year.
Table 4.7 shows estimated tax gaps for SME employers for the tax years 2005-06 to 2014-15 have remained at around 1% to 2% of theoretical tax liabilities, with a minimum of 0.9% in 2008-09 and a maximum of 2.2% in 2013-14. The main cause of the rise since 2008-09 has been a £0.4 billion increase in non-payment in the period until 2013-14. In 2014-15 the tax gap fell from £1.5 billion in 2013-14 to £0.9 billion. The main factor for this fall was a £0.4 billion reduction in non-payment, which occurred around the time of the roll-out of the Real Time Information (RTI) system for employers.
Income tax, NICs and Capital Gains Tax

56 Measuring tax gaps 2016 edition
Table 4.7: Tax gap for SME employers (£ billion)1
2005-06 2009-10 2010-11 2011-12 2012-13 2013-14 2014-15
Under-declared liabilities due to incorrect returns
Upper estimate 1.1 0.7 1.3 0.9 0.6 0.8 0.6
Central estimate 0.9 0.6 0.9 0.7 0.5 0.7 0.5
Lower estimate 0.7 0.5 0.5 0.5 0.4 0.5 0.4
Compliance yield2 0.3 0.3 0.3 0.3 0.2 0.2 0.2
Non-payment 0.7 0.9 1.0 0.9 0.8 1.0 0.6
Total tax gap
Upper estimate 1.5 1.3 2.0 1.4 1.1 1.7 1.0
Central estimate 1.3 1.2 1.6 1.2 1.0 1.5 0.9
Lower estimate 1.1 1.1 1.2 1.0 0.9 1.3 0.9
Total theoretical tax liabilities
77.1 82.3 84.1 70.5 69.2 68.3 70.1
Proportion of liabilities 1.7% 1.5% 1.9% 1.7% 1.5% 2.2% 1.3%
1 Figures rounded to the nearest £0.1 billion. As a result components may not appear to sum. Year relates to when enquiry was opened as employer compliance queries are not made in relation to an annual return. Values exclude the tax gap relating to avoidance; this figure is available as an aggregate figure for IT, NICs and CGT.
2 By period of settlement of enquiry.
A full time series for tables is available on our website www.gov.uk/government/statistics/measuring-tax-gaps-tables
Table 4.8 shows the estimated proportion of employers failing to fully meet their obligations in respect of operating PAYE has fallen from 41% in 2005-06 to 24% in 2014-15. This fall is a result of a drop in small under-declarations (up to £1,000).
Table 4.8: Proportion of SME employers not meeting their PAYE scheme obligations1
2005-06 2009-10 2010-11 2011-12 2012-13 2013-14 2014-15
Proportion of PAYE schemes 41% 27% 26% 25% 20% 21% 24%
of which, size of under-declaration
£1 to £1,000 23% 12% 12% 8% 5% 11% 7%
over £1,000 18% 14% 13% 17% 15% 11% 17%
1 Figures rounded to the nearest 1%. As a result components may not appear to sum. Year relates to when enquiry was opened as employer compliance queries are not made in relation to an annual return.
A full time series for tables is available on our website www.gov.uk/government/statistics/measuring-tax-gaps-tables
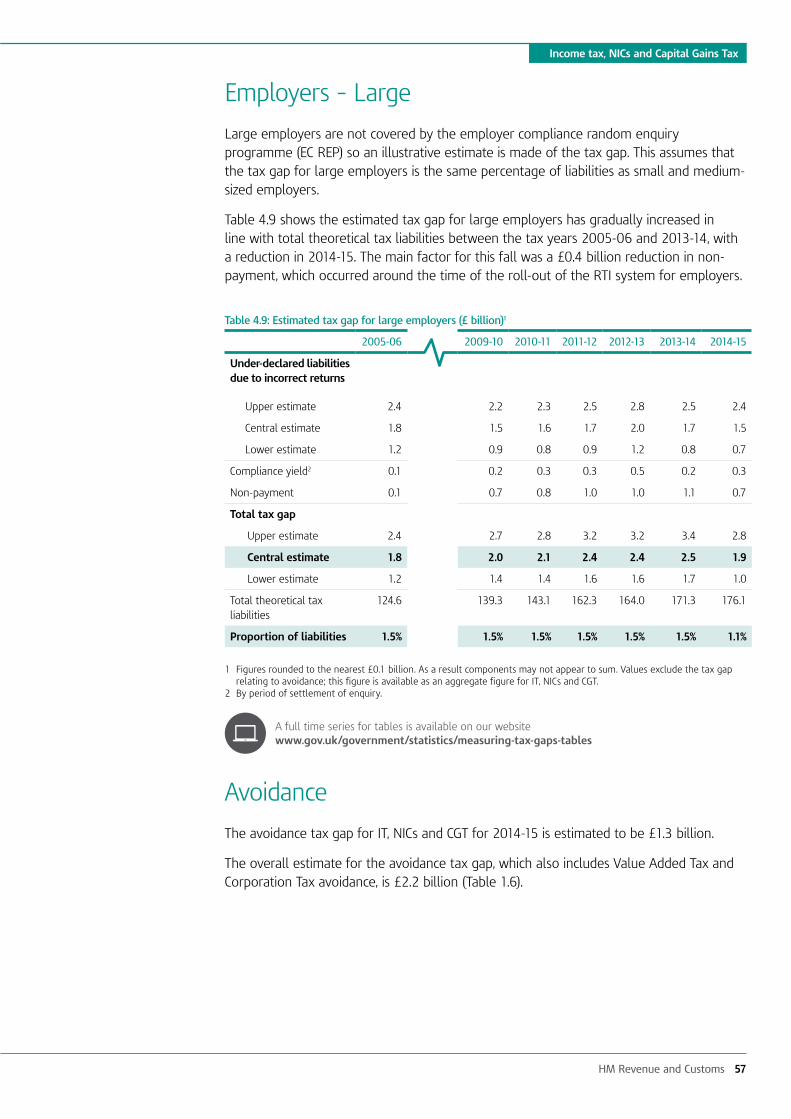
HM Revenue and Customs 57
Employers – Large
Large employers are not covered by the employer compliance random enquiry programme (EC REP) so an illustrative estimate is made of the tax gap. This assumes that the tax gap for large employers is the same percentage of liabilities as small and medium-sized employers.
Table 4.9 shows the estimated tax gap for large employers has gradually increased in line with total theoretical tax liabilities between the tax years 2005-06 and 2013-14, with a reduction in 2014-15. The main factor for this fall was a £0.4 billion reduction in non-payment, which occurred around the time of the roll-out of the RTI system for employers.
Table 4.9: Estimated tax gap for large employers (£ billion)1
2005-06 2009-10 2010-11 2011-12 2012-13 2013-14 2014-15
Under-declared liabilities due to incorrect returns
Upper estimate 2.4 2.2 2.3 2.5 2.8 2.5 2.4
Central estimate 1.8 1.5 1.6 1.7 2.0 1.7 1.5
Lower estimate 1.2 0.9 0.8 0.9 1.2 0.8 0.7
Compliance yield2 0.1 0.2 0.3 0.3 0.5 0.2 0.3
Non-payment 0.1 0.7 0.8 1.0 1.0 1.1 0.7
Total tax gap
Upper estimate 2.4 2.7 2.8 3.2 3.2 3.4 2.8
Central estimate 1.8 2.0 2.1 2.4 2.4 2.5 1.9
Lower estimate 1.2 1.4 1.4 1.6 1.6 1.7 1.0
Total theoretical tax liabilities
124.6 139.3 143.1 162.3 164.0 171.3 176.1
Proportion of liabilities 1.5% 1.5% 1.5% 1.5% 1.5% 1.5% 1.1%
1 Figures rounded to the nearest £0.1 billion. As a result components may not appear to sum. Values exclude the tax gap relating to avoidance; this figure is available as an aggregate figure for IT, NICs and CGT.
2 By period of settlement of enquiry.
A full time series for tables is available on our website www.gov.uk/government/statistics/measuring-tax-gaps-tables
Avoidance
The avoidance tax gap for IT, NICs and CGT for 2014-15 is estimated to be £1.3 billion.
The overall estimate for the avoidance tax gap, which also includes Value Added Tax and Corporation Tax avoidance, is £2.2 billion (Table 1.6).
Income tax, NICs and Capital Gains Tax
58 Measuring tax gaps 2016 edition
Hidden economy
The direct tax hidden economy estimate of £4.4 billion in 2014-15 consists of three elements: ghosts, moonlighters and PAYE individuals not in SA.
Ghosts and moonlighters
The 2014-15 illustrative estimate of the tax gap for ghosts was £1.2 billion and for moonlighters was £2.0 billion.
PAYE individuals not in SA
Estimates relating to the income and capital gains of individuals taxed through PAYE in 2014-15 and for whom HMRC do not receive SA returns was £1.2 billion. Estimates for 2010-11 to 2014-15 are projected from 2009-10 data in line with the trend in gross domestic product (GDP).
Methodology and data issues
Overview
Most of the IT, NICs and CGT components of the tax gap are estimated using our own sources, such as surveys, administrative and operational data. These methods are based on our compliance activity which can, in some cases, take years to complete. This means the resulting tax gap estimates typically apply to periods before 2014-15. This has two consequences:
• To produce a tax gap for years where we do not have random enquiry data, the latest available estimate is projected forward. The projections are made using the change in the tax liabilities for the relevant tax. Using tax liabilities ensures that our projections reflect changes to tax rates and taxable income, and projects a stable rate of underlying compliance. Hidden economy components are projected forward using growth in GDP or wages and salaries rather than tax liabilities, as there is no directly relevant data series to base predictions on.
• Estimates for earlier years have been revised, as they now include additional data from compliance checks that have been completed since last year’s publication.
The methods used differ between taxes, according to the type of non-compliance and the type of taxpayer involved. The main methods used to estimate tax gaps for direct taxes are random enquiries, data matching and risk registers. Where robust methodologies have not yet been developed, an illustrative estimate of the tax gap is given, based on our operational experts opinion or calculated by selecting the nearest equivalent measured gap. Further information on the methodology to calculate tax gap estimates from random enquiries can be found in the ‘Methodological annex’.
The methodological annex is available on our website www.gov.uk/government/statistics/measuring-tax-gaps
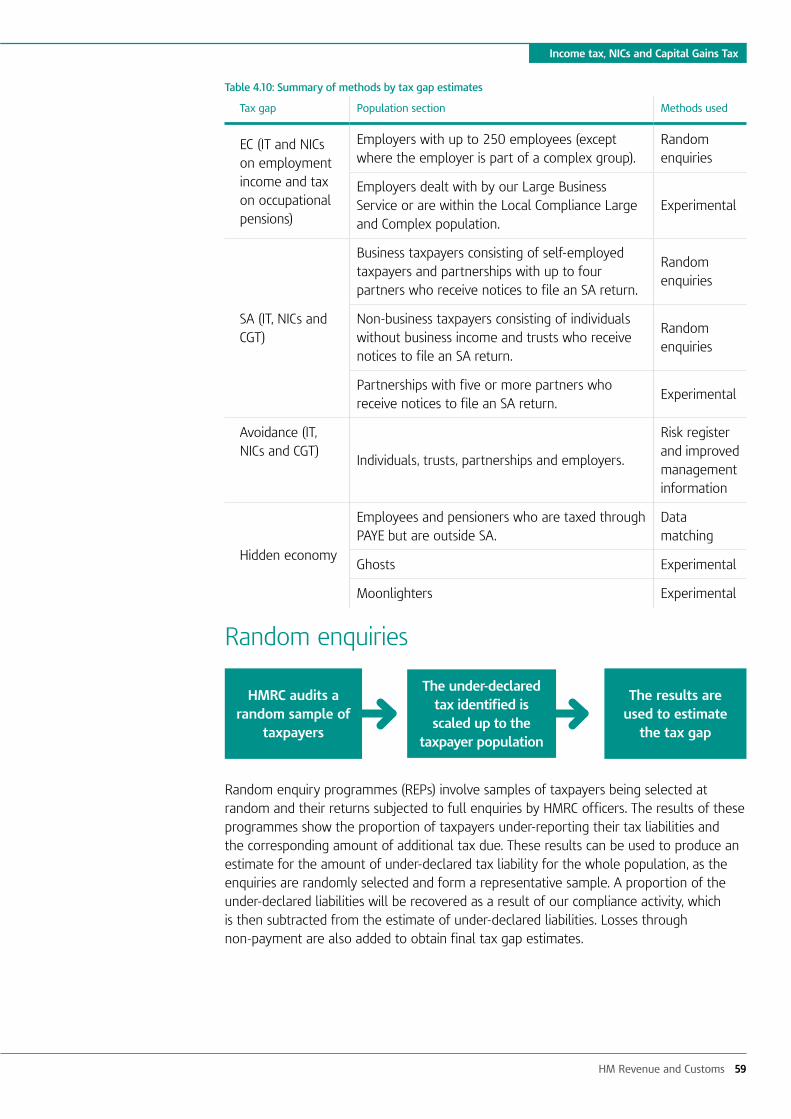
HM Revenue and Customs 59
Table 4.10: Summary of methods by tax gap estimates
Tax gap Population section Methods used
EC (IT and NICs on employment income and tax on occupational pensions)
Employers with up to 250 employees (except where the employer is part of a complex group).
Random enquiries
Employers dealt with by our Large Business Service or are within the Local Compliance Large and Complex population.
Experimental
SA (IT, NICs and CGT)
Business taxpayers consisting of self-employed taxpayers and partnerships with up to four partners who receive notices to file an SA return.
Random enquiries
Non-business taxpayers consisting of individuals without business income and trusts who receive notices to file an SA return.
Random enquiries
Partnerships with five or more partners who receive notices to file an SA return.
Experimental
Avoidance (IT, NICs and CGT)
Individuals, trusts, partnerships and employers.
Risk register and improved management information
Hidden economy
Employees and pensioners who are taxed through PAYE but are outside SA.
Data matching
Ghosts Experimental
Moonlighters Experimental
Random enquiries
Random enquiry programmes (REPs) involve samples of taxpayers being selected at random and their returns subjected to full enquiries by HMRC officers. The results of these programmes show the proportion of taxpayers under-reporting their tax liabilities and the corresponding amount of additional tax due. These results can be used to produce an estimate for the amount of under-declared tax liability for the whole population, as the enquiries are randomly selected and form a representative sample. A proportion of the under-declared liabilities will be recovered as a result of our compliance activity, which is then subtracted from the estimate of under-declared liabilities. Losses through non-payment are also added to obtain final tax gap estimates.
Income tax, NICs and Capital Gains Tax
HMRC audits a random sample of
taxpayers
The under-declared tax identified is scaled up to the
taxpayer population
The results are used to estimate
the tax gap
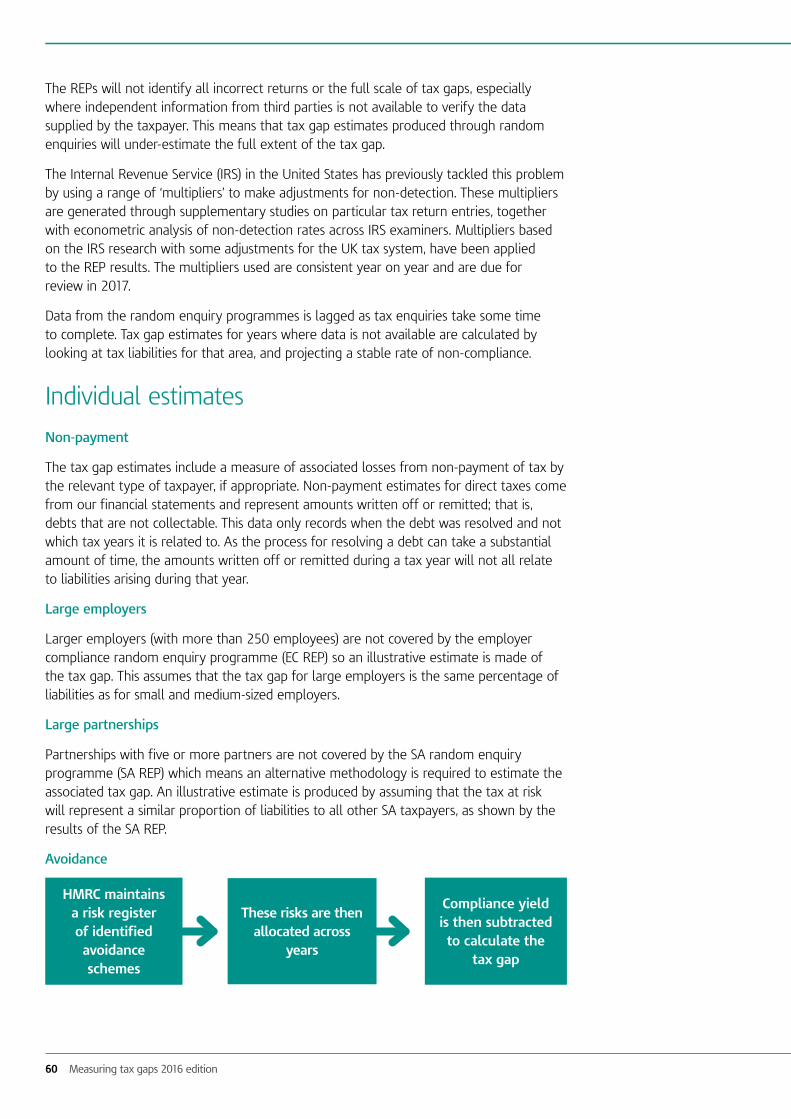
60 Measuring tax gaps 2016 edition
The REPs will not identify all incorrect returns or the full scale of tax gaps, especially where independent information from third parties is not available to verify the data supplied by the taxpayer. This means that tax gap estimates produced through random enquiries will under-estimate the full extent of the tax gap.
The Internal Revenue Service (IRS) in the United States has previously tackled this problem by using a range of ‘multipliers’ to make adjustments for non-detection. These multipliers are generated through supplementary studies on particular tax return entries, together with econometric analysis of non-detection rates across IRS examiners. Multipliers based on the IRS research with some adjustments for the UK tax system, have been applied to the REP results. The multipliers used are consistent year on year and are due for review in 2017.
Data from the random enquiry programmes is lagged as tax enquiries take some time to complete. Tax gap estimates for years where data is not available are calculated by looking at tax liabilities for that area, and projecting a stable rate of non-compliance.
Individual estimates
Non-payment
The tax gap estimates include a measure of associated losses from non-payment of tax by the relevant type of taxpayer, if appropriate. Non-payment estimates for direct taxes come from our financial statements and represent amounts written off or remitted; that is, debts that are not collectable. This data only records when the debt was resolved and not which tax years it is related to. As the process for resolving a debt can take a substantial amount of time, the amounts written off or remitted during a tax year will not all relate to liabilities arising during that year.
Large employers
Larger employers (with more than 250 employees) are not covered by the employer compliance random enquiry programme (EC REP) so an illustrative estimate is made of the tax gap. This assumes that the tax gap for large employers is the same percentage of liabilities as for small and medium-sized employers.
Large partnerships
Partnerships with five or more partners are not covered by the SA random enquiry programme (SA REP) which means an alternative methodology is required to estimate the associated tax gap. An illustrative estimate is produced by assuming that the tax at risk will represent a similar proportion of liabilities to all other SA taxpayers, as shown by the results of the SA REP.
Avoidance
HMRC maintains a risk register of identified avoidance schemes
These risks are then allocated across
years
Compliance yield is then subtracted to calculate the
tax gap
HM Revenue and Customs 61
Income tax, NICs and Capital Gains Tax
The IT, NICs and CGT avoidance tax gap of £1.3 billion for 2014-15 is estimated using HMRC’s ‘risk register’ of information on identified avoidance schemes used by individuals, trusts, partnerships and employers. The method used to allocate risks across years has been improved this year using better management information. The tax gap is calculated by subtracting an annual estimate of the compliance yield from the annual estimated tax under consideration relating to avoidance. (See ‘Methodological annex’ for more information on data sources, methodology and limitations).
Hidden economy
The direct tax hidden economy estimate is composed of three elements:
• PAYE individuals not in SA
• Ghosts
• Moonlighters
PAYE individuals not in SA
A tax gap estimate is produced for employees and pensioners taxed under PAYE who do not receive SA returns and have not returned details of additional taxable income.
In the absence of updated data and consistent with estimates for 2010-11 to 2013-14, the estimate for 2014-15 is projected from the methodology that produced the 2009-10 estimate using the trend in GDP.
By matching data supplied by third parties to a sample of our PAYE records, it has been possible to produce a tax gap estimate relating to some sources of income and capital gains of individuals taxed through PAYE, but who do not receive SA returns. Several sources of income were investigated, such as income from lettings, bank and building society interest and capital gains. Where a difference was found between income in the third-party data and the tax records, the tax that should have been paid on this income, if any, was then calculated and identified as the tax gap. The results from the sample were then grossed to produce an estimate of the overall tax gap for all employees and pensioners taxed through PAYE who are outside SA.
The limitations associated with the results of this exercise relate to the coverage of the third-party data used to establish evidence of additional undeclared income. Not all potential sources of income could be investigated, due to availability of data, and the investigation of some sources was limited by the completeness of the information. As a result, the estimate should be interpreted as a lower limit for the true scale of the tax gap relating to this group of taxpayers.
Ghosts and moonlighters
‘Ghosts’ are individuals who receive income from employment or self-employment but are not known to HMRC because they and/or their employers fail to declare their earnings. An illustrative estimate is made of the tax gap arising for these individuals.
‘Moonlighters’ are individuals who pay tax on their main job through PAYE, but who fail to declare earnings from a second job or additional income from self-employment.
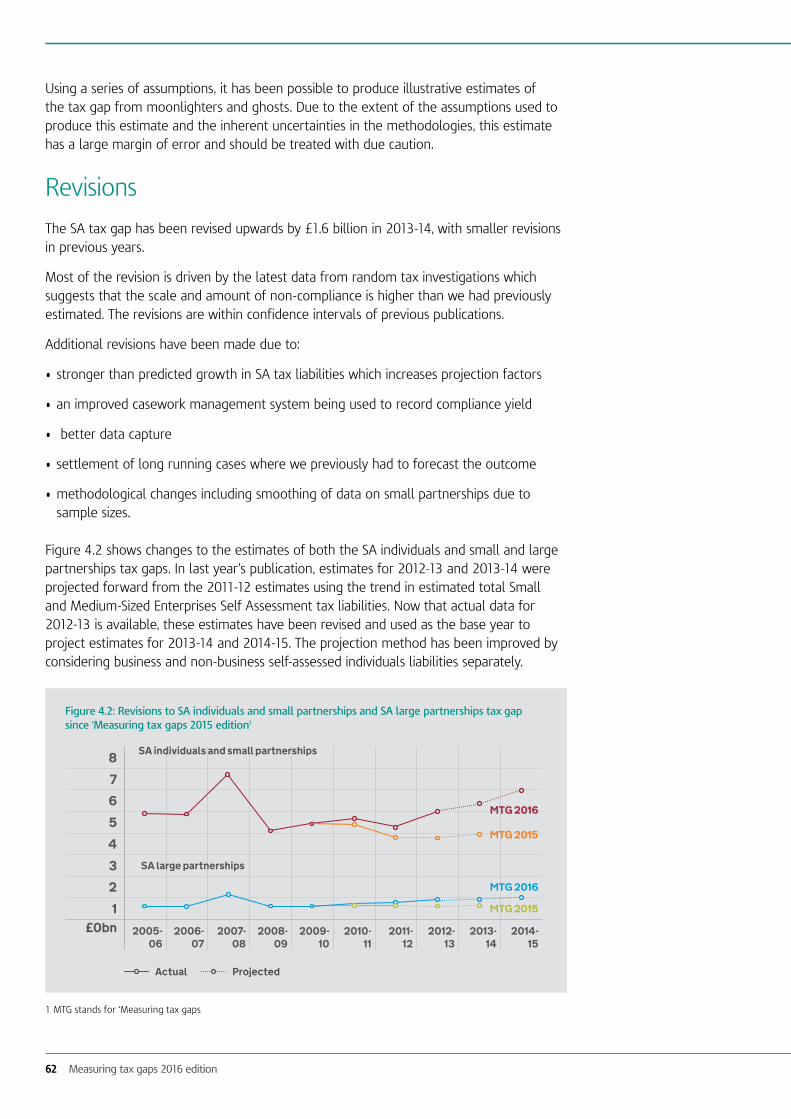
62 Measuring tax gaps 2016 edition
Using a series of assumptions, it has been possible to produce illustrative estimates of the tax gap from moonlighters and ghosts. Due to the extent of the assumptions used to produce this estimate and the inherent uncertainties in the methodologies, this estimate has a large margin of error and should be treated with due caution.
Revisions
The SA tax gap has been revised upwards by £1.6 billion in 2013-14, with smaller revisions in previous years.
Most of the revision is driven by the latest data from random tax investigations which suggests that the scale and amount of non-compliance is higher than we had previously estimated. The revisions are within confidence intervals of previous publications.
Additional revisions have been made due to:
• stronger than predicted growth in SA tax liabilities which increases projection factors
• an improved casework management system being used to record compliance yield
• better data capture
• settlement of long running cases where we previously had to forecast the outcome
• methodological changes including smoothing of data on small partnerships due to sample sizes.
Figure 4.2 shows changes to the estimates of both the SA individuals and small and large partnerships tax gaps. In last year’s publication, estimates for 2012-13 and 2013-14 were projected forward from the 2011-12 estimates using the trend in estimated total Small and Medium-Sized Enterprises Self Assessment tax liabilities. Now that actual data for 2012-13 is available, these estimates have been revised and used as the base year to project estimates for 2013-14 and 2014-15. The projection method has been improved by considering business and non-business self-assessed individuals liabilities separately.
1 MTG stands for ‘Measuring tax gaps
Figure 4.2: Revisions to SA individuals and small partnerships and SA large partnerships tax gap since ‘Measuring tax gaps 2015 edition1
1£0bn 2005-
062006-
072007-
082008-
092009-
102010-
112011-
122012-
132013-
142014-
15
2
3
4
5
6
7
8 SA individuals and small partnerships
SA large partnerships
MTG 2016
MTG 2015
MTG 2016
MTG 2015
Actual Projected
HM Revenue and Customs 63
Income tax, NICs and Capital Gains Tax
Data on small partnerships has been smoothed from 2010-11, which will lead to small revisions for all years from 2010-11 to 2013-14. This smoothing approach was introduced after reviewing the data and sampling approach used for this stratum and considering best practice for the treatment of outliers.
The 2010-11 SA individuals and small partnerships tax gap estimate has been revised upwards by £0.2 billion, from £4.4 billion in ‘Measuring tax gaps 2015 edition’ to £4.6 billion, due to some long-running cases settling for different amounts than expected. The revision for SA non-business is a £0.4 billion increase and for SA business is a £0.1 billion decrease.
The 2011-12 SA individuals and small partnerships tax gap estimate has been revised upwards from £3.8 billion in ‘Measuring tax gaps 2015 edition’ to £4.2 billion. This is split equally between business and non-business taxpayers and is mainly due to an improved casework management system being used to record compliance yield, better data capture and settlement of long-running cases.
The 2012-13 SA individuals and small partnerships tax gap estimate has been revised upwards by £1.2 billion from £3.8 billion in ‘Measuring tax gaps 2015 edition’ to £5.0 billion. This revision is due to using actual data rather than being projected from the 2011-12 estimate. Within this, SA business is revised upwards by £0.9 billion and SA non-business by £0.3 billion.
The 2013-14 SA individuals and small partnerships tax gap estimate has been revised upwards by £1.4 billion, from £3.9 billion in ‘Measuring tax gap 2015 edition’ to £5.3 billion. This increase is because for ‘Measuring tax gaps 2015 edition’ the 2013-14 figure was based on projections from the 2012-13 figure, whereas the current 2013-14 estimate is projected forward from actual random enquiry data for 2012-13. As the share of self-employed population and the economy were growing faster compared to previous years, the projections for tax gap estimate of SA individuals and small partnerships in 2013-14 are significantly higher. The upwards revision for SA business is £1.1 billion and for SA non-business it is £0.4 billion.
The SA large partnerships tax gap is an illustrative estimate, based on the findings for SA individuals and large partnerships. As these are revised upwards, the SA large partnerships estimate also increases. Since last year’s publication, the SA large partnerships has been revised upwards by £0.1 billion in both 2010-11 and 2011-12 to £0.7 billion in each of these years; by £0.3 billion in 2012-13 to £0.9 billion; and by £0.2 billion in 2013-14 to £1.0 billion.
The 2013-14 SME employers estimate has risen by £0.2 billion, from £1.3 billion in ‘Measuring tax gaps 2015 edition’ to £1.5 billion. This was mostly due to an improved casework management system being used to record compliance yield and better data capture. A second factor was an improvement in the method of allocating non-payment data between SA and PAYE.
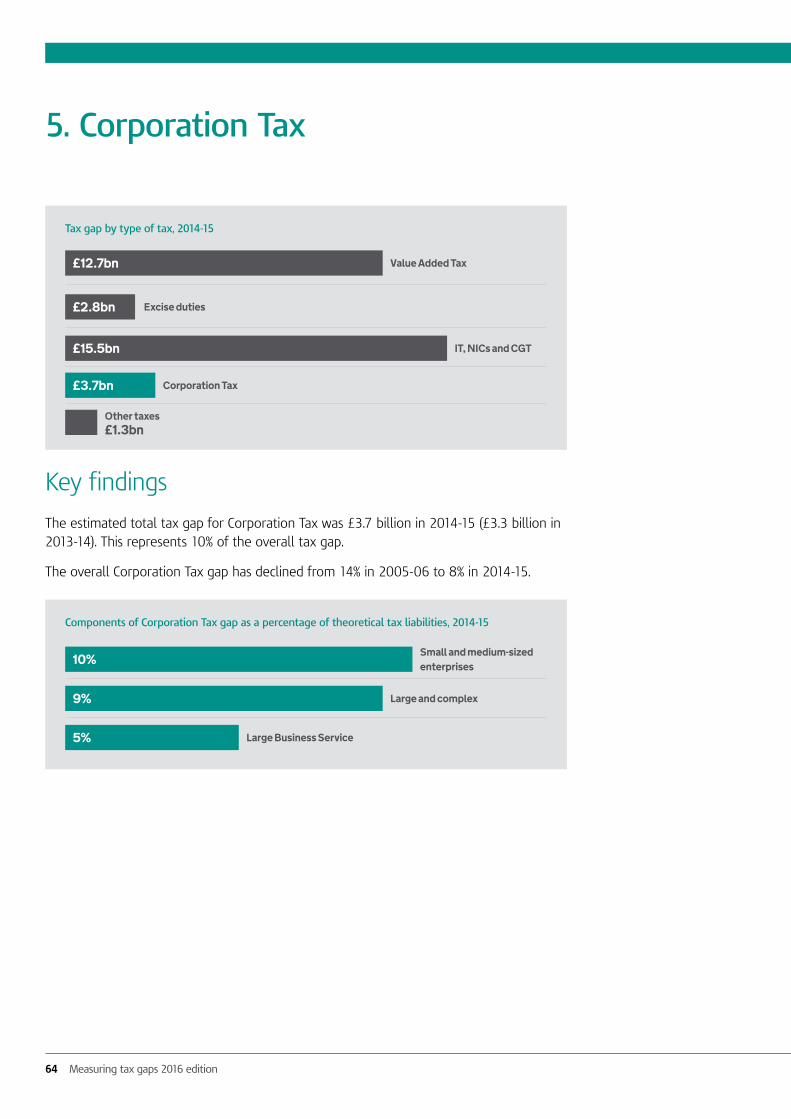
64 Measuring tax gaps 2016 edition
Corporation Tax
Key findings
The estimated total tax gap for Corporation Tax was £3.7 billion in 2014-15 (£3.3 billion in 2013-14). This represents 10% of the overall tax gap.
The overall Corporation Tax gap has declined from 14% in 2005-06 to 8% in 2014-15.
5. Corporation Tax
9%
10%
5%
Components of Corporation Tax gap as a percentage of theoretical tax liabilities, 2014-15
Large and complex
Small and medium-sized enterprises
Large Business Service
£15.5bn
£12.7bn
£3.7bn
£2.8bn
Tax gap by type of tax, 2014-15
IT, NICs and CGT
Value Added Tax
Corporation Tax
Excise duties
Other taxes£1.3bn
HM Revenue and Customs 65
Corporation Tax
Large businesses
In 2014-15 the Corporation Tax gap for large businesses was estimated to be 6% of their theoretical Corporation Tax liabilities. This relates to businesses managed in the Large Business Directorate in this year and in previous years in our Large Business Service and our Local Compliance Large and Complex directorates.
For businesses formerly in the Large Business Service, the Corporation Tax gap has declined from £2.9 billion in 2005-06 to £0.9 billion in 2014-15. As a proportion of estimated Corporation Tax liabilities, the Corporation Tax gap for those in the Large Business Service until 2013-14, and then in the Large Business Directorate declined from 9% to 5% over the same period.
The illustrative Corporation Tax gap for those businesses managed in the Local Compliance Large and Complex Directorate until the creation of the Large Business Directorate in 2014-15 is 9% of theoretical liabilities in 2014-15 (£0.7 billion).
Corporate small and medium-sized enterprisesThe Corporation Tax gap for small and medium-sized enterprises is estimated to be £2.2 billion in 2014-15, which is equivalent to 10% of small and medium-sized enterprises theoretical Corporation Tax liabilities.
The percentage tax gap for small and medium-sized enterprises declined from 19% in 2005-06 to 10% in 2014-15.
The proportion of small and medium-sized enterprises submitting an incorrect return leading to a loss of tax declined from 41% in 2005-06 to 21% in 2013-14. This is the latest year of findings from the random enquiry programme.
Results and tables
Large Business Service
The tax gap for Corporation Tax (CT) is estimated separately for large business and small and medium-sized enterprises. For the period up to 2013-14 the tax affairs of large businesses were managed by two directorates: the Large Business Service (LBS) and Local Compliance Large and Complex (L&C). The LBS handled the largest businesses, approximately 800 groups, and L&C oversaw a much larger number of comparatively smaller businesses, approximately 9,500. Data to 2012-13 which is on the LBS and L&C basis is used to project 2013-14 and 2014-15 estimates. In Chapter 1, estimates for LBS and L&C are combined under the heading ‘Large businesses’. In April 2014 a Large Business Directorate was formed to manage the tax compliance of the UK’s 2,100 largest businesses.
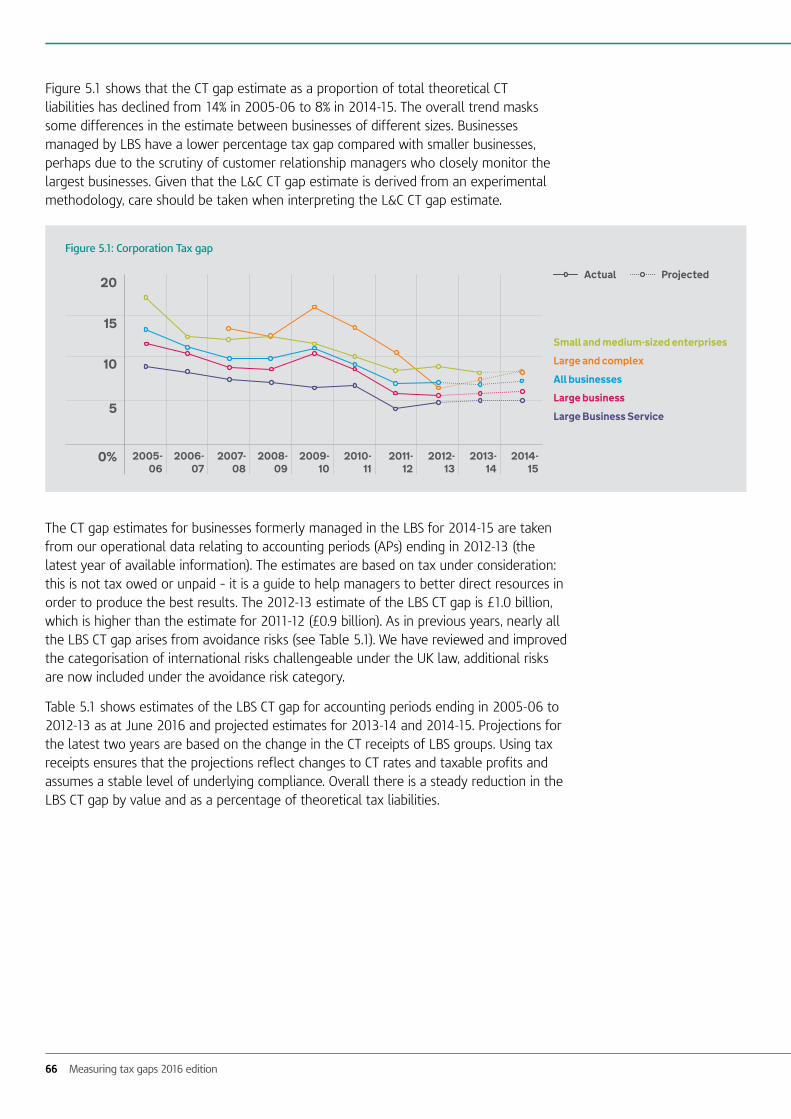
66 Measuring tax gaps 2016 edition
Figure 5.1 shows that the CT gap estimate as a proportion of total theoretical CT liabilities has declined from 14% in 2005-06 to 8% in 2014-15. The overall trend masks some differences in the estimate between businesses of different sizes. Businesses managed by LBS have a lower percentage tax gap compared with smaller businesses, perhaps due to the scrutiny of customer relationship managers who closely monitor the largest businesses. Given that the L&C CT gap estimate is derived from an experimental methodology, care should be taken when interpreting the L&C CT gap estimate.
The CT gap estimates for businesses formerly managed in the LBS for 2014-15 are taken from our operational data relating to accounting periods (APs) ending in 2012-13 (the latest year of available information). The estimates are based on tax under consideration: this is not tax owed or unpaid – it is a guide to help managers to better direct resources in order to produce the best results. The 2012-13 estimate of the LBS CT gap is £1.0 billion, which is higher than the estimate for 2011-12 (£0.9 billion). As in previous years, nearly all the LBS CT gap arises from avoidance risks (see Table 5.1). We have reviewed and improved the categorisation of international risks challengeable under the UK law, additional risks are now included under the avoidance risk category.
Table 5.1 shows estimates of the LBS CT gap for accounting periods ending in 2005-06 to 2012-13 as at June 2016 and projected estimates for 2013-14 and 2014-15. Projections for the latest two years are based on the change in the CT receipts of LBS groups. Using tax receipts ensures that the projections reflect changes to CT rates and taxable profits and assumes a stable level of underlying compliance. Overall there is a steady reduction in the LBS CT gap by value and as a percentage of theoretical tax liabilities.
Figure 5.1: Corporation Tax gap
10
5
Small and medium-sized enterprises
0%
Large and complex
All businesses
Large Business Service
15
2005-06
2006-07
2007-08
2008-09
2009-10
2010- 11
2011- 12
2012- 13
2013- 14
2014- 15
20
Large business
Actual Projected
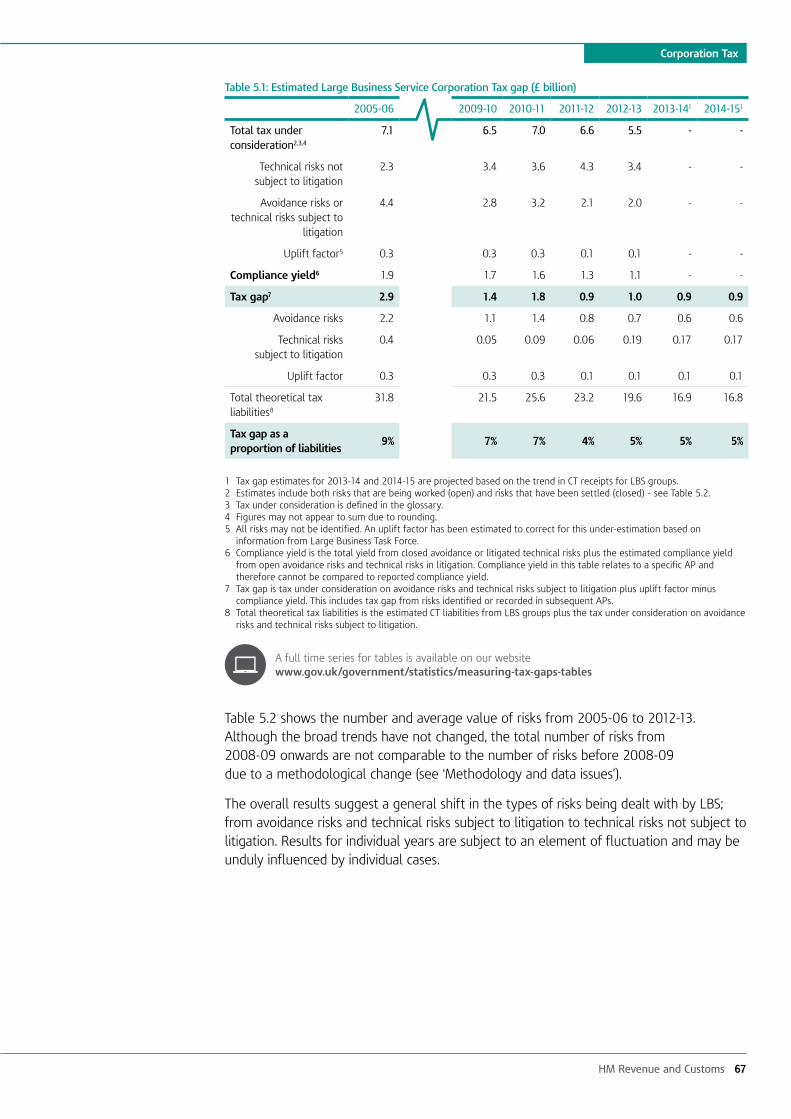
HM Revenue and Customs 67
Corporation Tax
Table 5.1: Estimated Large Business Service Corporation Tax gap (£ billion)
2005-06 2009-10 2010-11 2011-12 2012-13 2013-141 2014-151
Total tax under consideration2,3,4
7.1 6.5 7.0 6.6 5.5 - -
Technical risks not subject to litigation
2.3 3.4 3.6 4.3 3.4 - -
Avoidance risks or technical risks subject to
litigation
4.4 2.8 3.2 2.1 2.0 - -
Uplift factor5 0.3 0.3 0.3 0.1 0.1 - -
Compliance yield6 1.9 1.7 1.6 1.3 1.1 - -
Tax gap7 2.9 1.4 1.8 0.9 1.0 0.9 0.9
Avoidance risks 2.2 1.1 1.4 0.8 0.7 0.6 0.6
Technical risks subject to litigation
0.4 0.05 0.09 0.06 0.19 0.17 0.17
Uplift factor 0.3 0.3 0.3 0.1 0.1 0.1 0.1
Total theoretical tax liabilities8
31.8 21.5 25.6 23.2 19.6 16.9 16.8
Tax gap as a proportion of liabilities
9% 7% 7% 4% 5% 5% 5%
1 Tax gap estimates for 2013-14 and 2014-15 are projected based on the trend in CT receipts for LBS groups.2 Estimates include both risks that are being worked (open) and risks that have been settled (closed) – see Table 5.2.3 Tax under consideration is defined in the glossary.4 Figures may not appear to sum due to rounding.5 All risks may not be identified. An uplift factor has been estimated to correct for this under-estimation based on
information from Large Business Task Force.6 Compliance yield is the total yield from closed avoidance or litigated technical risks plus the estimated compliance yield
from open avoidance risks and technical risks in litigation. Compliance yield in this table relates to a specific AP and therefore cannot be compared to reported compliance yield.
7 Tax gap is tax under consideration on avoidance risks and technical risks subject to litigation plus uplift factor minus compliance yield. This includes tax gap from risks identified or recorded in subsequent APs.
8 Total theoretical tax liabilities is the estimated CT liabilities from LBS groups plus the tax under consideration on avoidance risks and technical risks subject to litigation.
A full time series for tables is available on our website www.gov.uk/government/statistics/measuring-tax-gaps-tables
Table 5.2 shows the number and average value of risks from 2005-06 to 2012-13. Although the broad trends have not changed, the total number of risks from 2008-09 onwards are not comparable to the number of risks before 2008-09 due to a methodological change (see ‘Methodology and data issues’).
The overall results suggest a general shift in the types of risks being dealt with by LBS; from avoidance risks and technical risks subject to litigation to technical risks not subject to litigation. Results for individual years are subject to an element of fluctuation and may be unduly influenced by individual cases.

68 Measuring tax gaps 2016 edition
Table 5.2: Corporation Tax risks for Large Business Service groups
2005-06 2006-07 2007-08 2008-09 2009-10 2010-11 2011-12 2012-13
Total number of risks1,2 1,940 1,475 1,245 830 660 670 755 650
Technical risks not subject to litigation
1,390 1,010 875 615 485 495 640 575
Avoidance risks or technical risks subject to litigation
550 460 370 215 175 180 115 75
Average tax under consideration from all risks (£ million)3
3.3 4.7 5.3 6.9 9.4 10.1 8.5 8.3
Technical risks not subject to litigation
1.7 2.8 4.0 4.4 7.0 7.3 6.7 6.0
Avoidance risks or technical risks subject to litigation
7.3 9.0 8.3 12.9 14.1 15.2 15.0 19.9
Percentage of risks closed (%) 96% 95% 90% 91% 87% 76% 64% 51%
Percentage of tax under consideration closed (%)
92% 92% 76% 79% 53% 74% 54% 31%
1 Risks may span more than one accounting period (AP), but are capped at five APs from the 2008-09 estimates.2 Numbers rounded to the nearest 5. As a result numbers may not appear to sum due to rounding.3 The average value of each risk is calculated using the estimates before the adjustment for risks recorded in future APs.
The adjustments increase the tax under consideration but not the number of risks.
Large and complex businesses
The estimates of the Corporation Tax (CT) gap among Large and Complex (L&C) businesses were £0.5 billion for 2013-14 and £0.7 billion for 2014-15 (see Table 5.3). Tax gap estimates for businesses dealt with by L&C remain illustrative as it is difficult to estimate the tax gap from existing data sources and they are estimated using an experimental methodology. Our operational data on L&C businesses relates to tax risks identified through risk assessment and are not representative of the risks in the wider population. Operational data cannot be used to draw inferences about rates of non-compliance for all L&C businesses. This is unlike the SME CT gap estimates, based on data from the random enquiry programme, and LBS businesses, where close scrutiny of every business means that most risks are identified.
Table 5.3: Estimated Large and Complex Corporation Tax gap (£ billion)1
2007-08 2009-10 2010-11 2011-12 2012-13 2013-14 2014-15
Estimated tax at risk 1.6 1.7 1.4 1.4 1.1 1.1 1.2
Compliance yield 0.6 0.6 0.6 0.7 0.8 0.7 0.6
Non-payment 0.1 0.2 0.2 0.1 0.2 0.1 0.1
Tax gap 1.1 1.3 1.0 0.8 0.5 0.5 0.7
Total theoretical tax liabilities2 8.1 8.2 7.2 7.8 7.1 7.1 7.6
Tax gap as a proportion of theoretical tax liabilities
14% 16% 14% 11% 7% 8% 9%
1 Figures may not appear to sum due to rounding.2 Total theoretical tax liabilities is the estimated Corporation Tax liabilities from L&C businesses plus the estimated tax gap.
A full time series for tables is available on our website www.gov.uk/government/statistics/measuring-tax-gaps-tables
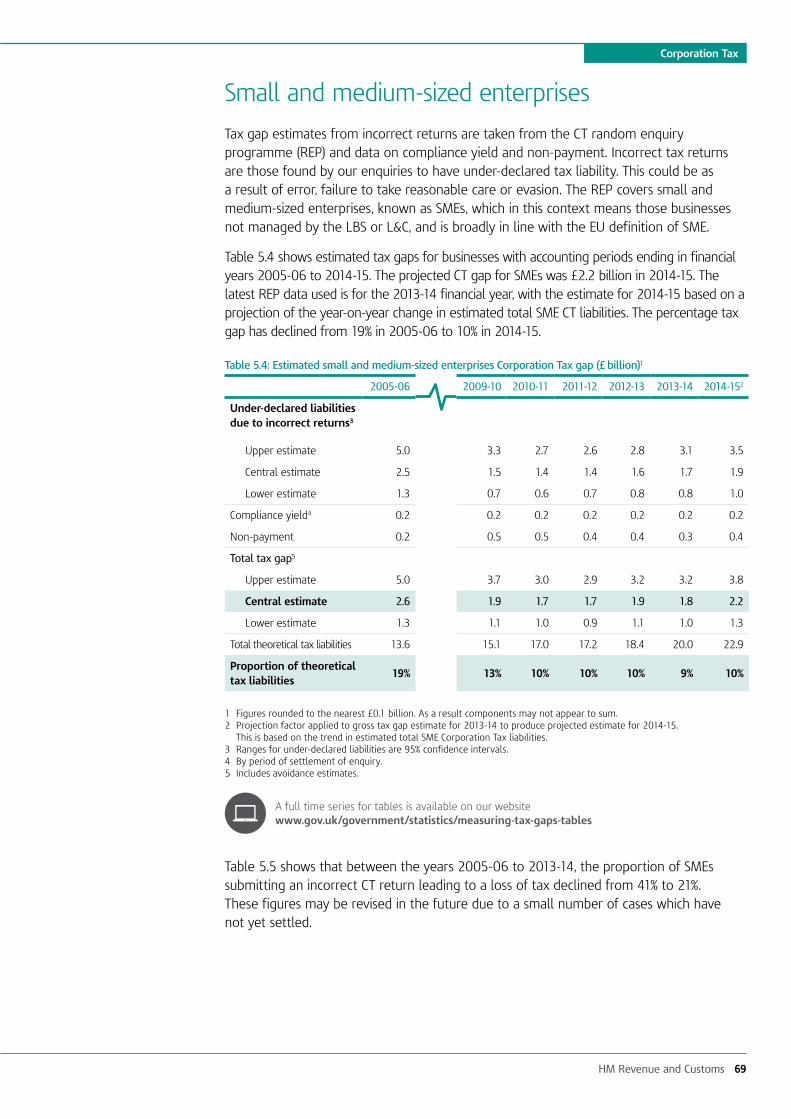
HM Revenue and Customs 69
Corporation Tax
Small and medium-sized enterprises
Tax gap estimates from incorrect returns are taken from the CT random enquiry programme (REP) and data on compliance yield and non-payment. Incorrect tax returns are those found by our enquiries to have under-declared tax liability. This could be as a result of error, failure to take reasonable care or evasion. The REP covers small and medium-sized enterprises, known as SMEs, which in this context means those businesses not managed by the LBS or L&C, and is broadly in line with the EU definition of SME.
Table 5.4 shows estimated tax gaps for businesses with accounting periods ending in financial years 2005-06 to 2014-15. The projected CT gap for SMEs was £2.2 billion in 2014-15. The latest REP data used is for the 2013-14 financial year, with the estimate for 2014-15 based on a projection of the year-on-year change in estimated total SME CT liabilities. The percentage tax gap has declined from 19% in 2005-06 to 10% in 2014-15.
Table 5.4: Estimated small and medium-sized enterprises Corporation Tax gap (£ billion)1
2005-06 2009-10 2010-11 2011-12 2012-13 2013-14 2014-152
Under-declared liabilities due to incorrect returns3
Upper estimate 5.0 3.3 2.7 2.6 2.8 3.1 3.5
Central estimate 2.5 1.5 1.4 1.4 1.6 1.7 1.9
Lower estimate 1.3 0.7 0.6 0.7 0.8 0.8 1.0
Compliance yield4 0.2 0.2 0.2 0.2 0.2 0.2 0.2
Non-payment 0.2 0.5 0.5 0.4 0.4 0.3 0.4
Total tax gap5
Upper estimate 5.0 3.7 3.0 2.9 3.2 3.2 3.8
Central estimate 2.6 1.9 1.7 1.7 1.9 1.8 2.2
Lower estimate 1.3 1.1 1.0 0.9 1.1 1.0 1.3
Total theoretical tax liabilities 13.6 15.1 17.0 17.2 18.4 20.0 22.9
Proportion of theoretical tax liabilities
19% 13% 10% 10% 10% 9% 10%
1 Figures rounded to the nearest £0.1 billion. As a result components may not appear to sum.2 Projection factor applied to gross tax gap estimate for 2013-14 to produce projected estimate for 2014-15. This is based on the trend in estimated total SME Corporation Tax liabilities.3 Ranges for under-declared liabilities are 95% confidence intervals.4 By period of settlement of enquiry.5 Includes avoidance estimates.
A full time series for tables is available on our website www.gov.uk/government/statistics/measuring-tax-gaps-tables
Table 5.5 shows that between the years 2005-06 to 2013-14, the proportion of SMEs submitting an incorrect CT return leading to a loss of tax declined from 41% to 21%. These figures may be revised in the future due to a small number of cases which have not yet settled.
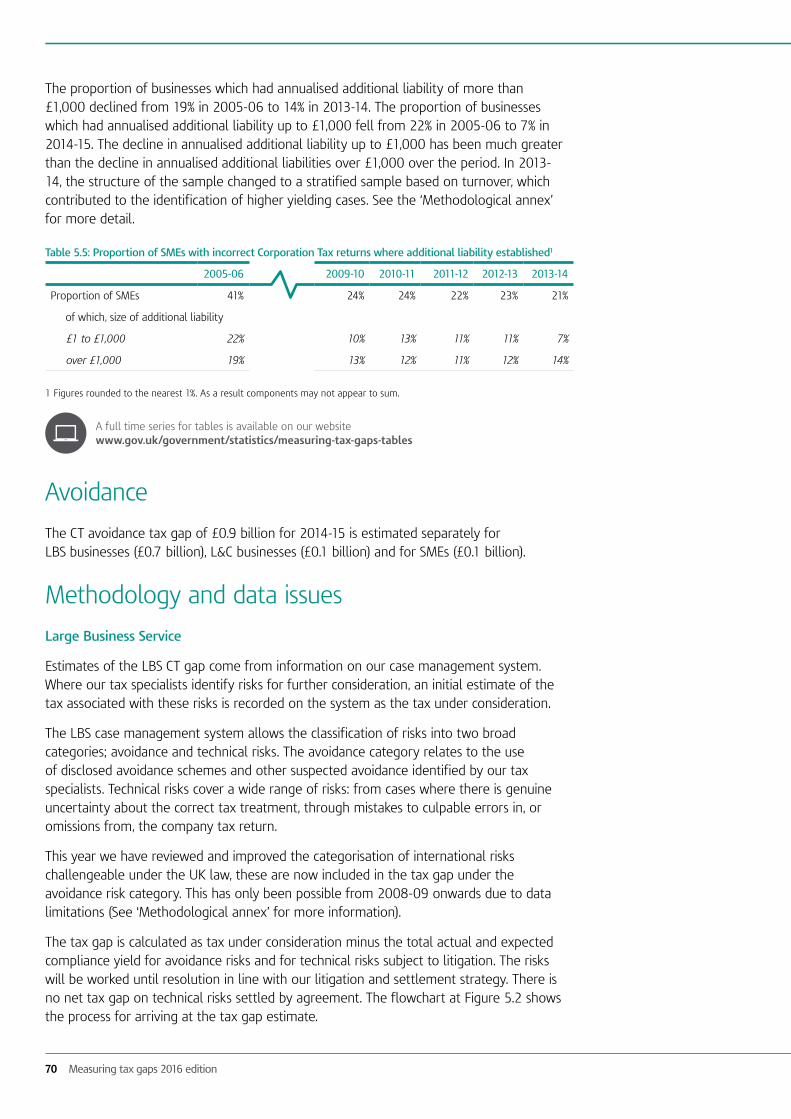
70 Measuring tax gaps 2016 edition
The proportion of businesses which had annualised additional liability of more than £1,000 declined from 19% in 2005-06 to 14% in 2013-14. The proportion of businesses which had annualised additional liability up to £1,000 fell from 22% in 2005-06 to 7% in 2014-15. The decline in annualised additional liability up to £1,000 has been much greater than the decline in annualised additional liabilities over £1,000 over the period. In 2013-14, the structure of the sample changed to a stratified sample based on turnover, which contributed to the identification of higher yielding cases. See the ‘Methodological annex’ for more detail.
Table 5.5: Proportion of SMEs with incorrect Corporation Tax returns where additional liability established1
2005-06 2009-10 2010-11 2011-12 2012-13 2013-14
Proportion of SMEs 41% 24% 24% 22% 23% 21%
of which, size of additional liability
£1 to £1,000 22% 10% 13% 11% 11% 7%
over £1,000 19% 13% 12% 11% 12% 14%
1 Figures rounded to the nearest 1%. As a result components may not appear to sum.
A full time series for tables is available on our website www.gov.uk/government/statistics/measuring-tax-gaps-tables
Avoidance
The CT avoidance tax gap of £0.9 billion for 2014-15 is estimated separately for LBS businesses (£0.7 billion), L&C businesses (£0.1 billion) and for SMEs (£0.1 billion).
Methodology and data issues
Large Business Service
Estimates of the LBS CT gap come from information on our case management system. Where our tax specialists identify risks for further consideration, an initial estimate of the tax associated with these risks is recorded on the system as the tax under consideration.
The LBS case management system allows the classification of risks into two broad categories; avoidance and technical risks. The avoidance category relates to the use of disclosed avoidance schemes and other suspected avoidance identified by our tax specialists. Technical risks cover a wide range of risks: from cases where there is genuine uncertainty about the correct tax treatment, through mistakes to culpable errors in, or omissions from, the company tax return.
This year we have reviewed and improved the categorisation of international risks challengeable under the UK law, these are now included in the tax gap under the avoidance risk category. This has only been possible from 2008-09 onwards due to data limitations (See ‘Methodological annex’ for more information).
The tax gap is calculated as tax under consideration minus the total actual and expected compliance yield for avoidance risks and for technical risks subject to litigation. The risks will be worked until resolution in line with our litigation and settlement strategy. There is no net tax gap on technical risks settled by agreement. The flowchart at Figure 5.2 shows the process for arriving at the tax gap estimate.
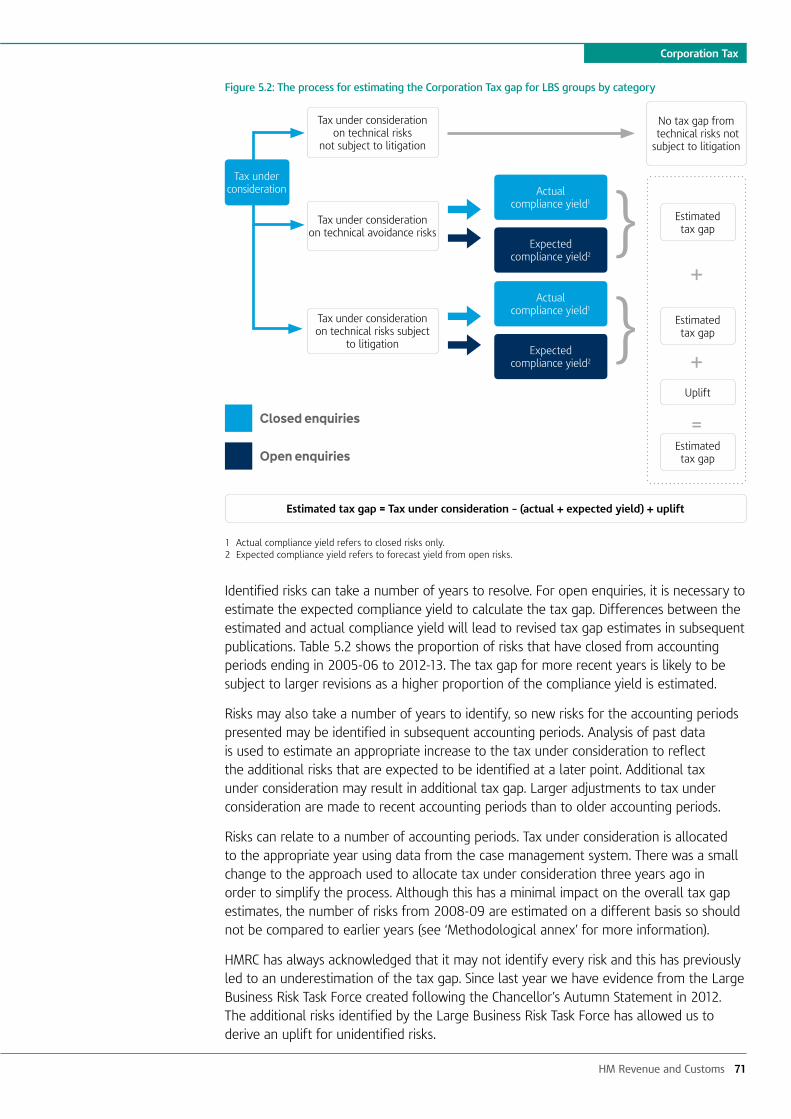
HM Revenue and Customs 71
Corporation Tax
Figure 5.2: The process for estimating the Corporation Tax gap for LBS groups by category
1 Actual compliance yield refers to closed risks only. 2 Expected compliance yield refers to forecast yield from open risks.
Identified risks can take a number of years to resolve. For open enquiries, it is necessary to estimate the expected compliance yield to calculate the tax gap. Differences between the estimated and actual compliance yield will lead to revised tax gap estimates in subsequent publications. Table 5.2 shows the proportion of risks that have closed from accounting periods ending in 2005-06 to 2012-13. The tax gap for more recent years is likely to be subject to larger revisions as a higher proportion of the compliance yield is estimated.
Risks may also take a number of years to identify, so new risks for the accounting periods presented may be identified in subsequent accounting periods. Analysis of past data is used to estimate an appropriate increase to the tax under consideration to reflect the additional risks that are expected to be identified at a later point. Additional tax under consideration may result in additional tax gap. Larger adjustments to tax under consideration are made to recent accounting periods than to older accounting periods.
Risks can relate to a number of accounting periods. Tax under consideration is allocated to the appropriate year using data from the case management system. There was a small change to the approach used to allocate tax under consideration three years ago in order to simplify the process. Although this has a minimal impact on the overall tax gap estimates, the number of risks from 2008-09 are estimated on a different basis so should not be compared to earlier years (see ‘Methodological annex’ for more information).
HMRC has always acknowledged that it may not identify every risk and this has previously led to an underestimation of the tax gap. Since last year we have evidence from the Large Business Risk Task Force created following the Chancellor’s Autumn Statement in 2012. The additional risks identified by the Large Business Risk Task Force has allowed us to derive an uplift for unidentified risks.
Actual compliance yield1
Expected compliance yield2
Actual compliance yield1
Expected compliance yield2
Tax under consideration on technical avoidance risks
Tax under consideration on technical risks subject
to litigation
Tax under consideration on technical risks
not subject to litigation
No tax gap from technical risks not subject to litigation
Estimated tax gap
Estimated tax gap
Estimated tax gap
Tax under consideration
Estimated tax gap = Tax under consideration – (actual + expected yield) + uplift
Uplift
Closed enquiries
Open enquiries
72 Measuring tax gaps 2016 edition
LBS reports compliance yield on a year of settlement basis, whereas the tax gap estimates are based on a financial year accounting period basis. For tax gap purposes only, compliance yield is calculated as the total yield from closed avoidance or litigated technical risks relating to that accounting period plus the estimated compliance yield from open avoidance risks and technical risks in litigation.
As it can take many years to close every risk identified in a particular year, the yield expected from open cases must be forecast to be able to produce estimates of the overall tax gap. Differences between forecast yield and actual yield may lead to some degree of error, and as such, estimates are provisional until every risk is closed.
These estimates will be subject to further revision as more data becomes available and methodological improvements are implemented.
Large and complex businesses
The illustrative estimate of the L&C CT gap is produced by assuming that the tax at risk will represent a similar proportion of liabilities to LBS businesses. Applying this assumption to the L&C CT liabilities data produces an estimate of the tax at risk for L&C businesses for each year. The 2012-13 estimate is projected to 2013-14 and 2014-15 based on the trend in L&C CT liabilities. This produces estimates of tax at risk for 2013-14 and 2014-15, from which compliance yield is subtracted and an estimate of losses from non-payment is added. Compliance yield is a smaller proportion of the tax at risk in L&C businesses, so the percentage tax gap is higher.
Small and medium-sized enterprises
The Corporation Tax random enquiry programme (REP) allows HMRC to estimate the extent of under-declaration of liabilities arising from the submission of incorrect CT returns. The random sample used for the programme is selected from SMEs issued with a notice to file a CT return.
Enquiries are taken up into the sampled returns. The results are then applied to the general population to produce estimates of non-compliance.
As enquiries can take a number of years to settle, it is necessary to make assumptions about any enquiries that are still open at the time of analysis. This means figures are subject to revision until all enquiries are settled. Estimates have been revised since the previous publication to include information on the outcomes of late settling enquiries.
The latest year of REP data used relates to 2013-14, with estimates for 2014-15 projected in line with the trend in estimated total SME CT liabilities.
Due to the small sample sizes and large natural variance in the levels of under-declared tax liabilities due to incorrect returns from year to year, an adjusted method for producing a time series of CT SME net tax gap estimates is used. This method is based on rolling three-year averages of the annualised under-declared tax liabilities for non-compliant cases (cases where additional tax liability has been established) for the previous two years, combined with the overall actual proportion of non-compliance within the random enquiries for the year in question.

HM Revenue and Customs 73
Corporation Tax
Based on US research, a multiplier is applied to account for non-detected non-compliance. Compliance yield is then subtracted, and estimates for losses from non-payment and SME CT avoidance added.
Avoidance
The LBS avoidance estimate is derived from the LBS case management system that includes additional data on tax under consideration split into related tax years. The estimates for L&C and SMEs are produced by applying the methodology used to estimate the IT, NICs and CGT tax gap to HMRC’s risk register data of avoidance schemes relating to CT. A small adjustment is applied to the LBS and L&C estimates to account for risks that are expected to be identified in subsequent years.
Revisions
Large Business Service
Tax gap estimates for accounting periods ending between 2008-09 and 2011-12 have been revised since ‘Measuring tax gaps 2015 edition’ to account for the latest data available (see Table 5.1). Minor changes result because a more recent snapshot of the data is used each year. For example, the 2011-12 estimate of the tax gap was £1.1 billion using the July 2015 snapshot and £0.9 billion using the June 2016 snapshot. Where time has elapsed between data snapshots, differences between the initial and latest tax gap estimates are expected for the following reasons:
• More risks may be found, leading to additional tax under consideration in any category.
• A larger proportion of the tax gap estimate will be based on actual yield numbers, replacing the values previously forecast.
• Our judgment on the tax under consideration of a risk or its classification as avoidance or technical may change where better information has emerged.
• This year we have improved our coverage of avoidance risks after reviewing the categorisation of international risks challengeable under UK law. These are now included in the tax gap under the avoidance risk category.
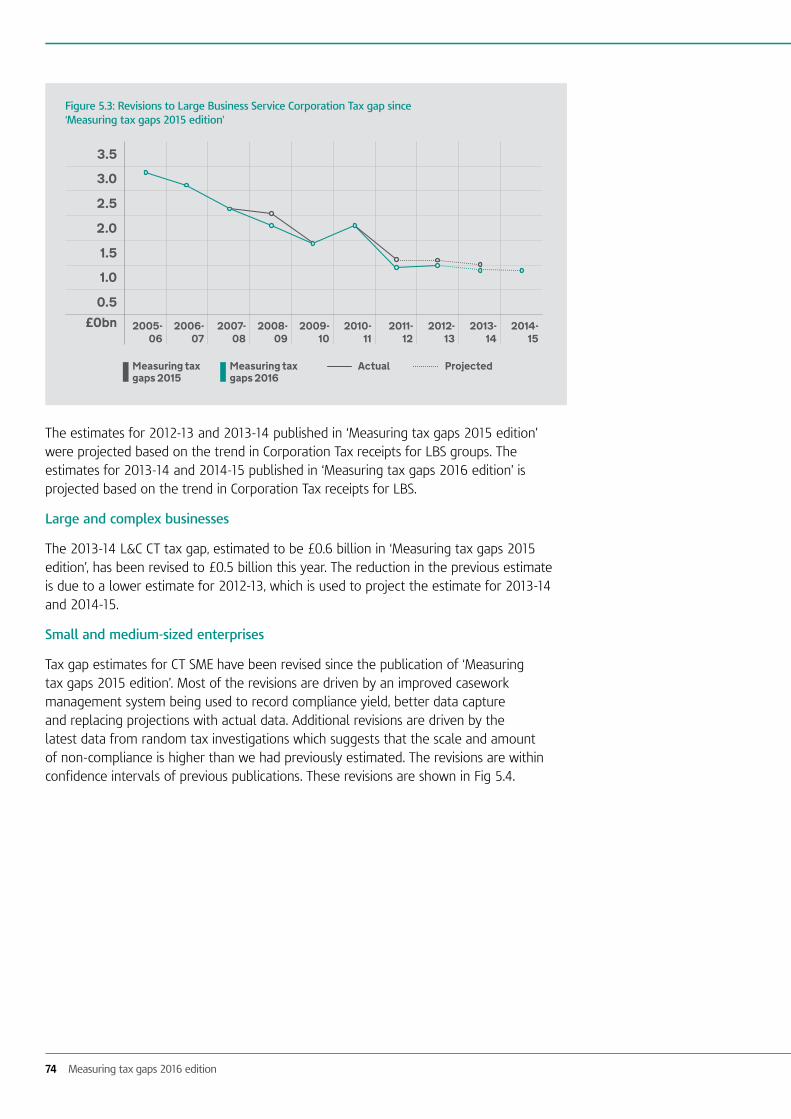
74 Measuring tax gaps 2016 edition
The estimates for 2012-13 and 2013-14 published in ‘Measuring tax gaps 2015 edition’ were projected based on the trend in Corporation Tax receipts for LBS groups. The estimates for 2013-14 and 2014-15 published in ‘Measuring tax gaps 2016 edition’ is projected based on the trend in Corporation Tax receipts for LBS.
Large and complex businesses
The 2013-14 L&C CT tax gap, estimated to be £0.6 billion in ‘Measuring tax gaps 2015 edition’, has been revised to £0.5 billion this year. The reduction in the previous estimate is due to a lower estimate for 2012-13, which is used to project the estimate for 2013-14 and 2014-15.
Small and medium-sized enterprises
Tax gap estimates for CT SME have been revised since the publication of ‘Measuring tax gaps 2015 edition’. Most of the revisions are driven by an improved casework management system being used to record compliance yield, better data capture and replacing projections with actual data. Additional revisions are driven by the latest data from random tax investigations which suggests that the scale and amount of non-compliance is higher than we had previously estimated. The revisions are within confidence intervals of previous publications. These revisions are shown in Fig 5.4.
Figure 5.3: Revisions to Large Business Service Corporation Tax gap since ‘Measuring tax gaps 2015 edition’
0.5£0bn 2005-
062006-
072007-
082008-
092009-
102010-
112011-
122012-
132013-
142014-
15
1.0
1.5
2.0
2.5
3.0
3.5
Actual ProjectedMeasuring tax gaps 2015
Measuring tax gaps 2016

HM Revenue and Customs 75
The estimates for 2011-12 and 2012-13 have both been revised up by £0.4 billion from what was published in ‘Measuring tax gaps 2015 edition’. This was caused by an improved casework management system being used to record compliance yield, better data capture and the settlement of long-running cases, which we previously had to forecast.
The estimate of £1.8 billion for 2013-14 has been revised up by £0.5 billion from what was published in last year’s publication. The latest estimate for this year is based on actual Corporation Tax random enquiry programme data rather than a projection.
Corporation Tax
Figure 5.4: Revisions to small and medium-sized enterprises Corporation Tax gap since ‘Measuring tax gaps 2015 edition’
0.5£0bn 2005-
062006-
072007-
082008-
092009-
102010-
112011-
122012-
132013-
142014-
15
1.0
1.5
2.0
2.5
3.0
3.5
Actual ProjectedMeasuring tax gaps 2015
Measuring tax gaps 2016
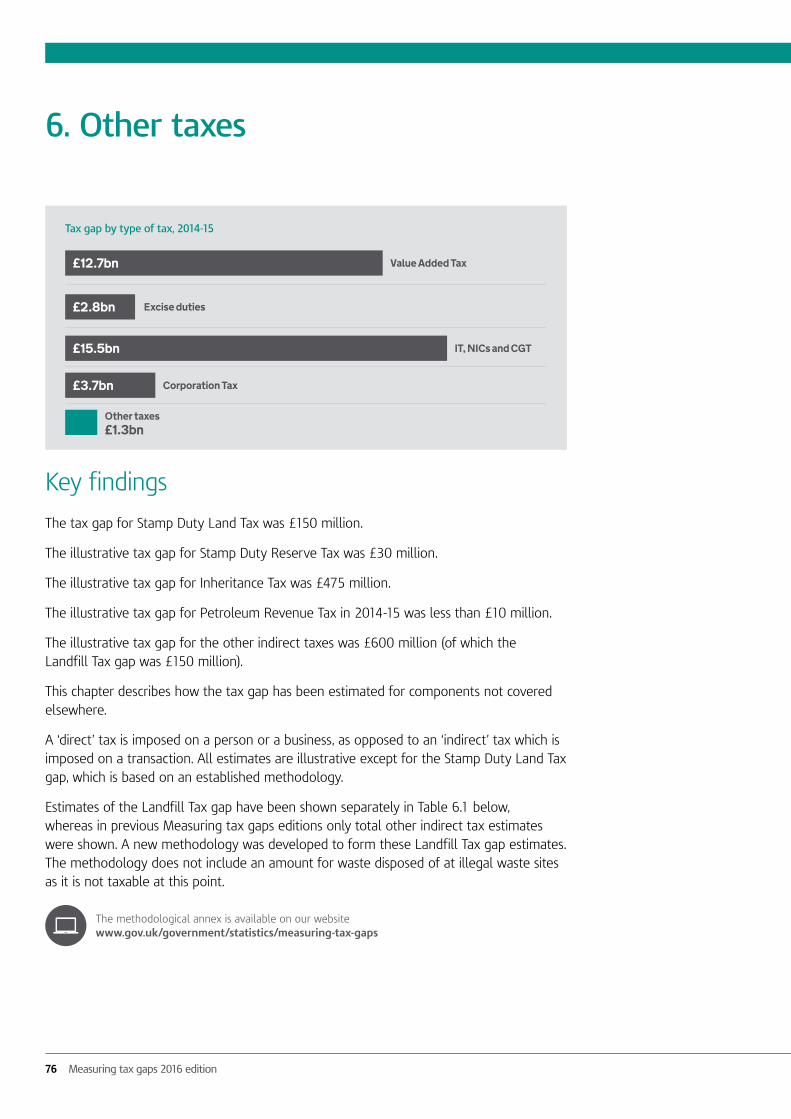
76 Measuring tax gaps 2016 edition
Other taxes
Key findings
The tax gap for Stamp Duty Land Tax was £150 million.
The illustrative tax gap for Stamp Duty Reserve Tax was £30 million.
The illustrative tax gap for Inheritance Tax was £475 million.
The illustrative tax gap for Petroleum Revenue Tax in 2014-15 was less than £10 million.
The illustrative tax gap for the other indirect taxes was £600 million (of which the Landfill Tax gap was £150 million).
This chapter describes how the tax gap has been estimated for components not covered elsewhere.
A ‘direct’ tax is imposed on a person or a business, as opposed to an ‘indirect’ tax which is imposed on a transaction. All estimates are illustrative except for the Stamp Duty Land Tax gap, which is based on an established methodology.
Estimates of the Landfill Tax gap have been shown separately in Table 6.1 below, whereas in previous Measuring tax gaps editions only total other indirect tax estimates were shown. A new methodology was developed to form these Landfill Tax gap estimates. The methodology does not include an amount for waste disposed of at illegal waste sites as it is not taxable at this point.
The methodological annex is available on our website www.gov.uk/government/statistics/measuring-tax-gaps
6. Other taxes
£15.5bn
£12.7bn
£3.7bn
£2.8bn
Tax gap by type of tax, 2014-15
IT, NICs and CGT
Value Added Tax
Corporation Tax
Excise duties
Other taxes£1.3bn

HM Revenue and Customs 77
Other taxes
Table 6.1 Other direct and indirect tax gaps (£ billion)1
2005-06 2009-10 2010-11 2011-12 2012-13 2013-14 2014-15
Direct
Stamp duties
Stamp Duty Land Tax
0.250 0.150 0.200 0.200 0.150 0.125 0.150
Stamp Duty Reserve Tax
0.030 0.030 0.030 0.030 0.020 0.030 0.030
Total 0.300 0.200 0.200 0.200 0.200 0.200 0.200
Other direct taxes
Inheritance Tax
0.150 0.275 0.275 0.350 0.400 0.400 0.475
Petroleum Revenue Tax
0.040 0.020 0.030 0.040 0.040 0.020 <0.010
Total 0.200 0.300 0.300 0.400 0.400 0.400 0.500
Indirect2
Landfill Tax 0.020 0.050 0.040 0.075 0.075 0.100 0.150
Other indirect taxes3 0.500 0.500 0.450 0.400 0.400 0.425 0.450
Total 0.500 0.500 0.500 0.500 0.500 0.500 0.600
Total other direct and indirect
1.000 1.000 1.000 1.100 1.100 1.100 1.300
1 Totals are rounded to the nearest £100 million. Estimates for specific taxes are rounded to the nearest £25 million, or the nearest £10 million if they are below £50 million. As a result components may not appear to sum to totals.
2 In previous editions of Measuring tax gaps, Indirect taxes in the table above included other excise duties (betting and gaming, cider and perry, spirits based ready-to-drinks), which are now included in Chapter 3: Excise.
3 Other indirect taxes are Aggregates Levy, Air Passenger Duty, Climate Change Levy, Custom duties and levies Insurance and Premium Tax.
The methodological annex is available on our website www.gov.uk/government/collections/measuring-tax-gaps

78 Measuring tax gaps 2016 edition
Methodology and data issues
Stamp taxes
The Stamp Duty Land Tax gap is estimated using a combination of management information and management assumptions. The estimate includes both commercial and residential property and land transactions.
The methodological annex is available on our website www.gov.uk/government/statistics/measuring-tax-gaps
The Stamp Duty Land tax gap estimate for 2013-14 reported in ‘Measuring tax gaps 2015 edition’ was based solely on assumptions. A review of these assumptions and using updated management information, has led to a revision to the 2013-14 estimate. 2014-15 estimates are formed on the same basis as 2013-14.
Stamp Duty Reserve Tax is a tax largely collected at source through the CREST computer system (the London Stock Exchange’s electronic share settlement system) making the risk of non-compliance very low.
An illustrative estimate of the tax gap for Stamp Duty Reserve Tax has been produced using the assumption that the tax under consideration is approximately 1% of receipts. This results in an estimate of the tax gap for Stamp Duty Reserve Tax of £30 million for 2014-15.
Inheritance Tax
This is an illustrative estimate based on assumptions. The gross tax gap is estimated by risk categories including omitted assets and agricultural and business reliefs. Compliance yield figures are subtracted from the gross tax gap to estimate the net tax gap.
Petroleum Revenue Tax
An illustrative indicator of the tax gap from Petroleum Revenue Tax has been produced using the expert opinion of Petroleum Revenue Tax specialists. Given the narrowly-defined base of the tax (limited to oil-producing fields developed before April 1993) and the small number of businesses involved, a range of between 1% and 3% of theoretical tax liabilities has been used to calculate an illustrative tax gap. This produces an estimate of less than £10 million in 2014-15.
Other indirect taxes
Estimates of the Landfill Tax gap have been shown separately for the first time in ‘Measuring tax gaps 2016 edition’, whereas in previous Measuring tax gaps editions only total other indirect tax estimates were shown.
Tax gaps for other indirect taxes are formed by estimating the average percentage of tax gaps for similar taxes each year and multiplying this by total theoretical tax liabilities for the relevant taxes.
The average percentage revenue losses should not be considered estimates of the true percentage loss for each of the taxes listed in Table 6.1. Many of the indirect taxes listed are very different from one another in their nature, each being subject to different rules. The true percentage tax gaps are therefore likely to vary widely across the various taxes listed.

HM Revenue and Customs 79
Other taxes
Landfill Tax
For the first time a separate Landfill Tax gap estimate has been produced. Previously Landfill Tax gap was included in other indirect tax gap estimates.
The level of Landfill Tax losses is measured by comparing the net Landfill Tax theoretical liability with actual Landfill Tax receipts. The difference between these amounts is the Landfill Tax gap.
The net theoretical Landfill Tax liability has been produced using a combination of modelling, proxy indicators and tax professional expertise. It takes account of estimates for waste legitimately diverted away from landfill, versus unexpected shortfalls in revenue. The methodology does not include an amount for waste disposed of at illegal waste sites as it is not taxable at this point.
The methodological annex is available on our website www.gov.uk/government/statistics/measuring-tax-gaps
Other taxes
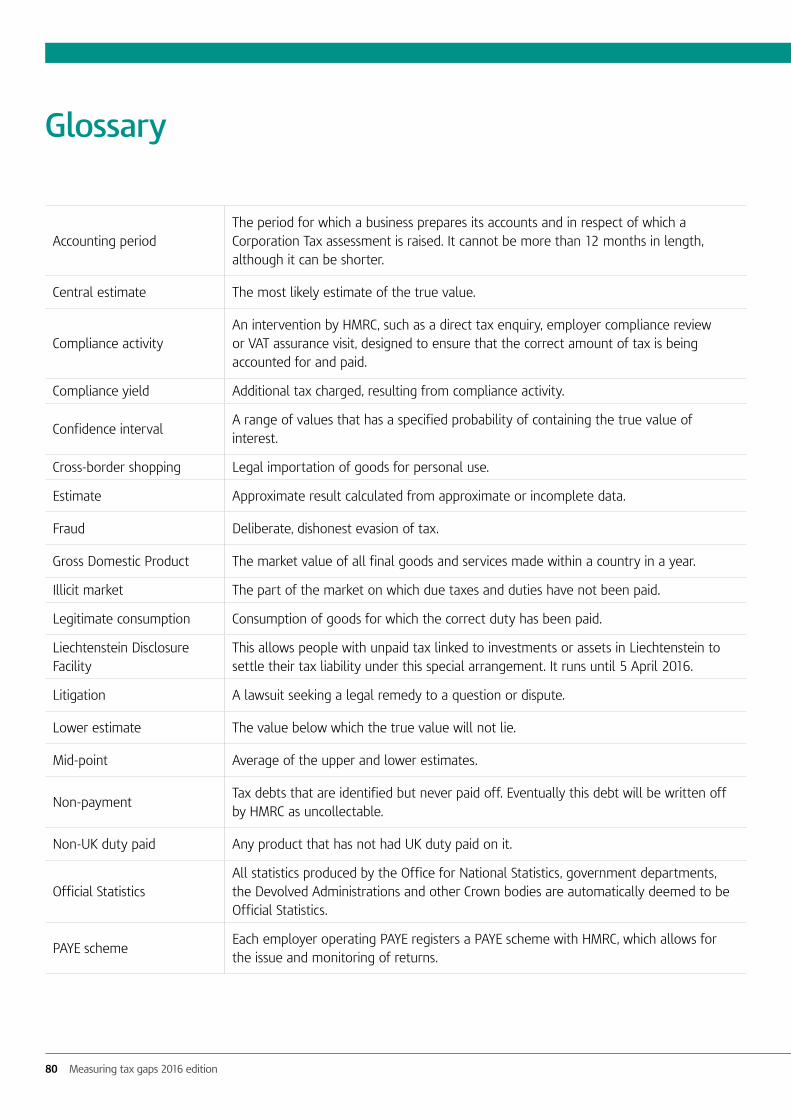
80 Measuring tax gaps 2016 edition
Glossary
Accounting periodThe period for which a business prepares its accounts and in respect of which a Corporation Tax assessment is raised. It cannot be more than 12 months in length, although it can be shorter.
Central estimate The most likely estimate of the true value.
Compliance activityAn intervention by HMRC, such as a direct tax enquiry, employer compliance review or VAT assurance visit, designed to ensure that the correct amount of tax is being accounted for and paid.
Compliance yield Additional tax charged, resulting from compliance activity.
Confidence intervalA range of values that has a specified probability of containing the true value of interest.
Cross-border shopping Legal importation of goods for personal use.
Estimate Approximate result calculated from approximate or incomplete data.
Fraud Deliberate, dishonest evasion of tax.
Gross Domestic Product The market value of all final goods and services made within a country in a year.
Illicit market The part of the market on which due taxes and duties have not been paid.
Legitimate consumption Consumption of goods for which the correct duty has been paid.
Liechtenstein Disclosure Facility
This allows people with unpaid tax linked to investments or assets in Liechtenstein to settle their tax liability under this special arrangement. It runs until 5 April 2016.
Litigation A lawsuit seeking a legal remedy to a question or dispute.
Lower estimate The value below which the true value will not lie.
Mid-point Average of the upper and lower estimates.
Non-paymentTax debts that are identified but never paid off. Eventually this debt will be written off by HMRC as uncollectable.
Non-UK duty paid Any product that has not had UK duty paid on it.
Official StatisticsAll statistics produced by the Office for National Statistics, government departments, the Devolved Administrations and other Crown bodies are automatically deemed to be Official Statistics.
PAYE schemeEach employer operating PAYE registers a PAYE scheme with HMRC, which allows for the issue and monitoring of returns.
Glossary
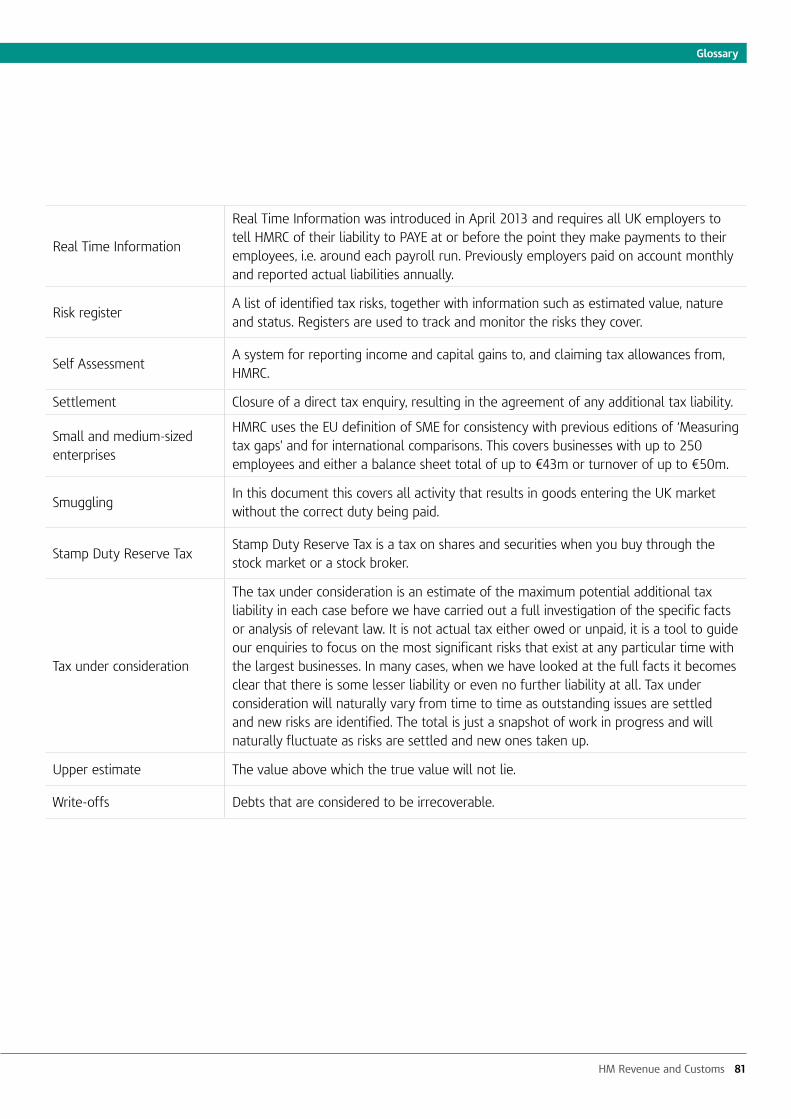
HM Revenue and Customs 81
Glossary
Real Time Information
Real Time Information was introduced in April 2013 and requires all UK employers to tell HMRC of their liability to PAYE at or before the point they make payments to their employees, i.e. around each payroll run. Previously employers paid on account monthly and reported actual liabilities annually.
Risk registerA list of identified tax risks, together with information such as estimated value, nature and status. Registers are used to track and monitor the risks they cover.
Self AssessmentA system for reporting income and capital gains to, and claiming tax allowances from, HMRC.
Settlement Closure of a direct tax enquiry, resulting in the agreement of any additional tax liability.
Small and medium-sized enterprises
HMRC uses the EU definition of SME for consistency with previous editions of ‘Measuring tax gaps’ and for international comparisons. This covers businesses with up to 250 employees and either a balance sheet total of up to €43m or turnover of up to €50m.
SmugglingIn this document this covers all activity that results in goods entering the UK market without the correct duty being paid.
Stamp Duty Reserve TaxStamp Duty Reserve Tax is a tax on shares and securities when you buy through the stock market or a stock broker.
Tax under consideration
The tax under consideration is an estimate of the maximum potential additional tax liability in each case before we have carried out a full investigation of the specific facts or analysis of relevant law. It is not actual tax either owed or unpaid, it is a tool to guide our enquiries to focus on the most significant risks that exist at any particular time with the largest businesses. In many cases, when we have looked at the full facts it becomes clear that there is some lesser liability or even no further liability at all. Tax under consideration will naturally vary from time to time as outstanding issues are settled and new risks are identified. The total is just a snapshot of work in progress and will naturally fluctuate as risks are settled and new ones taken up.
Upper estimate The value above which the true value will not lie.
Write-offs Debts that are considered to be irrecoverable.

82 Measuring tax gaps 2016 edition
Abbreviations
AP Accounting period
BEPS Base erosion and profit shifting
CGT Capital Gains Tax
CT Corporation Tax
EC Employer compliance
ESA10 European System of Accounts
EU European Union
GB Great Britain
GDP Gross Domestic Product
HMRC Her Majesty’s Revenue & Customs
ISA Individual Savings Account
IRSInternal Revenue Service (United States)
IT Income Tax
L&C Large and Complex
LBRT Large Business Risk Task Force
LBS Large Business Service
LCF Living Costs and Food Survey
MTIC Missing trader intra-community fraud
NI Northern Ireland
NICs National Insurance Contributions
OECDOrganisation for Economic Cooperation and Development
ONS Office for National Statistics
PAYE Pay As You Earn
PRT Petroleum Revenue Tax
REP Random enquiry programme
RoI Republic of Ireland
RTI Real Time Information
SA Self Assessment
SDLT Stamp Duty Land Tax
SDRT Stamp Duty Reserve Tax
SME Small and medium-sized enterprise
UK United Kingdom
VAT Value Added Tax
VTTL VAT total theoretical liability
HM Revenue and Customs 83
Index of tables and figures
Index of tables and figures
7 Figure 1.1: Tax gap as a percentage of theoretical tax liabilities
8 Figure 1.2: Tax gap by type of tax – value and share of tax gap, 2014-15
8 Figure 1.3 Tax gaps relative to tax due, 2014-15
9 Figure 1.4: Tax gap as a percentage of theoretical tax liabilities, 2005-06 to 2014-15
10 Figure 1.5: Tax gap by customer group — value and share of tax gap, 2013-14 and 2014-15
11 Figure 1.6: Tax gap by behaviour — value and share of tax gap, 2014-15
12 Figure 1.7: Avoidance tax gap by type of tax, 2014-15 (£ billion)
14 Figure 1.8: Tax gap by type of methodology, 2014-15 (£ billion)
15 Figure 1.9: Revisions to the tax gap as a percentage of theoretical liabilities compared to previous editions
16 Table 1.1: Tax gap components
17 Table 1.2: Percentage tax gap by type of tax
18 Table 1.3: Tax gap (cash figure) by type of tax
19 Table 1.4: Tax gap time series by customer group, percentage of total theoretical tax liabilities
19 Table 1.5: Tax gap time series by behaviour, percentage of total theoretical liabilities and £ billion
19 Table 1.6: Avoidance tax gap by type of tax (£ billion)
20 Table 1.7: Description of behaviours
21 Table 1.8: Revisions to estimates since 2015 edition of ‘Measuring tax gaps’
22 Table 1.9: Description of revisions since last edition
25 Table 2.1: Estimated VAT gap (£ billion)
26 Figure 2.1: Time series of the VAT gap, including and excluding debt
26 Figure 2.2: Time series of VAT debt
27 Figure 2.3: Components of the VTTL in 2014-15
28 Figure 2.4: Composition of VAT-able expenditure for the household sector in 2014-15
31 Figure 2.5: Revisions to the VAT gap estimates compared to the previous edition
32 Figure 2.6: Revisions to the VAT gap as a percentage of theoretical tax liabilities compared to previous editions
34 Figure 3.0.1 Excise duty tax gaps as a percentage of theoretical tax liabilities by sector 2007-08 to 2014-15
34 Figure 3.0.2 Excise tax gap (Duty and VAT combined) by sector (£ million) 2007-08 to 2014-15
35 Figure 3.1.1 Alcohol tax gap (duty and VAT combined) (£ million) 2007-08 to 2014-15
84 Measuring tax gaps 2016 edition
36 Table 3.1.1 Beer: Illicit market share and tax gap
37 Table 3.1.2 Spirits: Illicit market share and tax gap
38 Table 3.1.3: Wine: Illicit market share and tax gap
39 Table 3.2: Tobacco Tax Gap (£ million)
40 Figure 3.2.1: Cigarette central estimate for illicit market and UK tax paid consumption (billion cigarettes)
41 Table 3.2.1: Cigarettes: Illicit market share and breakdown of volumes (billion cigarettes)
42 Figure 3.2.2: Hand-rolling tobacco central estimate for illicit market and UK tax paid consumption (thousand kg)
42 Table 3.2.2: Hand-rolling tobacco: Illicit market share and breakdown of volumes (thousand kg)
43 Table 3.3.1: GB diesel: Illicit market share and tax gap
44 Table 3.3.2: NI diesel: Illicit market share and tax gap
45 Table 3.4: Other Excise Tax Gap (£ million)
52 Figure 4.1: SA individuals and small partnerships, SA large partnerships, SME employers and large employers tax gaps as a proportion of theoretical tax liabilities
53 Table 4.1: SA tax gap (excluding large partnerships) (£ billion)
53 Table 4.2: SA tax gap by type of taxpayer (£ billion)
54 Table 4.3: Proportion of SA returns with under-declared tax liability
54 Table 4.4: Business taxpayers: Proportion of SA returns with under-declared tax liability
54 Table 4.5: Non-business taxpayers: Proportion of SA returns with under-declared tax liability
55 Table 4.6: Tax gap for large partnerships in SA (£ billion)
56 Table 4.7: Tax gap for SME employers (£ billion)
56 Table 4.8: Proportion of SME employers not meeting their PAYE scheme obligations
57 Table 4.9: Estimated tax gap for large employers (£ billion)
59 Table 4.10: Summary of methods by tax gap estimates
62 Figure 4.2: Revisions to SA individuals and small partnerships and SA large partnerships tax gap since ‘Measuring tax gaps 2015 edition’
66 Figure 5.1: Corporation Tax gap
67 Table 5.1: Estimated Large Business Service Corporation Tax gap (£ billion)
68 Table 5.2: Corporation Tax risks for Large Business Service groups
68 Table 5.3: Estimated Large and Complex Corporation Tax gap (£ billion)
69 Table 5.4: Estimated small and medium-sized enterprises Corporation Tax gap (£ billion)
70 Table 5.5: Proportion of SMEs with incorrect Corporation Tax returns where additional liability established
71 Figure 5.2: The process for estimating the Corporation Tax gap for LBS groups by category
74 Figure 5.3: Revisions to Large Business Service Corporation Tax gap since ‘Measuring tax gaps 2015 edition’
HM Revenue and Customs 85
Index of tables and figures
75 Figure 5.4: Revisions to small and medium-sized enterprises Corporation Tax gap since ‘Measuring tax gaps 2015 edition’
77 Table 6.1 Other direct and indirect tax gaps (£ billion)

Issued byHM Revenue & CustomsCorporate CommunicationsOctober 2016 © Crown Copyright 2016