measuring the health of open source software ecosystems: beyond the scope of project health
TRANSCRIPT

Information and Software Technology xxx (2014) xxx–xxx
Contents lists available at ScienceDirect
Information and Software Technology
journal homepage: www.elsevier .com/locate / infsof
Measuring the health of open source software ecosystems: Beyondthe scope of project health
http://dx.doi.org/10.1016/j.infsof.2014.04.0060950-5849/� 2014 Elsevier B.V. All rights reserved.
⇑ Tel.: +31 619884880.E-mail address: [email protected] 1 http://flossmole.org/.
Please cite this article in press as: S. Jansen, Measuring the health of open source software ecosystems: Beyond the scope of project health, InformTechnol. (2014), http://dx.doi.org/10.1016/j.infsof.2014.04.006
Slinger Jansen ⇑Department of Information and Computing Sciences, Utrecht University, The Netherlands
a r t i c l e i n f o a b s t r a c t
Article history:Received 8 July 2013Received in revised form 28 March 2014Accepted 3 April 2014Available online xxxx
Keywords:Software ecosystem healthOpen source ecosystemsSoftware repository mining
Background: The livelihood of an open source ecosystem is important to different ecosystem participants:software developers, end-users, investors, and participants want to know whether their ecosystem ishealthy and performing well. Currently, there exists no working operationalization available that canbe used to determine the health of open source ecosystems. Health is typically looked at from a projectscope, not from an ecosystem scope.Objectives: With such an operationalization, stakeholders can make better decisions on whether to investin an ecosystem: developers can select the healthiest ecosystem to join, keystone organizers can establishwhich governance techniques are effective, and end-users can select ecosystems that are robust, will livelong, and prosper.Method: Design research is used to create the health operationalization. The evaluation step is done usingfour ecosystem health projects from literature.Results: The Open Source Ecosystem Health Operationalization is provided, which establishes the healthof a complete software ecosystem, using the data from collections of open source projects that belong tothe ecosystem.Conclusion: The groundwork is done, by providing a summary of research challenges, for more researchin ecosystem health. With the operationalization in hand, researchers no longer need to start fromscratch when researching open source ecosystems’ health.
� 2014 Elsevier B.V. All rights reserved.
1. Introduction
‘‘Ruby or Python?’’ ‘‘SugarCRM or a closed-source competitor?’’‘‘Drupal or Joomla?’’ ‘‘RedHat or Ubuntu?’’ These are questionsoften asked by developers, professionals, entrepreneurs, architects,and stakeholders related to software producing organizations.Choosing between different ecosystems is a complex task and sucha decision will be determining many of the future developmentswithin an organization. At present the only way to answer such aquestion is by doing sufficient reading, asking around, and findingout what the risks are of choosing to enter an ecosystem. One indi-cator of whether an ecosystem is alive or not can be determined bylooking at the health of the keystone project, for instance bylooking at the activity surrounding the Ubuntu project. Such activ-ity consists of commits, recent releases, fixes, number ofdownloads, response times in forums and bug trackers, activity
on e-mail lists, and contributions from non-developers. However,project health – ecosystem health.
Ecosystem health is operationalized in this work by taking acombined view at a keystone project and its surrounding projects.This work stands on the shoulders of two relevant contributions inthe field of ecosystem health measurement. First, the work byCrowston et al. [3], who have provided a first operationalizationof open source software project health, is used to establish healthfactors on the project level. Their work is also fundamental to OSS-Mole,1 a collection of meta-data about projects in some of the mainrepositories, like Github and SourceForge. Secondly, the work of denHartigh et al. [6], where an operationalization of health measure-ment of a commercial ecosystem is provided, is followed as closelyas possible.
Software ecosystems are sets of actors functioning as a unit andinteracting with a shared market for software and services,together with the relationships among them [15]. A healthy unitshould thus express qualities typically associated with health:
. Softw.

2 S. Jansen / Information and Software Technology xxx (2014) xxx–xxx
liveliness, activity, longevity, etc. For this work, we take a simpledefinition for software ecosystem health: longevity and a propensityfor growth [19]. The definition is only the first step, as both longev-ity and propensity for growth can be operationalized in differentways with a plethora of different metrics.
There is a distinct need for an Open Source Ecosystem HealthOperationalization (OSEHO). Manikas and Hansen [23] recentlypublished a call to action for the creation of such an operationaliza-tion, and laid the groundwork for it. Also, in our research agendafor software ecosystems [17], we call for more research into eco-system health. Others have attempted to create their own opera-tionalization, but these typically get stuck in the concept phase[31,3,30]. In this article, an OSEHO is provided and evaluated usingfour research projects into open source ecosystem health.
We continue this work with a description of the literature onhealth measurement in ecosystems and open source projects. Sec-tion 3 discusses the creation of the OSEHO and its evaluation chal-lenges. In Section 4, the OSEHO that provides methods formeasuring health of open source software ecosystems is presented,consisting of a generic ecosystem health model and a set of meth-ods for analyzing open source ecosystem health. In Section 5 fourresearch projects are presented that apply parts of the model inpractice. Furthermore, an analysis of the research projects andtheir aims (provide insight mostly), the indicators most frequentlyused (active developers, projects), and the research methodsapplied (mining repositories, web scraping) are presented. Sec-tion 6 presents a set of challenges that are met when applyingthe model and that were found in the four research projects,mostly having to do with data selection, preparation, and analysis.The article ends with a discussion on the applicability of an OSEHOand a summary of the conclusions and future research challenges.
2. Literature about ecosystem health
There is surprisingly little literature available about open sourceecosystem health. Different perceptions exist and frequently eco-system and project health are used interchangeably, such as inthe work of Lundell et al. [20], who discuss open source ecosystemsas being equal to one project. In the continued work of Gamaliels-son et al. [9,8], the responsiveness of developers on the mailing listof the Nagios community is measured as an indicator for opensource community health, but does not take an extended view ofmultiple projects within that community. The correct use of theterm ecosystem in the open source domain is illustrated by Lunguet al. [21], who look at ecosystem as federations of systems. Forthis work the aggregated view is seen as the only way to look atecosystem health, as the project level has already been studiedextensively.
The research in this project is largely dependent on the proposalof Manikas and Hansen [23], who wish to operationalize the eco-system health concept. Manikas and Hansen split their work alongthe categories of software ecosystems, business ecosystems, opensource ecosystems, and natural ecosystems. In our literature sur-vey the category of natural ecosystems is excluded, as this isalready sufficiently discussed by Manikas and Hansen and alsoby Dhungana et al. [7], and a distinction is made between opensource project health and open source ecosystem health. Relatedwork is thus roughly divided into the categories: project health,commercial ecosystem health, and open source ecosystem health.The sources of literature are two literature surveys in the domainof software ecosystems [22,2] and in the domain of open sourceecosystem health [23].
In regards to open source ecosystem health, the work of Wynn[31] first takes the three factors into account of vigor, resilience,and organization, analogous to natural ecosystems. The terms are
Please cite this article in press as: S. Jansen, Measuring the health of open sourcTechnol. (2014), http://dx.doi.org/10.1016/j.infsof.2014.04.006
later adopted and changed by Iansiti and Levien [14], to productiv-ity, robustness, and niche creation. The framework presented byWynn has been inspirational, and many of the factors in Wynn’sframework have made it into the OSEHO presented in Section 4.Unfortunately, Wynn’s framework does not present an evaluationor validation of the framework or its measures. The work of Man-ikas and Hansen [23] has also been fundamental, as it establishesan ecosystem as a collection of projects, and is taking differentviewpoints into ecosystem health, thereby functioning as an eval-uation checklist for the OSEHO. Finally, the work of Mens and Goe-minne [25] (a detailed description of this work is given inSection 5), even though the word health is never mentioned intheir chapter, is inspirational when looking at the collected metricsof developer roles and activity.
The work on project health has been used extensively: metricsabout project health in most cases can be aggregated to the ecosys-tem level and thus most (if not all) project health metrics are rel-evant for the OSEHO. The works of Crowston et al. [3] andWiggins et al. [30], operationalizing project health by looking atfactors such as developer activity, have provided around a thirdof the metrics that can be found in the project level metrics ofthe OSEHO. A survey by Haenni et al. [11], in which developersare asked what they want to know about the software ecosystemin which they are active, concluded that developers have down-stream needs: ‘‘what is the available public support? What licensesare used? What is the quality of other projects? What documenta-tion is available?’’ and upstream needs: ‘‘What other projects usemy project? How do these projects develop? How is my API used?Are code conventions followed?’’ These questions have been takeninto account in creating the OSEHO framework as well.
Finally, commercial ecosystem health is a highly relevant topic.It is discussed extensively by Iansiti and Levien [14], who first pro-vide guidelines on how ecosystem health may be operationalized.The work has been fundamental to the work of den Hartigh et al.[6], who first try to operationalize the health of a business ecosys-tem, based on the categories of health metrics presented by Iansitiand Levien. The challenges that Den Hartigh and his team face inthe commercial domain (missing data, impossible to create onesingle health measure, etc.), have been essential to the design ofthe OSEHO.
3. Research approach
The goal of this research is to provide a comprehensive over-view of the health metrics that can be used to determine the healthof an open source ecosystem. It does so by creating an inventory ofall metrics mentioned in literature that could potentially indicateecosystem health and then placing these metrics in a framework.The framework can be applied by researchers who aim to reach agoal associated with ecosystem health, such as improve activityin an ecosystem, evaluate the health of one ecosystem overanother, or identifying weaknesses in an ecosystem with the aimof making it healthier. The research answers the research question‘‘What are the health indicators for open source ecosystems and howcan, if at all, the indicators be classified and operationalized?’’ Pleasenote the wider scope of the open source ecosystem: the researchdoes not aim to evaluate the health of a single project, as thathas extensively been done (see Section 2).
The evaluation of the framework is done by examining fourresearch projects into ecosystem health, that have recently beendone in the domain of software ecosystems. The four research pro-jects have been selected from two literature surveys [2,22] andthrough searching for ecosystem health keywords. The selectioncriteria for inclusion are based on the fact that they take an ecosys-tem wide view, instead of just a project view, on open source
e software ecosystems: Beyond the scope of project health, Inform. Softw.

S. Jansen / Information and Software Technology xxx (2014) xxx–xxx 3
ecosystem health. The four projects have been described in fourpapers, and published in software ecosystem forums. No other fit-ting projects were found, and we consider it future work to pro-gressively add new studies on software ecosystem health as theyare published. The works that were selected were analyzed as fol-lows: first, the aim of the research was extracted. Secondly, thesources that were used for data gathering were extracted anddescribed, to present an overarching view of typical sources forecosystem health studies, as described in Section 5.2. Thirdly, themethods for gathering data are inventoried, also as illustration tofuture researchers. Fourthly, and perhaps most importantly, themetrics that were collected are listed to establish their role andfunction in the OSEHO. No new metrics were added based on thepapers, which furthers our belief that the previous works describ-ing ecosystem health (without operationalizing) and worksdescribing project health covered all the metrics already. Finally,the contribution, challenges, and discussions in the papers are ana-lyzed to further illustrate the use of the metrics.
4. Open Source Ecosystem Health Operationalization (OSEHO)
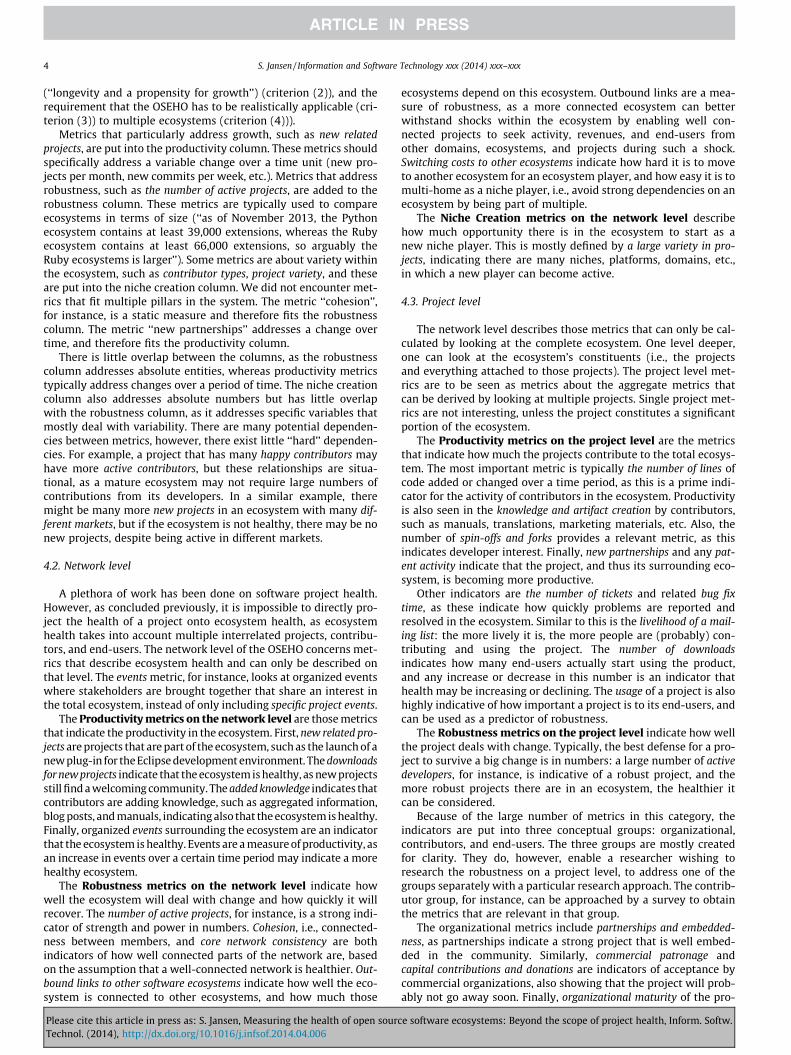
Fig. 1 represents the OSEHO. The framework is built up out ofthree pillars, being the productivity, robustness, and niche creationpillars, which are addressed in the discussion of the literature inSection 2. The pillars are separated into three layers, being the the-ory level, the network level, and the project level. At the top level isdisplayed what the theoretical model of Den Hartigh prescribes touse as guidelines for operationalizing the health concept, which inturn is inspired by Iansiti and Levien [13], which in turn is inspiredby the concepts from natural ecosystems: vigor, resilience, andorganization. The translation into the open source domain is done
Fig. 1. Open Source Ecosystem Health Operationalization – the shapes in
Please cite this article in press as: S. Jansen, Measuring the health of open sourcTechnol. (2014), http://dx.doi.org/10.1016/j.infsof.2014.04.006
on the second level, where the health operationalization at the net-work level is presented. At the third level a comprehensive over-view is created of project health metrics, which, if collected formultiple projects in an ecosystem, can be used as an aggregatemetric to describe overall ecosystem health.
4.1. Creating the OSEHO
The framework was created by first establishing that the splitinto the network level and project level is necessary to distinguishbetween ecosystem level metrics and (aggregated) project levelmetrics. Secondly, two lists of papers were created, one with pro-ject level health operationalizations and one with ecosystemhealth operationalizations. The metrics from each of the levelswere collected. Then, to add more structure and make sure theessential elements of ecosystem health were covered, the three pil-lars of productivity, robustness, and niche creation were added, fol-lowing the work of den Hartigh et al. [6].
Metrics were included when they fit the following criteria: (1)the metric had to stem from literature about project health or eco-system health, (2) contribute positively to ecosystem health, (3)the metric was operationalized or at least operationalizable intoa measurable entity, and (4) the metric was generalizable to multi-ple projects to get to the ecosystem scope. As the metrics camefrom literature, the second, third, and fourth criteria were addedto filter out metrics that were not relevant, not contributive, ornot operationalizable for the OSEHO. Please note that when a met-ric was reversible, only the positive variant of the metric wasadded, as for example ‘‘installs over a month’’ versus ‘‘de-installsover a month’’. The metric selection criteria are based on thesource of metrics (criterion (1)), the definition of ecosystem health
dicate the occurrence of the metric in one of the research projects.
e software ecosystems: Beyond the scope of project health, Inform. Softw.
4 S. Jansen / Information and Software Technology xxx (2014) xxx–xxx
(‘‘longevity and a propensity for growth’’) (criterion (2)), and therequirement that the OSEHO has to be realistically applicable (cri-terion (3)) to multiple ecosystems (criterion (4))).
Metrics that particularly address growth, such as new relatedprojects, are put into the productivity column. These metrics shouldspecifically address a variable change over a time unit (new pro-jects per month, new commits per week, etc.). Metrics that addressrobustness, such as the number of active projects, are added to therobustness column. These metrics are typically used to compareecosystems in terms of size (‘‘as of November 2013, the Pythonecosystem contains at least 39,000 extensions, whereas the Rubyecosystem contains at least 66,000 extensions, so arguably theRuby ecosystems is larger’’). Some metrics are about variety withinthe ecosystem, such as contributor types, project variety, and theseare put into the niche creation column. We did not encounter met-rics that fit multiple pillars in the system. The metric ‘‘cohesion’’,for instance, is a static measure and therefore fits the robustnesscolumn. The metric ‘‘new partnerships’’ addresses a change overtime, and therefore fits the productivity column.
There is little overlap between the columns, as the robustnesscolumn addresses absolute entities, whereas productivity metricstypically address changes over a period of time. The niche creationcolumn also addresses absolute numbers but has little overlapwith the robustness column, as it addresses specific variables thatmostly deal with variability. There are many potential dependen-cies between metrics, however, there exist little ‘‘hard’’ dependen-cies. For example, a project that has many happy contributors mayhave more active contributors, but these relationships are situa-tional, as a mature ecosystem may not require large numbers ofcontributions from its developers. In a similar example, theremight be many more new projects in an ecosystem with many dif-ferent markets, but if the ecosystem is not healthy, there may be nonew projects, despite being active in different markets.
4.2. Network level
A plethora of work has been done on software project health.However, as concluded previously, it is impossible to directly pro-ject the health of a project onto ecosystem health, as ecosystemhealth takes into account multiple interrelated projects, contribu-tors, and end-users. The network level of the OSEHO concerns met-rics that describe ecosystem health and can only be described onthat level. The events metric, for instance, looks at organized eventswhere stakeholders are brought together that share an interest inthe total ecosystem, instead of only including specific project events.
The Productivity metrics on the network level are those metricsthat indicate the productivity in the ecosystem. First, new related pro-jects are projects that are part of the ecosystem, such as the launch of anew plug-in for the Eclipse development environment. The downloadsfor new projects indicate that the ecosystem is healthy, as new projectsstill find a welcoming community. The added knowledge indicates thatcontributors are adding knowledge, such as aggregated information,blog posts, and manuals, indicating also that the ecosystem is healthy.Finally, organized events surrounding the ecosystem are an indicatorthat the ecosystem is healthy. Events are a measure of productivity, asan increase in events over a certain time period may indicate a morehealthy ecosystem.
The Robustness metrics on the network level indicate howwell the ecosystem will deal with change and how quickly it willrecover. The number of active projects, for instance, is a strong indi-cator of strength and power in numbers. Cohesion, i.e., connected-ness between members, and core network consistency are bothindicators of how well connected parts of the network are, basedon the assumption that a well-connected network is healthier. Out-bound links to other software ecosystems indicate how well the eco-system is connected to other ecosystems, and how much those
Please cite this article in press as: S. Jansen, Measuring the health of open sourcTechnol. (2014), http://dx.doi.org/10.1016/j.infsof.2014.04.006
ecosystems depend on this ecosystem. Outbound links are a mea-sure of robustness, as a more connected ecosystem can betterwithstand shocks within the ecosystem by enabling well con-nected projects to seek activity, revenues, and end-users fromother domains, ecosystems, and projects during such a shock.Switching costs to other ecosystems indicate how hard it is to moveto another ecosystem for an ecosystem player, and how easy it is tomulti-home as a niche player, i.e., avoid strong dependencies on anecosystem by being part of multiple.
The Niche Creation metrics on the network level describehow much opportunity there is in the ecosystem to start as anew niche player. This is mostly defined by a large variety in pro-jects, indicating there are many niches, platforms, domains, etc.,in which a new player can become active.
4.3. Project level
The network level describes those metrics that can only be cal-culated by looking at the complete ecosystem. One level deeper,one can look at the ecosystem’s constituents (i.e., the projectsand everything attached to those projects). The project level met-rics are to be seen as metrics about the aggregate metrics thatcan be derived by looking at multiple projects. Single project met-rics are not interesting, unless the project constitutes a significantportion of the ecosystem.
The Productivity metrics on the project level are the metricsthat indicate how much the projects contribute to the total ecosys-tem. The most important metric is typically the number of lines ofcode added or changed over a time period, as this is a prime indi-cator for the activity of contributors in the ecosystem. Productivityis also seen in the knowledge and artifact creation by contributors,such as manuals, translations, marketing materials, etc. Also, thenumber of spin-offs and forks provides a relevant metric, as thisindicates developer interest. Finally, new partnerships and any pat-ent activity indicate that the project, and thus its surrounding eco-system, is becoming more productive.
Other indicators are the number of tickets and related bug fixtime, as these indicate how quickly problems are reported andresolved in the ecosystem. Similar to this is the livelihood of a mail-ing list: the more lively it is, the more people are (probably) con-tributing and using the project. The number of downloadsindicates how many end-users actually start using the product,and any increase or decrease in this number is an indicator thathealth may be increasing or declining. The usage of a project is alsohighly indicative of how important a project is to its end-users, andcan be used as a predictor of robustness.
The Robustness metrics on the project level indicate how wellthe project deals with change. Typically, the best defense for a pro-ject to survive a big change is in numbers: a large number of activedevelopers, for instance, is indicative of a robust project, and themore robust projects there are in an ecosystem, the healthier itcan be considered.
Because of the large number of metrics in this category, theindicators are put into three conceptual groups: organizational,contributors, and end-users. The three groups are mostly createdfor clarity. They do, however, enable a researcher wishing toresearch the robustness on a project level, to address one of thegroups separately with a particular research approach. The contrib-utor group, for instance, can be approached by a survey to obtainthe metrics that are relevant in that group.
The organizational metrics include partnerships and embedded-ness, as partnerships indicate a strong project that is well embed-ded in the community. Similarly, commercial patronage andcapital contributions and donations are indicators of acceptance bycommercial organizations, also showing that the project will prob-ably not go away soon. Finally, organizational maturity of the pro-
e software ecosystems: Beyond the scope of project health, Inform. Softw.
S. Jansen / Information and Software Technology xxx (2014) xxx–xxx 5
ject indicates that the project is probably managed well, therebyalso guaranteeing robustness for the project.
In the group of contributors, the most important metric is thenumber of active contributors and their satisfaction with the project.Another factor that can be taken into account when establishinghow robust an ecosystem is, are contributor ratings and reputation,describing how well the developer is contributing and performingwithin the ecosystem. These ratings and reputation can beestablished by looking at their standing in the community, theirnumbers of commits, their individual bug fix times, etc. Whenthese developers multi-home, it adds to the robustness of theproject as the developer is well connected and may establishnew relationships for the project. A final sign of robustness fordevelopers is that a contributor is well-connected in the project,as highly connected networks are more robust than looselyconnected networks.
Finally, in the end-user group, end-user interest, in the form ofpage views, project ‘‘followers’’, search statistics, and other indica-tors of interest can be used to establish robustness. Also, marketshare and user satisfaction are clear indicators that tell whether aproject is robust or not. Furthermore, if switching costs to othersolutions are high, end-users tend to stay with a project for a longtime. Also, user loyalty and usage indicate how robust a project maystay in the future, if metrics such as usage and attrition are known.Finally, the quality of the project artifacts indicate whether the pro-ject is fickle, or whether it has been built to last.
The Niche Creation metrics on the project level indicatewhether the project allows for sufficient freedom and variationto enable end-users and contributors to create new niche solutionswith the project. When a project, for instance, supports many differ-ent technologies it can be used broadly in different contexts,thereby facilitating new and innovative ways of using the project.The same holds for a project that is used in different markets, isavailable in different languages, and has been built with differentdevelopment technologies, as that allows more people with differentskill sets to join in with the project. From these factors it alreadybecomes clear that having a project that can be applied in a widevariety of contexts, will be more supporting for niche creation.Finally, a strong variation in contributor types shows that a projectis mature and enables different types of contributors to come upwith new domain specific applications.
Manikas and Hansen [23] in their work look at actor health,software health, and orchestration health. In the OSEHO, these lev-els are not identified explicitly. The actor in ‘‘actor health’’, forinstance, may be the open source developer, the organization thatdeveloper stems from, or even the keystone organization itself. Inthe OSEHO most of the actor health factors are part of the projectlevel. Orchestration has deliberately been left out of the OSEHO:the results of orchestration are reflected by changes in the metricsin the OSEHO and should therefore not be part of the OSEHO, in ouropinion. One aspect of orchestration, for instance, is licensing. Alicense can be detrimental to the adoption of a project, if it is infec-tious [28], for instance. Should a license be changed to becomemore reuse friendly, this should be reflected in the metrics overtime. Finally, the OSEHO spends less attention on software health,whereas Manikas et al. specifically address software componenthealth, platform health, and software network health. In the OSE-HO these are not specifically addressed, but are reflected in theartifact quality measures, project connectedness metrics and inthe variety measures.
4.4. Analysis method
When a researcher is interested in establishing the health of anopen source ecosystem, she can apply the framework in the follow-ing way:
Please cite this article in press as: S. Jansen, Measuring the health of open sourcTechnol. (2014), http://dx.doi.org/10.1016/j.infsof.2014.04.006
1. Set goals – First, the researcher will establish the goal of thehealth assessment. By summing up the goals, she can determinewhich metrics are most relevant. This is also the phase wherethe researcher will determine the frequency of data collection,so whether this is a one-time assessment or something thatneeds to be done continuously.
2. Select ecosystem scope – Secondly, the researcher needs toestablish whether to study one subsystem in its context, ormultiple ecosystems in a broader context. Scoping too narrowlyresults in a limited view on the complete ecosystem (ignoringthe non-open source browser Internet Explorer when decidingfor which browsers a browser plug-in will work, for instance),where a scope that is too wide results in non-informative dataon larger ecosystems (gathering data on all Linux variants,where the subcluster of Debian variants was already selectedas being most interesting for a specific research question).
3. Select metrics – The goals are used to select the specific metricsthat are relevant to reaching those goals. Preferably, the metricscan be collected comprehensively, but as will be highlighted inthe research challenges in Section 6, this is not trivial and prac-tically impossible in most cases, so the researcher will have tosuffice by collecting data for subsets of the metrics.
4. Assess available data – The researcher will assess which data isavailable and whether the collection will be sufficient to reachthe goals set in the first step.
5. Collect data – The data is collected using the most efficientmethods available, such as repository mining, sending out asurvey to ecosystem participants, doing financial analysis,studying literature and existing reports, and any othermethod that can satisfy the data requirements described instep 2.
6. Analyze the data – The data is analyzed and goals are satisfied.
The analysis does not differ from a typical data miningproject and must be customized for each ecosystem or researchproject. A relevant question that must also be asked is howfrequently one wishes to perform the analysis. Furthermore, it isrecommended that any tools or data sets are published, as theyprovide a history to future researchers, can be used to validateresearch, and can be reused in case the project is redone in thefuture.
In scoping the ecosystem, a fitting view on software ecosystemsis taking the view that the complete software ecosystem is a largedatabase with organizations, ranging from one-man teams up tomulti-national software vendors, that produce software. Whendeciding which of these organizations should be included in theecosystem analysis, the researcher should define inclusion criteria,such as ‘‘creates Linux software’’, ‘‘creates plug-ins for Firefox’’, or(even narrower) ‘‘writes scripts for GreaseMonkey (a language forchanging how web pages are viewed in the Firefox browser)’’.As soon as the set of organizations that are included in a researchproject is known, the researcher can start collecting data onthem.
4.5. Applying the method and OSEHO in practice
When applying the method, beneficiaries need to establish theirgoals. To illustrate, we provide the following non-exhaustive list ofuse cases for the method and the OSEHO.
In the first and perhaps most important scenario, an opensource project organization must constantly look at its own growthand health. Several examples of metrics that must be continuouslycollected and evaluated are the number of third-party extensionsto the platform, the number of active contributors, the events orga-nized around the world for the project, download numbers, andsuccess metrics of other competing projects. It is interesting to
e software ecosystems: Beyond the scope of project health, Inform. Softw.

6 S. Jansen / Information and Software Technology xxx (2014) xxx–xxx
see that an organization such as the Eclipse foundation consistsmostly of ecosystem coordinators, intellectual property experts,and support engineers.2 Furthermore, it should come as no surprisethat the Eclipse Foundation in their year end reports focus specifi-cally on the metrics mentioned above.3
In a second scenario, software producing organizations regu-larly need to assess whether they will have their commercial activ-ities depend on an open source platform, such as a databaseplatform, a web server, an IDE, or another essential third-partycomponent. These decisions are typically long-term: the softwareproducer expects to benefit from a strategic decision aboutdepending on a third-party platform and must invest to integratethat component. Such a decision should not be made lightly: whatif the third party platform changes its license? Or what if the teambehind the component decides to fork a project and continue undera different name? And what if important issues are rarely fixed?Software producing organizations must regularly (i.e., yearly) doa health check of the ecosystem surrounding the platforms theydepend on, as radical changes in these ecosystems can stronglyinfluence the success of the software producer’s software products.In several case studies we have observed that the software produc-ing organization started participating actively in the developmentof the open source platform or started themselves building plug-ins for it [16].
A third scenario is that of an end-user representative decidingwhether to structurally start using an open source platform, suchas for Word processing, for long term use. An end-user representa-tive can potentially decide for thousands of users whether to go foran open source platform (i.e., LibreOffice) over a commercial vari-ant. Such a choice is obviously not made lightly: a platform needsto be adopted into an organization’s infrastructure, providing massdeployment, support, courses, and other services surrounding theplatform. The application owner within that organization must fre-quently check on the health of the ecosystem surrounding the pro-ject, to find potential extensions for the platform, to see howcompeting platforms are doing, and to make sure there is a fertileand healthy ecosystem surrounding the project to ensure of itscontinuance. The health scan will in this case typically serve asan addendum to a much heavier functional evaluation of theplatform.
Putting to use the OSEHO, organizations can gain strategicadvantage over others. Software ecosystem coordinators (such asthe Eclipse Foundation) require the information that stems fromthe metrics in the OSEHO to make well-informed decisions abouttheir strategy. If we (imperfectly) equate a software ecosystem toa platform, we can follow Cusumano’s Staying Power [5] conditionsfor a successful strategy. Specifically, he mentions that thereshould be strong network effects, there should be little differenti-ation between platforms, and multi-homing must be hard. Manyof the metrics can assist in making decisions about these three fac-tors. The more active contributors there are, for instance, the morenetwork effects you gain. Furthermore, the more domain specificsolutions there are to your platform, the more end-users can usethe platform. In regards to multi-homing, it is interesting to seefor what other platforms the extenders in your own ecosystemrelease their component: it may be beneficial to make multi-hom-ing harder or to assimilate the other platform into the ecosystem.With the metrics in mind, ecosystem coordinators can make stra-tegic decisions about where they want to improve and invest.
The OSEHO attempts to do the same for end-users and end-userorganizations: provide them with insight into the healthiest eco-systems such that they can adjust their strategy to it. The OSEHO
2 http://www.eclipse.org/org/foundation/staff.php.3 http://www.eclipse.org/org/foundation/reports/annual_report.php.
Please cite this article in press as: S. Jansen, Measuring the health of open sourcTechnol. (2014), http://dx.doi.org/10.1016/j.infsof.2014.04.006
enables an end-user organization to choose, for instance, betweeninvesting in the development of a domain specific solution for ahealthy platform, versus taking what is already available from anunhealthy platform. In a long term strategy, the first option shouldprevail.
5. Analysis of the research projects
Four research projects have been selected to illustrate the use ofthe OSEHO. The selection criteria have been listed in Section 3.
The first project applies ecosystem health metrics to determinehow healthy the ecosystems surrounding commercial Platform as aService providers are [19]. The goal was to provide stakeholders inthese ecosystem with insight into their ecosystem developmentand the most important metrics that indicate success in these eco-systems. The data source was GitHub and statistical analysis wasused to determine that Heroku, a platform as a service provider,is currently doing best, but that there are others growing veryquickly.
The second project looks into the health of the Python opensource ecosystem, by extracting information from a collection ofprojects that are part of the Python ecosystem [12]. The Pythonecosystem is highly active and grows quickly (exponentially, atsome points even). The stakeholders in mind are keystones in theecosystem, as they may wish to steer the ecosystem in a certaindirection. A number of key characteristics defining the health ofan open source ecosystem are established and the authors callfor an extension of the work to other ecosystems.
The third project aims to validate a framework for open sourcecommunity analysis. The framework is still in use and furtherdeveloped, with the aim of analyzing developer behavior in opensource communities, where health does not have to be the mainfocal point in the research. They evaluate the framework by takingan extended view at all projects in the Gnome ecosystem [25].They establish the roles and activities of developers over the differ-ent projects in the ecosystem.
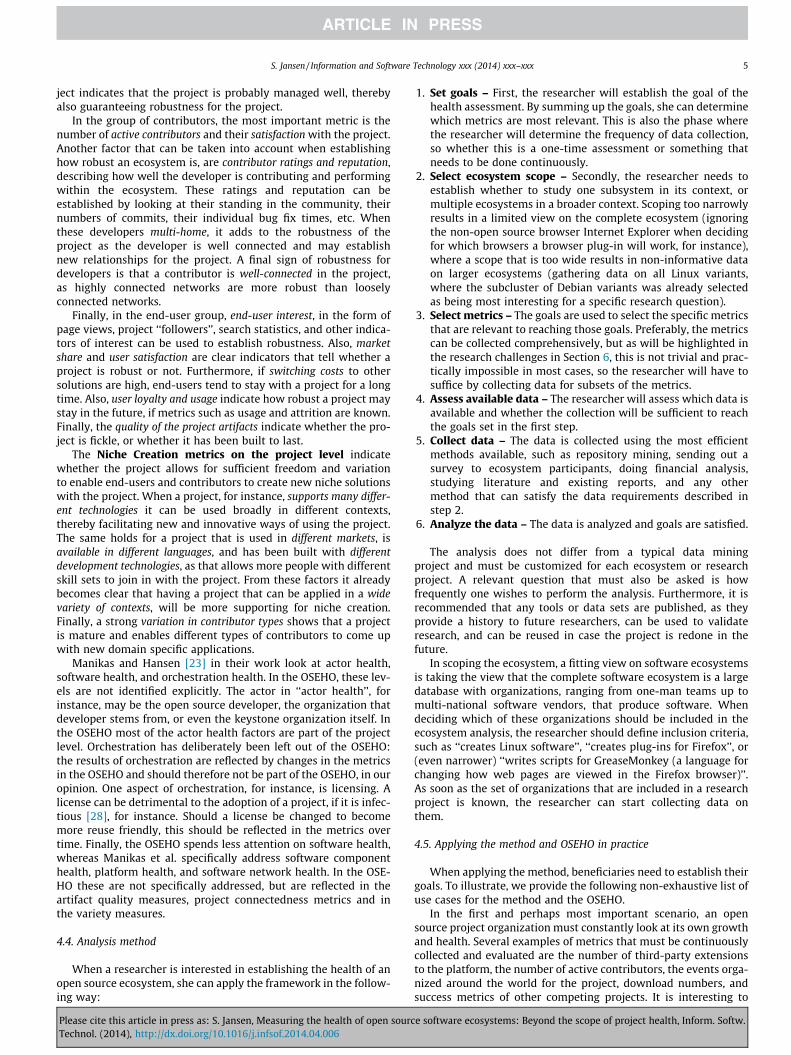
The fourth project looks at three of the largest open source con-tent management systems and finds that ecosystem health andadoption are not equal [27]. Health is looked at by extracting pro-ject information from projects related to the content managementsystems. The largest challenge found in the paper lies in the healthcomparison between the three ecosystems. The research projectsare summarized in Table 1. For each of the rows in the table, theobservations about the projects are discussed.
5.1. Aims, research methods, frameworks, indicators, andcontributions
When looking at the aims of the different research projects, itbecomes clear that the recurring pattern is that some other entity,outside of the academic community, can be informed by theknowledge that is collected about the ecosystems under study.The four projects mention that two groups are going to profit fromthe results: (1) keystone players that need information about theirecosystems and (2) stakeholders that are (planning to be) part ofan ecosystem. Two of the projects focus on one ecosystem and thusget in-depth knowledge about the platforms, whereas the othertwo do a comparative study of different ecosystems to compareand contrast. The OSEHO has a third target group: to provideresearchers with a framework for establishing ecosystem healthand potentially even to extend the framework with new metrics.
The research methods applied show an interesting mix of qual-itative and quantitative data gathering and analysis, with a focuson the latter. Furthermore, the four projects display the use of mul-tiple data analysis methods, indicating that multiple sources of
e software ecosystems: Beyond the scope of project health, Inform. Softw.

Table 1Research project survey.
Title P1: Ecosystem health of cloud PaaS providers P2: A study of the health of the Pythonecosystem
P3: The Case of the Gnome Community P4: Comparing the ecosystem health of CMSs
Publication Lucassen et al. [19] Hoving et al. [12] Mens and Goeminne [25] van Lingen et al. [27]Aim Evaluate the health of Platform as a Service
providers in a cost effective and objectivemanner
Evaluate the health of an open sourceecosystem and identify typical developercollaboration types
Validate a framework for open sourcecommunity (health) analysis and provideinsight into the Gnome community
Establish health of three ecosystems to informend-users or niche players of the mostsuccessful CMS
Sources GitHub. BitBucket, Tigris, and LaunchPad werediscarded due to data scarcity
The Python index of components: http://pypi.python.org
The Gnome project list: git.gnome.org/browse/ The component overviews of threeecosystems, Wordpress.org, Joomla.org, andDrupal.org. Forum posts. Google for google hitsper project, and Google Trends
Method Select platforms and data sources, mining appusing GitHub API, data preparation, 1% manualcross validation, some false positives found
Download all developers from manifests, splitup developer lists, identify relationshipscreated_by and collaborated_with
Mining detailed commit data in the GnomeCommunity, by analyzing all projects on theGnome project sites
Data gathering through a survey, anautomated scraping tool, and some manualwork.
Health frameworks (A part of) Crowston Parts of den Hartigh et al., Wynn et al. andIansiti et al.
Health is not specifically mentioned in thearticle
None
Indicators Active contributors: active developers in thepast year, active developers of uniquerepositories in the past year, active developersper segment of time, lines of code added perperiod of time. Spin-offs: total repositories,unique repositories, forks. Interest: number offollowers, unique programming languages,multi-platform repositories, repositoriesupdated at least once, active repositories
Active contributors, number of projects,number of total project downloads, growth innumber of projects, project connectedness
Active contributors, number of authors. KLOC/time period, contributor activity, number ofprojects, project connectedness, variety in roles,sub-communities, activity division across sub-communities, do community membersspecialize over time
New related projects, active contributors, Up-to-dateness of projects, ‘‘findability’’ of theecosystem, centrality of the platform, marketshare analysis, level of contribution percommunity user, perceived ecosystem health
Contribution The research provides a method for quicklyproviding insight into both internal andexternal stakeholders in a PaaS ecosystem andits health. Furthermore, it shows howecosystem health can be used outside thetraditional ecosystem views
Provides a snapshot of the Python ecosystem,which successfully exhibits an increasinggrowth in numbers of components added to theecosystem. It also discusses how connectednesscould be improved to make the ecosystemhealthier
Exemplary analysis of sub-communities,community members specialize over time,overall activity appears to be dropping, codingremains the activity that requires most effort,although other activities become moreimportant over a project’s lifetime
A status report on the health of threeecosystems, ecosystem health – platformsuccess
Challenges Data filtering, data unification, download countnot working on GitHub. Some components onGitHub support multiple platforms.Operationalization of indicators of Crowstonet al. [3], specifically active developers, spin-offs, interest
Expand the work by taking a closer look at theroles that developers take on (bridgers, lonewolfs, brokers, etc.). Continuous measurement.Detailed project data, such as code, must beretrieved from different sources (SourceForge,GitHub, etc.) Missing data, even from themanifest files
Data unification, advanced architecturedeveloped to approach the problems posed bydistributed data, heterogeneous data, etc.
Historical data gathering impossible, plethoraof research methods necessary to gain abalanced view
Discussion Absolute numbers should not be leading,developments in some smaller ecosystems arehealthy and strong. No financial data availablefor each platform. Continuous data gathering
More in-depth study needed before a full reportcan be given
None Hard to compare three somewhat equalecosystems, Google search statistics notalways reliable, no historical data
S.Jansen/Inform
ationand
Software
Technologyxxx
(2014)xxx–
xxx7
Pleasecite
thisarticle
inpress
as:S.Jansen,M
easuring
thehealth
ofopen
sourcesoftw
areecosystem
s:Beyond
thescope
ofproject
health,Inform.Softw
.Tech
nol.(2014),http://dx.doi.org/10.1016/j.infsof.2014.04.006

4 http://langpop.corger.nl/.
8 S. Jansen / Information and Software Technology xxx (2014) xxx–xxx
data are typically used in ecosystem health research. The work ofMens and Goeminne [25], calling for a generic data collectionand analysis workbench for ecosystem analysis, has an obviousrole here, as the other three projects are using interesting mixesof web scraping, failing APIs, and manual data gathering. In theproject studying content management systems (CMSs), the datais validated in part by conducting a survey among niche playersin the CMS ecosystems.
The frameworks that are used for outlining the health researchare mostly developed by the authors themselves. Lucassen et al.[19] use a part of Crowston’s framework, and Lucassen et al. [12]refer to the works of Iansiti and Levien, den Hartigh et al. andWynn. These frameworks can be considered comprehensive, butnot necessarily for the domain of open source ecosystem health.Furthermore, even though the work of Wynn for instance is com-prehensive, it is not operationalized, further strengthening theneed for the OSEHO. The OSEHO strongly bases itself on theseframeworks, but can be considered more extensive, because otherworks than the ones used in the research projects have beenincluded in the evaluation as well, such as the work of Wigginset al. [30] and that of Haenni et al. [11].
The indicators mostly used are contributors, projects, activity,relationships between contributors, and interest and are found inthe four research projects. The contributors, projects, and interestare typically easy to obtain. Contributors are typically gatheredthrough the manifests of projects, which in turn are gathered fromproject lists. Interest is gathered using Google Trends for two of theresearch projects and by looking at secondary variables (forks, fol-lowers, etc.) in the other two research projects. Relationships areharder to obtain but are typically determined by looking at co-authorship or collaboration on similar projects and code. Further-more, it appears that the research projects were strongly influ-enced by the availability of data: the research design wastypically created with the available data in mind. Please note thatsome of the indicators in the projects are operationalized versionsof the metrics in the OSEHO. Take for instance the indicators ‘‘up-to-dateness of projects’’, ‘‘findability of the platform’’, and ‘‘central-ity of the platform’’ from the project of van Lingen et al. [27]. ‘‘up-to-dateness of projects’’ is an operationalization of ‘‘total numberof active projects’’, ‘‘findability’’ is an operationalized version of‘‘search statistics’’, and ‘‘centrality of the platform’’ is an operation-alization of ‘‘core network consistency’’. In the OSEHO a degree offreedom is necessary, as these indicators are just one way of inter-preting the metrics. Other interpretations are possible, hence thereis not an exact match between the indicators found in the fourresearch projects and the metrics in the OSEHO. The OSEHO does,however, encompass the metrics used in the research projects.
The contribution of the work by Lucassen et al. [19] provides areport on the Cloud providers and the surrounding activities onGitHub. Furthermore, the work shows how GitHub can be usedto gauge health of commercial or closed ecosystems. The work ofHoving et al. [12] provides insight into the Python ecosystem andattempts to provide stakeholders with tools to increase connectiv-ity. The work of Mens and Goeminne [25] gives an insightful viewof the Gnome ecosystem, with a specific focus on contributor roles(such as translation, design, and coding activities) and attempts toprovide a standard workbench for open source ecosystem analysis.The project of van Lingen et al. [27] compares the health of the eco-systems of three large open source CMSs and illustrates that eco-system health (Drupal is the healthiest) does not equate platformsuccess (Wordpress is more successful by far). The works succeedin providing ecosystem stakeholders with new insights into theircommunities. The works presenting new methods for data analysisare most interesting for the academic community, such as usingGithub for analyzing somewhat closed ecosystems [19] or intro-ducing a framework for open source analysis [25].
Please cite this article in press as: S. Jansen, Measuring the health of open sourcTechnol. (2014), http://dx.doi.org/10.1016/j.infsof.2014.04.006
What these projects show is a plethora of approaches in obtain-ing data on ecosystem health and subsequently analyzing it. TheOSEHO aims to bring these approaches together and put them intocontext. These approaches furthermore illustrate the use andapplicability of the evaluated aspects in the OSEHO and indicatethat the OSEHO is applicable and useful for those aspects.
5.2. Data sources for open source ecosystem health
There are roughly three types of data sources for performingecosystem health research. First, there are the project sites. Projectsites are sites where all data about an open source project are col-lected, typically including the source code. Project sites are typi-cally hosted by project hosting services, such as SourceForge,Github, BitBucket, or Tigris. Many of these project hubs are wellaware of the wealth of data that is held in their databases. GitHub,for instance, has an advanced API that can be queried by anyoneand SourceForge provides their data as one downloadable data-base, that can be reused for research purposes.
The second type of data source are ecosystem hubs. Such hubscontain essential project indexes, such as RubyForge’s gem index,the Python egg index, the Joomla Component index, and many oth-ers. These sources are typically managed by a keystone organiza-tion within the ecosystem and are an excellent starting point forany ecosystem health project. Please note that the ecosystem pro-ject lists can also be collected by querying the project sites, but thisintroduces new challenges in regards to the elimination of falsepositives (see Section 6).
The third type of source are aggregation sites, where aggregatedinformation is stored about an ecosystem, or even about all ecosys-tems. Ohloh.net stands out as one of the sites where informationabout as many open source projects as possible is collected.Another interesting source in this regard is StackOverflow, a ques-tions-and-answers community for developers. One example of anapplication of data analysis of StackOverflow is the language pop-ularity index, developed at Delft University.4
Besides these sources that can be scraped, downloaded, analyzed,and called upon with an API, it is always possible to perform a devel-oper or contributor survey. This has proven successful in several eco-system research projects, such as the CMS project [27] or a projectinto clusters in the Ruby ecosystem [26], where contributors wereasked whether they are aware of their place in a cluster of contribu-tors or not, and how these clusters were shaped or formed.
Three of the projects focus on project indexes created by the key-stone players. The keystone obviously can play a crucial role here:without such indexes the community does not have a central gather-ing place for ecosystem participants. The fourth project has focusedon Github as the central repository, after discarding several others,and used its search results as the way to getting related projects.
Data sources of high quality are essential for ecosystem healthstudies, on three levels. On the first level, there is a need for accessto the source code of projects, in a generic way. The API of Git-Hub.com, for instance, is an excellent point of access for ecosystemresearchers wishing to delve deeper into source code, for instanceto study API adoption or code quality. On the second level, projectindexes are required that summarize which projects belong to acertain ecosystem. These lists do not necessarily need to be com-plete, but provide starting points for researchers in ecosystemhealth. On the third level, data aggregation sites, such as Ohloh.net,provide researchers with high-quality secondary data, enabling forinstance the study of developer migratory patterns and developerproductivity across ecosystems. In the future it is expected forthese secondary databases to flourish, such as for instance the
e software ecosystems: Beyond the scope of project health, Inform. Softw.

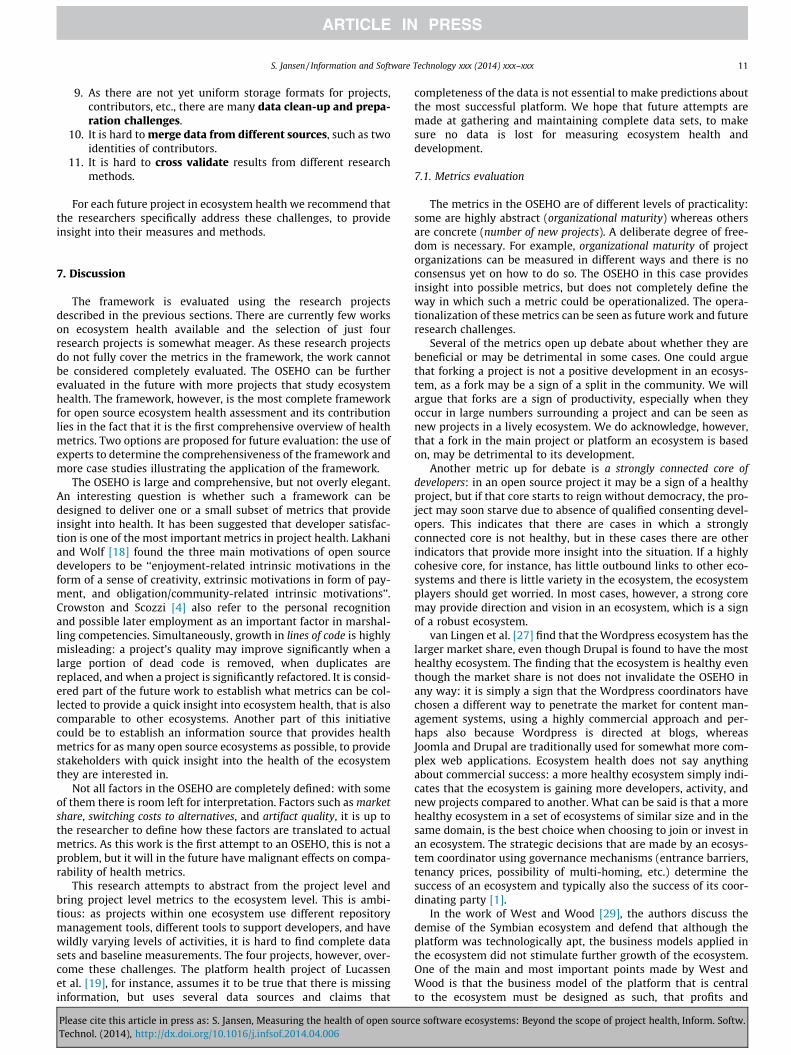
Table 2Data sources for collecting metrics.
Metric/source Project sites Ecosystem hub Aggregation sites
ProductivityNew related projects Project indexes Project indexesDownloads of new projects Download pageAdded knowledge about the
ecosystemContent management system, books, wikis
Events Content management systemKLOC added Software repository ContributionsNew tickets Ticketing systemNew downloads Download pageKnowledge and artefact
creationSoftware repository, content managementsystem
Mailing list responsiveness Mailing listBug fix time Bug trackers Bug trackersSpin-offs and forks Project repository Projects history Repository historyNew partnerships Information pages, code dependencies Partnership modelNew patents Developer surveyUsage Software operation knowledge
RobustnessNumber of active projects Project indexesProject connectedness/
CohesionInformation pages, code dependencies Partnership model
Core network consistency Partnership modelOutbound links to other
SECOsCode dependencies Partnership model
Switching costs to otherSECOs
Developer survey
Partnerships andembeddedness
Partnership model
Organizational maturity Content management system, partnership model,rules and regulations
Explicitness ecosystem
Commercial patronage Partnerships, content management system Partnership modelCapital contributions and
donationsPartnerships, content management system Partnership model, content management
Contributor satisfaction Developer survey Developer surveyActive contributors Repository Repositories, developer survey RepositoriesContributor ratings and
reputationProject contribution size Contributor aggregation Rating systems, contributor
aggregationMulti-homers Contributor aggregationContributor connectedness Contributor aggregationInterest Search engines, page hits Search engines, page hitsMarket share Content management system, end-user
surveysContent management system, end-user surveys Code inclusion in other projects
and ecosystemsSwitching costs End-user and developer surveys End-user and developer surveysUser loyalty and usage End-user and developer surveys, software
operation knowledgeEnd-user and developer surveys
User satisfaction or ratings End-user surveys End-user surveysArtifact quality Code quality in repositories
Niche creationVariety in projects Project indexes, content management system,
multi-homingVariation in contributor
typeContributor data, contributor surveys Contributor data, contributor surveys Contributor data
Variation in projectapplications
Project dependencies, content managementsystem
Project dependencies, content managementsystem
Supported naturallanguages
Content management system, repository
Variety in supportedtechnologies
Project dependencies, content managementsystem
Project dependencies, content managementsystem
Variety in developmenttechnologies
Project dependencies, content managementsystem, repository
Multiple markets Project dependencies, content managementsystem
Project dependencies, content managementsystem, end-user surveys
S. Jansen / Information and Software Technology xxx (2014) xxx–xxx 9
GHTorrent project [10], which is attempting to collect and main-tain as much data from Github as possible, without having to stressthe Github API and without running the risk of losing historicalinformation. Recently, the GHTorrent project has become redun-dant, as Github is now making its data available through the Goo-gle BigQuery initiative on the GitHub archives site.5
5 http://www.githubarchive.org/.
Please cite this article in press as: S. Jansen, Measuring the health of open sourcTechnol. (2014), http://dx.doi.org/10.1016/j.infsof.2014.04.006
In Table 2 we have inventoried the data sources for each of themetrics, categorized by the different levels on which data is gath-ered in ecosystems. The table shows that a large variation of datasources is required and available for measuring open source eco-system health. The main sources are the repository, developeraggregate data (such as the developer’s other projects, characteris-tics, and contribution size), the project indexes, the content man-agement systems of the ecosystem hub and its projects, and anysupporting systems for a project (bug trackers, mailing lists, etc.).
e software ecosystems: Beyond the scope of project health, Inform. Softw.

10 S. Jansen / Information and Software Technology xxx (2014) xxx–xxx
One example is market share. To get market share of a project, weneed to do end-user surveys and collect the knowledge that isalready available. On the ecosystem level, we can also do end-usersurveys and collect information that is already available, such asmarket reports, open source evaluations, and other platform popu-larity data. Finally, on an aggregate level we can analyze, usingsource code and manifest analysis, how frequently a project isrequired and used by other projects.
6. Repository mining research challenges
The research challenges from the projects are listed in Table 1and are collected and summarized to form common research chal-lenges into a research agenda. Each of the terms in bold can be con-sidered a challenge for any new ecosystem (health) study thatinvolves repository mining. The challenges are split into data selec-tion challenges and data preparation and analysis challenges.
6.1. Data selection challenges
When starting a research project for the analysis of open sourcesoftware ecosystems, the first step involves, after formulating aresearch goal, data selection. Based on the available resources, aproject starts by selecting the data that is relevant to reach theresearch goal. The research projects report the following chal-lenges in this research phase.
All projects report on the absence of data, such as missing pro-ject manifests or missing lists of authors. Such missing data forcesresearchers to remove data items from data sets, thereby reducingreliability of the final conclusions. The problem of missing data isespecially painful when researchers wish to compare projects(apples and oranges). It can be extremely hard to compare, forinstance, the health of two software projects based on mailing listresponse time, when one of the projects does not have a mailinglist. Another example is given by forks in projects, i.e., when adeveloper decides to copy the source code branch and continue anew version. These forks are uncommon in subversion projects,not made explicit and typically hard to merge. For a versioning sys-tem like Git, however, forks are one of the most common ways todevelop new features, so comparing the number of forks of a sub-version project and of a Git project is pointless.
Besides it being hard to compare projects with different data, itis even harder when comparing ecosystems. If one of the ecosys-tem keystones stores different meta-data about projects than astakeholder from another ecosystem, comparison becomes nighimpossible. Looking at Python versus Ruby, for instance, it isobserved that Python reports on the number of downloads percomponent (egg), whereas Ruby does not maintain such a metricreliably, as many of its components (gems) are hosted on Github,where the download count metric is unreliable.
Another problem in the problem realm of missing data, is thelack of historical data. Establishing the health of an open sourceecosystem, for instance, becomes much more interesting whenlooking at a developmental picture, using timelines, historicaldownload data, commit data, etc. This data is, however, rarelyavailable as project sites tend to store only current data. Thereare countermovements against this loss of information, such as(again) the GHTorrent project [10], which stores historical dataabout the event logs from GitHub, knowledge that would other-wise be lost.
Another problem for data selection is project findability andecosystem transparency. When an ecosystem does not maintaina central index of projects, it is almost impossible to say anythingsensible about the number of projects that are related to the eco-system. A similar problem is that many of these projects are
Please cite this article in press as: S. Jansen, Measuring the health of open sourcTechnol. (2014), http://dx.doi.org/10.1016/j.infsof.2014.04.006
managed opaquely, i.e., by one organization or developer that doesnot share its source code. This is perhaps the biggest weakness ofthe Platform Comparison project (project 1), as some of the plat-forms may typically be used by more closed organizations (i.e.,partners of Microsoft that develop for the Azure cloud), therebymaking a large part of the ecosystem hidden.
A search challenge frequently mentioned is the elimination offalse positives: as lists of open source projects are collected, forinstance from Github, these projects are typically obtained byrunning a search query on the GitHub site. Several of the hitsmay concern projects outside of the desired scope, but these stillmention the search terms. Or, in the case of Lucassen et al. [19],some open source projects were mentioned that can be used forseveral of the platforms and thus are part of the analyses for boththe platforms.
6.2. Data preparation and analysis challenges
The four projects report on incorrect data, with perhaps themost emphasis on the missing of the number of downloads fromGitHub, which is available through the API, but is a field that isincorrectly filled in. As Github and its API are relatively young thisis not surprising, but has hampered several of the projects. In thefuture, an increase in data quality would strengthen ecosystemhealth research and we hope that open source project authors takethe time to validate the data that is published about projectsonline.
A similar challenge is that of data clean-up and preparation.This may, for instance, involve splitting up contributor namesand identities from the author field in a manifest (e.g., ‘‘GooglePython Team and Guido’’). Although the technical challenge ofsplitting up such fields by keywords ‘and’ and ‘,’ is trivial, the nextstep of identifying and gathering of identities is much more chal-lenging. Another problem that arises here is the challenge of datamerging. It is impossible without extra information to for instancedetermine that ‘[email protected]’ is the same as ‘[email protected]’. The good news is that initiatives such as Ohloh.net arequickly becoming central tomes of knowledge where data is unitedon open source projects, contributors, and their supportingorganizations.
In the domain of data analysis, a common research challenge isfound, being the cross validation of results from differentresearch methods. In the project on CMSs, for instance, a surveywas held amongst contributors about the popularity of the CMS.The survey data was then used in the analysis to strengthen thequantitative data, creating alignment challenges between thequantitative and qualitative data.
Summarizing, we can make explicit the following research chal-lenges in this field:
1. It is hard to select the right data to support the metrics.2. Some data may be unavailable, such as contributor lists.3. It is hard to compare ecosystems, especially when the fun-
damental data differs.4. There may be a lack of historical data, as data sources fre-
quently do not store data over time.5. There may not be a project index, making it harder to col-
lect all related projects.6. The ecosystem may be less transparent, when it typically is
operated in a commercial domain.7. It is hard to identify whether a project has been created
specifically for an ecosystem or simply mentions it in theproject description.
8. Some data may be incorrect, for instance due to faulty datacollection on the data collector’s side.
e software ecosystems: Beyond the scope of project health, Inform. Softw.
S. Jansen / Information and Software Technology xxx (2014) xxx–xxx 11
9. As there are not yet uniform storage formats for projects,contributors, etc., there are many data clean-up and prepa-ration challenges.
10. It is hard to merge data from different sources, such as twoidentities of contributors.
11. It is hard to cross validate results from different researchmethods.
For each future project in ecosystem health we recommend thatthe researchers specifically address these challenges, to provideinsight into their measures and methods.
7. Discussion
The framework is evaluated using the research projectsdescribed in the previous sections. There are currently few workson ecosystem health available and the selection of just fourresearch projects is somewhat meager. As these research projectsdo not fully cover the metrics in the framework, the work cannotbe considered completely evaluated. The OSEHO can be furtherevaluated in the future with more projects that study ecosystemhealth. The framework, however, is the most complete frameworkfor open source ecosystem health assessment and its contributionlies in the fact that it is the first comprehensive overview of healthmetrics. Two options are proposed for future evaluation: the use ofexperts to determine the comprehensiveness of the framework andmore case studies illustrating the application of the framework.
The OSEHO is large and comprehensive, but not overly elegant.An interesting question is whether such a framework can bedesigned to deliver one or a small subset of metrics that provideinsight into health. It has been suggested that developer satisfac-tion is one of the most important metrics in project health. Lakhaniand Wolf [18] found the three main motivations of open sourcedevelopers to be ‘‘enjoyment-related intrinsic motivations in theform of a sense of creativity, extrinsic motivations in form of pay-ment, and obligation/community-related intrinsic motivations’’.Crowston and Scozzi [4] also refer to the personal recognitionand possible later employment as an important factor in marshal-ling competencies. Simultaneously, growth in lines of code is highlymisleading: a project’s quality may improve significantly when alarge portion of dead code is removed, when duplicates arereplaced, and when a project is significantly refactored. It is consid-ered part of the future work to establish what metrics can be col-lected to provide a quick insight into ecosystem health, that is alsocomparable to other ecosystems. Another part of this initiativecould be to establish an information source that provides healthmetrics for as many open source ecosystems as possible, to providestakeholders with quick insight into the health of the ecosystemthey are interested in.
Not all factors in the OSEHO are completely defined: with someof them there is room left for interpretation. Factors such as marketshare, switching costs to alternatives, and artifact quality, it is up tothe researcher to define how these factors are translated to actualmetrics. As this work is the first attempt to an OSEHO, this is not aproblem, but it will in the future have malignant effects on compa-rability of health metrics.
This research attempts to abstract from the project level andbring project level metrics to the ecosystem level. This is ambi-tious: as projects within one ecosystem use different repositorymanagement tools, different tools to support developers, and havewildly varying levels of activities, it is hard to find complete datasets and baseline measurements. The four projects, however, over-come these challenges. The platform health project of Lucassenet al. [19], for instance, assumes it to be true that there is missinginformation, but uses several data sources and claims that
Please cite this article in press as: S. Jansen, Measuring the health of open sourcTechnol. (2014), http://dx.doi.org/10.1016/j.infsof.2014.04.006
completeness of the data is not essential to make predictions aboutthe most successful platform. We hope that future attempts aremade at gathering and maintaining complete data sets, to makesure no data is lost for measuring ecosystem health anddevelopment.
7.1. Metrics evaluation
The metrics in the OSEHO are of different levels of practicality:some are highly abstract (organizational maturity) whereas othersare concrete (number of new projects). A deliberate degree of free-dom is necessary. For example, organizational maturity of projectorganizations can be measured in different ways and there is noconsensus yet on how to do so. The OSEHO in this case providesinsight into possible metrics, but does not completely define theway in which such a metric could be operationalized. The opera-tionalization of these metrics can be seen as future work and futureresearch challenges.
Several of the metrics open up debate about whether they arebeneficial or may be detrimental in some cases. One could arguethat forking a project is not a positive development in an ecosys-tem, as a fork may be a sign of a split in the community. We willargue that forks are a sign of productivity, especially when theyoccur in large numbers surrounding a project and can be seen asnew projects in a lively ecosystem. We do acknowledge, however,that a fork in the main project or platform an ecosystem is basedon, may be detrimental to its development.
Another metric up for debate is a strongly connected core ofdevelopers: in an open source project it may be a sign of a healthyproject, but if that core starts to reign without democracy, the pro-ject may soon starve due to absence of qualified consenting devel-opers. This indicates that there are cases in which a stronglyconnected core is not healthy, but in these cases there are otherindicators that provide more insight into the situation. If a highlycohesive core, for instance, has little outbound links to other eco-systems and there is little variety in the ecosystem, the ecosystemplayers should get worried. In most cases, however, a strong coremay provide direction and vision in an ecosystem, which is a signof a robust ecosystem.
van Lingen et al. [27] find that the Wordpress ecosystem has thelarger market share, even though Drupal is found to have the mosthealthy ecosystem. The finding that the ecosystem is healthy eventhough the market share is not does not invalidate the OSEHO inany way: it is simply a sign that the Wordpress coordinators havechosen a different way to penetrate the market for content man-agement systems, using a highly commercial approach and per-haps also because Wordpress is directed at blogs, whereasJoomla and Drupal are traditionally used for somewhat more com-plex web applications. Ecosystem health does not say anythingabout commercial success: a more healthy ecosystem simply indi-cates that the ecosystem is gaining more developers, activity, andnew projects compared to another. What can be said is that a morehealthy ecosystem in a set of ecosystems of similar size and in thesame domain, is the best choice when choosing to join or invest inan ecosystem. The strategic decisions that are made by an ecosys-tem coordinator using governance mechanisms (entrance barriers,tenancy prices, possibility of multi-homing, etc.) determine thesuccess of an ecosystem and typically also the success of its coor-dinating party [1].
In the work of West and Wood [29], the authors discuss thedemise of the Symbian ecosystem and defend that although theplatform was technologically apt, the business models applied inthe ecosystem did not stimulate further growth of the ecosystem.One of the main and most important points made by West andWood is that the business model of the platform that is centralto the ecosystem must be designed as such, that profits and
e software ecosystems: Beyond the scope of project health, Inform. Softw.

12 S. Jansen / Information and Software Technology xxx (2014) xxx–xxx
revenues made from the platform should be re-invested into theplatform and surrounding components. One could defend thatSymbian was a healthy ecosystem, but was finished off by externalfactors. As Symbian is a closed-source platform, it is hard to bringthese findings to the evaluation of open source platforms, but it issurprising to see that a healthy ecosystem can still be overtaken bya superior ecosystem so quickly. The main recommendation in thecontext of the OSEHO is to track user loyalty and active developers,as they are the first ones to indicate that another platform or eco-system is more attractive.
7.2. Conclusion and future work
This paper provides the Open Source Ecosystem Health Opera-tionalization, a framework that is used to establish the health ofan open source ecosystem. It is unique because it abstracts fromthe project level. Its application is explained in detail, illustratedusing four research projects from literature, and possible chal-lenges researchers may face are discussed in-depth. The operation-alization provides ecosystem researchers with a foundation undertheir ecosystem health work and they no longer need to start fromscratch when establishing the health of an open source ecosystem.To evaluate the framework further, more studies of software eco-systems and their health must be performed. Furthermore, usinginterviews the framework can further be evaluated by experts.
This article is a call to action for ecosystem health researchers.First, there is a need for historical data that, if not tracked, will getlost over time. Secondly, data quality must constantly be improved,as current data sources are not always accurate. Thirdly, morestudies are required in this important field to illustrate how easilydata can be gathered and how effectively the data can be used instrategic decision making about an open source ecosystem.
Finally, case studies are an excellent way to further evaluate theOSEHO. There are several case approaches that can be taken. First,it can be attemted to collect all metrics for one particular case.Doing so enables reflection on the framework, for instance inregards to how hard it is to collect certain metrics, analogue tohow den Hartigh and his team commented on their ecosystemhealth operationalization for commercial ecosystems [6]. Secondly,ecosystem participants’ observations and perceptions of a develop-ing ecosystem could be compared with the metrics found in theOSEHO. Such a comparison can be used to evaluate which metricsgive a realistic image of the health of an ecosystem and which met-rics may not be as significant or even contradictory. Thirdly, long-titudinal studies of ecosystems [24], including its metrics, canevaluate the use, effectiveness, and predictive power of the OSEHO.
References
[1] A. Baars, S. Jansen, A framework for software ecosystem governance, in:Software Business, Springer, 2012, pp. 168–180.
[2] O. Barbosa, R. Santos, C. Alves, C. Werner, S. Jansen, A systematic mappingstudy on software ecosystems through a three-dimensional perspective, in: S.Jansen, M. Cusumano, S. Brinkkemper (Eds.), Software Ecosystems: Analyzingand Managing Business Networks in the Software Industry, Edward ElgarPublishers, 2013.
[3] K. Crowston, J. Howison, H. Annabi, Information systems success in free andopen source software development: theory and measures, Software Process:Improvement and Practice 11 (2) (2006) 123–148.
[4] K. Crowston, B. Scozzi, Open source software projects as virtual organisations:competency rallying for software development, IEEE Software 149 (1) (2002)3–17.
[5] M. Cusumano, Staying Power: Six Enduring Principles for Managing Strategyand Innovation in an Uncertain World (Lessons from Microsoft, Apple, Intel,Google, Toyota and More), Oxford University Press, 2012.
Please cite this article in press as: S. Jansen, Measuring the health of open sourcTechnol. (2014), http://dx.doi.org/10.1016/j.infsof.2014.04.006
[6] E. den Hartigh, M. Tol, W. Visscher, The health measurement of a businessecosystem, in: S. Jansen, M. Cusumano, S. Brinkkemper (Eds.), SoftwareEcosystems: Analyzing and Managing Business Networks in the SoftwareIndustry, Edward Elgar Publishers, 2013.
[7] D. Dhungana, I. Groher, E. Schludermann, S. Biffl, Guiding principles of naturalecosystems and their applicability to software ecosystems, in: S. Jansen, M.Cusumano, S. Brinkkemper (Eds.), Software Ecosystems: Analyzing andManaging Business Networks in the Software Industry, Edward ElgarPublishers, 2013.
[8] J. Gamalielsson, B. Lundell, B. Lings, The nagios community: an extendedquantitative analysis, in: Open Source Software: New Horizons, Springer, 2010,pp. 85–96.
[9] J. Gamalielsson, B. Lundell, B. Lings, Responsiveness as a measure for assessingthe health of oss ecosystems, in: Proceedings of the 2nd InternationalWorkshop on Building Sustainable Open Source Communities (OSCOMM2010), 2010, pp. 1–8.
[10] G. Gousios, The ghtorent dataset and tool suite, in: Proceedings of the TenthInternational Workshop on Mining Software Repositories, IEEE Press, 2013, pp.233–236.
[11] N. Haenni, M. Lungu, N. Schwarz, O. Nierstrasz, Categorizing developerinformation needs in software ecosystems, in: Workshop on EcosystemArchitectures, 2013, pp. 1–5.
[12] R. Hoving, G. Slot, S. Jansen, Python: characteristics identification of a free opensource software ecosystem, in: 2013 7th IEEE International Conference onDigital Ecosystems and Technologies (DEST), IEEE, 2013, pp. 13–18.
[13] M. Iansiti, R. Levien, The Keystone Advantage: What the New Dynamics ofBusiness Ecosystems Mean for Strategy, Innovation, and Sustainability,Harvard Business School Press, 2004.
[14] M. Iansiti, R. Levien, Strategy as ecology, Harvard Business Review 82 (3)(2004) 68–78.
[15] S. Jansen, S. Brinkkemper, M. Cusumano, Software Ecosystems: Analyzingand Managing Business Networks in the Software Industry, Edward Elgar,2013.
[16] S. Jansen, S. Brinkkemper, J. Souer, L. Luinenburg, Shades of gray: opening up asoftware producing organization with the open software enterprise model, J.Syst. Software 85 (7) (2012) 1495–1510.
[17] S. Jansen, A. Finkelstein, S. Brinkkemper, A sense of community: a researchagenda for software ecosystems, in: 31st International Conference on SoftwareEngineering, New and Emerging Research Track, 2009.
[18] K. Lakhani, R. Wolf, Why Hackers Do What They Do: UnderstandingMotivation and Effort in Free/Open Source Software Projects, MIT Press,Cambridge, 2005.
[19] G. Lucassen, K. v. Rooij, S. Jansen, Ecosystem health of cloud paas providers, in:Proceedings of the International Conference on Software Business, Springer,Berlin Heidelberg, 2013.
[20] B. Lundell, B. Forssten, J. Gamalielsson, H. Gustavsson, R. Karlsson, C.Lennerholt, B. Lings, A. Mattsson, E. Olsson, Exploring health within ossecosystems, in: Proceedings of the First International Workshop on BuildingSustainable Open Source Communities, Tampere University of Technology,2009.
[21] M. Lungu, R. Robbes, M. Lanza, Recovering inter-project dependencies insoftware ecosystems, in: Proceedings of the IEEE/ACM InternationalConference on Automated Software Engineering, ACM, 2010, pp. 309–312.
[22] K. Manikas, K.M. Hansen, Software ecosystems–a systematic literature review,J. Syst. Software 85 (2012) 12941306.
[23] K. Manikas, K.M. Hansen, Reviewing the health of software ecosystems: aconceptual framework proposal, in: Proceedings of the InternationalWorkshop on Software Ecosystems, 2013.
[24] T. Mens, M. Claes, P. Grosjean, A. Serebrenik, Studying evolving softwareecosystems based on ecological models, in: Evolving Software Systems,Springer, Berlin Heidelberg, 2014, pp. 297–326.
[25] T. Mens, M. Goeminne, Analysing ecosystems for open source softwaredeveloper communities, in: S. Jansen, M. Cusumano, S. Brinkkemper (Eds.),Software Ecosystems: Analyzing and Managing Business Networks in theSoftware Industry, Edward Elgar Publishers, 2013.
[26] S. Syed, S. Jansen, On clusters in open source ecosystems, in: Proceedings of theInternational Workshop on Software Ecosystems, 2013.
[27] S. van Lingen, A. Palomba, G. Lucassen, On the software ecosystem health ofopen source content management systems, in: the Proceedings of the 5thWorkshop on Software Ecosystems, 2013.
[28] J. Waltl, J. Henkel, C.Y. Baldwin, Ip modularity in software ecosystems: howsugarcrms ip and business model shape its product architecture, in: SoftwareBusiness, Springer, 2012, pp. 94–106.
[29] J. West, D. Wood, Evolving an open ecosystem: the rise and fall of the symbianplatform, Advances in Strategic Management 30 (2013) 27–67.
[30] A. Wiggins, J. Howison, K. Crowston, Heartbeat: measuring active user baseand potential user interest in floss projects, in: Open Source Ecosystems:Diverse Communities Interacting, 2009, 94–104.
[31] D. Wynn, Assessing the health of an open source ecosystem, in: Emerging Freeand Open Source Software Practices, Idea Group Publishing, 2007.
e software ecosystems: Beyond the scope of project health, Inform. Softw.