measuring the measurement error: a method to … method to qualitatively validate sensitive survey...
TRANSCRIPT
Electronic copy available at: http://ssrn.com/abstract=2449048
Measuring the measurement error:A method to qualitatively validate sensitive survey data⇤
Christopher Blattman Tricia Gonwa Julian Jamison
Katherine Rodrigues Margaret Sheridan
†
June 11, 2014
Abstract
People may under-report sensitive and risky behaviors such as violence or substanceabuse in surveys. Misreporting correlated with treatment is especially worrisome incausal analysis. We develop and test a survey validation technique that uses intensivequalitative work to check for measurement error in random subsamples of respondents.Trained local researchers spent several days speaking with and observing respondentswithin a few days of their survey, validating six behaviors: four potentially sensitive(crime, drug use, homelessness, gambling) and two non-sensitive (phone charging andvideo club expenditures). Subjects were enrolled in a randomized trial designed to re-duce poverty and anti-social behaviors. We find no evidence of underreporting of sen-sitive behaviors, partly because (we discovered) stigma in this population is low. Non-sensitive expenditures were underreported, however, especially by the control group,probably because of strategic behavior and recall bias. The main contribution is areplicable validation method for observable, potentially sensitive behaviors.
⇤Acknowledgements: For comments we thank Neal Beck, Dan Corstange, Macartan Humphreys, Don
Green, Cyrus Samii, and participants at the NYU 2014 CESS conference. This study was made possiblethrough the financial support of the National Science Foundation (SES-1317506), the World Bank LOGiCATrust Fund, the GLM/LIC Programme of DFID and IZA, a Vanguard Charitable Trust, and the AmericanPeople through the United States Agency for International Development’s (USAID) DCHA/CMM office.The contents of this study are the sole responsibility of authors and do not necessarily reflect the views oftheir employers or any of these funding agencies or governments. Finally, for research assistance we thankFoday Bayoh Jr., Natalie Carlson, Camelia Dureng, Mathilde Emeriau, Yuequan Guo, Rufus Kapwolo, JamesKollie, Rebecca Littman, Richard Peck, Colombine Peze-Heidsieck, Joe St. Clair, Joseph Sango Jr., HelenSmith, Abel Welwean, Prince Williams, and John Zayzay through Innovations for Poverty Action (IPA).
†Blattman (corresponding author): Columbia University SIPA and Political Science, 420 W 118th St.,
New York, NY 10027 ([email protected]); Gonwa: The World Bank, 1818 H St NW, Washington,DC 20433 ([email protected]); Jamison: Office of Research, Consumer Financial Protection Bureau, 1700G St NW, Washington, DC 20552 ([email protected]); Rodrigues: Columbia University SIPA, 420 W 118thSt., New York, NY 10027 ([email protected]); Sheridan: Harvard Medical School/Boston Children’sHospital, 1 Autumn Street, AU 528, Boston, MA 02215 ([email protected]).
Electronic copy available at: http://ssrn.com/abstract=2449048
The trouble with studying sensitive subjects, whether it’s abortion, drug use, crime,
rioting, or support for terrorism, is that people have every reason not to tell the truth.
This makes survey research—the bedrock of so much social science—suspect. Even without
incentives to misreport, self-reported data are often inaccurate. People even make mistakes
about their gender, race, or years of education (Asher, 1974; Bound et al., 2001). When
measuring subjects that can embarrass or endanger the respondent, we worry that people
underreport their attitudes or actions.
When we are interested in the impact of a program or event on sensitive outcomes,
measurement error will also affect our ability to estimate accurate, unbiased causal effects. In
dependent variables, random or “classical” measurement error reduces precision and widens
confidence intervals but (in linear models, at least) won’t bias estimated coefficients (Asher,
1974; Hausman, 2001). Systematic reporting errors, however, generally bias causal estimates,
especially when the measurement error is correlated with the likelihood of experiencing the
program or event (Imai and Yamamoto, 2010). For instance, people who receive an anti-
violence message or an addiction treatment program might be more likely to respond that
they are non-violent or drug free, both because it’s socially desirable and because participants
may conform to the expectations of the people who ran the program.
Researchers have come up with a number of ways to deal with measurement error. The
lucky few can access administrative data. For example, crime studies often prefer arrest
and incarceration records to self-reported crime (e.g. Deming, 2011). Such data are seldom
available outside a few countries, however, and don’t apply to private attitudes or behaviors.
Others use survey experiments and indirect questioning. In list experiments, respondents
report the number of items they agree with on a list, which randomly includes or excludes
a sensitive item.1 In endorsement experiments, respondents rate their support for actors
expressing sensitive ideas.2 These are valuable tools, albeit with shortcomings. They can1e.g. Raghavarao and Federer (1979). For recent applications see Corstange (2009); Blair and Imai (2012);
Aronow et al. (2013); Jamison et al. (2013).2e.g. Bullock et al. (2011); Blair et al. (2014).
1

be imprecise and require large samples, they can be cumbersome when measuring an array
of items, and they make strong assumptions: that people do not lie when counting on a list
or endorsing a person, and that the presence of sensitive items doesn’t affect reporting of
non-sensitive ones.3
Finally, in some cases data are physically verifiable and researchers can use a little of
what Freedman (1991) called “shoe leather”, and simply verify behavior. For instance, in
Mexico, the government sent administrators to verify self-reported asset data used to decide
who was in or out of a cash transfer program and found underreporting of assets to increase
eligibility (Martinelli and Parker, 2009). We ask how far validation can take us with a little
extra shoe leather.
This paper develops and field tests a new approach to measuring potentially sensitive
behaviors. We field test the approach on self-reported crime, drug use, homelessness and
gambling, but the method could be applied to any number of sensitive actions or statuses—
participation in riots or attacks, voting behavior, sexual identity, and so forth. We use
in-depth observation, qualitative interviews, open-ended questioning, and efforts at trust-
building to elicit more truthful answers.
We tested its use in a field experiment with high-risk young men in the slums of Monrovia,
Liberia. The program targeted 999 destitute men with an emphasis on those involved in petty
crime, drugs, or begging. The evaluation, discussed in Blattman et al. (2014), randomized
two interventions designed to reduce crime and violence directly and indirectly: an 8-week
program of group cognitive behavior therapy (CBT) to discourage impulsive and anti-social
behaviors, and an unconditional cash transfer of $200.
Obviously, we are wary of self-reported measures of illegal or immoral behavior, especially
from a population suspicious of authority, some of whom make their living illicitly, and
who often hold multiple addresses and aliases. We should be doubly concerned when one
of the random treatments (CBT) sought to persuade people away from “bad” behaviors,3e.g. Blair and Imai (2012); Aronow et al. (2013).
2
potentially triggering additional social desirability bias among the treated. List experiments
were one option, but in addition to the previous concerns (variability and the assumption of
no liars and no design effects) we found list experiments difficult to implement with a largely
uneducated, illiterate population that were selected in part for impulsive behavior.4 Thus
we explored alternatives.
The goal of our shoe leather approach was to qualitatively validate survey data and
thus measure the direction and degree of error, plus any correlation with treatment status.
Out of more than 4,000 endline surveys conducted over the life of the project, we randomly
selected roughly 7.3% and attempted to validate answers to six of the survey questions
through close observation and interviews within several days of the survey. Specifically, one
of a small team of highly trained and experienced Liberian qualitative research staff would
visit the respondent four times over the course of ten days, spending several hours in casual
conversation. The staff would also casually observe the respondent’s public behavior from
afar, as well as engage peers, family, and community leaders in conversation. Observed
behavior or second-hand reports could become a starting point for a conversation about the
behavior and confirmation. Respondents all consented to qualitative interviews following up
the survey.
Without knowing the respondent’s survey responses or asking the respondent direct ques-
tions, the authors and the validation staff used their judgment and information to code an
indicator whether or not the respondent had engaged in the six behaviors during the previous
two weeks. Four were deemed “potentially sensitive”—marijuana use, thievery, gambling, and
homelessness—and two were typical social behaviors that were not believed to be sensitive—
paying to watch a movie or sports match in a commercial video club, and paying to charge
their mobile phone battery at a kiosk. Staff were trained to be an unobtrusive presence,
and in the course of the study developed a longstanding, almost routine presence in the
communities where we worked, often developing friendly relationships with the respondents.4For instance, a list experiment read aloud would require many ideas to be held in mind, and we were
concerned that answers would be correlated with cognitive abilities.
3

This qualitative approach could introduce different observational error and possibly indi-
vidual staff biases. These errors, we argue, are less likely to bias treatment effect estimates
than the underreporting or social desirability bias we feared. If true, then we can obtain
estimates of the direction and magnitude of systematic measurement error in outcomes, and
also the association with treatment status, thus allowing us to bound causal parameters.
First, we find that, in the endline surveys, men routinely report behaviors we believed to
be sensitive. For instance, at endline, 22% reported stealing in the past two weeks, and 48%
admitted to marijuana use.
Second, responses in the endline survey closely correspond to the validation measures.
They are identical in roughly 75% of cases, with the correspondence actually higher in the
potentially more sensitive behaviors, stealing and marijuana use.
Third, when the survey and validation measures do differ, the difference is small on
average for the potentially sensitive behaviors. Meanwhile, the “non-sensitive” expenditure-
related questions (video club and phone charging) are underreported in the survey compared
to the qualitatively validated measure.
Finally, there is little correlation between treatment status and measurement error in the
potentially sensitive behaviors. But the control group systematically underreports phone
charging and video club use.
Our experience suggests a few explanations for these patterns. After extensive field work,
we believe the reason we see little systematic error in drugs, crime, stealing and homelessness
is that the men most enmeshed in these activities were the least likely to feel stigma. While
most of Liberian society would regard drugs, stealing or gambling as undesirable, the men in
our sample seemed to speak freely on the subject and seldom hesitated to admit the behavior.
This is not something we would have known or could have demonstrated, however, without
the validation exercise.
The systematic error in expenditure-related questions is more puzzling, but we see two
possible explanations: a strategic interest in over-reporting poverty in order to appear eligible
4
for future programs; and recall bias in consumption and expenditure data. Both could explain
underreporting of expenditure-related items. For the underreporting to be correlated with
treatment requires an added strategic interest or recall bias in the control group. We discuss
under what conditions this could arise.
It would be a mistake to cite this paper as evidence that systematic measurement er-
ror in high-risk populations is low. While plausible, more validation needs to be done in
more places. Rather, our major contribution is to present a new and replicable method for
field experiments and other surveys. An Online Appendix describes detailed procedures.
Besides crime, violence and substance abuse, this approach could be useful at measuring
the measurement error in political violence, intimate partner violence, prostitution, sexual
orientation, stigmatized illnesses, and various political behaviors, to name a few examples.
The closest analog to our approach is in psychology, where virtually every survey measure
of mental health has been validated using structured clinical interviews (e.g. Spitzer et al.,
1999). Recent years, however, have seen a variety of new behavioral and other measures to
validate survey data on violence, prejudice, and other troublesome outcomes. In addition
to the list and endorsement experiments mentioned before, Scacco (2010) interviewed a
random subsample of potential religious rioters behind a screen that shielded their identity,
and Paluck and Green (2009) measure cooperation by the patterns of distribution of a group
survey gift. Systematic measurement error is a large and largely unaddressed problem,
however, calling for more such new tools and their refinement and replication.
Context and experimental design
In poor countries like Liberia, governments are especially fearful of urban youth and the
possibility they will commit crimes, rioting, or election violence. We designed a study to test
the economic and behavioral roots of crime and violence among high risk men, described in
Blattman et al. (2014).
5

Sample
The study recruited 1,000 young adult men in five large mixed-income slums in Monrovia,
a city of roughly 1.5 million. The study sought out “hard-core street youth”—men who are
homeless, underemployed, may be involved in drugs and crime, live in extreme poverty, or
were thought to be a danger to society or themselves. It also recruited very poor youth
who could be on the cusp of these high-risk activities. Table 1 describes the study sample
at baseline, based on a 90-minute survey performed by local enumerators in Liberian En-
glish on handheld computers. There are 999 observations (one person dropped out before
randomization).
On average the men were age 25, had nearly eight years of schooling, earned about $40
in the past month working 46 hours per week (mainly in low skill labor and illicit work),
and had $34 saved. 38% were a member of an armed group during the two civil wars that
ravaged the country between 1989 and 2003. 20% reported selling drugs, 44% reported daily
marijuana use, 15% reported daily use of hard drugs, 53% reported stealing something in
the past two weeks, and 24% reported they were homeless.
Experimental design
We designed, implemented, and evaluated two interventions—cash and behavior change
therapy—in a factorial experimental design. We randomly assigned half of the men in each
slum to receive an offer to enter the therapy program, beginning the following week. Therapy
was completed within eight weeks. Following this, we held a lottery for cash grants of $200.
The full sample was eligible. None knew of the cash grant until after therapy was completed.5
Randomization was done through public draw in blocks of roughly 50.
We recruited and implemented the study in three phases with six cohorts or blocks of
men. Table 2 describes the structure of the sample and treatment assignment. The first
phase was a small, successful pilot. Based on its results, we decided to scale the program5There is balance across treatment and control groups (see Online Appendix A for details).
6

Table 1: Description of the study sample (n=999)
Baseline covariate Mean Baseline covariate Mean
Age 25.4 Average weekly work hours in:Married/living with partner 16% Potentially illicit activities 13.6# of women supported 0.5 Agricultural Labor 0.4# children under 15 2.2 Low-skill wage labor 19.4Muslim 10% Low-skill business 11.5Years of schooling 7.72 High-skill work 1.5Literacy score (0-2) 1.23 Ex-combatant 38%Math score (0-5) 2.8 Currently sleeping on the street 24%Health index (0-6) 4.9 Times went hungry last week 1.26Disabled 8% Sells drugs 20%Monthly cash earnings (USD) 73.53 Drinks alcohol 75%Durable assets index, z-score 0.00 Uses marijuana daily 44%Savings stock (USD) 33.75 Uses hard drugs daily 15%Able to get a loan of $300 11% Stole in past two weeks 53%
Notes: Literacy is tested by reading a sentence; a 0 implies illiterate, 1 for some dif-ficulty and 2 for no difficulty. The math score reflects answers to 5 simple arithmeticquestions. The health index reflects self-reported difficulty at three simple physical tasks.The durable assets index represents the first principal component of XX assets, centeredat zero. Surveys were completed with all men, but there are a small number of missingbaseline values per respondent. For purposes of regression analysis, these are imputedwith the sample median to avoid losing the observation.
7

Table 2: Study sample and treatment assignment by block and phase
Start % recruits assigned to:
Phase MM/YY Block N CBT Cash Both None
1 12/10 Red Light 100 28% 24% 25% 23%
2 06/11 Red Light 219 27% 25% 24% 24%06/11 Central Monrovia 179 32% 19% 32% 17%
303/12 Clara Town 175 29% 27% 23% 21%02/12 Logan Town 86 27% 29% 20% 24%02/12 New Kru Town 240 26% 27% 24% 23%
Notes: By design, percentages assigned to each treatment can vary from 25%. Treatmentswere allocated by public draw of colored chips from a bag, without replacement, in groups(blocks) of about 50 people. There were more chips int he bag than people by design (toavoid the last person having a predetermined probability of assignment).
to a further 900 with only minor changes to the interventions and study protocols. To
accommodate the large number of men we scaled up in two phases. An advantage of this
phased implementation is that we calculate impacts over cohorts with different spatial and
time shocks.
Intervention
The behavior change program was designed and implemented by a local non-profit organiza-
tion, Network for Empowerment and Progressive Initiatives (NEPI) Liberia. An international
non-profit, Global Communities, conducted the cash distribution. These partners conducted
all recruitment and program implementation to minimize the perceived connection between
the research team and programs. The research team, from Innovations for Poverty Action
(IPA), were presented as independent evaluators and wore distinct colors and identification
over the years of the study.
Treatment 1: Cognitive behavior therapy and counseling The 8-week program
had two main goals. The first was “transformation”, or the shift from the position (and
8

self-identity) as an outcast living on the fringe of society to an economically- and socially-
integrated member of mainstream society. The second goal was to shift men from present-
oriented decision-making to future-oriented goals and behavior.
The approach and curriculum grew organically out of the experiences and repeated prac-
tice of the local organization, but these theories of change (and the specific curriculum
developed) had a firm grounding in clinical psychology, especially cognitive behavioral ther-
apy (CBT). Group-based CBT approaches have been validated, typically in US populations,
to reduce substance abuse, criminality, and aggression. Blattman et al. (2014) review the
psychological basis of the intervention in detail.
Participants met three times a week in groups of about 20, led by two to three facilita-
tors. They met for roughly four hours at a time, and the only compensation provided for
attendance was a bowl of rice and simple stew. On alternate days when the group did not
meet, the facilitators visited the men at their homes or work areas to provide individual
advising and encouragement. Many of the facilitators who ran the group intervention and
individual counseling were themselves ex-combatants or reformed street youth.
The CBT element of the program manifested itself in the emphasis on small practical
changes each session, which are reinforced through encouragement and praise. These in-
cluded reducing substance use and abuse, improving body cleanliness, improving the clean-
liness of the area in which they live, and managing their anger without resorting to violence.
Facilitators also formally encouraged participants to engage with society in planned and un-
accustomed ways. They also taught a series of new skills around planning and goal setting
designed to help participants enhance their future-oriented attitudes, anticipate potential
setbacks, and build skills for dealing with adversity. Finally, throughout the eight weeks,
facilitators articulated to the participants a set of social norms and encouraged them to
adopt these norms.
9

Treatment 2: Unconditional cash grant All men were eligible for a cash grant of $200,
but the announcement and lottery followed the behavior change intervention so that the cash
would be both a treatment and also a measurement tool, to see whether spending patterns
were affected by the therapy and counseling. The framing of the grant was minimalist—
people were told that it was random, one-time and unconditional. Prior to the lottery, the
group merely received a short lecture (15-30 minutes) on how to safeguard the funds once
received.
Survey data collection
We attempted to collect survey data from each recruit five times: (i) at baseline prior to
the intervention; (ii and iii) at “short-run” endline surveys roughly 2 and 5 weeks after the
cash transfers; and, (iv and v) at two “long-run” endline surveys 12 and 13 months after the
cash grants. The exception is the 100 men in the pilot phase, who had a single “short run”
survey 3 weeks after the grant, and a pair of “medium-run” surveys at 5 and 7 months in
addition to the 12- and 13-month surveys. We ran pairs of short-run and long run surveys
because it allowed us to take two measures of relatively noisy outcomes with potentially
low autocorrelation such as earnings, expenditures, criminal activity, drug use, and so forth.
Taking multiple measurements at short intervals allows one to average out noise, increasing
power (McKenzie, 2012).
Each survey was roughly 90 minutes long, followed by roughly 90 minutes of interac-
tive behavioral games and psychological tests. Liberian enumerators conducted face-to-face
interviews in Liberian English using handheld electronic devices.
This sample was exceptionally mobile and difficult to track over time. A majority changed
locations between each round, many changing sleeping places every few weeks or nights. We
generally made at least four attempts to locate each person, in all corners of the country,
including prison (to be interviewed only when released). Averaging across all endline survey
10

rounds, we were able to track and survey 92% of the men. Attrition is generally unrelated
to baseline covariates (see Online Appendix A).
Empirical strategy
We illustrate the consequences of measurement error in causal analysis of a random treatment
on survey outcomes using a simple linear intent-to-treat specification. We then consider the
consequences of less error-prone validation data for a random subsample.
In this illustrative example, suppose the true specification is:
y⇤ = ↵ + ✓T + " (1)
where y⇤ is the true outcome and T is an indicator for assignment to treatment.6 The
observed survey outcome ys, however, measures the true outcome with both systematic and
random error:
ys = �sy⇤ + �sT + µ (2)
where we assume the random error µ is uncorrelated with y⇤, T and ".
To calculate treatment effects on ys, we estimate the following equation rather than
equation 1:
ys = ↵̂ + ✓̂T + "̂ (3)
By substituting equation 1 into 2 and comparing to 3, we can see that the estimated treat-
ment effect is ✓̂ = �s✓ + �s, and the bias from the true treatment effect ✓ is:6This example adapts the simple approach by Bound et al. (2001), who consider a continuous covariate X
rather than indicator T . They also assume that other right-hand side variables are measured without errorand have been partialled out. We ignore other covariates in this simple example, but the basic intuitionswould hold with them present.
11

E(✓̂ � ✓) = (�s � 1)✓ + �s (4)
Classical measurement error is the special case where �s = 1 and �s = 0. The case
where the survey measure systematically underreports the true outcome (but where this
underreporting is uncorrelated with treatment status) is represented by 0 < �s < 1 and
�s = 0. Under-reporting would bias the estimated treatment effect towards the null, and
over-reporting away from it, all proportional to �. The more worrisome case is when �s > 0,
in which case we mistake measurement error (such as social desirability bias correlated with
treatment) for a treatment effect.
Now imagine we can collect validation data for a random sample of the experimental
pool, y⌫ :
y⌫ = �⌫y⇤ + �⌫T + ⌘ (5)
where ⌘ is uncorrelated with T , y⇤, ", and µ. We define the difference in the survey and
validation measures as:
y� = ys � y⌫ = (�s � �⌫)y⇤ + (�s � �⌫)T + µ� ⌘ (6)
If we accept that the validated measure is more accurate, then y� is a proxy for over-reporting
(and under-reporting if negative).7 It also means we can identify the direction and magnitude
of systematic survey measurement error from the sample mean of y�, and assess whether
the survey error is correlated with treatment by estimating the treatment regression:
y� = ↵� + ✓�T + ⇣ (7)
where, since there is a treatment indicator in y⇤, ✓� = (�s � �⌫)✓ + �s � �⌫ .7This is equivalent to the assumptions that 0 |�⌫ � 1| < |�s � 1| and 0 |�⌫ | < |�s|.
12

As the validated measure approaches the true outcome measure, then ✓� approaches the
value of the treatment effect bias described in equation 4. That is, as �⌫ ! 1 and �⌫ ! 0
then ✓� ! E(✓̂ � ✓). Note that we cannot separately identify the bias arising from general
systematic error � apart from treatment-specific measurement error �. In theory, they could
run in opposite directions and cancel one another out. In that case, however, y� 6= 0. Only
in case where y� ⇡ 0 and ✓� ⇡ 0 can we be more confident there is little systematic error.
Identification of the bias term E(✓̂�✓) hinges entirely on the credibility of the validation
measure. The assumption of lower systematic measurement error is inherently untestable,
and is a judgment call based on the nature and quality of the process. So long as the
validation measures are imperfect, and 0 < �⌫ or 0 < �⌫ , this approach will tend to under-
estimate measurement error. The confidence interval on ✓� also increases with any noise in
the validated measure, ⌘.
Nonetheless, to the extent that the validation measures are credible, if we validate a
random subset of the study sample we can bound the distribution of y⇤ (conditional on T
or other covariates).
Validation methodology
We selected six survey variables for validation, all with recall periods of two weeks. We
attempted to choose a set of variables with varying degrees of social stigma and discourage-
ment by the therapy treatment, and which would be prone to similar types of measurement
error (e.g. recall error) apart from that triggered by sensitivity and desirability bias. The
variables were:
1. Stealing. The corresponding survey questions asked, in the last two weeks, if the
respondent stole someone’s belongings when they were not paying attention (“corrected
someone’s mistake” in the Liberian English vernacular), shoplifted an item (“took
something from behind someone that’s not for you”), or deceived or conned someone of
13

money (“cheated or scraped from people”).8 Based on our fieldwork, we hypothesized
that stealing would be the least socially desirable of all six measures.
2. Gambling. The corresponding survey question was, “In the last two weeks, how many
days did you gamble, including betting like football games and other things?” Before-
hand, we hypothesized gambling had a lower level of sensitivity than stealing, but was
still stigmatized somewhat.
3. Marijuana use. The corresponding survey questions were, “In the last 7 days how many
times did you smoke opium?” and, “What about the 7 days before that?” Opium is the
vernacular for marijuana in Liberia, and does not imply an actual opiate. Marijuana
use is not socially acceptable across Liberian society overall, but is fairly prevalent
in our target demographic. We initially hypothesized underreporting could arise not
so much from social stigma but from the discouragement to drug use in the therapy
treatment.
4. Homelessness. The corresponding survey question was, “In the last 2 weeks, have you
ever had to sleep outside, or on the street, or in a market stall because you had no
other place to sleep or stay?” This is a variable where we hypothesized respondents
might have under-reported from embarrassment or over-reported in order to appear
more needy (and eligible for more programs).
5. Phone charging. The corresponding survey question was, in the context of an expen-
diture portion of the survey, “In the last 2 weeks, how many times did you charge
phones?” In the vernacular, this corresponds to taking one’s phone to a kiosk with
electricity where one pays a small fee to recharge the battery. This is a common and
routine expense for many Liberians, without apparent stigma. 38% of our sample had8The survey also measured more serious forms of theft, such as armed robbery, but our qualitative
validation focussed on non-violent theft.
14

a mobile phone at the endline, and 38% reported charging a phone in the last two
weeks.
6. Video Club Attendance. The corresponding survey question was, “In the last 2 weeks,
how many times did you go to the video club?” These clubs are private businesses
where one can go to watch a movie, television show, or football match for a small
fee. This is a popular and socially acceptable pastime, as most Liberians do not have
electricity or home entertainment.
The program also intended to change political behavior, particularly participation in election
violence, association with ex-military commanders, and participation in riots. These would
normally be candidates for qualitative validation through shoe leather. In this particular in-
stance, there were few opportunities for political violence during our study period, especially
as the election turned out to be a peaceful affair. Also, our three-phase design meant that
opportunities for political violence would have varied by phase. As such, political violence
was not an ideal candidate for field testing the method in this instance.
Validator staff
There were eight different validators over the two years of data collection. Typically two
were active during each validation round. All but one were men, and all had a high school
or some post-secondary education. Two of the men completed roughly half the validations
with the remainder doing roughly 10 to 20% each.
Validators were typically selected from the study’s best survey enumerators and were
also typically trained to (and had extensive experience in) more standard qualitative data
collection with the authors. The authors vetted roughly two to three times the number
of validators from the pool of research staff, selecting only those with the most natural
questioning and rapport-building skills for the validation exercise. Each received at least 10
days of training on the validation methods involving both classroom learning and extensive
15

field training. Further details of validator selection and training, team structure, and tools
and forms are in Online Appendix B.
Approach
For each respondent, the validators tried to determine whether the respondent had engaged
in any of the measured behaviors, even once, in the two weeks preceding the respondent’s
survey date. We found it optimal for each respondent to be visited four times, on four
separate days, with each visit, or “hangout session” lasting approximately three hours. The
validator aimed to begin hanging out the day after subjects completed their quantitative
surveys and to conduct all four visits in the days following the respondent’s endline survey
date.
On the first visit validators would obtain verbal consent for hanging out and learning
more about participants’ lives. The consent script was designed to be informal, and explained
that the goal of hanging out with the respondent was to talk about some of the same things
they discussed in the survey, but also to get qualitative information about people’s lives.
Validators also asked for consent to talk to friends and neighbors. In addition to this verbal
consent, the more formal consent form delivered with the survey said that qualitative staff
may come and visit them again to gather more information.
Validators deliberately avoided the feeling of a formal interview. Validators would typi-
cally shadow the respondents as they were going about their business, rather than sit down
for a formal interview. As a rule, no notes or recordings were taken while with respondents.
The main approach was to engage in casual conversation on a wide range of topics, includ-
ing the six target topics/measures. The target topics were raised mainly through indirect
questions while informally chatting and conversing. For example, validators typically started
conversations with discussions of family. This was both customary among peers in Liberia
and a sign of interest in their lives and respect. It was also a stepping stone for discussing the
target behaviors—either because the validator can discuss an issue in their family (someone
16
engaging in one of the activities) or how the respondent’s family feels about their current
lifestyle and circumstances.
In general, validators found it helpful to tell respondents stories or scenarios about another
person, or themselves, related to the target measures, then steer the conversation to get
information about how respondents have behaved in similar situations, eventually discussing
the past two weeks. Validators were careful to present these behaviors and incidents in a non-
stigmatized light, for instance by discussing a friend who stole in order to get enough to eat,
or how they themselves had periods of homelessness or used drugs and alcohol. Validators
found these personal stories (all of which were truthful) and genuineness were essential to
building rapport and trust.
These conversations might be held once or twice over the three hours, with the validator
spending perhaps twenty or thirty minutes in conversation each time, to avoid unnaturally
long or awkward conversations. The remainder of the three hours was typically spent in
the general vicinity, observing respondents engaging in their daily activities. This could
involve taking a rest in the shade or in a tea shop (as is common) or engaging others
in conversation. Validators would also try to talk casually with the respondent’s friends,
relatives, or neighbors to learn about him (although we considered information from these
second hand sources as insufficient to support a conclusion about the respondents’ behaviors,
but merely as supporting information).
We found that building a rapport with participants in a short space of time was crucial
to success. To develop trusting and open relationships, validators developed techniques,
including becoming close to respected local community and street leaders, eating meals
with participants, sharing personal information about themselves, befriending respondents’
acquaintances, assisting subjects with their daily activities, and mirroring participants’ ap-
pearances and vernacular, as appropriate. In addition, validators tried to maintain neutrality
and openness while discussing potentially sensitive topics. For instance, conveying – through
stories or otherwise – that illicit behaviors were not perceived negatively, allowed respon-
17

dents to feel comfortable sharing their involvement in such activities. Validators did not lie
to or deceive respondents, however.
Overall, the marginal cost of this qualitative validation came mainly from wages and
transport, and was roughly equivalent to the marginal cost of standard tracking and survey-
ing.9 This is considerably more expensive than survey experiments. It is more in line with
the depth and cost of commonplace efforts to improve consumption measurement through
the use of diaries or (in one extreme example) to have enumerators physically measure the
volume of all food consumption, as in the India NSS consumption survey (NSSO Expert
Group,, 2003). For crucial measures in large program evaluations, or for statistics informing
major policies, the cost is small relative to the intervention, larger study, or larger purpose.
Coding validated data
Validators were unaware of the respondents’ survey responses, and formed their own opinions
based on the information they collected about whether the respondent engaged in the six
activities during the time period captured by the quantitative survey.
Written notes were made during the three-hour interview, but only in isolated areas out
of sight from the respondent, such as a toilet stall or teashop. If validators were unable to
find a secluded area in which to take notes, they sometimes recorded information in their cell
phones, pretending to send a text message. A core part of the validator training included
logical reasoning, supporting their reasoning with evidence, and writing this down in a clear
and structured manner.
After each visit, validators made written notes about the relevant data collected, including
evidence to support their conclusions, on a standardized form. At the conclusion of the four
visits, the validator coded six indicators, one for each behavior, where “1” meant that he9We estimate the marginal cost of this validation was roughly $80 per respondent. By comparison, the
marginal cost of surveying a respondent was roughly $70—high given the fact that it typically took one totwo days of searching to find each respondent for surveying, plus the time to survey itself. Both surveyingand validating in Liberia were expensive by the standards of household surveys, largely because of the costof operating in a fragile, post-conflict state and the great difficulties in tracking such an unstable population.
18

had relatively direct evidence that the respondent engaged in the behavior during the recall
period, and “0” otherwise. This was a subjective judgment, but all submissions and coding
decisions were reviewed with the authors case-by-case.
Our experience was that marijuana use was easiest to observe, and validators found other
behaviors straightforward to discuss in conversation, such as gambling, stealing, and video
club attendance. In the survey and (especially) the validation, phone battery charging led
to the most confusion—in particular, did simply charging one’s phone count, or did only
paying to charge one’s phone count? Paid charging was the focus of the survey question
(it appeared in an expenditure survey module), but we were concerned that the validators
would use a more expansive definition. We attempted to mitigate such differences through
trainings and regular discussions on the coding.
Homelessness also proved somewhat challenging to measure and validate. Over time we
determined that homelessness is subjective and dependent on context. For instance, over
time some circumstances arose that were somewhat ambiguous, such as having no home of
one’s own and sleeping on a friend’s floor or in an acquaintance’s market stall. To account
for the potential variability in perceptions of homelessness, validators were instructed to
include as much information as possible about respondents’ living situations in their summary
reports. The authors then worked with validators to code a somewhat broad definition of
homelessness that included any ambiguous circumstances. Prior to analysis, it was not clear
whether survey respondents applied the same definition, and hence we err on the side of
finding underreporting in the survey. As we will see, the results suggest that this broader
definition is consistent with the pattern of survey responses.
19

Table 3: Validation sample, totals and attrition
Surveys Validation Reason for no validation data
Phase Round Target # Selected ValidatedUnfoundat endline
Unfoundfor
validation%
validated
1
3-week 100 05-month 100 24 18 0 6 75%7-month 100 24 12 0 12 50%12-month 100 10 6 3 1 60%13-month 100 10 8 2 0 80%
2
3-week 398 26 24 0 2 92%5-week 398 27 17 0 10 63%
12-month 398 28 25 2 1 89%13-month 398 44 38 1 5 86%
3
3-week 501 05-week 501 0
12-month 501 35 31 2 2 89%13-month 501 69 61 5 3 88%
All 4096 297 240 15 42 81%
Notes: The proportion selected in each round was principally a function of logisticalfeasibility (e.g. number of available staff), and in some none were selected. As proceduresbecame more familiar and staff more experienced, more could be done over time.
Validation sampling and non-response
In each endline survey round we randomly selected study respondents to be validated, strat-
ified by treatment group.10 In general, the validation sample was a balanced subsample of
the full sample (see Online Appendix A for sampling and balance details).
Table 3 describes the samples selected for validation in each survey round over the course
of the study. In total, 297 people were randomly selected for validation, and 240 (81%) were10Respondents were blocked by survey window and within these blocks respondents were randomly selected
(using a uniform random variable generated in the program Stata) to be validated following their survey.The selection was designed not to validate the same subject twice in a given pair of short-term or long-termsurvey pairs, but the same subject could be validated in different rounds. This happened 20 times.
20
found.11 15 were not validated because they could not be found for the endline survey. 42
could not be validated because they were difficult to find again or (more often) because they
moved a long distance away. In general, respondents who had moved across the country
would have been surveyed but were unlikely to be validated because of the time and expense
and opportunity cost in terms of validating others selected.
This attrition is an identification concern, but there is little evidence of biased attrition.
Just as overall endline survey attrition was low and relatively uncorrelated with baseline
characteristics, the excess validation attrition (those who were surveyed but not validated)
was not robustly associated with baseline characteristics (see Online Appendix A for details).
Limitations of the approach
While our qualitative assessment is that this validation exercise gave enough time to gather
detailed, accurate information and fostered trust and frankness, there are nonetheless limi-
tations to this approach.
First, the interviews may be intrusive and might disrupt respondents’ daily activities,
thereby altering the findings. To mitigate this risk, validators wore clothes that would blend
in with their respondent’s environment, and typically accompanied and assisted respondents
in their activities as appropriate (e.g. helping a scrap metal collector scavenge).
Second, the survey and validation questions might have been interpreted differently, mak-
ing it difficult to compare results. As discussed above, phone charging and homelessness
proved somewhat difficult to measure consistently. We used close consultations and reviews
of the data, and focus groups with survey and validation staff, to maximize consistency.
Third, the validation period came after the survey recall period and validators or respon-
dents could have made errors about the relevant window of time—most likely a source of
random measurement error.11The decision to select 297 was made based on a combination of logistical capacity and budget, alongside
power calculations based on the earliest rounds of data collected.
21

Finally, the method is reliant on skills, persistence, luck, and best judgment of the val-
idators and authors—all sources of potential measurement error.
Results
First, the results from the survey and qualitative measures are similar. We construct an
indicator for each behavior from the survey and compare it to the indicators coded by
the validators. We compare survey and qualitative measures in Table 4. The survey and
validated indicators agree 62 to 85% of the time, an average of 77% across the measures
(Column 1).
Second, the potentially sensitive behaviors are reported commonly in both the survey
and the validation exercise. For instance, in the survey 22% report stealing, 48% report
marijuana use, and 18% said they gambled (Column 2).
Third, the means of the survey and qualitative variables are generally quite similar
(Columns 2 and 4). We calculate the simple difference in means, y�, and perform a t-
test, first ignoring the blocking by phase and survey round (Columns 6 and 7). y� is, in
effect, our proxy for survey over-reporting. The negative signs in Column 6 imply large and
statistically significant underreporting of gambling, video club attendance and phone charg-
ing in the survey. These estimates are vulnerable to slight bias, however, because of selective
attrition and differential probabilities of selection into the validation sample over time and
phase. Thus we examine underreporting after accounting for block fixed effects, validator
fixed effects, and baseline covariates. These should also increase accuracy by explaining un-
explained variation. After correcting for these covariates, the underreporting persists but is
smaller and no longer statistically significant (Columns 8 to 11).12 The same patterns hold if
we create additive indices the measures—there is little underreporting of sensitive behaviors
and slight, but not statistically significant, underreporting of the non-sensitive behaviors.12To do so, we perform a t-test on the difference between the residuals from regressions of the survey and
qualitative measures on block fixed effects (for each survey round and phase).
22

Tabl
e4:
Com
paris
onof
surv
eyan
dqu
alita
tive
valid
atio
nm
eans
aten
dlin
e
Surv
ey-q
ualit
ativ
edi
ffere
nce,
with
adju
stm
ent
for:
Beh
avio
rin
past
two
wee
ks
Surv
ey=
valid
ated
mea
sure
Surv
eym
easu
reVa
lidat
edm
easu
reN
oco
varia
tes
Blo
cks
&su
rvey
roun
ds
Blo
cks,
surv
eyro
unds
,va
lidat
orFE
&ba
selin
eco
varia
tes
Mea
nN
Mea
nN
Coe
ff.p-
valu
eC
oeff.
p-va
lue
Coe
ff.p-
valu
e(1
)(2
)(3
)(4
)(5
)(6
)(7
)(8
)(9
)(1
0)(1
1)
Sens
itive
Stea
ling
79%
0.22
238
0.20
240
0.02
0.57
0.00
0.94
0.01
0.80
Mar
ijuan
a85
%0.
4823
80.
5124
0-0
.03
0.24
0.03
0.26
0.01
0.58
Gam
blin
g72
%0.
1823
80.
2923
9-0
.11
0.00
-0.0
30.
40-0
.02
0.57
Hom
eles
s82
%0.
2323
90.
2124
00.
020.
45-0
.02
0.47
-0.0
20.
39
Non
-sen
sitiv
eV
ideo
club
62%
0.42
238
0.61
239
-0.1
90.
00-0
.06
0.10
-0.0
60.
10P
hone
char
ging
82%
0.39
239
0.48
240
-0.0
80.
00-0
.01
0.72
-0.0
10.
70
Sens
itive
(0-4
)1.
1223
91.
2124
0-0
.10
0.17
-0.0
20.
81-0
.02
0.76
Non
-sen
sitiv
e(0
-2)
0.82
239
1.09
240
-0.2
70.
00-0
.07
0.12
-0.0
70.
11
All
(0-6
)1.
9323
92.
3024
0-0
.37
0.00
-0.0
90.
30-0
.09
0.27
Notes:
Col
umn
1re
port
sth
epe
rcen
tage
ofre
spon
dent
sfo
rw
hom
the
surv
eyin
dica
tor
equa
lsth
equ
alit
ativ
ely
mea
sure
din
dica
tor.
Col
umns
2to
5di
spla
yth
em
eans
and
num
ber
ofob
serv
atio
nsof
the
surv
eyan
dqu
alit
ativ
em
easu
res.
Col
umns
6to
11re
port
the
coeffi
cien
t,p-
valu
ean
dnu
mbe
rof
obse
rvat
ions
from
are
gres
sion
ofth
edi
ffere
nce
betw
een
the
surv
eyan
dqu
alit
ativ
em
easu
reon
aco
nsta
ntte
rman
din
dica
tors
for
rand
omiz
atio
nbl
ocks
,wit
hva
riou
sco
ntro
lcov
aria
tes.
Stan
dard
erro
rsar
ero
bust
and
clus
tere
dby
bloc
k.
23
Tabl
e5:
The
corr
elat
ion
betw
een
trea
tmen
tst
atus
and
surv
ey-q
ualit
ativ
em
easu
redi
ffere
nces
OLS
regr
essio
nof
surv
ey-v
alid
atio
ndi
ffere
nce
ontr
eatm
ent
with
bloc
kan
dro
und
FE
No
cova
riate
sW
ithco
varia
tes
Beh
avio
rin
past
two
wee
ksC
BT
Cas
hC
ash
orC
BT
Cas
hor
CB
T
Coe
ff.St
d.E
rr.
Coe
ff.St
d.E
rr.
Coe
ff.St
d.E
rr.
Coe
ff.St
d.E
rr.
(1)
(2)
(3)
(4)
(5)
(6)
(7)
(8)
Sens
itive
Stea
ling
0.02
[.059
]0.
00[.0
56]
0.00
[.067
]-0
.05
[.066
]M
ariju
ana
0.02
[.044
]-0
.04
[.047
]-0
.02
[.048
]-0
.01
[.047
]G
ambl
ing
0.10
[.066
]0.
01[.0
66]
0.03
[.076
]0.
02[.0
78]
Hom
eles
s0.
03[.0
55]
0.00
[.056
]-0
.02
[.072
]0.
01[.0
66]
Non
-sen
sitiv
eV
ideo
club
0.10
[.069
]0.
04[.0
72]
0.14
[.089
]0.
16[.0
85]*
Pho
nech
argi
ng0.
08[.0
53]
0.10
[.056
]*0.
18[.0
68]*
**0.
16[.0
61]*
**
Sens
itive
(0-4
)0.
16[.1
33]
-0.0
3[.1
33]
-0.0
1[.1
56]
-0.0
3[.1
45]
Non
-sen
sitiv
e(0
-2)
0.18
[.086
]**
0.14
[.087
]0.
31[.1
06]*
**0.
31[.0
97]*
**A
ll(0
-6)
0.33
[.158
]**
0.11
[.161
]0.
30[.1
84]
0.28
[.177
]
Notes:
Col
umns
1th
roug
h8
repo
rtth
ere
sult
sfr
oma
regr
essi
onof
the
diffe
renc
ein
the
surv
eyan
dva
lidat
ion
mea
sure
son
anin
dica
torf
orra
ndom
assi
gnm
entt
oea
chor
any
trea
tmen
t,co
ntro
lling
forr
ando
miz
atio
nbl
ock
fixed
effec
tsan
din
dica
tors
for
each
endl
ine
roun
d.C
olum
ns7
and
8in
clud
eba
selin
eco
vari
ates
and
valid
ator
fixed
effec
tsin
the
regr
essi
on.
Stan
dard
erro
rsar
ero
bust
and
clus
tere
dby
bloc
k.**
*p<
0.01
,**
p<0.
05,*
p<0.
1
24

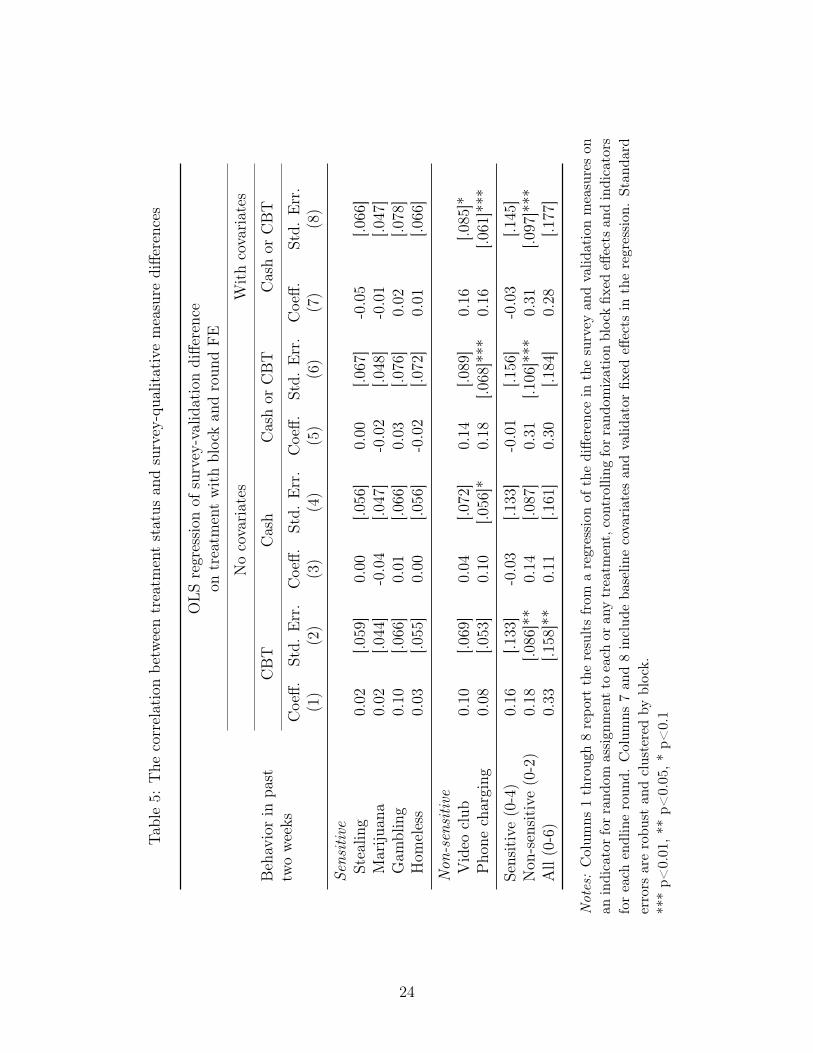
Fourth, we see little evidence of our proxy for measurement error being correlated with
treatment in any of the sensitive behaviors: stealing, marijuana, gambling, or homelessness.
Table 5 estimates equation 7 for each of our variables and indices. We regress our proxy
for survey over-reporting, y�, on treatment indictors (therapy only, cash only or either
treatment) controlling for block and survey round fixed effects (Columns 1 to 6) and validator
fixed effects and baseline covariates (Columns 7 and 8).13 The coefficients are all less than
or equal to 0.04 in absolute magnitude and not statistically significant. Since y� ⇡ 0 and
✓� ⇡ 0, there is little evidence of any systematic measurement error.
Fifth, the control group appears to underreport the two expenditure-related measures,
video club attendance and paying to charge a phone. The survey-validation difference in
Table 5, y�, is substantively and significantly correlated with both treatments. Combined,
an index of the two is significant at the 1% level, especially from the CBT treated groups.
The estimates in Column 7 imply that control group members are 16 percentage points less
likely to report phone charging or attending a video club than treated members, who appear
to report their activities without much evidence of error.
Discussion and conclusions
Our larger study required that we could accurately measure the prevalence of potentially
sensitive behaviors. Besides the usual worries of underreporting, we worried that this popu-
lation might have special reasons to conceal their behavior—such as suspicion of outsiders, or
a desire to receive programs in future. We were also concerned that a treatment designed to
reduce anti-social behaviors would also cause the treated to underreport them even further.
In the end, what we learned in the process of collecting the data, plus the final analysis,
suggests the measurement error is different than what we expected. First, we found no
evidence that the potentially sensitive behaviors are underreported. The mean levels of13Validators were not randomly assigned and in principal could introduce endogeneity bias if better val-
idators were assigned to harder cases. In general we don’t see reasons the endogeneity should be so strong,and such concerns might be outweighed by the desire to correct for individual-specific biases and skill.
25

the survey and qualitatively validated measures are similar, though they only agree roughly
three-quarters of the time. We can only speculate to the source of this measurement error, but
errors in recording or understanding (in both the survey and qualitative validation measures)
are the most likely candidates. That is, the measurement error looks largely classical.
Why do we see little survey-validation difference in potentially sensitive behaviors? One
possibility, of course, is that our shoe leather method did little to reduce the suspicion,
embarrassment, social desirability bias, or strategic desires to receive a program. While it
would be a stretch to think the shoe leather method got at the very “truth”, surely going
from asking a question in three seconds to spending several days of investigation yields a
more accurate result. Qualitatively, after observing the process, we judge it was the rapport,
the familiarity, and the skill of the Liberian validators, rather than the lengthy time spent,
that was most effective.
Based on our qualitative observation and discussions with the sample, our impression is
that these so-called “sensitive” behaviors, while not acceptable within Liberian society as a
whole, are not so sensitive or stigmatized that people feel ashamed to report them, at least in
this extreme population. One reason is that, relative to societal norms, smoking marijuana
or engaging in petty crime are commonplace in this setting and sample. A majority in the
sample do both. Moreover, the risk of punishment is minuscule. The Liberian police are
largely incapable of investigating and prosecuting all but the most grave crimes. Thus, these
behaviors are not endangering, embarrassing or socially undesirable to them and their peers,
and hence they discuss them freely.
Our second major findings is that the so-called “non-sensitive” expenditure-related activ-
ities were systematically underreported, and that this underreporting was concentrated in
the control group. This finding is admittedly more puzzling, but extremely important given
that expenditure and consumption survey are common and the basis of measuring material
well-being and poverty in most developing countries. We see two main possible explanations:
26
1. Strategic behavior. The control group is behaving strategically on the survey, trying
to appear poorer to encourage eligibility for future treatment. Phone charging and
going to a video club are considered discretionary spending (or even luxuries) and if
a respondent wanted to signal destitution, they might underreport spending on these
items. The control group could have a strategic incentive to behave more strategically.
We view this explanation as plausible, though there are caveats. First, the control
group did not over-report homelessness, which is an obvious indicator of need (although
perhaps observable enough that it was harder to falsify on a survey). Second, drug
use and gambling are also forms of expenditure, and these were not underreported to
signal poverty. Third, in principle those who received one of the earlier treatments also
had incentives to behave strategically in the hopes for future programs. Treated men
almost universally lobbied for additional assistance.
2. Recall bias. Expenditures could be more subject to more recall error, because they are
less regular and possibly less salient than drug use or crime. There is ample evidence
that consumption and expenditure data are underreported, and that underreporting
increases with the period of recall, the lower the reported consumption per standard-
ized unit of time, and the less salient the purchase (Deaton and Grosh, 1997; Ahmed
et al., 2006; Gibson, 2006; Beegle et al., 2012). People may also make cognitive er-
rors when aggregating over a construct such as “the last two weeks”. Finally, the
expenditures survey module was long and much more subject to fatigue, compounding
underreporting.
Recall bias is plausible, but we are looking for explanations that would correlate with
treatment. There are a few possibilities. Treatment could have increased attention
and mindfulness. The CBT treatment was explicitly designed to reduce impulsive
behavior and planning. There is some evidence that impulsivity improved (Blattman
et al., 2014). The cash transfer could have had a similar effect for different reasons.
27

Studies have also shown that recall bias in consumption data increases with poverty
(Beegle et al., 2012). This is consistent with evidence that cognition is taxed by poverty
and scarcity (Mani et al., 2013). Presumably hunger would affect survey fatigue and
mindfulness. The cash grant (and short run decrease in poverty) could have had a
similar effect on the margin. Finally, receiving either treatment could have produced
enough reciprocity that the treated exercised more care in recalling less salient data.
We regard these explanations with caution but cannot reject them.
Both explanations are plausible but come with caveats, and so we refrain from a firm con-
clusion about the sources of measurement error. What we see is that the method reveals
important and unexpected patterns. Replication of the method will generate more evidence
from more contexts and measures and inform our understanding of the general risk factors
for measurement error.
A fundamental principle of survey methodology is the importance of validating mea-
surements with multiple instruments. In a study designed to measure and change anti-social
behaviors and poverty, measurement error in either are serious causal identification concerns,
especially when there is the possibility of a correlation between measurement error and treat-
ment. List and endorsement experiments and other strategies will not always be feasible or
credible enough to satisfy, and when the stakes are high more in-depth approaches are impor-
tant tools to have available. This paper develops and reports the results of a new, in-depth,
qualitative approach to validating survey data through shoe leather. We hope to encourage
replication in other contexts and populations in order to assess its credibility more broadly
and to learn more about systematic error and the determinants of misreporting, especially
regarding sensitive behaviors such as crime and violence.
28

References
Ahmed, N., M. Brzozowski, and T. F. Crossley (2006). Measurement errors in recall food
consumption data. Technical report, IFS Working Papers, Institute for Fiscal Studies
(IFS).
Aronow, P. M., A. Coppock, and D. P. Green (2013). Combining list experiment and direct
question estimates of sensitive behavior prevalence. Working paper .
Asher, H. B. (1974, May). Some consequences of measurement error in survey data. Amer-
ican Journal of Political Science 18 (2), 469–485. ArticleType: research-article / Full
publication date: May, 1974 / Copyright c� 1974 Midwest Political Science Association.
Beegle, K., J. De Weerdt, J. Friedman, and J. Gibson (2012). Methods of household con-
sumption measurement through surveys: Experimental results from tanzania. Journal of
Development Economics 98, 3–18. 1.
Blair, G. and K. Imai (2012). Statistical analysis of list experiments. Political Analysis 20 (1),
47–77.
Blair, G., K. Imai, and J. Lyall (2014). Comparing and combining list and endorsement
experiments: Evidence from afghanistan. American Journal of Political Science.
Blattman, C., J. Jamison, and M. Sheridan (2014). Reducing youth poverty and violence:
Experimental evidence from unconditional cash transfers and behavior change with high-
risk men. Working paper .
Bound, J., C. Brown, and N. Mathiowetz (2001). Measurement error in survey data. In
Handbooks in Economics, Volume 2, pp. 3705–3843.
Bullock, W., K. Imai, and J. N. Shapiro (2011). Statistical analysis of endorsement ex-
periments: Measuring support for militant groups in pakistan. Political Analysis 19 (4),
363–384.
29

Corstange, D. (2009). Sensitive questions, truthful answers? modeling the list experiment
with LISTIT. Political Analysis 17 (1), 45–63.
Deaton, A. and M. Grosh (1997). Consumption. Designing Household Survey Questionnaires
for Developing Countries: Lessons from Ten Years of LSMS Experience.
Deming, D. J. (2011). Better schools, less crime? The Quarterly Journal of Eco-
nomics 126 (4), 2063–2115.
Freedman, D. A. (1991). Statistical models and shoe leather. Sociological methodology 21 (2),
291–313.
Gibson, J. (2006). Statistical tools and estimation methods for poverty measures based on
cross-sectional household surveys. Handbook on Poverty Statistics .
Hausman, J. (2001, October). Mismeasured variables in econometric analysis: Problems
from the right and problems from the left. The Journal of Economic Perspectives 15 (4),
57–67.
Imai, K. and T. Yamamoto (2010, April). Causal inference with differential measurement
error: Nonparametric identification and sensitivity analysis. American Journal of Political
Science 54 (2), 543–560.
Jamison, J. C., D. Karlan, and P. Raffler (2013). Mixed-method evaluation of a passive
mHealth sexual information texting service in uganda. Information Technologies & Inter-
national Development 9 (3).
Mani, A., S. Mullainathan, E. Shafir, and J. Zhao (2013). Poverty impedes cognitive function.
Science 341 (6149), 976–980.
Martinelli, C. and S. W. Parker (2009). Deception and misreporting in a social program.
Journal of the European Economic Association 7 (4), 886–908.
30
McKenzie, D. (2012). Beyond baseline and follow-up: The case for more t in experiments.
Journal of Development Economics 99 (2), 210–221.
NSSO Expert Group, (2003). Suitability of different reference periods for measuring house-
hold consumption. results in pilot survey. Economic and Political Weekly, 25–31.
Paluck, E. L. and D. P. Green (2009). Deference, dissent, and dispute resolution: An
experimental intervention using mass media to change norms and behavior in rwanda.
American Political Science Review 103, 622–644.
Raghavarao, D. and W. T. Federer (1979). Block total response as an alternative to the
randomized response method in surveys. Journal of the Royal Statistical Society. Series
B (Methodological), 40–45.
Scacco, A. (2010). Who riots? explaining individual participation in ethnic violence. Dis-
sertation, New York University .
Spitzer, R. L., K. Kroenke, and J. B. W. Williams (1999). Validation and utility of a self-
report version of PRIME-MD: the PHQ primary care study. Journal of the American
Medical Association 282 (18), 1737–1744.
31

Online Appendix to Measuring the measurement error
Christopher Blattman, Tricia Gonwa, Julian Jamison,
Katherine Rodrigues & Margaret Sheridan
A Randomization balance and survey attrition
In general, all randomizations display balance. Table A.1 reports an ordinary least squares
(OLS) regression of an indicator for random assignment on baseline variables and block fixed
effects (fixed effect coefficients not shown). At the base of the table we report the p-value
from an F-test of joint significance of all baseline covariates. Randomization block fixed
effects are correlated with treatment by construction, and are required for identification of
balance on baseline characteristics, and are omitted from the table and the F-test for this
reason. Columns 1 and 2 look at assignment to cash treatment, Columns 3 and 4 assignment
to the CBT treatment, and Columns 5 and 6 assignment to validation.
The baseline covariates are jointly not significant in predicting any treatment (Columns
1 to 4). A small number of baseline variables are individually statistically significant, but
no more than would be expected at random. In terms of selection into validation, selection
is not very systematic. The covariates (including fixed effects) explain just 13% of the
variation and the baseline covariates are jointly significant with a p-value of 0.095. 5 of
the 28 displayed baseline covariates (18%) have a p-value less than 0.1. Those selected into
validation are slightly less likely to be married, support slightly more women, are slightly
more likely to have been an ex-combatant, and slightly less likely to drink alcohol. There
are few substantively or statistically significant differences in the sensitive behaviors we are
interested in measuring and validating. Overall, selection seems relatively modest.
In addition, attrition appears to be relatively unsystematic. Table A.2 reports OLS
regression of an indicator for being unfound on baseline variables and block fixed effects
i

Table A.1: Randomization balance to treatments and to selection into validation
Dependent variable: Assigned to
Cash treatment CBT treatment Validation sample
Baseline variable Coeff. SE Coeff. SE Coeff. SE(1) (2) (3) (4) (5) (6)
Age 0.001 [.004] 0.000 [.004] 0.001 [.001]Married/living with partner -0.025 [.050] 0.022 [.049] -0.032 [.017]*# of women supported 0.007 [.027] -0.040 [.027] 0.032 [.010]***# children under 15 -0.007 [.006] -0.002 [.006] 0.000 [.002]Muslim -0.012 [.056] 0.074 [.055] 0.014 [.020]Years of schooling 0.002 [.006] -0.001 [.006] 0.001 [.002]Literacy score (0-2) -0.008 [.024] 0.020 [.024] 0.003 [.008]Math score (0-5) -0.008 [.012] -0.021 [.012]* -0.003 [.004]Health index (0-6) -0.006 [.012] 0.020 [.012]* -0.002 [.004]Disabled -0.073 [.064] 0.042 [.063] 0.007 [.019]Monthly cash earnings (USD) 0.000 [0000]* 0.000 [0000] 0.000 [0000]Durable assets index, z-score 0.035 [.019]* -0.012 [.019] -0.002 [.006]Savings stock (USD) 0.000 [0000] 0.000 [0000] 0.000 [0000]Able to get a loan of $300 -0.007 [.054] 0.017 [.054] 0.053 [.022]**Average weekly work hours in:Potentially illicit activities 0.000 [.001] 0.000 [.001] 0.000 [0000]Agricultural Labor -0.001 [.004] 0.006 [.004] 0.000 [.001]Low-skill wage labor 0.000 [.001] 0.000 [.001] 0.000 [0000]Low-skill business 0.001 [.001] 0.002 [.001]** 0.000 [0000]High-skill work 0.004 [.002]** 0.002 [.002] 0.000 [.001]
Ex-combatant 0.037 [.038] 0.011 [.038] 0.025 [.012]**Currently sleeping on the street -0.023 [.044] -0.032 [.043] -0.008 [.015]Times went hungry last week 0.015 [.012] 0.004 [.012] -0.002 [.004]Sells drugs -0.005 [.050] 0.017 [.049] -0.012 [.017]Drinks alcohol 0.035 [.039] 0.055 [.038] -0.027 [.013]**Uses marijuana daily 0.011 [.039] 0.038 [.038] 0.018 [.013]Uses hard drugs daily 0.067 [.052] -0.116 [.051]** -0.015 [.017]Stole in past two weeks -0.004 [.038] 0.030 [.037] -0.007 [.013]
Joint significance (p-value) 0.781 0.271 0.095R-squared 0.510 0.549 0.134Observations 999 999 2994
Notes: Columns 1 to 4 report the coefficient and standard error on each variable from an OLS regression ofa treatment indicator on all variables listed in the table plus block fixed effects. Columns 5 and 6 do thesame where the dependent variable is selection into validation. For assignment to treatment the sample isthe 999 men in the study. For the validation exercise it is the 4096 endline surveys run at various pointsin time, although because some rounds have none selected for validation we exclude these rounds and have2994 remaining. Each endline survey is a separate observation, and robust standard errors are clustered atthe individual level.*** p<0.01, ** p<0.05, * p<0.1
ii
(fixed effect coefficients not shown). At the base of the table we report the p-value from an
F-test of joint significance of all baseline covariates. Columns 1 and 2 look at attrition in the
endline survey (n=4096), and Columns 3 and 4 selection into the validation sample (n=297).
Each endline survey is a separate observation, and robust standard errors are clustered at
the individual level.
For the endline survey, attrition was just 8% on average across all endline survey rounds,
and this attrition appears to be unsystematic. Of the 144 men we could not survey, 2 had
died, 4 were incarcerated, 2 refused to answer the survey, and the remainder could simply
not be found despite repeated attempts over several weeks. From Columns 1 and 2, only 2 of
the 28 (7%) individual baseline covariates have a p-value below .1 and jointly the covariates
have a p-value of 0.53.
For the validation, only 3 of the 28 (10%) covariates have a p-value less than .1 and
jointly they have a p-value of .57. Attritors from validation are less educated and less
disabled. There are some covariates that show a substantive difference (e.g. attritors are 10
percentage points less likely to be hard drug users, and 9 percentage points more likely to
be homeless) but these are not statistically significant.
B Further details of validation methodology
The goal of this section is to expand on certain activities and aspects of the approach in
order to facilitate replication or adaption of the method.
Validator roles and responsibilities
The validation team was comprised of three main roles (in order of seniority): the Project
Coordinator, Team Leader, and Validator.
iii

Table A.2: Attrition from the endline survey and from validation
Dependent variable
Unfound at endline Unable to validate
Baseline variable Coeff. SE Coeff. SE(1) (2) (3) (4)
Age 0.000 [.001] 0.000 [.006]Married/living with partner -0.010 [.019] 0.043 [.070]# of women supported 0.002 [.009] 0.018 [.051]# children under 15 -0.003 [.002] -0.011 [.007]Muslim 0.081 [.029]*** -0.023 [.069]Years of schooling 0.001 [.002] -0.019 [.010]*Literacy score (0-2) 0.004 [.009] 0.044 [.038]Math score (0-5) 0.001 [.004] -0.012 [.018]Health index (0-6) -0.001 [.004] -0.016 [.018]Disabled 0.003 [.020] -0.133 [.075]*Monthly cash earnings (USD) 0.000 [0000] 0.000 [0000]Durable assets index, z-score 0.013 [.008] 0.040 [.030]Savings stock (USD) 0.000 [0000] 0.000 [0000]Able to get a loan of $300 -0.006 [.020] -0.051 [.075]Average weekly work hours in:Potentially illicit activities 0.000 [0000] 0.000 [.001]Agricultural Labor 0.000 [.001] -0.002 [.002]Low-skill wage labor 0.000 [0000] -0.002 [.001]**Low-skill business 0.000 [0000]** 0.000 [.001]High-skill work 0.000 [.001] 0.002 [.004]
Ex-combatant 0.002 [.013] -0.040 [.057]Currently sleeping on the street 0.002 [.016] 0.091 [.068]Times went hungry last week -0.002 [.005] -0.023 [.018]Sells drugs -0.010 [.016] 0.071 [.076]Drinks alcohol -0.012 [.015] -0.045 [.062]Uses marijuana daily -0.002 [.015] 0.000 [.059]Uses hard drugs daily -0.012 [.020] -0.096 [.077]Stole in past two weeks -0.005 [.014] 0.035 [.058]
Joint significance (p-value) 0.531 0.574R-squared 0.169 0.307Observations 4096 297
Notes: Columns 1 to 4 report the coefficient and standard error on each covariate from an OLS regressionof an attrition indicator on all covariates listed in the table plus block fixed effects. Each endline survey isa separate observation, and robust standard errors are clustered at the individual level.*** p<0.01, ** p<0.05, * p<0.1
iv

• The primary responsibilities of the Project Coordinator were to: (i) build an effective
team, including hiring and training, (ii) identify target respondents, (iii) supervise the
team leader and validators, and (iv) monitor field progress.
• The Team Leader was expected to perform all duties, functions, and responsibilities of
a qualitative researcher in addition to: (i) assisting with trainings, (ii) overseeing field
logistics, such as assigning validators to respondents, (iii) mentoring validators, as well
as (iv) monitoring and reporting on the team’s progress.
• Validators were principally responsible for the following duties: (i) locating respon-
dents, (ii) collecting and accurately recording data, and (iii) routinely communicating
progress to the Team Leader.
Validators underwent an intensive 10-day training, involving both classroom learning and
extensive field training, before being selected.14 The aim of the training was to develop
and refine trainees’ skills in acquiring informed consent, building rapport with respondents,
collecting and recording data, and analytical reasoning. Trainings were held for eight hours
each day and, over the course of 10 days, transitioned gradually from exclusive classroom
learning to field trainings with short debriefing sessions. Field trainings provided trainees
with opportunities to practice the skills and techniques they had learned.
During the initial three days of training, we introduced the validation exercise, obtain-
ing informed consent, developing trusting relationships with respondents, as well as data
collection and reporting. In the subsequent four days, we focused on analytical reason-
ing, providing logical evidence to support one’s conclusions, and field training. Validators
spent the final three days of training in the field, with short debriefing sessions to review
their performance. The last day of training culminated in a performance evaluation of each
trainee.14We trained more qualitative researchers than were needed for the exercise. Those who exhibited superior
performance during the trainings were selected as validators.
v

Logistical organization
Consent Process Validators obtained informed consent from each respondent prior to
commencing the first “hangout” session. Validators were provided with a consent script
which they recited to respondents by memory to maintain informality. During the consenting
process, study participants were advised of the research team’s interest in learning about
their lives. However, respondents were not informed of the precise data being collected.
This exercise was discussed in the formal consent process to the endline survey, however.
Strategies for assigning respondents Respondents were assigned based on their prox-
imity to the validators’ other assigned respondents or their workload distribution. Respon-
dents whom we had difficulty tracking or getting to answer the survey were often assigned
to one of the more experienced validators.
Coordination and communication The validators aimed to begin “hangout” sessions
the day after subjects completed their quantitative surveys, and to conduct all four visits
within 10 days of respondents having been surveyed. To facilitate coordination and com-
munication, validators were assigned to a survey team. The survey team would alert the
validator when the respondent was being surveyed. A validator would go to the location
where the respondent was being surveyed, the enumerator would introduce the respondent
to the validator if possible, and the validator would set up a time to meet with the R the
next day. This coordination and communication were essential and typically saved hours or
days of tracking.
Workflow management The Team Leader had several strategies for developing work
plans. For instance:
• Validators would try when possible to validate two people per day, though this was
not always possible because of tracking time.
vi

• Their work hours were flexible, and might include early mornings or evening visits.
• If a validator were assigned three respondents, he would rotate them, such that all four
visits with the three respondents were completed over the course of six days.
• If validators knew a particular respondent was difficult to locate, they would often begin
their day early trying to find him. If after a few hours they were not able to locate
him, they would have a “backup” respondent for the morning slot in mind (that is,
one they knew would be easy to locate). In this way, validators tried to make sure too
much time would not elapse between hangouts with “difficult-to-locate” respondents.
• Validators also needed time before and after their “hangout” sessions to locate respon-
dents and record collected data. Thus, if a validator were assigned three respondents,
she typically needed eight days to complete the entire exercise (one day for locating
respondents, six days for visiting with respondents, and one day for transferring her
field notes into the appropriate template).
Strategies Validators were provided with cell phones (and cell phone credit) to contact
respondents, each other, and the survey team. Petty cash for transportation to and from
hangout sessions was also given to validators on a weekly basis.
Since this population was largely transient, the use of tracking sheets (that specified the
whereabouts and contact information of respondents, their relatives and friends) proved cru-
cial. This form was used to locate subjects and was continuously updated as new information
became available. Validators also carried a small photograph of their assigned respondent in
order to identify him.15
Recording Data Finally, the Validators and Project Coordinator kept track of the hang-
out sessions completed each day and pertinent information about the validation sample (see15We obtained respondent consent for tracking photos. This photo was not shown to anyone outside of
the study team and was destroyed after meeting with the respondent.
vii

Appendix Figure 1 for the form used). This information was obtained from the Team Leader
during debriefing sessions at the end of each day, notes were added, and these were the basis
of the review process with the authors for case-by-case final coding.
viii

PARTID PARTID SDV Team Member SDV Team Member Activity Stealing Activity Marijuana
How did you bring up the subject?1- Ask him a direct question2- Ask him an indirect question3- Gave a story/scenario4- You saw him do it5- You saw proof that he does it6 - Other
[JUST ENTER THE NUMBER]
How did you bring up the subject?1- Ask him a direct question2- Ask him an indirect question3- Gave a story/scenario4- You saw him do it5- You saw proof that he does it6 - Other
[JUST ENTER THE NUMBER]
How did you bring up the subject? [DESCRIBE]
How did you bring up the subject? [DESCRIBE]
What do you know about the respondent and this activity?
1- He never does it2- He can do it sometimes3- He can do it one one time4- He can do it daily5- Other
[JUST ENTER THE NUMBER]
What do you know about the respondent and this activity?
1- He never does it2- He can do it sometimes3- He can do it one one time4- He can do it daily5- Other
[JUST ENTER THE NUMBER]
What do you know about the respondent and this activity?
[DESCRIBE]
What do you know about the respondent and this activity?
[DESCRIBE]
Has the respondent done it IN THE 2 WEEKS BEFORE THE SURVEY?
1- Yes, 0- No
[JUST ENTER THE 1 OR 0 ]
Has the respondent done it IN THE 2 WEEKS BEFORE THE SURVEY?
1- Yes, 0- No
[JUST ENTER THE 1 OR 0 ]
What are the reasons you have to believe this is true?
[ONLY ADD NEW INFORMATION, DON’T REPEAT INFORMATION]
What are the reasons you have to believe this is true?
[ONLY ADD NEW INFORMATION, DON’T REPEAT INFORMATION]

PARTID PARTID SDV Team Member SDV Team Member Activity Homelessness Activity Gambling
How did you bring up the subject?1- Ask him a direct question2- Ask him an indirect question3- Gave a story/scenario4- You saw him do it5- You saw proof that he does it6 - Other
[JUST ENTER THE NUMBER]
How did you bring up the subject?1- Ask him a direct question2- Ask him an indirect question3- Gave a story/scenario4- You saw him do it5- You saw proof that he does it6 - Other
[JUST ENTER THE NUMBER]
How did you bring up the subject? [DESCRIBE]
How did you bring up the subject? [DESCRIBE]
What do you know about the respondent and this activity?
1- He never does it2- He can do it sometimes3- He can do it one one time4- He can do it daily5- Other
[JUST ENTER THE NUMBER]
What do you know about the respondent and this activity?
1- He never does it2- He can do it sometimes3- He can do it one one time4- He can do it daily5- Other
[JUST ENTER THE NUMBER]
What do you know about the respondent and this activity?
[DESCRIBE]
What do you know about the respondent and this activity?
[DESCRIBE]
Has the respondent done it IN THE 2 WEEKS BEFORE THE SURVEY?
1- Yes, 0- No
[JUST ENTER THE 1 OR 0 ]
Has the respondent done it IN THE 2 WEEKS BEFORE THE SURVEY?
1- Yes, 0- No
[JUST ENTER THE 1 OR 0 ]
What are the reasons you have to believe this is true?
[ONLY ADD NEW INFORMATION, DON’T REPEAT INFORMATION]
What are the reasons you have to believe this is true?
[ONLY ADD NEW INFORMATION, DON’T REPEAT INFORMATION]

PARTID PARTID SDV Team Member SDV Team Member Activity Phones Charging Activity Video Club
How did you bring up the subject?1- Ask him a direct question2- Ask him an indirect question3- Gave a story/scenario4- You saw him do it5- You saw proof that he does it6 - Other
[JUST ENTER THE NUMBER]
How did you bring up the subject?1- Ask him a direct question2- Ask him an indirect question3- Gave a story/scenario4- You saw him do it5- You saw proof that he does it6 - Other
[JUST ENTER THE NUMBER]
How did you bring up the subject? [DESCRIBE]
How did you bring up the subject? [DESCRIBE]
What do you know about the respondent and this activity?
1- He never does it2- He can do it sometimes3- He can do it one one time4- He can do it daily5- Other
[JUST ENTER THE NUMBER]
What do you know about the respondent and this activity?
1- He never does it2- He can do it sometimes3- He can do it one one time4- He can do it daily5- Other
[JUST ENTER THE NUMBER]
What do you know about the respondent and this activity?
[DESCRIBE]
What do you know about the respondent and this activity?
[DESCRIBE]
Has the respondent done it IN THE 2 WEEKS BEFORE THE SURVEY?
1- Yes, 0- No
[JUST ENTER THE 1 OR 0 ]
Has the respondent done it IN THE 2 WEEKS BEFORE THE SURVEY?
1- Yes, 0- No
[JUST ENTER THE 1 OR 0 ]
What are the reasons you have to believe this is true?
[ONLY ADD NEW INFORMATION, DON’T REPEAT INFORMATION]
What are the reasons you have to believe this is true?
[ONLY ADD NEW INFORMATION, DON’T REPEAT INFORMATION]