measuring the performance of antimicrobial stewardship ... · pdf file56 part i —...
TRANSCRIPT
54
Part
I —
Mea
suri
ng th
e pe
rfor
man
ce o
f ant
imic
robi
al s
tew
ards
hip
prog
ram
s
5 Measuring the performance of antimicrobial stewardship programs
Authors: David Looke and Margaret Duguid
5.1 Key points
• Monitoring and analysis of antimicrobial usage is critical to understanding antimicrobial resistance and measuring the effects of stewardship interventions.
• Continuous surveillance of the appropriateness of antimicrobial prescribing should be the ultimate aim of any stewardship program.
• Reporting and analysis of ward and hospital antimicrobial usage data is useful in monitoring trends and identifying areas for evaluating appropriateness of prescribing.
• Process and outcome measures are an integral part of any quality improvement program and should be incorporated into the hospital’s antimicrobial stewardship plan.
• Process indicators can be used to target and evaluate initiatives to improve prescribing. Providing timely feedback in a format that can be interpreted and used by clinicians is important.
• The introduction of an individual patient electronic medical record linked with electronic prescribing and medication management systems will improve surveillance of antimicrobial usage and appropriateness of prescribing, and enable more efficient targeting of interventions.
55
5.2 Recommendations
5.2.1 Antimicrobial usage data is collected and regularly reviewed to identify areas for improvement.
5.2.2 Quality indicators are monitored to assess appropriate prescribing practice and compliance with policy.
5.2.3 Information technology resources are available for:
» monitoring antimicrobial usage
» auditing process indicators
» measuring outcomes of the antimicrobial stewardship program.
5.2.4 Antimicrobial usage data is interpreted together with infection control and antimicrobial resistance data.
5.3 Assessing antimicrobial stewardship activities Successful antimicrobial stewardship (AMS) programs include all the elements of successful quality improvement programs and measuring the effectiveness of program activities is a key component. In AMS programs, this usually includes measuring antimicrobial use, auditing the quality of prescribing, and monitoring process and outcome indicators. The information can then be used to provide feedback to prescribers, and inform the AMS team and drug and therapeutics committee of the effect of stewardship initiatives on antimicrobial use and resistance patterns. This chapter focuses on aspects of the effective use of surveillance data in stewardship programs, and reviews the use of process and outcome indicators to assist with targeting initiatives to improve prescribing. A detailed discussion on using quality improvement strategies to implement effective AMS is presented in Chapter 1.
Hospital administrative support for the infrastructure (including information systems) required to measure and monitor antimicrobial use and the outcomes of AMS interventions is considered essential to the success of an AMS program.1
56
Part
I —
Mea
suri
ng th
e pe
rfor
man
ce o
f ant
imic
robi
al s
tew
ards
hip
prog
ram
s
Antimicrobial stewardship in Australian hospitals
5.4 Effective use of surveillance data in stewardship programs Effectiveness of prescribing can be measured by the quantity of agents prescribed and by the quality of the prescribing (i.e. appropriateness for a given indication). Continuous prospective monitoring of the appropriateness of antimicrobial prescribing should be the ultimate aim of any stewardship program. However, this requires real-time knowledge of:
• the provisional and confirmed diagnosis of every patient
• patients’ underlying co-morbidities
• the agent (or agents) prescribed, including details such as dose, duration and route
• the outcome of treatment.
Ideally, these data would be collected electronically; however, this is not possible with the information systems now available in Australia. Currently, this form of prospective surveillance is only possible using highly trained clinicians to review individual charts, which is a time-consuming and resource-intensive task. This type of review is often completed as a ‘snapshot’ survey or point prevalence study and is discussed in detail in Section 5.6.1.
A comprehensive review of current local and international surveillance systems for antimicrobial use was published by Duguid et al.25 (see Appendix 1). The review addresses the reasons for monitoring antimicrobial use data, methods of surveillance (measurement, definitions and reporting), and existing Australian and international surveillance systems. Information from the review is not repeated in this chapter and it is recommended that Appendix 1 is read in conjunction with this chapter.
5.5 Measuring the volume of antimicrobial usageTo standardise the quantification of antimicrobial use and allow comparisons over time or between units and hospitals, it is recommended that drug use data are expressed as defined daily dose (DDD) per 1000 occupied bed-days.1, 87-88 Because DDDs are based on adult dosing, these measurements are not suitable for determining antimicrobial use in paediatric units. Use is usually reported by antimicrobial type or class using the anatomical therapeutic chemical (ATC) classification.
Another measure used to monitor the volume of antimicrobial use is the prescribed daily dose. The prescribed daily dose is calculated by dividing the total grams of the antimicrobial agent used by the number of grams in a locally used average daily dose of the agent given to an adult patient. Prescribed daily dose is a measurement of the number of patient days that treatment has been given, whereas DDD is a measurement of total amount of antimicrobial used. Both measures can be derived from pharmacy data (see Section 5.5.1 below). Both are useful for monitoring usage. Refer to Appendix 1 for further information on surveillance methods.
57Measuring the performance of antimicrobial stewardship programs
5.5.1 Reporting and monitoring usage data at a local level
Information on antimicrobial use is generally available from hospital pharmacy information systems. Data on inpatient use is obtained from the volume of ward stock issued combined with individual patient issues. It may be reported monthly, quarterly or annually, preferably as DDDs. Ward stock use is not generally linked to individual prescribers, so the data are purely measures of the volume of medicines prescribed in a given time. These data can be reported as whole-of-hospital data or broken down into individual ward or division information. Specific antimicrobials or antimicrobial groups can be targeted or total antimicrobial consumption measured. Although expenditure data have severe limitations, since costs are affected by purchase contracts, formulary changes and variations in ordering patterns, they can be helpful to identify where dollars are being spent15 and to track any savings from stewardship activities.
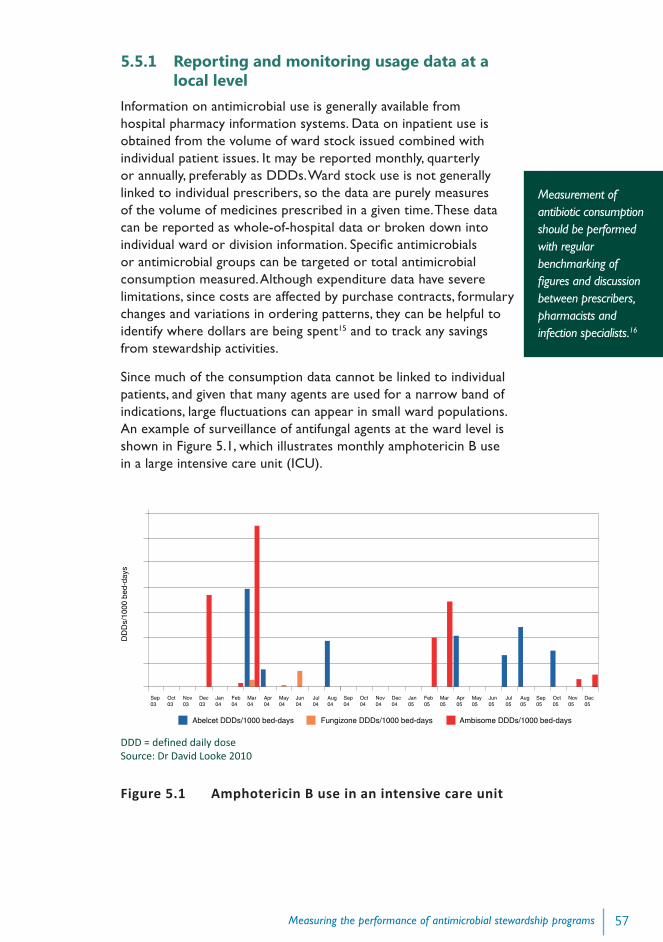
Since much of the consumption data cannot be linked to individual patients, and given that many agents are used for a narrow band of indications, large fluctuations can appear in small ward populations. An example of surveillance of antifungal agents at the ward level is shown in Figure 5.1, which illustrates monthly amphotericin B use in a large intensive care unit (ICU).
DDD = defined daily dose Source: Dr David Looke 2010
Figure 5.1 Amphotericin B use in an intensive care unit
Measurement of antibiotic consumption should be performed with regular benchmarking of figures and discussion between prescribers, pharmacists and infection specialists.16
Sep03
Oct03
Nov03
Dec03
Jan04
Feb04
Mar04
Apr04
May04
Jun04
Jul04
Aug04
Sep04
Oct04
Nov04
Dec04
Jan05
Feb05
Mar05
Apr05
May05
Jun05
Jul05
Aug05
Sep05
Oct05
Nov05
Dec05
Abelcet DDDs/1000 bed-days Fungizone DDDs/1000 bed-days Ambisome DDDs/1000 bed-days
DD
Ds/
1000
bed
-day
s
58
Part
I —
Mea
suri
ng th
e pe
rfor
man
ce o
f ant
imic
robi
al s
tew
ards
hip
prog
ram
s
Antimicrobial stewardship in Australian hospitals
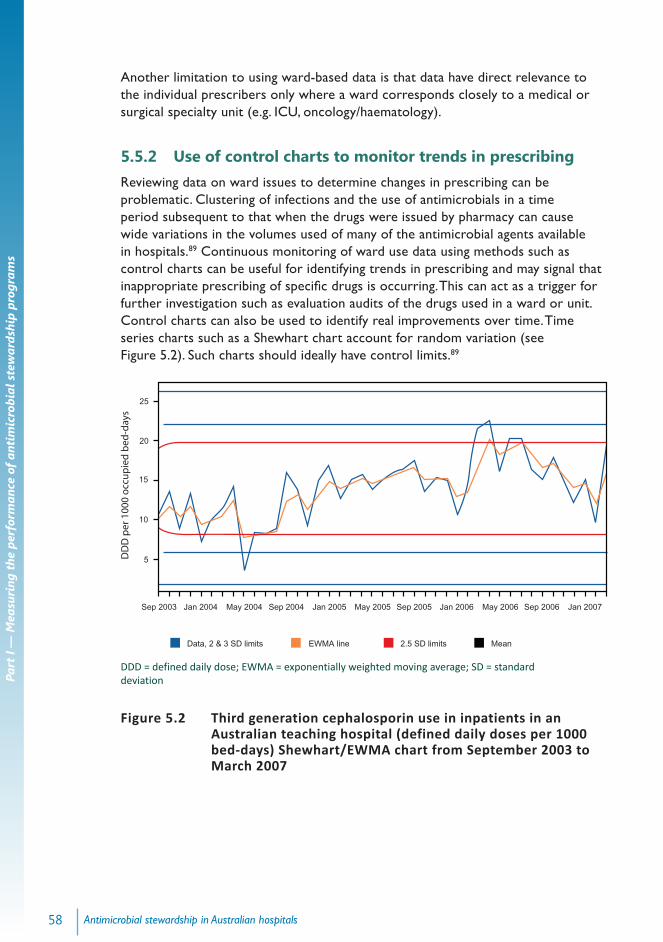
Another limitation to using ward-based data is that data have direct relevance to the individual prescribers only where a ward corresponds closely to a medical or surgical specialty unit (e.g. ICU, oncology/haematology).
5.5.2 Use of control charts to monitor trends in prescribingReviewing data on ward issues to determine changes in prescribing can be problematic. Clustering of infections and the use of antimicrobials in a time period subsequent to that when the drugs were issued by pharmacy can cause wide variations in the volumes used of many of the antimicrobial agents available in hospitals.89 Continuous monitoring of ward use data using methods such as control charts can be useful for identifying trends in prescribing and may signal that inappropriate prescribing of specific drugs is occurring. This can act as a trigger for further investigation such as evaluation audits of the drugs used in a ward or unit. Control charts can also be used to identify real improvements over time. Time series charts such as a Shewhart chart account for random variation (see Figure 5.2). Such charts should ideally have control limits.89
DDD = defined daily dose; EWMA = exponentially weighted moving average; SD = standard deviation
Figure 5.2 Third generation cephalosporin use in inpatients in an Australian teaching hospital (defined daily doses per 1000 bed-days) Shewhart/EWMA chart from September 2003 to March 2007
Sep 2003 Jan 2004 May 2004 Sep 2004 Jan 2005 May 2005 Sep 2005 Jan 2006 May 2006 Sep 2006 Jan 2007
5
10
15
20
25
Data, 2 & 3 SD limits EWMA line 2.5 SD limits Mean
DD
D p
er 1
000
occ
up
ied
bed
-day
s
59Measuring the performance of antimicrobial stewardship programs
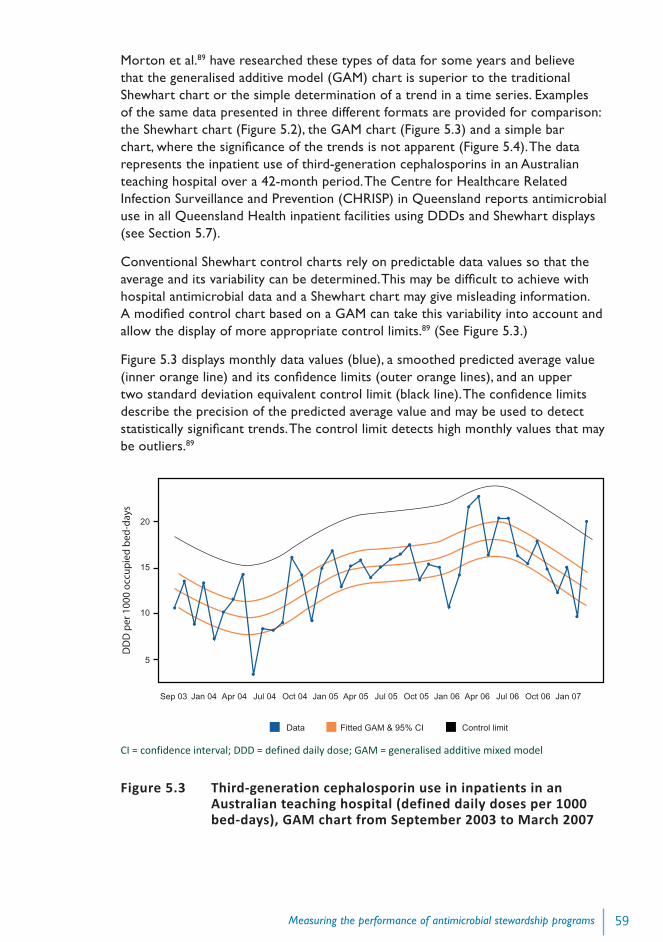
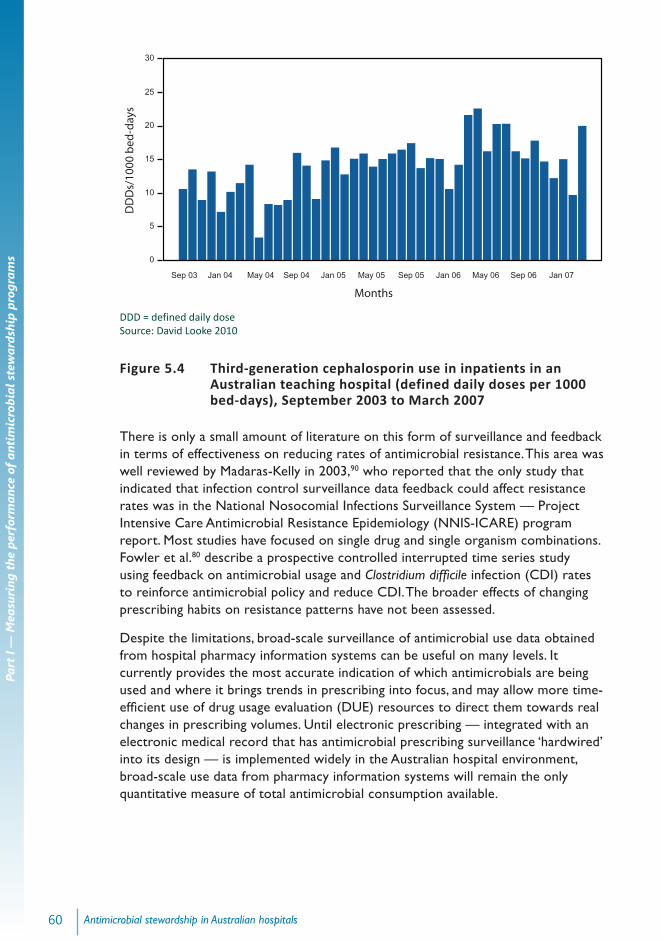
Morton et al.89 have researched these types of data for some years and believe that the generalised additive model (GAM) chart is superior to the traditional Shewhart chart or the simple determination of a trend in a time series. Examples of the same data presented in three different formats are provided for comparison: the Shewhart chart (Figure 5.2), the GAM chart (Figure 5.3) and a simple bar chart, where the significance of the trends is not apparent (Figure 5.4). The data represents the inpatient use of third-generation cephalosporins in an Australian teaching hospital over a 42-month period. The Centre for Healthcare Related Infection Surveillance and Prevention (CHRISP) in Queensland reports antimicrobial use in all Queensland Health inpatient facilities using DDDs and Shewhart displays (see Section 5.7).
Conventional Shewhart control charts rely on predictable data values so that the average and its variability can be determined. This may be difficult to achieve with hospital antimicrobial data and a Shewhart chart may give misleading information. A modified control chart based on a GAM can take this variability into account and allow the display of more appropriate control limits.89 (See Figure 5.3.)
Figure 5.3 displays monthly data values (blue), a smoothed predicted average value (inner orange line) and its confidence limits (outer orange lines), and an upper two standard deviation equivalent control limit (black line). The confidence limits describe the precision of the predicted average value and may be used to detect statistically significant trends. The control limit detects high monthly values that may be outliers.89
CI = confidence interval; DDD = defined daily dose; GAM = generalised additive mixed model
Figure 5.3 Third-generation cephalosporin use in inpatients in an Australian teaching hospital (defined daily doses per 1000 bed-days), GAM chart from September 2003 to March 2007
20
15
10
5
Sep 03 Jan 04 Apr 04 Jul 04 Oct 04 Jan 05 Apr 05 Jul 05 Oct 05 Jan 06 Apr 06 Jul 06 Oct 06 Jan 07
DD
D p
er 1
000
occ
up
ied
bed
-day
s
Data Fitted GAM & 95% CI Control limit
60
Part
I —
Mea
suri
ng th
e pe
rfor
man
ce o
f ant
imic
robi
al s
tew
ards
hip
prog
ram
s
Antimicrobial stewardship in Australian hospitals
DDD = defined daily dose Source: David Looke 2010
Figure 5.4 Third-generation cephalosporin use in inpatients in an Australian teaching hospital (defined daily doses per 1000 bed-days), September 2003 to March 2007
There is only a small amount of literature on this form of surveillance and feedback in terms of effectiveness on reducing rates of antimicrobial resistance. This area was well reviewed by Madaras-Kelly in 2003,90 who reported that the only study that indicated that infection control surveillance data feedback could affect resistance rates was in the National Nosocomial Infections Surveillance System — Project Intensive Care Antimicrobial Resistance Epidemiology (NNIS-ICARE) program report. Most studies have focused on single drug and single organism combinations. Fowler et al.80 describe a prospective controlled interrupted time series study using feedback on antimicrobial usage and Clostridium difficile infection (CDI) rates to reinforce antimicrobial policy and reduce CDI. The broader effects of changing prescribing habits on resistance patterns have not been assessed.
Despite the limitations, broad-scale surveillance of antimicrobial use data obtained from hospital pharmacy information systems can be useful on many levels. It currently provides the most accurate indication of which antimicrobials are being used and where it brings trends in prescribing into focus, and may allow more time-efficient use of drug usage evaluation (DUE) resources to direct them towards real changes in prescribing volumes. Until electronic prescribing — integrated with an electronic medical record that has antimicrobial prescribing surveillance ‘hardwired’ into its design — is implemented widely in the Australian hospital environment, broad-scale use data from pharmacy information systems will remain the only quantitative measure of total antimicrobial consumption available.
15
10
5
0
20
25
30
Sep 03 Jan 04 May 04 Sep 04 Jan 05 May 05 Sep 05 Jan 06 May 06 Sep 06 Jan 07
Months
DD
Ds/
1000
bed
-day
s
61Measuring the performance of antimicrobial stewardship programs
5.6 Measuring the quality of antimicrobial usageContinuous prospective monitoring of the appropriateness of antimicrobial prescribing should be the ultimate aim of any stewardship program. Measurements of the quality of prescribing can provide assurance that the most effective therapy is being given, and the risk of poor outcomes, including antimicrobial-related adverse events, is being reduced.
In the absence of electronic systems to efficiently report data, the appropriateness of prescribing is usually measured by reviewing patient notes, using prevalence surveys such as ‘snapshots’ of elements of antimicrobial prescribing in a healthcare facility or clinical audit as part of a DUE program.3–4, 50, 88, 91–92 Data from these surveys can be used by the AMS team and drug and therapeutics committee to monitor the effectiveness of an intervention and as part of educational activities to influence prescribing behaviour.
5.6.1 Prevalence surveysPrevalence surveys are an effective tool to improve the quality of antimicrobial prescribing. They allow problem areas to be targeted and enable more intensive audits, leading to further interventions to improve prescribing. They are also useful for measuring the effects of interventions. Such surveys are most useful when repeated at regular intervals.
Point prevalence or ‘snapshot’ surveys
Point prevalence or ‘snapshot’ surveys have the advantage of being resource-efficient; however, they can only provide feedback on limited elements of prescribing in the facility and may not consistently reflect practice within a unit or hospital.91 Point prevalence surveys are done at a single site on a single day. The data are often collected from one data source — the medication chart. The type of information provided by these surveys may include the percentage of patients prescribed antimicrobials, the range and volume of agents prescribed, percentage of ‘restricted’ antimicrobials prescribed, number of antimicrobials per patient, duration of therapy, dosing and dosage interval, and time for intravenous-to-oral switching.3-4, 88 Prophylactic use can be assessed by reviewing surgical patients who were prescribed antimicrobials in the previous 24 hours.
Linking survey information with clinical data gathered from other sources (such as indication, prophylaxis or treatment, nature and severity of the infection and details of antimicrobial therapy received) can enable a better assessment of the appropriateness of prescribing, including prescribing in accordance with clinical guidelines.88 However, this type of survey is more resource-intensive.
Serial point prevalence studies conducted at regular intervals are a practical method for studying hospital antimicrobial use in the absence of computerised prescribing. They provide hospitals with baseline information on current antimicrobial usage from which specific targets for intervention can be identified and evaluated
62
Part
I —
Mea
suri
ng th
e pe
rfor
man
ce o
f ant
imic
robi
al s
tew
ards
hip
prog
ram
s
Antimicrobial stewardship in Australian hospitals
in subsequent audits. Dean et al. describe a series of three standardised point prevalence studies that used pharmacists to collect the data on all patients prescribed systemic antimicrobials admitted to four hospitals.92 They found the data collection method reliable and suggest one or two point prevalence studies a year sufficient to provide ongoing monitoring of antimicrobial use.
Willemsen et al.4 performed point prevalence surveys on all inpatients in a large teaching hospital in the Netherlands, assessing antimicrobial prescribing and analysing appropriateness judged against current institutional guidelines. They also identified patients who did not receive antimicrobial therapy even though it was indicated. Six consecutive one-day surveys were conducted at six-monthly intervals over a three-year period, using infection control practitioners to collect data from medical and nursing records. Data were used to identify and measure the effects of interventions to improve antimicrobial use.
Clinical pharmacists are ideal personnel to collect data, with a stewardship pharmacist coordinating data collection,88 and infectious diseases physicians or clinical microbiologists involved with assessment of appropriateness.91
Point prevalence surveys can be used to measure and compare antimicrobial use in multiple sites — the data can be used to inform local and national audits and support prescribing initiatives.91
5.6.2 Audit and feedbackThe use of audit and feedback in stewardship quality improvement programs, including DUE studies, is further discussed in Section 3.6.2. Auditing adherence to antimicrobial policies and guidelines are fundamental activities in any AMS program. Examples of the types of audits that may be considered include:
• reviews of drug charts, with antimicrobial prescriptions assessed according to predetermined criteria of appropriateness
• chart reviews of treatment of selected infectious diseases, identified by positive microbiological tests
• reviews of ‘restricted drugs’ to ensure that proper approval processes have been followed (the use of electronic approval systems described in Chapter 2 facilitates these exercises).
5.7 Reporting and use of data at state and national levelsIn Australia, there is some state and territory-wide reporting on antimicrobial drug use, and more recently some national reporting through the National Antimicrobial Utilisation Surveillance Program (NAUSP), originating in South Australia.
South Australia and Queensland have state-based programs that collect and report on in-hospital antimicrobial use data. In South Australia, hospitals contributing data receive monthly reports detailing antimicrobial use density rates in the form of
63Measuring the performance of antimicrobial stewardship programs
time series graphs, including specific use rates for ICUs. Corresponding state-wide aggregate reports are supplied for comparison and are publicly available. CHRISP in Queensland has initiated standardised reporting of antibiotic use in all Queensland Health inpatient facilities using DDDs and Shewhart displays. The data are reviewed twice a year by the Queensland Health Medicines Advisory Committee and are used to direct antimicrobial use evaluation projects.
At a national level, NAUSP collects aggregate data from hospitals in all Australian states and territories. The program currently collects data from 29 major public and 2 private hospitals, representing approximately 60% of Australian tertiary referral beds. Separate usage rates are currently reported for ICUs. Contributing hospitals receive bimonthly reports of hospital inpatient antimicrobial usage, reported as ICU and non-ICU usage. Corresponding ‘national’ rates, calculated from aggregate data, are included for comparison. Further information on NAUSP is provided in Appendix 1, Section A1.6.2.
At a local level, data from these programs can be used to monitor the effect of AMS activities on drug use and to benchmark ICU and non-ICU use data against peer hospitals (see Case study 2 in Appendix 1). These systems and other national surveillance programs are reviewed extensively in Appendix 1.
Using larger scale reporting systems to draw comparisons across hospitals, areas, states and territories, or even countries has potential problems. Case-mix and regional variations in the incidence of particular infectious diseases or antimicrobial resistance can confound the results. Kuster et al.93 attempted to correlate antimicrobial consumption with a case-mix index across a group of hospitals in Switzerland. They found that a significant correlation existed and suggested that case-mix distribution should be taken into account when analysing large sets of antimicrobial use data. Kritsotakis et al.94 attempted stratification of surveillance data by ward type in an effort to reduce confounding by patient mix. Although this was useful to the individual facility in indicating trends, there were major problems with comparisons between facilities.
This type of surveillance is useful for monitoring fluctuations and trends over time — statistically significant increases or decreases in use can be investigated to determine whether or not they are evidence of inappropriate prescribing.
5.8 Process and outcome measures of stewardship activitiesProcess and outcome measures of antimicrobial policies should be audited.16
5.8.1 Process measuresPerformance measurement is an integral part of the quality improvement cycle and a number of indicators for appropriate antimicrobial prescribing have been reported in the literature. These are predominately process indicators such as rates of adherence to guidelines, appropriateness and timeliness of therapy for a given infection, advice acceptance rates and rates of concordance with susceptibility
64
Part
I —
Mea
suri
ng th
e pe
rfor
man
ce o
f ant
imic
robi
al s
tew
ards
hip
prog
ram
s
Antimicrobial stewardship in Australian hospitals
reporting.17, 23, 35, 95 Measurement of these rates may occur as an intermittent audit — as part of the evaluation of a stewardship intervention — rather than as ongoing continuous surveillance. When instituted as regular cycled audits and reported as indicators (sometimes termed key performance indicators or KPIs) they can be useful instruments to maintain prescribing performance at an appropriate high level.
Feedback in a format that can be interpreted and used by clinicians is important. Indicator results may be presented dynamically in the form of run charts or control charts (with control limits) as this allows clinicians (and stewardship team members) to assess whether the process is stable and identify real improvements over time.95
A limitation of indicators is that organisations may focus their efforts on only one aspect of performance to the detriment of others, leading to the ‘gaming’ of results.96 This applies particularly to publicly reported measures. Unexpected consequences include the skewing of treatment priorities and the promotion of unnecessary antimicrobial use.97 Wachter et al. suggest that key end users need to be involved in the development of KPIs and the assessment of validity, reliability, impact and costs should occur within one to two years of implementing quality measurement and reporting programs.97
Nathwani et al.87 reviewed the development of indicators for antimicrobial control programs and concluded that potential indicators should be prioritised to maximise cost-effectiveness and be multidisciplinary in their development to ensure ownership by relevant clinical groups. A quality indicator for glycopeptide prescribing was cited as an example. Cooke and Dean77 described a similar indicator for glycopeptide prescribing and showed that a simple audit tool for vancomycin prescribing uncovered a substantial number of problems with the prescribing of glycopeptides.
The NSW Therapeutic Advisory Group has published a compendium of indicators95 for the quality use of medicines in Australian hospitals. They include indicators relating to antimicrobial prescribing, such as the percentage of:
• patients undergoing specified surgical procedures that receive an appropriate prophylactic antibiotic regimen
• prescriptions for restricted antibiotics that are concordant with drug and therapeutics committee approved criteria
• patients with a toxic or subtherapeutic aminoglycoside concentration whose dosage has been adjusted or reviewed prior to the next aminoglycoside dose
• patients presenting with community acquired pneumonia that are prescribed guideline concordant antimicrobial therapy.
Other important indicators to measure are the time to first antimicrobial dose, such as in patients presenting to hospital with bacterial meningitis or severe sepsis.
65Measuring the performance of antimicrobial stewardship programs
5.8.2 Outcome indicatorsIn addition to using process measures, Dellit et al.1 also recommend using outcome measures to determine the impact of AMS on antimicrobial use and resistance patterns (i.e. did the process implemented reduce or prevent resistance or other unintended consequences of antimicrobial use?).
Clinical outcome measures such as mortality, readmission rates and length of hospital stay may be too indirectly related to appropriate antimicrobial prescribing to be an accurate reflection of the performance of AMS programs. However, a reduction in bacterial resistance and a decrease in CDI infection are proposed as key metrics to consider when evaluating the effect of AMS.37 Further evidence attesting the success of using such outcome measurements is awaited.