measuring the predictability of
TRANSCRIPT


2
Measuring the Predictability of Istation’s Indicators of Progress Scores on Students’ Virginia Standards of Learning (SOL) Scores
The following report has been prepared for Istation. The report is a predictability study of the
Istation’s Indicators of Progress Early (ISIP-ER) and Advanced Reading (ISIP-AR) scores to
students’ Virginia Reading Standards of Learning (SOL) scores. Included in this report are charts,
tables, and figures demonstrating the predictability of the ISIP-ER and ISIP-AR scores on SOL
scores with a sample of student data (N = 4,033). The data in this report does not identify
individual districts, schools, or students.
University of Central Florida Research Team Members:
Principal Investigator: Laurie O. Campbell, Ed.D., Assistant Professor
Co-Principal Investigator:
Glenn W. Lambie, Ph.D., Professor and Associate Dean Postdoctoral Scholar:
Claudia C. Sutter, Ph.D., Postdoctoral Scholar
Contact Information: Address: Dr. Laurie O. Campbell Morgridge International Reading Center University of Central Florida 4143 Andromeda Loop Orlando, FL 32816
Acknowledgements: Jaimie Stickl Haughen, Stacy Watkins Escobedo, Eric D. LaGuardia, and Breahannah Hilaire for their copy editing and Darleen Block (cover). Citation: Campbell, L. O., Sutter, C. C, & Lambie, G. W. (2019). Predictability of Istation’s Indicators of Progress Scores on Students’ Virginia Standard of Learning Scores: Grades 3 through 8.

3
Abstract The study provides evidence that Istation’s Indicators of Progress (ISIP) Reading cut scores can
predict the Virginia Standards of Learning (SOL) examination scores for all achievement levels
among 3rd- to 8th-grade students. The study examined the ISIP Overall Reading and
Comprehension scores and the Reading SOL scores for 3rd through 8th grade students. All data
came from one county in the Commonwealth of Virginia and was collected during the 2018-
2019 school year. A simple linear regression analysis was conducted to determine the
correlation of the Reading SOL Scaled Scores and the ISIP-ER and ISIP-AR Overall Reading
scores, between R2 = .219 and .561 (between 21.9% and 56.1% of the variance explained), and
comprehension scores between R2 = .251 and R2 = .523 (between 25.1% and 52.3% of the
variance explained). Therefore, the ISIP-ER and ISIP-AR scaled scores had a strong positive
correlation to the SOL scores. Predictability “bands” were computed to identify the ISIP-ER and
ISIP-AR cut scores that predict Reading SOL scores for all achievement levels.

4
Table of Contents
Abstract . . . . . . . 3
Introduction . . . . . . . 5
Literature . . . . . . . 6
Methodology . . . . . . . 8
Analysis . . . . . . . 9
Conclusion . . . . . . . 20
References . . . . . . . 22
Appendix . . . . . . . 24
Tables:
Table 1: Reading SOL Test Interpretation 8
Table 2: Frequency of Academic Level by Grade 9
Table 3: Descriptive Statistics of the Assessment Scores 10
Table 4: Pearson Product-Moment Correlation Coefficients and Effect Size 11
Table 5: ISIP-ER Overall Score Prediction Bands for the Reading SOL Test - Grade 3 17
Table 6 ISIP-AR Overall Score Prediction Bands for the Reading SOL Test - Upper Elementary 18
Table 7 ISIP-AR Prediction Bands for the Reading SOL Test - Middle School Grades 6-8 19

5
Introduction
The purpose of this study is to determine (a) the predictability of Istation’s Indicators of
Progress Early Reading (ISIP-ER) and Advanced Reading (ISIP-AR) Overall scaled scores and
Reading Comprehension subtest scores related to the Virginia Standards of Learning
Assessments (SOL) reading scores; and (b) the cut scores of the ISIP-ER and ISIP-AR and the SOL
based on students’ achievement level. Obtaining the predictability of a curriculum-based
measure like ISIP-ER and ISIP-AR scores on a high-stakes assessment like the SOL can provide
early awareness of students’ yearly progress towards reaching expected state standards (Miller,
Bell, & McCallum, 2015). Further, ISIP-ER and ISIP-AR can provide evidence of how students are
meeting formative benchmarks, and the resulting data can provide a pathway to personalized
instructional decision-making (Campbell, Lambie, & Planinz, 2016; Sutter, Campbell, & Lambie,
2019).
The predictability of ISIP-ER and ISIP-AR scores may inform students, families, and
educators of the need for remediation to support students in earning a passing score of their
SOL assessment. The following report provides evidence of predictability and subsequent cut
scores for the ISIP-ER and ISIP- AR in relationship to SOL. The following two research questions
guided this study:
Research Question 1. To what level does 3rd- through 8th-grade students’ ISIP-ER and
ISIP-AR scores (Overall Reading and Comprehension scores) predict their SOL scores?
Research Question 2. What are the cut scores of 3rd- through 8th-grade students’ ISIP-
ER and ISIP-AR in relationship to their SOL levels of achievement?

6
Review of Related Literature
Istation’s Indicators of Progress Early Reading (ISIP-ER) – Kindergarten through Grade 3
Continuous progress monitoring in reading can be accomplished by frequent formative
assessment. Through the use of ISIP-ER, Kindergarten through 3rd-grade students can be
rapidly assessed, providing educators information about their students’ reading abilities.
Students who take the computer-adaptive, Internet-delivered, curriculum-based measure earn
an Overall Reading scaled score and subsequent subtest scores. For example, overall scores for
students in 3rd grade are generated from the following subtests: (a) Reading Comprehension,
(b) Spelling, and (c) Vocabulary (Mathes, Torgeson, & Herron, 2011; 2016). Prior research
indicates that the ISIP-ER is predictive of national and state high-stakes assessment scores
(Campbell, Sutter, & Lambie, 2019; Gaughin, 2011; Hoelzle, 2012; Luo, Lee, & Molina, 2017;
Patarapichayatham, 2016; 2017).
Istation’s Indicators of Progress Advanced Reading (ISIP-AR) - Grade 4 through Grade 8
ISIP-AR is an assessment designed for students in 4th through 8th grade. The ISIP-AR is a
computer-adaptive assessment that is typically taken at the beginning of each month or the
first time a student uses the program for that month. Teachers can assign students to take the
entire assessment or a portion thereof on-demand as needed. Delivery of the assessment is
web-based and can only be taken when using a school-designated Internet Protocol (IP)
address. While Istation advises teachers to allot 30 minutes for the assessment, most students
complete the assessment in 20 minutes or less (see the Fidelity report). In this study, the ISIP-
AR Overall Reading score includes four subscale measures: (a) Word Analysis, (b) Text Fluency,

7
(c) Vocabulary, and (d) Reading Comprehension. The resulting scores guide the subsequent
instructional path the student will follow before the next assessment. Likewise, the resulting
reports provide instructors information for planning face-to-face instruction. Concurrent
validity for Istation assessment scores includes the Gray Oral Reading Test-4 (GORT – 4),
Woodcock-Johnson-3 (WJ-III), Wechsler Individual Achievement Test-II (WIAT-II; spelling,
decoding, and word recognition), and the Peabody Picture Vocabulary Test-IV (PPVT-IV;
Mathes, 2012; 2014).
Virginia’s Standards of Learning (SOL)
The SOL measures minimum expectations for learning and achievement for students
living in the Commonwealth of Virginia (VDOE Policy and Communication, 2015). For this study,
students’ Istation Overall Reading and Comprehension scores were compared to the Reading
SOL scores. Scaled scores determine students’ levels of proficiency and performance. There are
four performance levels for reading in Grade 3 through Grade 8, including: (a) Pass/Advanced,
(b) Pass/Proficient, (c) Fail/Basic, and (d) Fail/Below Basic (see Table 1). The delivery format for
the assessment was computer based and the test itself is computer adaptive.

8
Table 1
Reading SOL Test Interpretation
Grade Fail Pass
Level 4 Below Basic
Level 3 Basic
Level 2 Proficient
Level 1 Advanced
Grade 3 SOL Scores 0-309 310-399 400-499 500-600
Grade 4 SOL Scores 0-302 303-399 400-499 500-600
Grade 5 SOL Scores 0-294 295-399 400-499 500-600
Grade 6 SOL Scores 0-316 317-399 400-499 500-600
Grade 7 SOL Scores 0-314 315-399 400-499 500-600
Grade 8 SOL Scores 0-316 317-399 400-499 500-600
*Scores for each performance level were derived from the current sample.
Methods
Participants
The sample (N = 4,033) was comprised of students from one county in the
Commonwealth of Virginia who have scores on both the October ISIP Overall Reading and ISIP
Reading Comprehension subtest as well as the SOL, regardless of curriculum usage. The
students were enrolled in the following grade levels: (a) 3rd, n = 955; (b) 4th, n = 978; (c) 5th, n
= 998; (d) 6th, n = 629; (e) 7th, n = 262; and (f) 8th, n = 211. The distribution of students’
academic tier levels by grade is documented in Table 2.

9
Table 2
Frequency of Academic Level by Grade
Grade N Academic Tier 1 Academic Tier 2 Academic Tier 3
N % N % N %
Grade 3 955 631 66.1 168 17.6 156 16.3
Grade 4 978 618 63.2 195 19.9 165 16.9
Grade 5 998 856 85.8 79 7.9 63 6.3
Grade 6 629 406 64.5 99 15.7 124 19.7
Grade 7 262 126 48.1 56 21.4 80 30.5
Grade 8 211 87 41.2 44 20.9 80 37.9
Total 4,033 2,724 67.5 641 15.9 668 16.6
Analysis
The purpose of this study was to determine (a) the predictability of ISIP-ER and ISIP-AR
Overall Reading and Comprehension scores on students’ SOL scaled scores and (b) the
predictive scoring bands and cut scores relative to the SOL achievement levels for Grade 3
through Grade 8. The descriptive statistics of both ISIP scores (Overall Reading and Reading
Comprehension) as well as the scaled Reading SOL scores are presented in Table 3.
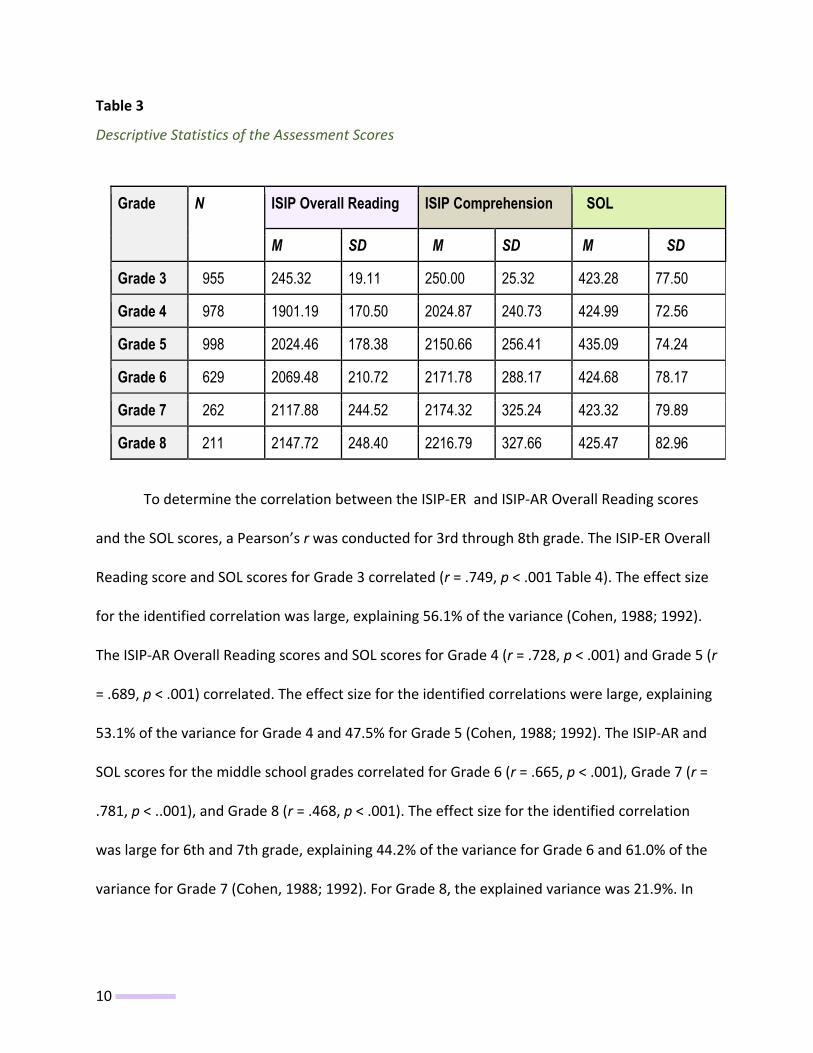
10
Table 3
Descriptive Statistics of the Assessment Scores
Grade N ISIP Overall Reading ISIP Comprehension SOL
M SD M SD M SD
Grade 3 955 245.32 19.11 250.00 25.32 423.28 77.50
Grade 4 978 1901.19 170.50 2024.87 240.73 424.99 72.56
Grade 5 998 2024.46 178.38 2150.66 256.41 435.09 74.24
Grade 6 629 2069.48 210.72 2171.78 288.17 424.68 78.17
Grade 7 262 2117.88 244.52 2174.32 325.24 423.32 79.89
Grade 8 211 2147.72 248.40 2216.79 327.66 425.47 82.96
To determine the correlation between the ISIP-ER and ISIP-AR Overall Reading scores
and the SOL scores, a Pearson’s r was conducted for 3rd through 8th grade. The ISIP-ER Overall
Reading score and SOL scores for Grade 3 correlated (r = .749, p < .001 Table 4). The effect size
for the identified correlation was large, explaining 56.1% of the variance (Cohen, 1988; 1992).
The ISIP-AR Overall Reading scores and SOL scores for Grade 4 (r = .728, p < .001) and Grade 5 (r
= .689, p < .001) correlated. The effect size for the identified correlations were large, explaining
53.1% of the variance for Grade 4 and 47.5% for Grade 5 (Cohen, 1988; 1992). The ISIP-AR and
SOL scores for the middle school grades correlated for Grade 6 (r = .665, p < .001), Grade 7 (r =
.781, p < ..001), and Grade 8 (r = .468, p < .001). The effect size for the identified correlation
was large for 6th and 7th grade, explaining 44.2% of the variance for Grade 6 and 61.0% of the
variance for Grade 7 (Cohen, 1988; 1992). For Grade 8, the explained variance was 21.9%. In

11
conclusion, for Grades 3-8, the ISIP-ER and ISIP-AR Overall Reading scores had a strong
correlation with the Reading SOL scores (see Table 4).
The ISIP-ER Reading Comprehension subscale scores for Grade 3 correlated with the
SOL scores (r = .714, p < .001), explaining 51% of the variance. For the upper elementary
school grades, the ISIP-AR Reading Comprehension subscales correlated with the SOL scores
for Grade 4 (r = .723, p < .001), explaining 52.3% of the variance, and Grade 5 (r = .686, p <
.001), explaining 47.1% of the variance. For middle school, the ISIP-AR Comprehension
subscales correlated with the SOL scores for Grade 6 (r = .661, p < .001), explaining 43.7 % of
the variance, Grade 7 (r = .717, p < .001), explaining 51.4 % of the variance and Grade 8 (r =
.501, p < .001), explaining 25.1 % of the variance. Therefore, both the ISIP-ER and ISIP-AR
Overall Reading scale score and Reading Comprehension subscale score had a strong
correlation with the Reading SOL scores.
Table 4
Pearson Product-Moment Correlation Coefficients and Effect Size
ISIP Overall Reading r2 ISIP Reading Comprehension
r2
Grade 3 SOL Scaled Score
.749 .561 .714 .510
Grade 4 .728 .531 .723 .523
Grade 5 .689 .474 .686 .470
Grade 6 .665 .442 .661 .437
Grade 7 .781 .610 .717 .515
Grade 8 .468 .219 .501 .251

12
A simple linear regression analysis was conducted using SPSS software version 24 to
determine the predictability of ISIP-ER and ISIP-AR scores to the students’ SOL scores. For the
Overall Reading predictability, the ISIP Overall Reading score was the predictor variable, and the
Reading SOL score was the outcome variable. Likewise, for the Reading Comprehension
predictability, the ISIP-ER and ISIP-AR Reading Comprehension score was the predictor
variable, and the Reading SOL score was the outcome variable. The yˆ for 3rd through 8th grade
data was computed. For the regression analyses, the October ISIP Overall Reading and Reading
Comprehension scores were centered to the mean.
Research Question 1: Simple Linear Regression Analysis
To what level does 3rd- through 8th-grade students’ ISIP-ER and ISIP-AR scores (Overall
Reading and Comprehension scores) predict their SOL scores?
Primary Grade 3
For 3rd grade, 56.1% of the variance in Reading SOL scores was predicted by the ISIP-ER
Overall Reading scores (R2 = .560). The equation for predicting the Reading SOL score is: SOL =
423.289 + 3.037 (ISIP-ER Overall Reading score) + e. The intercept was 423.289. The Reading
SOL score was 423.289 as the ISIP-ER Overall Reading score was zero. The slope for ISIP-ER
Overall Reading was 3.037, indicating that the Reading SOL score was 426.326 (423.289 +
3.037) as the ISIP-ER Overall Reading score increases 1 unit (See Appendix A).
For 3rd grade, 51.0% of the variance in Reading SOL scores was predicted from ISIP-ER
Reading Comprehension scores (R2 = .510). The equation for predicting the Reading SOL score
is: SOL = 423.275 + 2.186 (ISIP-ER Reading Comprehension score) + e. The intercept was
423.275. The Reading SOL score was 423.275 as ISIP-ER Reading Comprehension score was
zero. The slope for ISIP-ER Reading Comprehension was 2.186, indicating that the Reading SOL

13
score was 425.461 (423.275 + 2.186) as the ISIP-ER Reading Comprehension score increases 1
unit.
Upper Elementary Grades 4 and 5
For 4th grade, 53.1% of the variance in Reading SOL scores was predicted by the ISIP-AR
Overall Reading scores (R2 = .531). The equation for predicting the Reading SOL score is: SOL =
424.987 + .310 (ISIP-AR Overall Reading score) + e. The intercept was 424.987. The Reading SOL
score was 424.987 as ISIP-AR Overall Reading score was zero. The slope for ISIP-AR Overall
Reading was .310, indicating that the Reading SOL score was 425.297 (424.987 + .310) as the
ISIP-ER Overall Reading score increases 1 unit (See Appendix A).
For 4th grade, 52.3% of the variance in Reading SOL scores was predicted from ISIP-AR
Reading Comprehension scores (R2 = .523). The equation for predicting the Reading SOL score
is: SOL = 424.985 + .218 (ISIP-AR Reading Comprehension score) + e. The intercept was 424.985.
The Reading SOL score was 424.985 as ISIP-AR Reading Comprehension score was zero. The
slope for ISIP-AR Reading Comprehension was .218, indicating that the Reading SOL score was
425.203 (424.985 + .218) as the ISIP-AR Reading Comprehension score increases 1 unit.
For 5th grade, 47.4% of the variance in Reading SOL scores was predicted by the ISIP-AR
Overall Reading scores (R2 = .474). The equation for predicting the Reading SOL score is: SOL =
435.084 + .287 (ISIP-AR Overall Reading score) + e. The intercept was 435.084. The Reading SOL
score was 435.084 as ISIP-AR Overall Reading score was zero. The slope for ISIP-AR Overall
Reading was .287, indicating that the Reading SOL score was 435.371 (435.084 + .287) as the
ISIP-AR Overall Reading score increases 1 unit.

14
For 5th grade, 47.0% of the variance in Reading SOL scores was predicted from ISIP-AR
Reading Comprehension scores (R2 = .470). The equation for predicting the Reading SOL score
is: SOL = 435.085 + .199 (ISIP-AR Reading Comprehension score) + e. The intercept was 435.085.
The Reading SOL score was 435.085 as ISIP-AR Reading Comprehension score was zero. The
slope for ISIP-AR Reading Comprehension was .199, indicating that the Reading SOL score was
435.279 (435.08 + .199) as the ISIP-AR Reading Comprehension score increases 1 unit.
Middle School Grades 6, 7 and 8
For 6th grade, 44.2% of the variance in Reading SOL scores was predicted by the ISIP-AR
Overall Reading scores (R2 = .442). The equation for predicting the Reading SOL score is: SOL =
424.675 + .247 (ISIP-AR Overall Reading score) + e. The intercept was 424.675. The Reading SOL
score was 424.675 as ISIP-AR Overall Reading score was zero. The slope for ISIP-AR Overall
Reading was .247, indicating that the Reading SOL score was 424.922 (424.675 + .247) as the
ISIP-AR Overall Reading score increases 1 unit.
For 6th grade, 43.7% of the variance in Reading SOL scores was predicted from ISIP-AR
Reading Comprehension scores (R2 = .437). The equation for predicting the Reading SOL score
is: SOL = 424.675 + .179 (ISIP-AR Reading Comprehension score) + e. The intercept was 424.675.
The Reading SOL score was 424.675 as ISIP-AR Reading Comprehension score was zero. The
slope for ISIP-AR Reading Comprehension was .179, indicating that the Reading SOL score was
424.854 (424.675 + .179) as the ISIP-AR Comprehension score increases 1 unit.
For 7th grade, 61.0% of the variance in Reading SOL scores was predicted by the ISIP-AR
Overall Reading scores (R2 = .610). The equation for predicting the Reading SOL score is: SOL =
423.373 + .255 (ISIP-AR Overall Reading score) + e. The intercept was 423.373. The Reading SOL

15
score was 423.373 as ISIP-AR Overall Reading score was zero. The slope for ISIP-AR Overall
Reading was .255, indicating that the Reading SOL score was 423.628 (423.373 + .255) as the
ISIP-AR Overall Reading score increases 1 unit.
For 7th grade, 51.5% of the variance in Reading SOL scores was predicted from ISIP-AR
Reading Comprehension scores (R2 = .515). The equation for predicting the Reading SOL score
is: SOL = 423.374 + .176 (ISIP-AR Reading Comprehension score) + e. The intercept was 423.374.
The Reading SOL score was 423.374 as ISIP-AR Reading Comprehension score was zero. The
slope for ISIP-AR Reading Comprehension was .176, indicating that the Reading SOL score was
423.55 (423.374 + .176) as the ISIP-AR Reading Comprehension score increases 1 unit.
For 8th grade, 21.9% of the variance in Reading SOL scores was predicted by the ISIP-AR
Overall Reading scores (R2 = .219). The equation for predicting the Reading SOL score is: SOL =
425.474 + .156 (ISIP-AR Overall Reading score) + e. The intercept was 425.474. The Reading SOL
score was 425.474 as ISIP-AR Overall Reading score was zero. The slope for ISIP-AR Overall
Reading was .156, indicating that the Reading SOL score was 425.63 (425.474 + .156) as the
ISIP-AR Overall Reading score increases 1 unit.
For 8th grade, 25.1% of the variance in Reading SOL scores was predicted from ISIP-AR
Reading Comprehension scores (R2 = .251). The equation for predicting the Reading SOL score
is: SOL = 525.473 + .127 (ISIP-AR Reading Comprehension score) + e. The intercept was
525.473. The Reading SOL score was 525.473 as ISIP-AR Reading Comprehension score was
zero. The slope for ISIP-AR Reading Comprehension was .127, indicating that the Reading SOL
score was 526.6 (525.473 + .127 ) as the ISIP-AR Comprehension score increases 1 unit.

16
Research Question 2: Confidence Intervals
What are the cut scores of 3rd- through 8th-grade students’ ISIP-ER and ISIP-AR in
relationship to their SOL levels of achievement?
Confidence score bands were computed to determine the estimate of confidence of the
observed scores in the sample being predictive of the SOL. The upper and lower bound of the
confidence interval were applied to obtain the prediction band. The confidence score bands
were calculated at 95%, meaning that 95% of the population of the sample that scored in these
predictive score bands were situated within the predictive range. The lower bound of the
confidence score band of the predictor assessment (i.e., ISIP-ER and ISIP-AR Overall Reading
scale score and Reading Comprehension subscale score) provided the cut scores between each
SOL proficiency level from simple linear regression results. Performance levels were provided
by the SOL (See Table 1) and are: (a) Pass/Advanced, (b) Pass/Proficient, (c) Fail/Basic, and (d)
Fail/Below Basic. Student performance is graded on a scale of 0 - 600 with 400 representing the
minimum level of acceptable proficiency. Hence, if a student scores below 400 (Performance
Levels 3 and 4), he or she will fail the assessment (See Tables 5-7). Within our data, sample
scores were more nuanced by grade, indicating variability for inclusion within a certain
performance level.
For example, for 3rd-grade students, the prediction band for Performance Level 2
(Pass/Proficient) was 249 - 251 (see Table 5). The ISIP-ER Overall Reading score at 249 is the
lower bound cut score. It is 95% certain that students who have an ISIP-ER Overall Reading
score between 249 - 251 will score within 400 - 499 on the SOL and that their SOL Performance
Level 2 cut score will be in the 400 - 499 range. In other words, 3rd-grade students who score

17
equal to or above 249 on the ISIP-ER Overall Reading will almost certainly score at Reading SOL
performance Level 2 and pass the SOL. For each performance level, the prediction bands are
indicated with 95% certainty. Likewise, the same pattern can be followed to determine the
prediction bands for the ISIP-ER Reading Comprehension subtest.
Table 5
ISIP-ER Overall Score Prediction Bands and Cut Scores for the Reading SOL Test - Grade 3
Fail Pass
Grade Level 4 Below Basic
Level 3 Basic Level 2 Proficient
Level 1 Advanced
Grade 3 ISIP-ER Overall Reading 212-219 231-234 249-251 263-268
Lower Bound Cut Score 212 231 249 263
SOL Cut Off Scores 0-309 310-399 400-499 500-600
ISIP-ER Reading Comprehension 215-222 231-236 252-256 275-282
Lower Bound Cut Score 215 231 252 275
The cut scores for upper elementary grades are presented in Table 6. For example, for
4th-grade students, the prediction band for Performance Level 2 (Pass/Proficient) was 1925 -
1945. The ISIP-AR Overall Reading score at 1925 is the lower bound cut score. It is 95% certain
that students who have an ISIP-AR Overall Reading score between 1925 - 1945 will score within
400 - 499 on the SOL and that their SOL Performance Level 2 cut score will be in the 400 - 499
range. In other words, 4th-grade students who score equal to or above 1925 on the ISIP-AR
Overall Reading will almost certainly score at Reading SOL performance Level 2 and pass the
SOL.

18
Table 6
ISIP-AR Overall Score Prediction Bands for the Reading SOL Test - Upper Elementary
Fail Pass
Grade Level 4 Below Basic
Level 3 Basic Level 2 Proficient
Level 1 Advanced
Grade 4 ISIP-AR Overall 1607-1693 1751-1784 1925-1945 2077-2118
Lower Bound Cut Score 1607 1751 1925 2077
SOL Cut Off Scores 0-302 303-399 400-499 500-600
ISIP-AR Comprehension 1714-1788 1807-1845 2046-2077 2303-2366
Lower Bound Cut Score 1714 1807 2046 2303
Grade 5 ISIP-AR Overall 1703-1789 1855-1889 2038-2060 2179-2219
Lower Bound Cut Score 1703 1855 2038 2179
SOL Cut Off Scores 0-294 295-399 400-499 500-600
ISIP-AR Comprehension 1763-1853 1901-1945 2164-2198 2390-2441
Lower Bound Cut Score 1763 1901 2164 2390
The cut scores for middle school grades are presented in Table 7. For example, for 6th-
grade students, the prediction band for Performance Level 2 (Pass/Proficient) was 2119 - 2151.
The ISIP-AR Overall Reading score at 2119 is the lower bound cut score. It is 95% certain that
students who have an ISIP-AR Overall Reading score between 2119 and 2151 will score within
400 - 499 on the SOL, meaning the Performance Level 2 cut score will be in the 400 - 499 range.
In other words, 6th-grade students who score equal to or above 2219 on ISIP-AR Overall
Reading will almost certainly score at Reading SOL performance Level 2 and pass the SOL.

19
Table 7
ISIP-AR Prediction Bands and Cut Scores for the Reading SOL Test - Middle School Grades 6-8
Fail Pass
Grade Level 4 Below Basic
Level 3 Basic Level 2 Proficient
Level 1 Advanced
Grade 6 ISIP-AR Overall 1689-1793 1894-1943 2119-2151 2290-2344
Lower Bound Cut Score 1689 1894 2119 2290
SOL Cut Off Scores 0-316 317-399 400-499 500-600
ISIP-AR comprehension 1749-1831 1908-1966 2238-2288 2462-2543
Lower Bound Cut Score 1749 1908 2238 2462
Grade 7 ISIP-AR Overall 1611-1819 1896-1982 2156-2223 2378-2470
Lower Bound Cut Score 1611 1896 2156 2378
SOL Cut Off Scores 0-314 315-399 400-499 500-600
ISIP-AR Comprehension 1701-1866 1841-1978 2233-2322 2457-2632
Lower Bound Cut Score 1701 1841 2233 2457
Grade 8 ISIP-AR Overall 1593-1780 1907-2104 2162-2240 2347-2477
Lower Bound Cut Score 1593 1907 2162 2347
SOL Cut Off Scores 0-316 317-399 400-499 500-600
ISIP-AR Comprehension 1593-1865 1883-2016 2214-2319 2583-2746
Lower Bound Cut Score 1593 1883 2214 2583

20
Conclusions
Overall, the study’s results indicate evidence of predictive validity for 3rd- through 8th-
grade students’ ISIP-ER and ISIP-AR Overall Reading and Reading Comprehension scores
(October)to their SOL scores. Based on this sample of 3rd- through 8th-grade students (N =
4,033), educators can rely on the ISIP-ER and ISIP-AR Overall Reading and Reading
Comprehension scores to be a strong predictive estimate of SOL scores. The ISIP-ER and ISIP-AR
cut scores are useful for educators to predict students’ performance on the end-of-the-year
SOL tests and to guide instruction prior to the high-stakes achievement testing of the Virginia
SOL.
The ISIP-ER and ISIP-AR is designed to be administered monthly. Students are prompted
to take the assessment the first time they use the program at school each month. In the
participating school district, especially in middle school (see the Fidelity report), not all students
utilized the program monthly, rather they may have only use it at the designated benchmarking
times. During this year, it was noted that the most compliance to completing the benchmarking
assessment occurred during October. For students in need, taking more frequent assessments
may aid instructional planning. Teachers, reading coaches, school counselors, and
administrators can view the students’ data to determine students’ progress towards a
satisfactory achievement level on the Reading SOL. For example, the ISIP-ER Overall Reading cut
score (October) for 3rd grade to pass SOL Achievement Level 2 is 249 - 251. If a 3rd-grade
student scores 239 during the October monthly assessment, the student is at risk for not
passing the SOL testing in May. Thus, by reviewing the ISIP October monthly assessment

21
educators have time to act and intervene to help the students potentially reach greater
achievement.
This study’s results provide evidence of the ISIP-ER and ISIP-AR Overall Reading and
Reading Comprehension cut scores and predictive score bands in relationship to the Reading
SOL for students in 3rd through 8th grade. These predictive score bands provide educators a
means to determine students who may be at risk of not passing the SOL and in need of
additional interventions. The predictive score bands and resulting cut scores are presented with
95% certainty. Environmental, physical, and psychological factors may impact students’ SOL
scores.

22
References
Campbell, L. O., Lambie, G. W., Planinz, T., & Pulse, L. (2016). An investigation of the effects of the Istation Reading program on the reading performance of elementary school students in the state of Florida (Year 2). Orlando, FL. University of Central Florida. www.ucf.edu/mirc/istation.
Cohen, J. (1988). Statistical power analysis for the behavioral sciences (2nd ed.). Hillsdale, NJ: Lawrence Erlbaum Associates.
Cohen, J. (1992). A power primer. Psychological Bulletin, 112(1), 155-159. https://doi.org/10.1037/0033-2909.112.1.155
Gaughin, L. (2011). Report of Istation 2009 Second Grade 2010 Third Grade Users [White Paper]. Hillsborough County Public Schools: Tampa, FL
Hoelzle, B. (2012). Predicting student performance on the developmental reading assessment: An independent comparison of two different tests (2nd ed.) [White Paper]. Frisco, Independent School District: Frisco, TX
Luo, T., Lee, G.-L., & Molina, C. (2017). Incorporating Istation into early childhood classrooms to improve reading comprehension. Journal of Information Technology Education: Research, 16, 247- 266. http://doi.org/10.28945/3788
Mathes, P. (2012). Technical report: Istation's Indicators of Progress (ISIP) Advanced Reading computer adaptive testing system for continuous progress monitoring of reading growth for students grade 4 to 8. Dallas, TX: Istation.
Mathes, P. (2014). Istation’s indicators of progress (ISIP) Advanced Reading technical report: Computer adaptive testing system for continuous progress monitoring of reading growth for students grade 4 through grade 8. Dallas, TX: Istation
Mathes, P., Torgesen, J., & Herron, J. (2011). Technical manual: Istation’s Indicators of Progress, Early Reading: Computer Adaptive Testing System for Continuous Progress Monitoring of Reading Growth for Students Pre-K to Grade 3. Retrieved from: www.istation.com/studies.
Mathes, P., Torgesen, J., & Herron, J. (2016). Computer Adaptive Testing System for Continuous Progress Monitoring of Reading Growth for Students Pre-K through Grade 3. Istation.com, Dallas, Texas. Retrieved from: www.istation.com/studies.

23
Miller, K. C., Bell, S. M., & McCallum, R. S. (2015). Using reading rate and comprehension CBM to predict high-stakes achievement. Journal of Psychoeducational Assessment, 33(8), 707-718.
Patarapichayatham, C. (2016). Predictability Study of ISIP Reading and Georgia Milestones Assessment System: 3rd – 6th Grade Students. Dallas, TX: Istation. Retrieved from: www.istation.com/studies.
Patarapichayatham, C. (2017). Predictability Study of ISIP Reading and Kansas Assessment Program: 3rd– 6th Grade Students. Dallas, TX: Istation. Retrieved from: www.istation.com/studies.
Sutter, C. C., Campbell, L. O., & Lambie, G. W. (2019). Computer-adaptive reading to improve reading achievement among third-grade students at risk for reading failure. Journal of At-Risk Issues, 22, 31-38. Retrieved from https://dropoutprevention.org/wp-content/ uploads/2019/10/JARI-222.pdf
Virginia Department of Education [VDOE] Policy and Communication (2015). Frequently Asked Questions about SOL Testing. http://www.doe.virginia.gov/testing/sol_faq.pdf

24
Appendix A
Table A1
Simple Linear Regression Analysis Differentiated by Grade: ISIP Overall Reading - Model
Summary
Model Summary
Grade R R2
Adjusted
R2
Std. Error
of the
Estimate
Change Statistics
R2
Change F Change df1 df2
Sig. F
Change
3 .749a .561 .560 51.381 .561 1217.222 1 953 .000
4 .728a .531 .530 49.734 .531 1103.665 1 976 .000
5 .689a .474 .474 53.860 .474 898.297 1 996 .000
6 .665a .442 .441 58.434 .442 496.805 1 627 .000
7 .781a .610 .609 49.976 .610 407.041 1 260 .000
8 .468a .219 .216 73.471 .219 58.760 1 209 .000
a. Predictors: (Constant), October Overall Reading Score

25
Table A2
Simple Linear Regression Analysis Differentiated by Grade: ISIP Overall Reading - ANOVA
ANOVAa
Grade Sum of Squares df Mean Square F Sig.
3 Regression 3213457.453 1 3213457.453 1217.222 .000b
Residual 2515914.212 953 2639.994
Total 5729371.665 954
4 Regression 2729856.455 1 2729856.455 1103.665 .000b
Residual 2414083.345 976 2473.446
Total 5143939.800 977
5 Regression 2605828.194 1 2605828.194 898.297 .000b
Residual 2889251.567 996 2900.855
Total 5495079.761 997
6 Regression 1696369.635 1 1696369.635 496.805 .000b
Residual 2140930.203 627 3414.562
Total 3837299.838 628
7 Regression 1016631.628 1 1016631.628 407.041 .000b
Residual 649379.716 260 2497.614
Total 1666011.344 261
8 Regression 317187.277 1 317187.277 58.760 .000b
Residual 1128187.330 209 5398.026
Total 1445374.607 210
a. Dependent Variable: SOL Scaled Score
b. Predictors: (Constant), October Overall Reading Score

26
Table A3
Simple Linear Regression Analysis Differentiated by Grade: ISIP Overall Reading - Coefficients
Coefficientsa
Grade
Unstandardized Coefficients
Standardized Coefficients
t Sig. B Std. Error Beta
3 (Constant) 423.289 1.663 254.588 .000
October Overall Score 3.037 .087 .749 34.889 .000
4 (Constant) 424.987 1.590 267.235 .000
October Overall Score .310 .009 .728 33.221 .000
5 (Constant) 435.084 1.705 255.197 .000
October Overall Score .287 .010 .689 29.972 .000
6 (Constant) 424.675 2.330 182.270 .000
October Overall Score .247 .011 .665 22.289 .000
7 (Constant) 423.373 3.088 137.123 .000
October Overall Score .255 .013 .781 20.175 .000
8 (Constant) 425.474 5.058 84.119 .000
October Overall Score .156 .020 .468 7.665 .000
a. Dependent Variable: SOL Scaled Score

27
Table A4
Simple Linear Regression Analysis Differentiated by Grade: ISIP Reading Comprehension - Model
Summary
Model Summary
Grade R R2 Adjusted R2
Std. Error
of the
Estimate
Change Statistics
R2
Change F Change df1 df2
Sig. F
Change
3 .714a .510 .510 54.267 .510 992.542 1 953 .000
4 .723a .523 .522 50.158 .523 1068.616 1 976 .000
5 .686a .470 .470 54.058 .470 884.431 1 996 .000
6 .661a .437 .437 58.674 .437 487.628 1 627 .000
7 .717a .515 .513 55.769 .515 275.655 1 260 .000
8 .501a .251 .247 71.994 .251 69.863 1 209 .000
a. Predictors: (Constant), October Reading Comprehension Score

28
Table A5
Simple Linear Regression Analysis Differentiated by Grade: ISIP Reading Comprehension -
ANOVA
ANOVAa
Grade Sum of Squares df Mean Square F Sig.
3 Regression 2922908.493 1 2922908.493 992.542 .000b
Residual 2806463.172 953 2944.872
Total 5729371.665 954
4 Regression 2688474.001 1 2688474.001 1068.616 .000b
Residual 2455465.799 976 2515.846
Total 5143939.800 977
5 Regression 2584523.499 1 2584523.499 884.431 .000b
Residual 2910556.261 996 2922.245
Total 5495079.761 997
6 Regression 1678742.937 1 1678742.937 487.628 .000b
Residual 2158556.901 627 3442.674
Total 3837299.838 628
7 Regression 857351.422 1 857351.422 275.655 .000b
Residual 808659.921 260 3110.230
Total 1666011.344 261
8 Regression 362105.064 1 362105.064 69.863 .000b
Residual 1083269.543 209 5183.108
Total 1445374.607 210
a. Dependent Variable: SOL Scaled Score
b. Predictors: (Constant), October Reading Comprehension Score

29
Table A6
Simple Linear Regression Analysis Differentiated by Grade: ISIP Comprehension Reading Ability -
Coefficients
Coefficientsa
Grade
Unstandardized Coefficients Standardized Coefficients
T Sig. B Std. Error Beta
3 (Constant) 423.275 1.756 241.041 .000
October Comprehension Score
2.186 .069 .714 31.505 .000
4 (Constant) 424.985 1.604 264.972 .000
October Comprehension Score
.218 .007 .723 32.690 .000
5 (Constant) 435.085 1.711 254.262 .000
October Comprehension Score
.199 .007 .686 29.739 .000
6 (Constant) 424.675 2.339 181.524 .000
October Comprehension Score
.179 .008 .661 22.082 .000
7 (Constant) 423.374 3.445 122.879 .000
October Comprehension Score
.176 .011 .717 16.603 .000
8 (Constant) 425.473 4.956 85.846 .000
October Comprehension Score
.127 .015 .501 8.358 .000
a. Dependent Variable: SOL Scaled Score