measuring the space economy: estimating the value of
TRANSCRIPT

S C I E N C E & T E C H N O L O G Y P O L I C Y I N S T I T U T E
Measuring the Space Economy:Estimating the Value of Economic
Activities in and for Space
Keith W. CraneEvan LinckBhavya Lal
Rachel Y. Wei
March 2020Approved for public release;
distribution is unlimited.
IDA Document D-10814Log: H 19-000421
IDA SCIENCE & TECHNOLOGY POLICY INSTITUTE
1701 Pennsylvania Ave., Suite 500 Washington, DC 20006-5825

The Institute for Defense Analyses is a nonprofit corporation that operates three Federally Funded Research and Development Centers. Its mission is to answer the most challenging U.S. security and science policy questions with objective analysis, leveraging extraordinary scientific, technical, and analytic expertise.
About This Publication
This work was conducted by the Institute for Defense Analysis Central Research Program. The views, opinions, and findings should not be construed as representing the official positions of the sponsoring office.
For More Information
Bhavya Lal, Project Leader [email protected], 202-419-3724
Mark S. Taylor, Acting Director, Science and Technology Policy Institute [email protected], 202-419-5491
Copyright Notice
© 2020 Institute for Defense Analyses 4850 Mark Center Drive, Alexandria, Virginia 22311-1882 • (703) 845-2000.
This material may be reproduced by or for the U.S. Government pursuant to the copyright license under the clause at FAR 52.227-14 (May 2014).

S C I E N C E & T E C H N O L O G Y P O L I C Y I N S T I T U T E
IDA Document D-10814
Measuring the Space Economy: Estimating the Value of Economic
Activities in and for Space
Keith W. CraneEvan LinckBhavya Lal
Rachel Y. Wei


iii
Executive Summary
The purpose of this report is to provide more targeted estimates of the size of the space economy than are currently employed. It does so by adopting a more restrictive definition of the space economy that only includes the value of goods and services provided to governments, households, and businesses from space or used to support activities in space; it excludes activities that are enabled by space, but are primarily generated terrestrially. We adopt this definition because we believe that an estimate of the size of the space economy focused on activities from or in space would help U.S. Government policy makers develop better policies to foster the growth of commercial activities for or in space, and help clarify for investors and entrepreneurs interested in the space economy the current extent and size of markets focused exclusively on space.
Methodology We split the space economy into four categories:
1. Government expenditures on space: government expenditures on activities inspace, such as human space exploration or military space programs.
2. Space services: expenditures by households and businesses on servicesgenerated in space for use on Earth or in space, such as broadband internetprovided by satellites.
3. Space supplier industry: sales of goods and services such as satellites or spacelaunches, which make possible the achievement of government space missionsor the production of goods and services in space for sale on Earth. Becausedemand for these goods and services is derived from expenditures on activitiesin space by governments or satellite operators, we exclude these sales from thetotal value of the space economy to avoid double counting.
4. Space service user support industry: sales of products—such as consumersatellite TV dishes, global navigation satellite systems (GNSS) hardware—thatare needed to utilize space services.
We exclude some activities occasionally included in other estimates. We only include government expenditures in our estimates of purchases of launch services and other products of the space supplier industry; we do not include the value of sales of launch services by companies to governments, as that would entail double counting. We exclude from our estimates economic activities that we argue are primarily terrestrial in origin. We

iv
also have developed more refined estimates of the value of portions of systems, such as GNSS, which make possible utilizing services from space.
To develop our estimates of the size of the global space sector, we draw on estimates produced by the Satellite Industry Association’s (SIA’s) annual State of the Satellite Industry Report, the Space Foundation’s The Space Report, and the Organisation for Economic Co-operation and Development (OECD), three of the most highly regarded sources of information and primary data on the space economy. We provide two estimates for the space economy: one for 2013 and one for 2016. We chose those two years to make comparisons because 2013 was the latest year for which an estimate of the size of the space economy by the OECD was available and because 2016 was the last year for which primary data on GNSS hardware sales were available to us.
Findings on the Size of the Space Economy Figure ES-1 shows the value of our estimates alongside the estimates of the three
organizations for 2013 and for SIA and the Space Foundation for 2016. We estimate the total value of goods and services from and for space at $155.7 billion in 2013 and $166.8 billion in 2016.1 As can be seen, there is a large difference between these estimates and those of the most respected public estimates of the size of the space economy; STPI’s estimates are roughly half those estimates.
1 We have chosen to present all information in nominal dollars of the year in which the data are reported. We made this decision to make it easier for readers to find the numbers in the referenced publications.

v
Sources: STPI estimates; SIA 2014, 2017; Space Foundation 2014, 2017; OECD 2014
Figure ES-1. Estimates of the Size and Composition of the Space Economy
Explanations for the Differences with Other Estimates Why are these differences so large?
• Estimates by SIA sum the value of the goods and services purchased or sold byeach of four categories (government expenditures, satellite services, the spacesupplier industry, and the space service user support industry) to measure thetotal value of the space economy. We argue that summing the four categories tocreate a total value of the space economy results in some double counting.Government and space service company expenditures on launch services andsatellites equal the revenues of the space suppliers who provide those products.Counting both the expenditures on purchases of goods and services and therevenues from sales of those goods and services results in double counting. Thisdifference in accounting is responsible for about $20 billion of the differencebetween STPI estimates and the SIA estimates for 2016; but only about $8billion of the difference between STPI’s estimates and the Space Foundationestimates because the Space Foundation also tries to eliminate some of thedouble counting involved in adding space supplier sales.
• STPI adopted a more restrictive definition to estimate the value of satelliteservices. We restrict those services to services generated in space: the revenuesor costs generated from owning and operating satellites and transmitting signalsto the Earth. We exclude payments by direct broadcast TV operators for
155.7
320 314.2 320
166.3
339.1 329.3
0
50
100
150
200
250
300
350
400
STPI SIA SpaceFoundation
OECD STPI SIA SpaceFoundation
Billio
ns o
f USD
, nom
inal
dol
lars
Government Expenditures Satellite Services Space SuppliersSpace Service User Support Consumer Services Non-Satellite Industry
2013 2016

vi
marketing expenses and for royalties for films and other content. We also exclude the value of derivate products from space activities, such as data analytics products for which Earth observations are just one input, like counts of cars in parking lots taken from satellites that are then correlated with retail sales data. As a result, STPI’s estimates for the value of satellite services are roughly $80 billion less than those of SIA and the Space Foundation for 2016.
• STPI has refined its estimates of the value of the space service user supportindustry to only count the full value of a good or service if its primary purpose isto receive or use signals from space services. For a product that may receive oruse signals from space as just one of many functions, such as cell phones thatreceive GNSS data, we only count the value of the microchips and othercomponents that make the reception of signals from space possible, not the fullcost of the piece of equipment. For 2016, this methodology results in roughly a$70 billion difference between the STPI estimate for revenues from the spaceservice user support industry and those of SIA and the Space Foundation.
Figure ES-2 shows how these differences in estimation lead to the differences in STPI’s estimates and those of other organizations for 2016.
Sources: STPI estimates; SIA 2017; Space Foundation 2017
Figure ES-2. Decomposition of Differences between SIA, Space Foundation, and STPI Estimates of the Size of the Space Economy in 2016
0
50
100
150
200
250
300
350
400
SIA Space Foundation STPI No SupplierRevenues
STPI RestrictiveDefinition
STPI RefinedEstimates
Government Expenditures Satellite Services Space Suppliers Space Service User Support

vii
Future Projections Several organizations have used estimates of the current size of the space economy to
project its future size. Projections for 2040 (2045 in the case of Bank of America) range from a forecast of $926 billion by the United Bank of Switzerland (UBS) to Goldman Sachs’s “multi-trillion” dollar space economy (Figure ES-3). U.S. Government officials appear to have drawn on these projections in speeches in which they refer to a “trillion dollar space economy.”
Although detailed breakdowns of these projections by subsector are available for only two of the five, differences in the composition of the forecasts and forecasts of activity by subsectors can be large. One estimate includes second order economic effects stemming from an increase in the number of internet users made possible by space-based internet, while another does not. For the organizations that provided breakdowns, the largest increases in the size of the space economy come from increased demand for and use of internet services from space.
STPI finds the projections and the annualized growth rates (4 to 10 percent growth per year) to be ambitious based on current trends. By way of comparison, average annual increases in the size of the space economy between 2013 and 2016 as estimated by SIA and the Space Foundation were 2.0 and 2.6 percent, respectively, and only 0.7 and 0.3 percent, respectively, in constant prices, substantially less than those from these projections.

viii
Sources: UBS 2018; Morgan Stanley Research 2017; U.S. Chamber of Commerce 2018; Bank of America Equity Research 2017; Goldman Sachs Equity Research 2017 Note: We represented Goldman Sachs “multi-trillion” forecast as $3 trillion.
Figure ES-3. Projections of the Size of the Future Space Economy
The space industry is a substantial, innovative component of the global and U.S. economies. However, we caution policy makers not to premise policy decisions on a broad definition of the size of the economy or optimistic forecasts. Any government decision related to supporting the growth of the space economy should be robust to predictions of the size of the space economy; they should not be predicated on a single vision of its future size. As the U.S. Government seeks to foster the development of the U.S. commercial space industry, it should focus its support on those subsectors that will benefit most from government support. These include those that hold a public good component—such as space science and deep space human exploration—as well as others where government support may help to reach a tipping point with respect to commercial viability like launch services.
0
500
1000
1500
2000
2500
3000
3500
2016 2040 2016 2040 2016 2040 2016 2045 2016 2040
UBS Morgan Stanley U.S. Chamber ofCommerce
Bank of America Goldman Sachs
Billi
ons o
f dol
lars
Satellite Internet Ground equipmentDirect broadcast TV Government ExpendituresOther Space Activities Second-order effects from Internet services

ix
Contents
1. Introduction .................................................................................................................1 A. Purpose ................................................................................................................3 B. Methodology .......................................................................................................3
1. Definitions and Scope ...................................................................................3 2. Composition of the Space Economy .............................................................4 3. Sources of Data and Analytic Approach .......................................................5
2. Estimates of Economic Output Associated with Space ...............................................9 A. Space Services Government Expenditures ........................................................10
1. U.S. Government .........................................................................................10 2. Foreign Governments ..................................................................................11
B. Commercial Sales of Goods and Services Produced in Space ..........................13 1. Satellite Services .........................................................................................14 2. Earth Observations ......................................................................................18 3. Commercial Space Travel ...........................................................................18 4. Manufacturing in Space ...............................................................................18
C. Space Supplier Industry .....................................................................................19 1. Satellites and Other Spacecraft ....................................................................19 2. Launch Services ..........................................................................................21 3. Launch Insurance ........................................................................................21
D. Space Service User Support Industry ................................................................22 1. Global Navigation Satellite Systems ...........................................................22 2. Consumer Receiving Equipment Other Than GNSS ..................................24 3. Network Equipment ....................................................................................24
3. Comparing STPI Estimates with Other Estimates .....................................................27 A. Differences with Other Estimates ......................................................................27 B. Why Are These Differences So Large? .............................................................29 C. Limitations of Our Estimates ............................................................................31 D. Summary ...........................................................................................................32
4. Projections of the Future Size of the Space Economy ..............................................33 A. Projected Size ....................................................................................................33 B. Methodologies ...................................................................................................34
1. UBS .............................................................................................................34 2. Morgan Stanley ...........................................................................................34 3. U.S. Chamber of Commerce .......................................................................35 4. Bank of America .........................................................................................35 5. Goldman Sachs Equity Research ................................................................35
C. Comparison of Projections ................................................................................35

x
D. Observations ......................................................................................................38E. Summary ...........................................................................................................41
References ....................................................................................................................... A-1 Abbreviations ...................................................................................................................B-1

1
1. Introduction
Through its National Space Policy, the United States has “committed to encouraging and facilitating the growth of a U.S. commercial space sector that supports U.S. needs, is globally competitive, and advances U.S. leadership in the generation of new markets and innovation-driven entrepreneurship” (White House 2010). This commitment has persisted across administrations, and has the support of both Congress and the National Aeronautical and Space Administration (NASA). For the U.S. Government to develop effective policies to foster the growth of the space economy and, in particular, sharpen its policies to support commercialization of the sector, policy makers need to have a clear idea of the space economy’s size and composition.
A number of organizations have estimated the size, composition, and possible growth of the U.S. and global space economies. The Space Foundation and the Satellite Industry Association (SIA) estimate the total size of the global space economy in 2017 to be $383.5 billion and $360 billion, respectively (Space Foundation 2018; SIA 2019).2 The Organisation for Economic Co-operation and Development’s (OECD’s) most recent estimate of the size of the global consumer space economy was $256 billion in 2013 (OECD 2014).3
Estimates of the total value of the global space economy are used by governments, companies, and private investors to make decisions on space policies, budgets, and investments. For example, in remarks introducing and justifying the Department of Commerce’s consolidation of many government commercial space activities into a single Office of Space Commerce, Secretary of Commerce Wilbur Ross stated “Space commerce is already a $339 billion business and will become a trillion dollar one sooner than anyone realizes” (Ross 2018).4 Congressional testimony by William Shelton, the former commander of U.S. Air Force Space Command, cited the Space Foundation’s estimate of the global space market and the reach of space products in daily life as justification for an increased military deterrence posture in space (Shelton 2017). Government documents, such as the Federal Aviation Administration’s (FAA’s) Annual Compendium of Commercial Space Transportation, draw on these estimates to size the current and likely
2 Estimates published by the Satellite Industry Association are generated by the Bryce Group (formerly the Tauri Group).
3 The OECD’s $256 billion estimate does not include government spending. Including the OECD’s separate estimate of government space budgets raises this total to $321 billion in 2013.
4 The $339 billion number appears to come from the SIA’s estimate of the global space industry in 2017 (SIA 2017).

2
future development of the sector (FAA 2018). These estimates have been cited by Congress as an input into making decisions about budgets and policy for space (House Committee of Transportation and Infrastructure 2018).
Although these estimates produce different values for the size of the global space economy based on differing data sources, they primarily agree on what activities should be counted: government expenditures on space; revenues from goods and services provided from space; revenues from manufacturing and operating space hardware (e.g., satellite and launch vehicles); and sales of global navigation satellite systems (GNSS) and other equipment for receiving signals from space. However, what is included in some of these categories can be expansive. For example, some have gone so far as to include all commercial uses of GNSS, like Uber’s car ride services, as part of the space economy.
Expansive definitions have their uses, including helping investors identify fast growing companies among diverse market segments or showing the public how government expenditures can affect different sectors of the economy. They can also be used to identify sectors of the economy that are highly dependent on services provided from space, such as GNSS. However, to inform public policy to foster the growth of the commercial space sector, estimates that include downstream activities not directly related to activities in space may mislead policy makers. An expansive definition of the space economy may muddy policy debates on what specific activities governments should support to meet its policy goal of “facilitating the growth of a U.S. commercial space sector.” Although businesses that depend on GNSS like Uber contribute to increased economic output, they are not space industries according to our (and most) definitions. If government policy is to support the development of a commercial space manufacturing industry, they should be targeted on companies that are developing new types of satellites or launch vehicles; they should not include measures targeted at supporting Uber. For the purpose of government policy and for investors in space companies, in our view a narrower definition of the space economy, confining space activities to those that are undertaken in space for the purposes of exploring and utilizing space, provides a more useful perspective for making policy decisions or investments than do broader definitions.
In addition to providing estimates of the size of the space economy, we also assess projections of the potential future size of the space economy. Several investment banks and other economic institutions, including Bank of America Merrill Lynch, Morgan Stanley, Goldman Sachs, and United Bank of Switzerland (UBS), and the U.S. Chamber of Commerce, have projected the future size and shape of the space economy to help inform investors about prospects for space companies. For example, Morgan Stanley has projected that the space economy would grow from $350 billion in 2016 to $1.1 trillion by 2040 (Morgan Stanley Research 2017). These projections have been used by U.S. Government officials to encourage private investors to invest in space and to guide government policy

3
(Ross 2018). If policy makers and investors employ such projections to make decisions, they would benefit from an assessment of the basis for these projections.
A. PurposeThe purpose of this report is to provide more restrictive estimates of the size of the
space economy than are currently employed. It does so by adopting a definition of the space economy that only includes the value of goods and services provided to governments, households, and businesses from space or used to support activities in space; it excludes activities that are enabled by space, but are primarily generated terrestrially. Federal, State, and local governments support many economic activities through economic policy instruments. Government policies to develop the U.S. commercial space sector have focused on fostering the production of goods and services for space or that are produced in space. For example, NASA has supported the development of a commercial launch industry in the United States through its Commercial Orbital Transportation Services program. It has not provided funding to Uber or other users of GNSS signals. Our more tailored estimates should help government policy makers develop better policies to foster the growth of commercial activities for or in space. For much the same reasons, we review current projections of the space economy, although we do not generate alternative projections. These critical examinations of the current estimates and future projections of the space economy should help government policy makers better target policies to support the growth of the commercial space sector and help investors and entrepreneurs interested in space to better assess the current and potential future extent and size of markets focused exclusively on space.
B. Methodology
1. Definitions and ScopeThe terms space market, commercial space sector, space industry, and space
economy are frequently used to describe the network of buyers and sellers—including governments—that purchase or produce goods or services in space for sale on Earth or that purchase or produce goods and services on Earth for use in space. In this report, we use space economy to encompass government as well as private sector activities in space. We use the term space industry to describe those companies and other organizations that produce goods and services in or for space.
In our analysis, we distinguish between final demand and derived demand for space products. Companies either sell products directly to end users or produce and sell intermediate goods and services used to produce those end-use products. Purchases of goods and services by end users are considered final demand. Demand for intermediate goods and services and factors of production used to produce end use products is derived

4
from final demand; and is referred to as derived demand. Demand for new satellites from satellite manufacturers derives from final demand by governments, businesses, and households for the services satellites provide: Earth observations, telecommunications, or direct broadcast television. Without demand for these services, satellite manufacturers would have no market for their wares. Demand for satellite launch services, in turn, derives from satellite operators’ need to place satellites in orbit. Sales by companies satisfying derived demand are limited by the sales of the end use products that generate demand for their products: over time sales of these intermediate goods cannot exceed the value of sales of the final products in which they are used. Figure 1 provides an illustration of these concepts.
Source: Crane et al. (2019)
Figure 1. Illustration of Final Demand and Derived Demand for Space Services
2. Composition of the Space EconomyFor our analysis, we split the space economy into four sets of activities:
1. Government expenditures on space: government expenditures on activities inspace, such as human space exploration or military space programs.
2. Space services: expenditures by households and businesses on servicesgenerated in space for use on Earth or in space, such as broadband internetprovided by satellites.
3. Space supplier industry: sales of goods and services such as satellites, spacelaunches, and ground stations, which make possible the achievement of

5
government space missions or the production of goods and services in space for sale on Earth. Demand for these products comes from government space missions or non-governmental satellite operators, and as such, is derived demand.
4. Space service user support industry: sales of products—such as consumer satellite TV dishes, GNSS hardware and services—that are needed to utilize space services. As with the space supplier industry, demand for products in this category is a derived demand of the space services industry. Unlike the space supplier industry, purchases of goods and services in this category are often made directly by the consumer and hence are not already captured in purchases from government space budgets.
3. Sources of Data and Analytic Approach
a. Size of the Space Economy To develop our estimates of the size of the global space sector, we first reviewed the
methodologies and estimates produced by SIA in its annual State of the Satellite Industry Report,5 the Space Foundation’s The Space Report, and analyses by the OECD, three of the most highly regarded sources of information and data on the space economy. The State of the Satellite Industry Report provides information on annual sales of satellite services, production of satellites, number of launches, the value thereof, and other information related to the satellite industry and the space economy more broadly. The Space Report is an annual publication of the Space Foundation, a non-profit organization whose mission is “to inspire, educate, connect, and advocate on behalf of the global space community” (Space Foundation n.d.). The Space Report provides an annual update on space products and services, the space economy, space infrastructure, and the space workforce. The section on the space economy provides statistical information on expenditures and revenues of various entities engaged in purchasing and providing goods and services pertaining to space. The OECD does not publish annual estimates of the size of the space economy, but does provide estimates every few years. It provides detailed explanations of its methodologies (OECD 2012).
In addition to using estimates of the value of certain space activities made by SIA and the Space Foundation, we tapped primary sources for information on space revenues and government expenditures on space using government documents and budgets. We also used annual reports of satellite operators and other companies in the space industry, and
5 The State of the Satellite Industry Report is prepared by the Bryce Group (formerly the Tauri Group
Space and Technology).

6
publications from industry groups. Drawing on this information, we developed our own estimates of the value of the four sets of activities described above.
In this report, we provide two estimates for the space economy: one for 2013 and one for 2016. We chose these two years to make comparisons because 2013 was the latest year for which an estimate of the size of the space economy by the OECD was available and because 2016 was the last year for which industry data needed to understand the total market, especially primary data on GNSS hardware sales, were available.6
SIA, the Space Foundation, and the OECD have adopted a broad definition of what constitutes the space economy. For example, both SIA and the Space Foundation use the total revenue of companies like DirecTV or DISH Network for their estimates of the value of direct-to-home satellite television broadcasts. In contrast, we only ascribe the value of satellite transmissions for direct broadcast TV to the space economy because those are the services generated from space for direct broadcast TV. We exclude from our estimates of the size of the space economy costs that direct TV broadcasters incur for licensing fees paid to Hollywood or Bollywood studios, marketing expenses, and other such activities. In the case of DISH Network, the company’s imputed revenues from space (the costs and expenses associated with purchasing and operating satellites and sending and receiving transmissions from space) were approximately 5 percent of total revenues in 2016, whereas the costs and expenses associated with programming and other subscriber-related expenses were approximately 60 percent (DISH Network 2017).
We also exclude the value of derivate products from our estimates (e.g., data analytics products for which Earth observations are just one input like counts of cars in parking lots taken from satellites that are then correlated with retail sales data). Because we are only interested in revenues for services generated in space or by demand from space, we confine our estimates to payments for Earth observations or to the costs of satellites to collect those observations, not the value of integrating databases and producing and marketing analytical tools, which take place on Earth.
We do not add the value of the sales of the space supplier industry to the space economy so as to avoid double counting. Government expenditures and some part of satellite operator revenues fund all purchases from the space supplier industry. Every sale by the space supplier industry has a corresponding expenditure by governments or satellite operators. Counting both the purchases and the revenues results in double counting.
6 We have chosen to present all information in nominal dollars of the year in which the data are reported.
We made this decision to make it easier for readers to find the numbers in the referenced publications.

7
a. Size of the Projections Several institutions have used these estimates of the current size of the space economy
to project its future size. Chapter 4 reviews projections made by five organizations—four investment banks (UBS, Morgan Stanley, Bank of America Merrill Lynch, and Goldman Sachs) and the U.S. Chamber of Commerce. STPI assesses these projections based on publicly available versions of these reports, but does not generate its own projections.


9
2. Estimates of Economic Output Associated with Space
As discussed above, we break the space economy into four categories: government expenditures on space, space services, the space supplier industry, and the space user support industry.
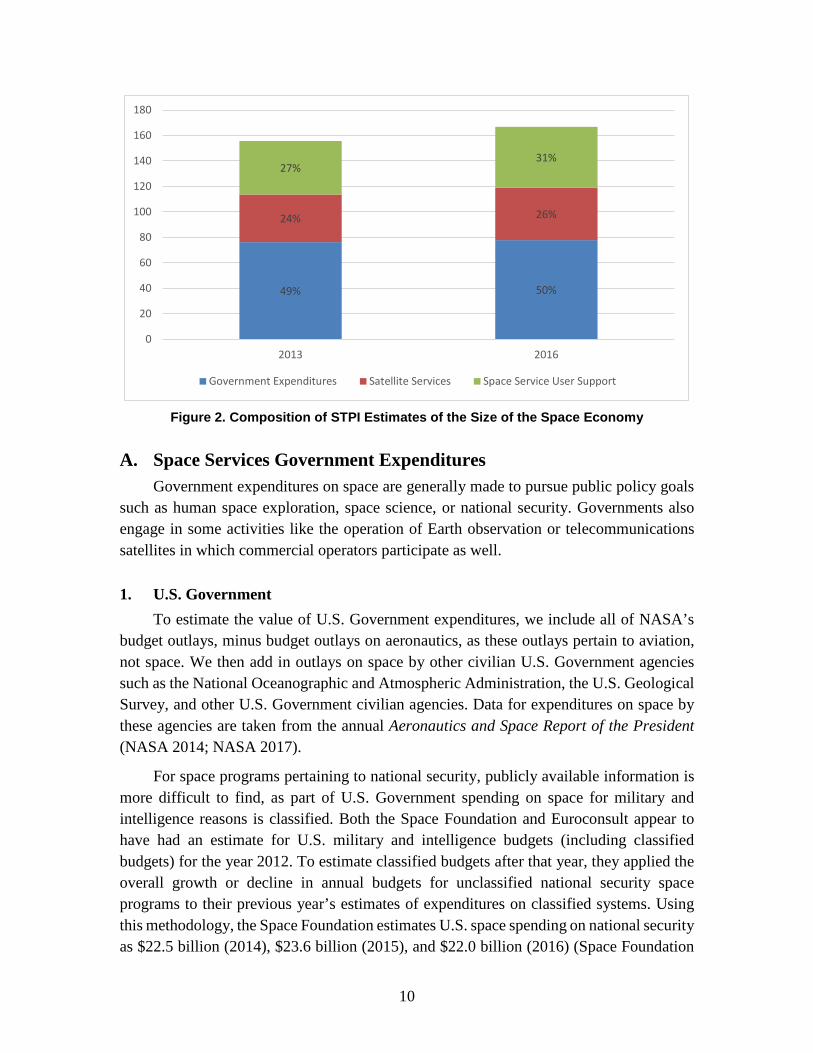
Based on our estimates of the value of the three categories we include in our estimates of the size of the space economy (government expenditures on space, space services, and the space user support industry), we estimate that the total value of goods and services from space was $155.7 billion in 2013 and $166.8 billion in 2016 (Table 1). These totals constitute the total final demand for goods and services generated in space or needed to receive these services. Notably, we do not include the value of the space supplier industry in our total. As discussed above, the purchases of space goods and services by governments and the satellite services industry equal the sales of the space supplier industry. Adding both categories would result in double counting.
Figure 2 presents the percentage of the total space economy each category comprises. Estimates of the value of each of the categories are discussed in detail in the sections below.
Table 1. STPI Estimates of the Size and Composition of the Space Economy
Billions of Dollars Category 2013 2016
Government expenditures $76.3 $77.8 Satellite services $37.4 $41.1 Space service user support industry
$42.0 $47.9
Estimated value of the space economy
$155.7 $166.8
Space suppliers industry $25.8 $24.4
10
Figure 2. Composition of STPI Estimates of the Size of the Space Economy
A. Space Services Government Expenditures Government expenditures on space are generally made to pursue public policy goals
such as human space exploration, space science, or national security. Governments also engage in some activities like the operation of Earth observation or telecommunications satellites in which commercial operators participate as well.
1. U.S. Government To estimate the value of U.S. Government expenditures, we include all of NASA’s
budget outlays, minus budget outlays on aeronautics, as these outlays pertain to aviation, not space. We then add in outlays on space by other civilian U.S. Government agencies such as the National Oceanographic and Atmospheric Administration, the U.S. Geological Survey, and other U.S. Government civilian agencies. Data for expenditures on space by these agencies are taken from the annual Aeronautics and Space Report of the President (NASA 2014; NASA 2017).
For space programs pertaining to national security, publicly available information is more difficult to find, as part of U.S. Government spending on space for military and intelligence reasons is classified. Both the Space Foundation and Euroconsult appear to have had an estimate for U.S. military and intelligence budgets (including classified budgets) for the year 2012. To estimate classified budgets after that year, they applied the overall growth or decline in annual budgets for unclassified national security space programs to their previous year’s estimates of expenditures on classified systems. Using this methodology, the Space Foundation estimates U.S. space spending on national security as $22.5 billion (2014), $23.6 billion (2015), and $22.0 billion (2016) (Space Foundation
49% 50%
24% 26%
27%31%
0
20
40
60
80
100
120
140
160
180
2013 2016
Government Expenditures Satellite Services Space Service User Support

11
2017). This approach may not generate accurate estimates, as the cancellation or start of a single unclassified program could result in a swing of 10 percent or more in total spending, and may have no bearing on changes in expenditures on classified programs.
We estimate U.S. Government expenditures on space by the Department of Defense (DOD) and the intelligence agencies using a different approach. In 2013, DOD changed its reporting method for its annual appropriations and outlays in the annual Aeronautics and Space Report of the President. This change in methodology reduced the estimated budget authority for 2013 from the 2012 report of $25.555 billion to $10.818 billion in actual budget authority in the 2013 report. Later years’ reports noted that the new methodology for calculating the space budget does not include classified military or intelligence spending, implying that the pre-2013 numbers were for the entire national security space budget (both classified and unclassified). Taking the average of the publicly available budget outlays for national security space from FY 2010–FY 2012, which include classified programs ($24,142 million, $25,924 million, $26,457 million, respectively), yields $25.5 billion, which is approximately the total projected budget authority in FY 2013 after accounting for sequestration (NASA 2014). We therefore chose to use $25.5 billion for 2013 for our estimate for that year. Because we have no additional information, we used this average for our 2016 estimate as well (Table 2). This estimate of $25.5 billion is roughly $4 billion greater than the Space Foundation’s estimate for national security space funding in FY 2013 of $21.7 billion.
2. Foreign Governments Euroconsult, the Space Foundation, and the OECD have collected budgetary
information on expenditures on space for all countries with substantial space programs that make these data publicly available. For countries with major space programs that provide little public information on their civil expenditures on space, these organizations provide estimates. In some instances these organizations’ estimates differ slightly, as many countries only publish aggregate statistics on budgetary categories in which spending on space is embedded and do not break out spending on space science from their overall budgets for research. In addition, no countries provide information on classified military space spending. There are also small differences between final outlays and budgets, depending on the year. For this report, unless otherwise noted below, we chose to use the budgetary numbers as aggregated by Euroconsult for 2013, due to the completeness of their estimates, and by Space Foundation’s Space Report for 2016, as we did not have access to Euroconsult’s data for this year. Space Foundation bases its estimates for military spending on space on Euroconsult data.
Russia does not publish official annual budgets for space, but sometimes provides information on civilian space expenditures through announcements or statements by Russian officials. For example, Russian sources sometimes provide aggregate numbers for

12
budgetary expenditures on space for a multi-year period, rather than an annual budget. The director of Russia’s space agency, Roscosmos, periodically states the annual budget for the organization in speeches or other public pronouncements. Drawing on these and other sources and using its own methodologies, Euroconsult estimated Roscosmos’s budget in 2013 to be 203 billion rubles ($6.38 billion) and military space spending at 145 billion rubles ($4.55 billion) (Euroconsult 2014). The Space Foundation estimated Roscosmos’s budget at 165 billion rubles ($5.18 billion) for 2013; it did not provide an estimate for Russia’s military space budget. The Space Foundation states that its estimate for total military space spending for all countries except for the United States is based on Euroconsult data. The OECD’s The Space Economy at a Glance 2014 stated that Russia’s total budget for civil and military space in 2013 was $5.3 billion (OECD 2014). For this study, we use the Space Foundation’s numbers for Russia’s civil space budgets of $5.18 billion for 2013 and $1.63 billion for 2016 because the sources of these numbers were personal communications by the Space Foundation with the Russian Embassy or official estimates by the director of Roscosmos, Igor Komarov. We use Euroconsult’s data for Russia’s military spending on space.
China also does not make its budgets for civil and military space spending publicly available. Because of the lack of published annual budgets, the three organizations make their own estimates for China’s spending on space, which are quite different. The OECD estimated China’s civil and military space budget to be $6.1 billion in 2013 (OECD 2014); Euroconsult estimated China’s civil and military space budget at $4.0 billion dollars for the same year (Euroconsult 2014). Euroconsult’s estimate for China is derived from partial information on estimated program costs from various publications, trends in spending on science and technology in China, and comparisons to similar space programs in other countries (Euroconsult 2014). The Space Foundation estimates how much the Chinese government spends on space by taking the average percentage of GDP nations other than the United States or Russia spend on their civil space programs and multiplying China’s GDP by that percentage. Using this methodology, the Space Foundation estimates that China’s civil space program budget was $3.5 billion in 2013 (Space Foundation 2013). As with its estimates for Russia, the Space Foundation does not estimate a military space budget for China, but notes that unnamed analysts estimate that civil and commercial space spending may compose two-thirds of China’s total space budget (Space Foundation 2013). Because Euroconsult’s methodology appears to use a wider variety of sources and takes into account physical developments in China’s space program, we have chosen to use its estimate for 2013. To generate an estimate of China’s spending on space for 2016, we assumed that the annual rate of growth in China’s space program between 2012 and 2013 listed in Euroconsult’s 2013 report remained the same for the period from 2013 and 2016 and applied this rate of growth to the 2013 figure to estimate Chinese expenditures in 2016.

13
Table 2 shows our estimates. In comparison, for 2013, Euroconsult estimated total non-U.S. civil expenditures on space to be $23.9 billion and total non-U.S. military spending on space to be $9.5 billion, for a total of $33.4 billion. The Space Foundation estimated non-U.S. civil expenditures on space to be $21.7 billion and total non-U.S. military spending on space to be $10.3 billion, for a total of $32.0 billion. The OECD estimated total non-U.S space spending, civil and military, to be $25.0 billion.
Table 2. Government Space Budgets
Billions of Dollars Function 2013 2016
U.S. Government expenditures on space $44.3 $46.4 Non-military outlays $18.8 $20.9 Military and intelligence outlays $25.5 $25.5 Foreign government expenditures on space $32.0 $31.4 Non-military $22.5 $20.4 Military and intelligence $9.5 $11.0 Total $76.3 $77.8
Sources: NASA 2014, 2017; Euroconsult 2014; Space Foundation 2014, 2017 Notes: (1) U.S. budget authority for non-military space were $19.4 billion (2013) and $21.8 billion (2016) and for
unclassified national security space were $10.8 billion (2013) and $9.7 billion (2016). (2) We have chosen to present all information in nominal dollars of the year in which the data are reported.
We made this decision to make it easier for readers to find the numbers in the referenced publications.
B. Commercial Sales of Goods and Services Produced in Space Commercial space service companies generate revenues from sales of services like
direct broadcast television, satellite telecommunications, and Earth observations that are generated in space. These services may be sold to governments, households, and businesses. Currently, commercial space services primarily consist of revenues from sales of direct broadcast TV, telecommunications, and data and internet services. Earth observations provide the remainder of revenues from services from space. Future revenues from space tourism and manufacturing in space would fall into this category.
Our estimates of the value of goods and services produced in space include actual or imputed revenues from broadcasting signals for direct-to-home TV, satellite radio, satellite broadband, satellite telephone, fixed and mobile voice and data communications through satellites, commercial sales of Earth observations, and incipient revenues from space tourism and manufacturing in space. As noted above, we only include in our estimates the value of services provided from space, such as payments for the use of satellite transponders. We exclude the value of derivative products like financial and other
14
information linked to Earth observations data. For example, ESRI is a U.S.-based company that builds and sells mapping and spatial analytics software (ESRI n.d.). Earth observations data are only one component of this software; the bulk of ESRI’s value is generated by developing software and integrating many databases into its products, only some of which incorporate Earth observations. We do not include sales by companies like ESRI in our estimates, but do include the value of the Earth observations data on which ESRI draws for its products.
To calculate the value of commercial sales of goods and services produced in space, we draw on the estimates of the SIA (2014; 2017), the Space Foundation (2014; 2017), and the European Global Navigation Satellite Systems Agency (GSA 2015; 2017) for broadcast and other satellite services and Earth observations. We subtract from their estimates that portion of broadcast and other satellite services that is generated on Earth. To obtain information on the value of satellite broadcasting and telecommunications services, we also use data from the annual reports of satellite companies and information from the space commercial press.
1. Satellite Services Below, we estimate the size of the satellite services market divided by the market
segments listed in SIA’s State of the Satellite Industry: direct-to-home television broadcast, satellite radio, satellite broadband, fixed satellite services, and mobile voice and data.
a. Direct-to-Home Television Broadcast Services We estimate the value of direct-to-home satellite television broadcasts associated with
space by estimating the costs to satellite television broadcasters of purchasing satellite services for their broadcasts or providing those services themselves. In our estimate of the value of these services generated from space, we exclude the costs associated with purchasing broadcasting rights for the films and television shows, marketing satellite television services, or the costs of billing and collecting payment for services. For example, in 2016, DISH television reported a total revenue of $15.1 billion and total costs of $12.8 billion. DISH’s largest cost was $8.9 billion for subscriber-related expenses, including programing content. DISH leases transponders and buys satellite operations services from EchoStar Satellite Services; it also has some of its own satellites, which it pays EchoStar Satellite Services to operate. DISH reports the value of transponder and satellite operations services within its satellite and transmission expenses category of its annual report. In 2016,

15
the value of the services purchased by DISH was $727 million, 4.8 percent of total revenues.7
To estimate the value of satellite services for direct-to-home broadcast from space we examined the annual reports of three of the largest providers of direct-to-home satellite broadcasters, which in addition to DISH, include DirecTV (for 2013 only), and Sky, to identify their expenditures on satellite transmission, networks, and broadcast operations, including depreciation and amortization of space assets. We then converted those figures to a percentage of the companies’ total revenues. We found these three companies spent between 10 percent and 22 percent of revenue on space-related expenses with an average of 15.9 percent. We applied this average percentage to the total revenue for direct-to-home broadcasting report in SIA’s State of the Satellite Industry ($92.6 billion and $97.7 billion, for 2013 and 2016, respectively). Using this methodology, we estimate the value of direct-to-home television broadcast services from space to have been $14.8 billion in 2013 and $15.6 billion in 2016 (Table 3).
Table 3. Commercial Sales of Goods and Services Produced in Space
Billions of Dollars Function 2013 2016
Direct-to-home TV broadcast services $14.8 $15.6 Satellite radio $0.4 $0.5 Satellite broadband $1.7 $2.0 Mobile voice and data $2.6 $3.6 Fixed satellite services $11.8 $11.2 Managed services $4.6 $6.2 Earth observations $1.5 $2.0 Total $37.4 $41.1
Sources: STPI estimates; Space Foundation 2017; SIA 2014, 2017
Direct-to-home television broadcasts account for most of the total value of satellite
services as estimated by SIA (2017) and the Space Foundation (2014). Because we only include the value of the services generated in space—the transmission and reception of these services—our estimates of the value of direct-to-home television broadcasts and other satellite services are significantly lower than these estimates.
7 DISH Network’s satellite and transmission expenses line item includes some non-space activities in
addition to its satellite services, such as Sling TV, an internet streaming television service, so the actual value of space services procured by DISH Network is somewhat lower than this figure.

16
b. Satellite Radio In the United States and Canada, the sole provider of direct broadcast satellite radio
services is Sirius XM (Sirius XM Canada is partially owned by Sirius XM and relies on it for satellite broadcasts). In Europe, Eutelsat and some other direct-to-home satellite TV broadcasters also provide satellite radio services, but these companies do not break out satellite radio revenues in their annual reports. Because providers of satellite radio services outside of North America do not break out their revenue for these services, SIA’s estimate of direct broadcast satellite radio services appears to be limited to the revenues of Sirius XM; SIA appears to put non-North American satellite radio revenues under direct-to-home TV broadcasts.
Following SIA, we confine our estimates for radio satellite services to the operations of Sirius XM. Like SIA, we capture other radio satellite service revenues under other satellite service categories. Sirius XM had revenues of approximately $5 billion dollars in 2016 (Sirius XM 2017). It spent approximately $3 billion on items such as royalties, programming and content, marketing, and administrative activities. To estimate the value of Sirius XM’s space activities, we sum Sirius XM’s expenditures on satellites and transmissions; cost of equipment; engineering, design and development; and depreciation and amortization, for a total of $418 million in 2013 and $495 million in 2016. We use these numbers as our estimates of the value of satellite radio services provided from space.
c. Satellite Broadband According to SIA, satellite broadband brought in $1.7 billion in 2013 and $2.0 billion
in annual revenue in 2016 (SIA 2017). Many satellite companies provide enterprise broadband through very small aperture terminal networks. However, the two largest providers of consumer broadband are both in the United States: HughesNet and ViaSat Exede. This may change in coming years, as companies like OneWeb, SpaceX, and Astranis launch global satellite broadband constellations. As the costs of satellite broadband primarily relate to the transmission of data via space, we adopt SIA’s estimates of the total value of satellite broadband for our estimates. Several providers of satellite broadband do not breakout revenues of satellite broadband from other revenue streams; these revenues may be captured in either the direct-to-home satellite television broadcast services or fixed satellite services categories.
d. Mobile voice and data Many satellite companies provide fixed-to-mobile or mobile-to-mobile voice and data
services. This market sector is divided into several distinct market segments: satellite telephones, maritime data services, and aviation data services (e.g., in-flight internet or communications). The largest providers of these services are Inmarsat (annual revenues of approximately $1.3 billion in 2016, which provides mobile voice and data services to

17
aviation and maritime industries, enterprise users, and governments) and Iridium ($433 million in annual revenue in 2016, which provides satellite telephones). Other mobile satellite service providers include Thuraya, Orbcomm and Globalstar. These five companies had combined revenues of $1.9 billion in 2013 and at least $2.0 billion in 2016 (Thuraya’s revenue in 2016 was not made publicly available.). Additionally, several fixed satellite service companies, including Echostar, provide limited mobile satellite services, and other fixed satellite service providers, including Intelsat General and Telstra, resell mobile satellite services from major mobile satellite service operators (e.g., Iridium, Inmarsat). Because almost all of these revenues derive from services generated in space, we adopt SIA’s estimates of the value of mobile voice and data for our estimates: $2.6 billion in 2013 and $3.6 billion in 2016.
e. Fixed satellite services and managed services Fixed satellite service (FSS) providers operate satellites in geostationary orbit and
lease transponders for video, data, and voice transmission. In recent years, the distinction between FSS and other satellite market segments has blurred, as FSS operators sell capacity to other market segments (de Selding 2015). The revenues we include in this category come from companies that primarily provide telecommunications services, not direct broadcast television, satellite radio, consumer broadband, or mobile services. Because FSS companies make a large share of their revenue from selling to other satellite services companies, at least some of the revenue in this category has likely been double counted, as we have included these revenues under our estimates of the value of other categories.
In 2013, the largest 26 fixed satellite service operators had combined revenues of $11.8 billion, with five companies accounting for 71 percent of revenue: Intelsat, SES, Eutelsat, Telesat, and Sky Perfect JSat (de Selding 2015).8 We use this $11.8 billion figure for our 2013 estimate; it matches SIA’s estimate for this category. For our 2016 estimate, we used SIA’s estimate for this category, $11.2 billion.
Users of fixed satellite services (primarily governments and corporations) often do not purchase bandwidth on communication satellites directly, but rather contract with managed network services to connect remote facilities via satellite and other transmission methods. Many managed service providers sell turnkey systems that include on-site very small aperture terminals (VSAT), installation, and network management. Providers of managed services will often operate their own teleports to communicate with satellites owned and operated by fixed satellite service providers. As such, part of managed service providers’ costs are revenues for fixed satellite service operators. We use SIA’s estimates
8 Sky Perfect JSat’s revenue is split between direct-to-home television broadcasting (their largest revenue
stream) and fixed satellite services.

18
of revenues for satellite-related managed services, $4.6 billion in 2013 and $6.2 billion in 2016, although these figures likely double count some revenues (Table 3).
2. Earth Observations Our estimate of revenues from the Earth observations market segment includes only
companies with space operations. It excludes revenues from data analytics companies that buy images from Earth observation companies, which they then use to produce analytical products for their clients, as these products are created on the Earth, not generated in space. The largest Earth observations companies are Digital Globe, Planet, and Spire, but a number of new start-up companies are also entering the market. Digital Globe had net revenues of $613 million in 2013 and $725 million in 2016, with sales to the U.S. Government comprising $358 million and $462 million in 2013 and 2016, respectively (Digital Globe 2014; 2017). Because a large percentage of sales by Earth observation companies are made to governments, there may be some double counting between government expenditures and revenues from this category. However, the extent to which government purchases from private providers of remote sensing images comes from government space budgets is unclear. For example, such purchases by intelligence agencies or departments of agriculture are unlikely to be included in space budgets. As many Earth observations companies are start-ups, they do not release annual reports to the public. However, as a number of these companies are members of SIA, we use SIA’s State of the Satellite Industry numbers for the total revenue of this market segment. SIA’s estimates for revenue from Earth observations were $1.5 billion for 2013 and $2.0 billion for 2016 (SIA 2014; 2017).9
3. Commercial Space Travel Despite some advance sales by Virgin Galactic and SpaceX, no companies are
currently flying tourists to space. As we do not include advance sales as revenues for services that have not yet been delivered, we include no revenues for commercial space travel in our estimate of the size of the space economy.
4. Manufacturing in Space Made-in-Space, a U.S. company, has manufactured parts and plastic tools on the
International Space Station (ISS) for use on the ISS. To this point, sales have been small, on the order of a few thousand dollars. Made in Space and Fiber Optic Manufacturing in Space (FOMS) are proposing to manufacture optical fiber on the ISS. The Made-in-Space
9 Northern Sky Research reports $2.3 billion and $2.9 billion revenue for the Earth observation market
segment (Space Foundation 2013; 2017). However, these numbers include value-added services, such as information products and big data analytics.
19
apparatus to manufacture ZBLAN, a brand name for an exotic optical fiber, arrived on the station in July 2018; FOMS’s apparatus arrived in April 2019. Both companies plan on returning optical fiber drawn by the machine to Earth for sale. At this point in time, no product has yet been returned to Earth for sale, and therefore no sales are included in our estimates.
C. Space Supplier Industry We divide the value of goods and services produced by the space supplier industry
into satellite and other spacecraft manufacturing; launch vehicles and launches; insurance premiums, and space infrastructure: launch pads, and ground stations needed to launch and monitor satellites in orbit. The Bryce Group and the Space Foundation have engaged in an exhaustive effort to compile statistics on sales of satellites and launches. We use their data here. Because the revenues associated with the manufacturing and launching of spacecraft and launch vehicles are generated by sales to governments and satellite service companies, which are therefore covered in their expenditures, we do not include the numbers in this section in our total estimate of the space economy to avoid double counting.
1. Satellites and Other Spacecraft The primary markets for satellites are satellite communications companies; civilian
government agencies that purchase satellites for Earth observations, global positioning systems, meteorology, and science; and military and intelligence agencies that purchase satellites for communications, Earth observations, and intercepts. In the United States, Boeing; Lockheed Martin; Space Systems Loral (SSL) (now part of Maxar Technologies); and Northrup Grumman Innovation Systems (formerly Orbital ATK) have been the primary manufacturers of larger commercial satellites.10 In addition to Boeing and Lockheed Martin, Northrop Grumman, Raytheon, and Harris manufacture military and intelligence satellites. Major commercial and military satellite manufacturers headquartered outside the United States include Airbus Defence and Space, OHB SE, and Thales Alenia Space in Western Europe and JSC Information Satellite Systems in Russia. Several other countries also manufacture large satellites; of these, China, Israel, and Japan are among the most important.
According to SIA, sales of satellites ran $15.7 billion in 2013 and $13.9 billion in 2016, most of which were generated by sales of satellites to governments (Table 4). Sales of surveillance satellites to militaries are the largest single category of satellite sales. However, this category accounted for less than half of total satellite sales in 2016.
10 SSL was acquired by MacDonald Dettwiler or MDA, a Canadian company in 2012; MDA has since
become Maxar Technologies and is now also listed as a U.S. company.

20
Commercial communications satellites were the next largest category, followed by Earth observation and navigation satellites.
In addition to these sales of larger satellites, in recent years, small satellites, satellites weighing less than 180 kilograms, have emerged as a new market. This market remains small, less than $100 million annually in sales, less than one percent of the total satellite market by value (Lal 2017; SIA 2017). This market also includes nanosatellites, such as CubeSats, satellites that weigh less than 10 kilograms.
The Space Foundation uses Eurospace estimates for the value of spacecraft. Eurospace estimates include more items than SIA: the value of spacecraft for human space flight, primarily capsules for transporting supplies and cosmonauts to the ISS and satellites manufactured by universities and government facilities (Space Foundation 2017). According to Eurospace, the overall value of the market for spacecraft was $33.96 billion in 2013 and $32.942 billion in 2016 compared to $15.7 billion and $13.9 billion, respectively, according to SIA. The Space Foundation has published estimates of revenues from non-government satellite manufacturing, which ran $5.0 billion in 2013 and $4.8 billion in 2016 (Space Foundation 2013; 2017). Although these estimates fit within the SIA estimates, no single category in the SIA estimates matches these numbers.
Because SIA provides more detailed data, we have chosen to use SIA’s estimates for our study rather than those of Eurospace as published in the Space Foundation’s Space Report. However, because SIA’s data is for satellites only, we have added the Eurospace estimates of the value of spacecraft for human space flight to the SIA’s estimates. We have estimated these numbers off the graph published by the Space Foundation (Space Foundation 2017).
Table 4. Global Sales of Spacecraft by Function or Purchaser
Billions of Dollars Function 2013 2016
Navigation $0.6 $1.7 Military surveillance $4.8 $6.1 Scientific $1.3 $0.7 Earth observation services $1.6 $1.7 R&D $0.3 $0.1 Civil/Military communications $2.9 $0.8 Commercial communications $4.6 $2.2 Meteorology $0.2 $0.6 Total Satellites $15.7 $13.9 Human spacecraft $2.5 $2.5 Total for all spacecraft $18.2 $16.4
Sources: SIA 2014, 2017; Space Foundation 2013, 2017

21
2. Launch Services Eurospace estimates the total value of launch vehicles and launch services in 2013
and 2016 at $6.8 billion and $7.4 billion, respectively (Space Foundation 2017). This number includes both commercial and government (civil and military) launches. SIA estimates the value of commercially procured launches only to have been $5.4 billion in 2013 and $5.5 billion in 2016, with U.S. customers of launch services spending $2.4 billion and $2.2 billion, respectively (SIA 2017). We use the more inclusive Eurospace estimates for our analysis (Table 4).
Governments and commercial satellite and launch service providers purchase and operate ground equipment: launch pads, control centers, and communications systems that link launch vehicles and satellites to ground control. Launch pads have facilities for the final integration of components into launch vehicles, for integrating the payload with the launch vehicle, for fueling the launch vehicle, and for conducting maintenance prior to launch. Currently, launch pads are primarily owned and operated by national governments. In the United States, the Federal Government leases federally owned launch pads to commercial launch companies at cost. Several States have set up spaceports, but as of yet, many of these facilities have experienced little demand for their services. Costs associated with these properties are primarily borne by governments, and thus covered under government expenditures or are captured in estimates of sales of launch service companies.
Control centers have long lifetimes and are refurbished infrequently. With advances in computation and automation, the size of many control centers has shrunk. The costs for these systems are assumed to be covered under launch services.
Table 5. Global Purchases of Satellites, Launch Services, and Insurance Premiums
Billions of USD Function 2013 2016
Satellites and other spacecraft $18.2 $16.4 Launch Services $6.8 $7.4 Insurance Premiums $0.8 $0.6 Total $25.8 $24.4
Sources: Satellites—SIA; Launch services—Eurospace; Insurance Premiums—Space Foundation 2014, 2017
3. Launch Insurance Companies purchase launch insurance to defray losses should a payload be destroyed
during launch. We use Space Foundation’s estimates of the size of this market for our analysis: $800 million in 2013 and $600 million in 2016 (Table 5).

22
D. Space Service User Support Industry In addition to paying for satellite transmissions of telecommunications, direct-to-
home broadcast TV, and satellite internet services, households, governments, and businesses have to procure equipment to receive those signals. This equipment includes satellite television dishes, navigation chipsets in mobile devices, and satellite telephones. Revenues from space service user support industries reflect sales of this additional equipment needed to utilize services provided from space. These expenditures are in addition to expenditures on satellite services; they are not captured in those figures.
1. Global Navigation Satellite Systems GNSS are the backbone of position, navigation, and timing systems used by
governments, businesses, and households. The European Global Navigation Satellite Systems Agency (GSA) provides estimates and forecasts of global revenues from sales of such devices; revenues derived from GNSS augmentation services and other necessary software solutions and content (including digital maps); and added-value services directly attributable to GNSS (GSA 2017). According to the European Global Navigation Satellite Systems Agency, in 2016 global revenues from these activities ran about 107 billion euro or $118 billion.11 Of these revenues, about 47 billion euros or $52 billion were from sales of devices and augmentation services and 60 billion euros or $66 billion came from sales of added-value services (GNSS 2017). Following the GNSS Market Report, we provide estimates for sales of GNSS receivers and other equipment for automotive, aviation, rail, maritime, agricultural, surveying, and timing and synchronization uses. Table 6 below shows our estimates.
Because we are only interested in goods and services generated for space or in space, we only consider revenues from the sale of devices that receive GNSS signals from space, rather than value-added services that use GNSS, which are generated terrestrially. The numbers used in our estimates are derived from GSA data provided to us through a personal communication with staff of the GSA and data found in GSA’s GNSS Market Report. From the 2017 GNSS report, we use the global shipments of every GNSS device and the global revenue from the sales of that device to calculate the cost per device or per chip in 2016. Because we lack the same information for 2013, we use the same prices for devices for both 2013 and 2016. Because device costs have been declining, this approach may lead to some underestimation of the dollar value of sales of these products in 2013.
To estimate the value of sales of GNSS chips used in mobile devices, we drew on GNSS Market Report estimates of the value of GNSS chip sets in GNSS-enabled smartphones, tablets and other computers, digital cameras, sport and wearable devices, as 11 Euros converted into dollars using the 2013 average euro to dollar exchange rate of 0.753 euro per U.S.
dollar and 2016 average euro/dollar exchange rate of 0.904 euro per U.S. dollar (IMF 2018).

23
GNSS is not the main functionality of these devices. The cost of chips ranged from approximately €1 to €2, with a weighted average of €1.09 ($1.21). Following the GNSS Market Report, we include the retail cost of personal tracking devices and search and rescue devices, including personal locator beacons and emergency locator transmitters. We do not include data revenue from locational services from smartphones and tablets nor do we include the GNSS share of software applications (such as the value GNSS brings to Uber) because, as noted above, these services are generated terrestrially, not in space.
To estimate the value of GNSS receivers in the automotive sector, we used the retail value of the system or the retail value of an equivalent stand-alone GNSS device. For example, as many built-in vehicle GNSS devices include additional functionality beyond navigation, we set the value of in-vehicle systems to that of personal navigation devices, approximately one-third of the in-vehicle device price for the entire unit. As with the first category, for devices where GNSS is just one of many subsystems and not the primary functionality of the device, such as emergency eCall systems, we used the cost of the GNSS chip. For GNSS products where software is the major cost driver of a system, such as fleet management systems, we included just the cost of the on-board GNSS unit.
Within the aviation industry, the GNSS Market Report includes the value of the GNSS systems used in commercial, regional, general, and business planes, as well as stand-alone devices enabled by GNSS used in the aviation industry, such as search and rescue devices and the GNSS-part of automatic surveillance-broadcast systems. For rail, the GNSS Market Report includes the value of GNSS devices used for rail asset management (e.g., railroad cars), signaling and train control applications, passenger information systems, and driver advisory systems. GNSS devices for maritime uses include both navigation, which is used by the vessel, and positioning, which is used by outside parties to track the vessel. For each of these market segments, we included the retail cost of the full system, regardless of whether GNSS was just one of many functionalities.
For agriculture, the GNSS Market Report includes the retail value of the GNSS receivers, maps, and navigation software. We follow the GNSS Market Report, with one exception: although we included tractor guidance systems, we excluded automatic steering systems from the agricultural category, as most of the cost of the latter system is due to components unrelated to GNSS. For surveying, we were unable to separate expenditures on software from those on GNSS devices, so we included the total estimate from the GNSS Market Report. We did the same for estimates of the value of revenues from GNSS related to timing and synchronization. Data for 2013 were unavailable for this category, so we took the average rate of growth in number of units sold for other industrial categories (i.e., not personal or automotive devices) between 2013 and 2016 and applied it to this market segment to generate an estimate for 2013.

24
Table 6. Equipment to Receive Satellite Transmissions
Billions of Dollars Function 2013 2016
GNSS equipment total $17.6 $19.1 Personal devices $2.6 $3.0 Automotive $9.0 $8.6 Aviation $1.0 $0.9 Rail $0.1 $0.1 Maritime $0.9 $1.0 Agriculture $0.5 $0.6 Surveying $2.4 $3.4 Timing $1.0 $1.4 Consumer equipment other than GNSS $15.6 $18.5
Network equipment $8.8 $10.3 Total $42.0 $47.9
Sources: GNSS 2015, 2017; STPI estimates; SIA 2014, 2017 Notes: (1) Euro figures were converted into dollars using average annual dollar/euro exchange rates (IMF n.d.). The sum of subcategories may not equal total numbers due to rounding. (2) Data for the timing category were unavailable for 2013 so we derived our own estimate based on the share of timing in total revenues in 2016, which we applied to the 2013 number with an adjustment for the absence of timing revenues in the total for 2013.
2. Consumer Receiving Equipment Other Than GNSS Consumers of satellite services purchase satellite TV dishes, radios designed to
receive satellite transmissions, satellite telephones, and other mobile satellite terminals. Although equipment in this market segment is less capable than enterprise-grade network equipment, estimated below, sales volumes in this category are much larger than for network equipment. According to industry surveys conducted by the SIA, global sales of these products totaled $15.6 billion in 2013 and $18.5 billion in 2016 (Table 6).
3. Network Equipment Communications systems and other network equipment consists of all ground stations
needed by businesses and governments to use communication networks that rely on satellites for at least some part of transmissions. Equipment in this category includes gateways, network operations centers, VSAT, satellite news gathering equipment, and flyaway antennas (SIA 2017). Gateways are used for high-throughput data transmissions to and from satellites. Network operation centers manage data transmissions for large networks. Equipment in this category is also used in applications such as satellite backhaul for cell towers.

25
The market for network equipment is large, as it is used for all activities in the space services sector. For example, in order for companies and governments to communicate with off-site locations via satellite, either through their own networks or through networks run by managed network service providers, remote locations must be outfitted with VSAT. As shown in Table 6, total sales of network equipment ran $8.8 billion in 2013 and $10.3 billion in 2016 (SIA 2017). Of this, global hardware revenues for VSAT totaled approximately $1.0 billion in both 2013 and 2016 (COMSYS 2017). As some of this equipment was purchased by satellite service providers or their suppliers, there is likely some double counting between the space services industry estimates and this category.


27
3. Comparing STPI Estimates withOther Estimates
As detailed in Chapter 2, STPI estimates the total value of the space economy as $155.7 billion in 2013 and $166.8 billion in 2016. These totals constitute our assessment of the total amount of final demand for goods and services generated in space or needed to receive these services. This chapter places our estimates alongside others in the community, and explains why our numbers differ from other estimates.
A. Differences with Other EstimatesAs noted in Chapter 1, the OECD estimated the size of the consumer space economy
at $256 billion in 2013; $321 billion, if one includes government budgets.12 The Space Foundation estimated the size of the global space sector at $314 billion and $329 billion, respectively, for 2013 and 2016; SIA estimates the size of the global space sector to be $320 billion in 2013 and $339 billion in 2016 (Space Foundation 2013; Space Foundation 2017; SIA 2014; SIA 2017). Tables 7 (for 2013) and 8 (for 2016) present a breakdown of each estimate for comparison.
12 The OECD lists government expenditures as $64.4 billion and commercial revenues generated by the space economy as $256.6 billion (OECD 2014). The OECD report does not explicitly add government expenditures and commercial revenues for a total estimate of the space economy, which is reflected in the table. If one includes government expenditures, the total estimate is $321 billion.

28
Table 7. Estimates of the Size and Composition of the Space Economy in 2013
Billions of Dollars
Category STPI SIA Space
Foundation OECD Government expenditures 76.3 --- 74.1 64.4 Non-Satellite Industry (includes government expenditures and GNSS chipsets) --- 124.8b --- --- Satellite Services 37.4 118.6 122.6 21.6 Space Service User Support Industry 42.0 55.5 109.6 ---c
Consumer services (includes direct-to-home broadcasts and consumer and enterprise equipment) --- --- --- 149.6 Subtotal 155.7 298.9 306.3 235.6 Space Suppliers Industry [25.8]a 21.1 7.9 85 Estimated value of the space economy 155.7 320 314.2 321
Sources: STPI estimates; SIA 2014; Space Foundation 2014; OECD 2014 Notes: a. STPI does not include the space supplier industry number in the total estimate of the space economy, as
the funds to purchase this sector’s products are already captured in government budget expenditures or from the revenues of satellite operators derived from the sale of satellite services.
b. SIA did not explicitly estimate government expenditures for 2013, but noted the total size of the space economy was $320 billion (SIA 2014). Based on SIA’s reports from later years, the market activities that compose the non-satellite industry are government missions and GNSS chipsets. We calculated SIA’s implicit estimate of the non-satellite industry by taking the difference of their total estimate and their estimate of the size of the satellite industry.
c. The OECD’s space supplier industry estimate includes the entire space manufacturing supply chain; it consists of the sales of prime contractors, component suppliers, integrators, and downstream equipment (e.g., consumer satellite dish) manufacturers. The OECD divides the goods and services of the space service user support industry category, as defined in this study, between consumer services and space supplier industry categories.
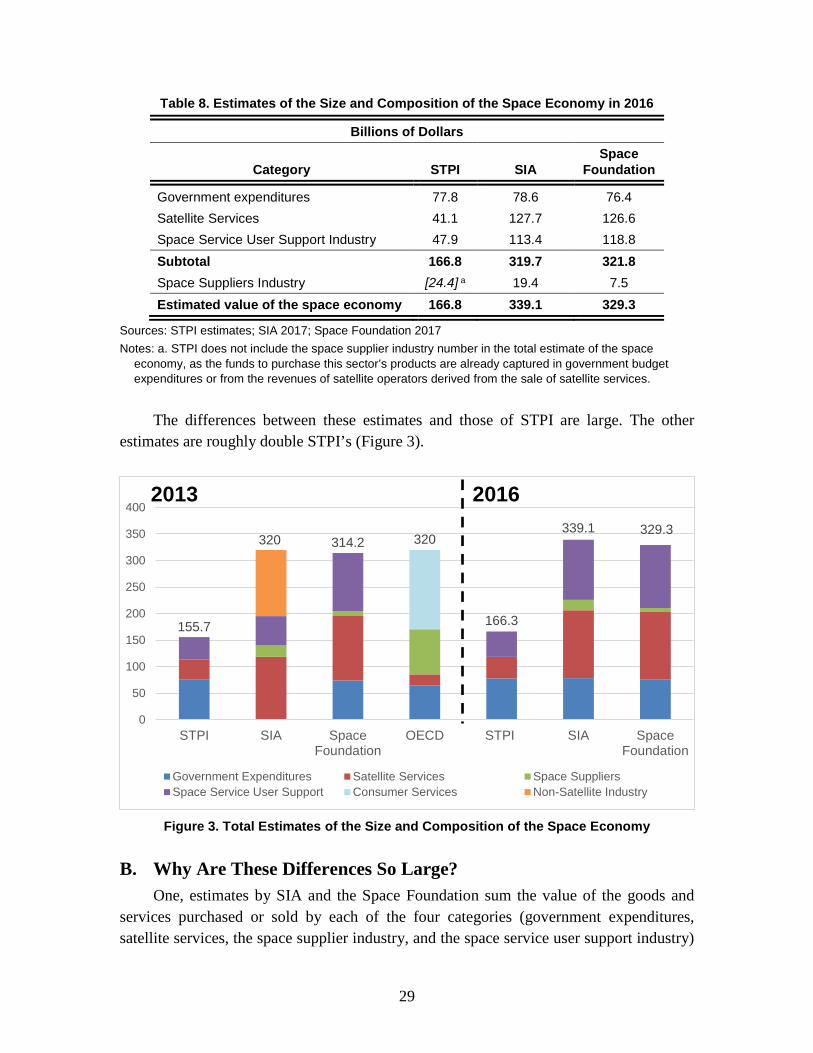
29
Table 8. Estimates of the Size and Composition of the Space Economy in 2016
Billions of Dollars
Category STPI SIA Space
Foundation
Government expenditures 77.8 78.6 76.4 Satellite Services 41.1 127.7 126.6 Space Service User Support Industry 47.9 113.4 118.8 Subtotal 166.8 319.7 321.8 Space Suppliers Industry [24.4] a 19.4 7.5 Estimated value of the space economy 166.8 339.1 329.3
Sources: STPI estimates; SIA 2017; Space Foundation 2017 Notes: a. STPI does not include the space supplier industry number in the total estimate of the space
economy, as the funds to purchase this sector’s products are already captured in government budget expenditures or from the revenues of satellite operators derived from the sale of satellite services.
The differences between these estimates and those of STPI are large. The other
estimates are roughly double STPI’s (Figure 3).
Figure 3. Total Estimates of the Size and Composition of the Space Economy
B. Why Are These Differences So Large? One, estimates by SIA and the Space Foundation sum the value of the goods and
services purchased or sold by each of the four categories (government expenditures, satellite services, the space supplier industry, and the space service user support industry)
155.7
320 314.2 320
166.3
339.1 329.3
0
50
100
150
200
250
300
350
400
STPI SIA SpaceFoundation
OECD STPI SIA SpaceFoundation
Government Expenditures Satellite Services Space SuppliersSpace Service User Support Consumer Services Non-Satellite Industry
2013 2016

30
to measure the total value of the space economy. We argue that summing the four categories to create a total value of the space economy results in some double counting because all the sales of the space supplier industry are to governments or satellite operators, the source of all the funds for purchases of this equipment. This difference is responsible for about $20 billion of the difference between STPI estimates and the SIA estimates and about $8 billion of the difference between STPI’s estimates and the Space Foundation estimates.
Two, as per our definition of the space economy, STPI confines the value of satellite services to services generated in space: the revenues or imputed revenues based on costs generated from owning and operating satellites and transmitting signals to the Earth, excluding payments by direct broadcast TV operators for royalties for films and other content and marketing expenses. As a result, STPI’s estimates for the value of satellite services are roughly $80 billion less than those of SIA and the Space Foundation.
Three, STPI has refined its estimates of the value of the space service user support industry to only count the full value of a good or service if its primary purpose is to receive or use signals from space services. For a product that may receive or use signals from space as just one of many functions, such as cell phones that receive GNSS data, we only count the value of the microchips and other components that make the reception of signals from space possible, not the full cost of the piece of equipment. For 2016, this methodology results in roughly a $70 billion difference between the STPI estimate for revenues from the space service user support industry and those of SIA and the Space Foundation. Figure 4 shows how these differences in estimation lead to the differences in STPI’s estimates and those of other organizations for 2016.

31
Source: STPI estimates; SIA 2017; Space Foundation 2017
Figure 4. Decomposition of Differences between SIA, Space Foundation, and STPI Estimates of the Size of the Space Economy in 2016
C. Limitations of Our Estimates As noted throughout Chapter 2, for some categories there may be double counting.
For example, we were unable to estimate the fraction of ground stations and other network equipment that was purchased by the satellite service industry. As such, we included the total sales of network equipment ($8.8 billion in 2013 and $10.3 billion in 2016) in our estimate of the space service user support industry. Accounting for this and other overlapping estimates would decrease our total estimate, but likely not by more than a few percent of the total.
We did not attempt to estimate values of space-related activities that SIA and the Space Foundation did not include in their 2013 or 2016 estimates. For example, we did not estimate a value for commercial space situational awareness (SSA) services. However, as governments and satellite service operators are the only customers of SSA service providers, the expenditures on this service may be captured in our estimate of government expenditures and space services revenues.
We chose to estimate the size of the space economy for 2013 and 2016 only, rather than more recent years, due to the availability of data when we conducted the research. The
0
50
100
150
200
250
300
350
400
SIA Space Foundation STPI No SupplierRevenues
STPI RestrictiveDefinition
STPI RefinedEstimates
Government Expenditures Satellite Services Space Suppliers Space Service User Support

32
benefit of examining markets that are several years old, rather than estimating the past year’s market shortly after the year has concluded, is that data tend to be more comprehensive for earlier years. Annual reports have been released, industry associations have provided estimates of their members’ sales, and companies have released data on older products. Additionally, we chose those years as several prominent organizations (including the OECD for 2013) had released estimates of the size of components of the space economy for those years.
D. Summary The primary purpose of this study is to estimate the value of goods and services
generated or consumed in space, using a narrower definition than is frequently used in other estimates of the size of the space economy. According to this narrower definition of the space economy, the value of final demand for goods and services made in space or used to capture signals from space was $167 billion in 2016; roughly half the size of the two most frequently cited estimates by SIA and the Space Foundation. For the purposes of government policy makers interested in targeting government programs to foster new services from space and the growth of the emerging space industry, this narrower definition should help to better size and define activities of firms manufacturing goods and services for or in space, a set of firms on which U.S. policy has focused in recent years. These estimates should also help inform decisions about the level of assistance the U.S. Government may wish to provide in relation to the current and potential future size of this industry.
Our definition highlights the primary role that governments continue to play in funding activities in space. According to our estimates, government budgetary expenditures on space account for almost half of final demand for goods and services from space. Until substantially new products of interest to households and business develop in space, government budgets will continue to play a dominant role in purchases of space industry products.

33
4. Projections of the Future Size of the Space Economy
A. Projected Size Several organizations have used these estimates of the current size of the space
economy to project its future size. Projections for 2040 range from a forecast by UBS, an international bank, of $926 billion, to one by Goldman Sachs of a “multi-trillion” dollar space economy (Table 9). Bank of America projects a $2.7 trillion space economy in 2045. Drawing on these forecasts, U.S. Government officials have frequently referred to the “trillion dollar space economy” in presentations designed to explain and present government policy and encourage private investors to invest in space (Sheetz 2017; O’Connell 2018).
Table 9. 2040 Projections of the Size and Composition of the Space Economy
Institution Year 2016 Space Economy
Future Space Economy
Compound Annual Rate of
Growth UBS 2040 $340 billiona $926 billion 4.3% Morgan Stanley 2040 $339 billiona $1.1 trillion 4.9% U.S. Chamber of Commerce 2040 $383.5 billionb $1.5 trillion 6% Bank of America 2045 $339 billiona $2.7 trillion 9% Goldman Sachs ~2040 $340 billionc multi-trillion $’s 9.5%d
Sources: UBS 2018; Morgan Stanley Research 2017; U.S. Chamber of Commerce 2018; Bank of America Equity Research 2017; Goldman Sachs Equity Research 2017
Notes: a. Forecast based on SIA’s estimate of $339 billion for 2016 (SIA 2017; UBS 2018, Morgan Stanley
Research 2017, Bank of America Equity Research 2017). b. U.S. Chamber of Commerce forecast based on the Space Foundation estimate of $383.5 billion for 2017
(Space Foundation 2018; U.S. Chamber of Commerce 2018). c. Goldman Sachs did not provide a current estimate; we used the Space Foundation estimate for 2016 for
Goldman Sachs. d. To make this calculation we assume Goldman Sachs’s “multi-trillion dollar” space economy is $3 trillion.
Figure 5 shows the five projections. It also provides detailed breakdowns of forecasts
by sector from the two organizations that provided this information publicly: UBS and Morgan Stanley.
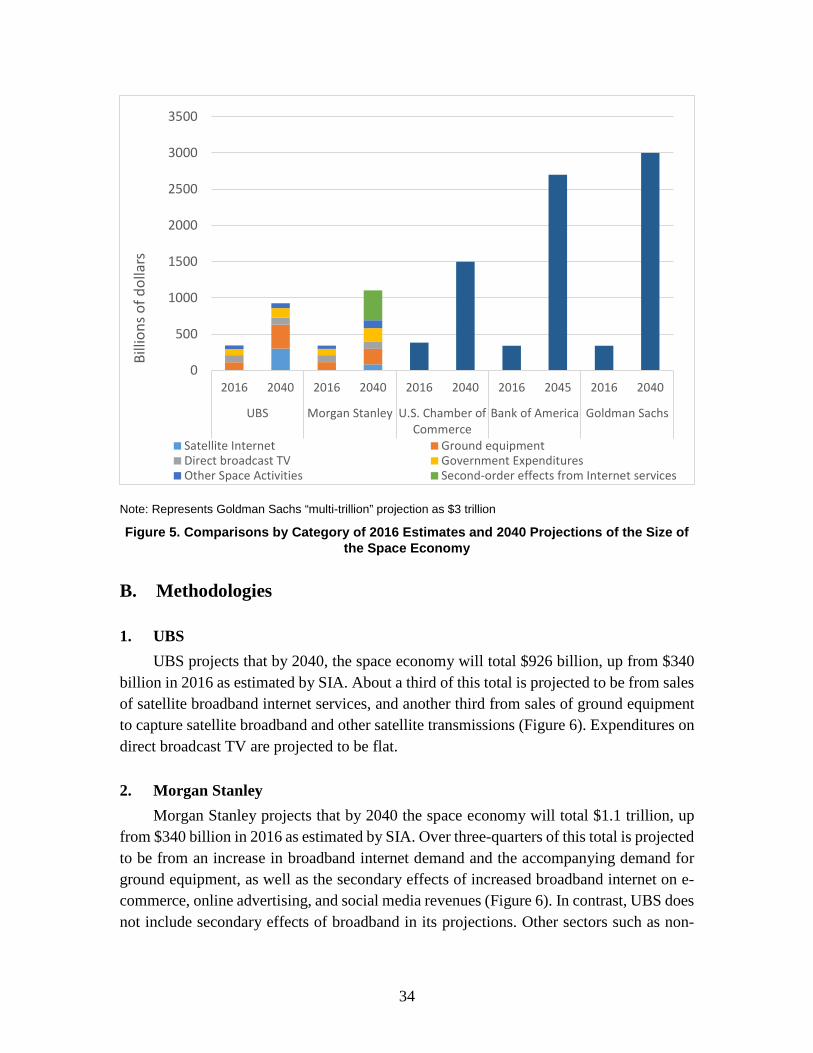
34
Note: Represents Goldman Sachs “multi-trillion” projection as $3 trillion
Figure 5. Comparisons by Category of 2016 Estimates and 2040 Projections of the Size of the Space Economy
B. Methodologies
1. UBS UBS projects that by 2040, the space economy will total $926 billion, up from $340
billion in 2016 as estimated by SIA. About a third of this total is projected to be from sales of satellite broadband internet services, and another third from sales of ground equipment to capture satellite broadband and other satellite transmissions (Figure 6). Expenditures on direct broadcast TV are projected to be flat.
2. Morgan Stanley Morgan Stanley projects that by 2040 the space economy will total $1.1 trillion, up
from $340 billion in 2016 as estimated by SIA. Over three-quarters of this total is projected to be from an increase in broadband internet demand and the accompanying demand for ground equipment, as well as the secondary effects of increased broadband internet on e-commerce, online advertising, and social media revenues (Figure 6). In contrast, UBS does not include secondary effects of broadband in its projections. Other sectors such as non-
0
500
1000
1500
2000
2500
3000
3500
2016 2040 2016 2040 2016 2040 2016 2045 2016 2040
UBS Morgan Stanley U.S. Chamber ofCommerce
Bank of America Goldman Sachs
Billi
ons o
f dol
lars
Satellite Internet Ground equipmentDirect broadcast TV Government ExpendituresOther Space Activities Second-order effects from Internet services

35
consumer satellite services and satellite manufacturing and launch are projected to see moderate growth, while expenditures on direct broadcast TV are projected to be flat.
3. U.S. Chamber of Commerce According to the U.S. Chamber of Commerce, (email correspondence 2019), the $1.5
trillion U.S. Chamber of Commerce forecast of the size of the space economy in 2040 was projected by taking the size of the space economy in 2017 as measured by the Space Foundation, and assuming a 6 percent annual growth rate until 2040. The projected growth rate was based on the growth rate of the space sector over the last decade.
4. Bank of America Bank of America did not generate its own projections of the size of the space
economy, but adopted those of the United Launch Alliance (ULA) from its vision of a $2.7 trillion cislunar economy by 2045. ULA’s vision includes an astronaut population of 1,000, a populated lunar habitat, space solar power from geosynchronous orbit, and active lunar regolith and asteroid mining (ULA 2017). These numbers “came out of a brainstorming session,” are “rather notional” (Monda 2016), and were not meant to represent the whole of the space economy. Bank of America argues that government spending on space, especially military, will continue to dominate as sources of revenue for space companies.
5. Goldman Sachs Equity Research In its publicly released version, Goldman Sachs does not provide a detailed
explanation for its projection of a “multi-trillion dollar” space economy by 2040. In its report, it discusses satellite internet and other services, declining launch costs, tourism, space mining, Earth observation, and military spending as drivers of the future space economy (Goldman Sachs Equity Research 2017).
C. Comparison of Projections The three largest projections of the future size of the space economy in 2040–2045
are by Goldman Sachs, Bank of America, and the U.S. Chamber of Commerce: “multi-trillion dollars,” $2.7 trillion, and $1.5 trillion, respectively. The two smallest projections of the future size of the space economy are from Morgan Stanley and UBS, at $1.1 trillion and $926 billion respectively.
Morgan Stanley and UBS were the only two of the five institutions that provided breakdowns of the components of their projections. Both organizations predict that the largest increases to the space economy will come from increased demand for and use of internet services and satellites. Figure 6 shows the two sets of projections side-by-side. We examine and compare their projections by sector below.

36
Figure 6. Breakdown by Category for UBS and Morgan Stanley Projections of the Space
Economy by 2040
UBS’s projection for revenues from satellite broadband in 2040 is over 350 percent of the Morgan Stanley projection. The large discrepancy is mainly due to differences in assumptions about global broadband penetration. UBS projects that global broadband penetration will be 75 percent by 2027, while Morgan Stanley projects a more conservative 59 percent.
Second order effects are defined as benefits to internet companies due to the growing number of subscribers because of the availability of internet broadband from space. These benefits stem from increased internet access that brings in new users, increasing revenues from social media, search/online advertising, and e-commerce. Although second order effects are not included in the estimates of the size of internet services provided by satellite companies in 2016, Morgan Stanley includes these second order effects in its projection of the size of the space economy in 2040. These second order effects, projected to run $412 billion, make up 54 percent of Morgan Stanley’s projected increase in the size of the space economy—by far the largest single contribution. UBS projects second order effects of $720 billion, but does not include this in its projection.
Morgan Stanley’s projection of second order effects is based on the assumptions that internet broadband penetration in 2040 will be 74 percent of a 9.2 billion global population and all additional internet users will use social media, online search/advertising, and e-commerce. The projection from UBS is based on a simpler calculation obtained by doubling the number of internet users from the present day.

37
Table 10. Composition of 2040 Projections of the Size of the Space Economy by Morgan Stanley and UBS
Billions of Dollars
Category 2016 2040 Contribution to Total Increase
Satellite internet Morgan Stanley $2 $85 11% UBS $0 or N/A $300 51% Ground equipment Morgan Stanley $113 $214 13% UBS $113 $331 37% Direct broadcast TV Morgan Stanley $98 $103 1% UBS $98 $98 0% Government expenditures on space Morgan Stanley $84 $181 13% UBS $84 $130 -3% Other space activities Morgan Stanley $44 $109 9% UBS $44 $68 15% Second order effects from internet services from space
Morgan Stanley 0 $412 54% UBS 0 $720* N/A Totals Morgan Stanley $350 $1,100 UBS $340 $926
Sources: UBS 2018; Morgan Stanley Research 2017 Notes: N/A—Not applicable or not available *Not included in UBS projection of total size of the space economy in 2040 (UBS 2018)
Both Morgan Stanley and UBS use the same 2016 estimate of the size of the ground
equipment industry in 2016 of $113 billion. However, UBS projects that industry sales will rise to $330 billion by 2040 while Morgan Stanley projects a market of $214 billion. The differences in these increases in revenue are due to differences in projections of increases in the numbers of satellites launched, particularly to low Earth orbit, which will require a corresponding growth in terrestrial stations. Morgan Stanley predicts satellite launches will increase at a compound annual growth rate of approximately 8 percent, compared to UBS’s projection of a compound annual growth rate of 5 percent. Despite projecting a higher rate of growth in satellite launches, Morgan Stanley still projects substantially lower revenues

38
for the ground equipment industry because it predicts that technological advances will bring down ground equipment costs and prices sharply.
In the sectors of “government” and “other” (including non-consumer satellite services, satellite manufacturing and launch, space tourism, and asteroid mining), Morgan Stanley’s current space economy estimates align with those of UBS. However, Morgan Stanley’s projected growth is significantly greater, with most of this growth in the non-satellite industry.
D. Observations The compound average rate of growth of the five projections ranges between
estimates of 4.3 and 9.5 percent (Table 9). In contrast, SIA reports that global satellite industry revenues—79 percent of its estimates of the space economy—grew 2.4 percent in 2016 and 3.1 percent in 2017 in nominal dollars (SIA 2019). Deflating these increases by the U.S. GDP deflator, annual growth rates in constant dollars were 1.3 percent in 2016 and 1.1 percent in 2017. Using the data in Tables 7 and 8 above, we calculate the nominal average annual increases in the size of the space economy between 2013 and 2016 as estimated by STPI, SIA, and the Space Foundation, as 2.3, 2.0, and 2.6 percent, respectively. In constant prices, the increases were 1.0, 0.7, and 0.3 percent, respectively. These rates of growth are far less than those used in the projections above.
To illustrate the potential for overestimating economic activity in space, we compare recent predictions to actual outcomes for Goldman Sachs, one of the institutions we cite. Goldman Sachs predicted that there would be approximately 100 launches per year in the light launch sector for the three-year period from 2017 to 2019 and medium-heavy launch volumes at approximately 90 per year, or 190 launches per year for that same period (Goldman Sachs Equity Research 2017). The actual numbers were a total of 90 light and medium-heavy launches in 2017 and 114 in 2018 (SIA 2018; SIA 2019). Goldman Sachs further predicted that the number of smallsat units launched would increase from 341 to 477 in 2018; the actual number of smallsats launched dropped to 328 in 2018 (Bryce Space and Technology 2019).
Major components of the space industry, most notably satellite operators with large satellites in geosynchronous orbits, have entered a mature phase; some sources of revenues, such as satellite TV in the United States, are stable or declining (Spangler 2019). As a consequence, the traditional space supplier industry has also been undergoing a period of slow revenue growth and in some subsectors—such as sales of large geostationary satellites—revenues have fallen. Outside the United States and China, civilian space programs are also undergoing a period of stress as governments of developed countries face budget constraints. In the medium-term, the U.S. Federal Government budget will be facing budgetary pressures as well. Consequently, outside of potential increases in military

39
spending on space, traditional sectors of the space economy are highly unlikely to post the rates of growth implicit in the five projections.
All of the projections incorporate substantial revenues from new or nascent sectors of the space economy, in particular, internet services from low Earth orbit. Space-based internet and related services account for 51 and 65 percent of UBS’s and Morgan Stanley’s projections of the total size of the space economy in 2040, respectively. Revenues from sales of ground equipment, which are closely tied to space-based internet, are the second largest component of their forecasts of the size of the space economy in 2040, running 36 and 19 percent, respectively. These projections of revenue growth are based on estimates that place the size of ground equipment sales at $113 billion in 2016, which includes the full cost of ground equipment instead of only the hardware components that make the reception of signals from space possible. This number also includes sales of derivative products and services that are produced terrestrially. Our own estimates, which we limit to ground equipment costs directly related to space, place the size of ground equipment sales at $47.9 billion in 2016.
In our view, these projections on the part of both UBS and Morgan Stanley appear optimistic. Although substantial numbers of people in the world do not yet have internet access, many of these people are poor, often with incomes less than the World Bank poverty line of about $2 a day. They do not have the incomes needed to purchase satellite internet. These households are concentrated in the countryside, the area to which satellite internet is best adapted. Although poorer communities may be able to pool resources to purchase a satellite internet connection, this market segment is unlikely to become large, and prices will need to drop dramatically to make satellite internet affordable to large numbers of rural households in developing countries. Substantial reductions in prices would affect the projected revenues of satellite internet providers. Wealthier households with the means to purchase internet services are concentrated in urban areas where fixed line connections are more competitive. Moreover, in all but the poorest countries in the world, cellphone ownership has become ubiquitous; smart phone coverage is growing rapidly. Internet access in these countries has been expanding through the cellphone network. Satellite internet providers will have a difficult time competing against cellphone operators for these cost-sensitive internet customers, although they may be able to earn revenues by providing backend network services to cellphone networks.
Satellite internet operators will also find it difficult to poach internet users from middle-income and wealthier households that currently use cable or cellphone connections, especially as 5G becomes common. Morgan Stanley points out that existing cable has internet connection speeds that are twice as fast as satellite links by OneWeb; 5G speeds are projected to be twice as fast as satellite links as well (Morgan Stanley 2017). In this context, we are skeptical that satellite internet will be used outside of niche markets, like wealthier rural areas; mobile users, like ships and aircraft; or for monitoring pipelines or

40
other infrastructure that goes through remote areas. These markets are not in the range of hundreds of billions of dollars.
We find the potential for sizeable revenues from other components of the forecasts unlikely. Some of the reports above discuss potential space markets such as space tourism, asteroid mining, and space-based solar power, although they do not project the size of potential revenues from these sources. The incipient space tourism market is split into suborbital trips, like those that Virgin Galactic is proposing, and orbital trips, generally with a stop at ISS. A large number of people have put down deposits for suborbital flights on Virgin Galactic, when the spacecraft becomes ready for flight. One financial reporter has expressed skepticism about enduring demand for short suborbital trips, however (Page 2019). To date, only seven people have paid to go to the ISS on eight separate trips on the Russian rocket, Soyuz, between 2001 and 2009. On average, they paid $25.5 million per trip. NASA has indicated that once the Commercial Crew program begins to transport astronauts to the ISS, available seats may be able to be sold to private passengers. In addition to the cost of launch, space tourists would pay an estimated cost of $35,000 a night once they reached the ISS (Boyle 2019). As of 2015—the latest date for which information was available—Space Adventures, Ltd., the company that has arranged past flights, had two customers signed up for trips to the ISS, when slots become available (Space Adventures 2015).
Unlike orbital tourism, where the principal constraint is cost, for asteroid mining and space-based solar power, technology as well as cost are major constraints. In light of the technological challenges and the costs of equipment and lift, asteroid mining is not likely to be economical for the next two decades or more. The first two asteroid mining companies have exited the industry, and with them, the first wave of commercial activity may well have ended. Rare and expensive metals such as platinum, which has one of the highest prices per ounce, are highly price inelastic: a surge in supply from deliveries from an asteroid would send market prices down, possibly making the asteroid mining operation unprofitable. Demand for water mined in space will be derived from government demand for human space exploration (Lal et al. 2018). Expenditures on human space exploration will be tightly constrained by future civilian space budgets.
Similar to asteroid mining, space-based solar power is at the conceptual stage. Solar and wind power projects in the United States now sell electricity at a few cents per kilowatt-hour, often at less cost than natural gas-generated electricity. Between 2010 and 2018, the costs of solar power dropped 84 percent and of on-shore wind 49 percent (Broom 2019). Costs are still falling. It is difficult to envision a space-based solar power system able to compete with these costs. One concept for a space-based solar power system reportedly estimates that costs could be close to 20 cents per kilowatt-hour if the project were to be developed—and could eventually cost less than 10 cents per kilowatt-hour, a multiple of
41
current costs of terrestrial solar power, which does not have the technological and cost uncertainties facing space-based solar power (John C. Mankins, NASA).
E. Summary We find that the five forecasts of the future size of the space economy that we
examined to be optimistic. The space industry is a substantial, innovative component of the global and U.S. economy. However, we caution policy makers and investors not to premise their decisions on these forecasts. Dollar projections can give policy makers a false sense of certainty. The investment in satellite-based telephony in the 1990s is a cautionary tale, where billions of dollars were invested in space-based constellations, and all proved to not be financially viable.13 Regardless of whether the predictions come to fruition, government policy needs to be flexible and robust, and able to function efficiently across a large range of futures.
13 The reverse can be true as well. There is an oft-repeated case study that in the 1980s, McKinsey &
Company was commissioned by AT&T to forecast cell phone penetration in the U.S. by 2000. The consultant’s prediction, about 900,000 subscribers, was less than 1 percent of the actual figure, which was over 100 million (The Economist 1999).


A-1
References
Bank of America Equity Research. 2017. To Infinity and Beyond – Global Space Primer. October 30. Bank of America Merrill Lynch.
Boyle, Rebecca. 2019. “The True Price of Privatizing Space Travel.” The Atlantic. June 11. https://www.theatlantic.com/science/archive/2019/06/nasa-iss-private-astonauts/591421/
Broom, Douglas. 2019. “The Cost of Generating Renewable Energy Has Fallen - a Lot.” World Economic Forum. May 7. https://www.weforum.org/agenda/2019/05/this-is-how-much-renewable-energy-prices-have-fallen/
Bryce Space and Technology. 2019. Smallsats by the Numbers. https://brycetech.com/downloads/Bryce_Smallsats_2018.pdf
Crane, Keith, Evan Linck, Sara A. Carioscia, Bhavya Lal. 2019. Assessment of the Utility of a Government Strategic Investment Fund for Space. D-10616. IDA Science and Technology Policy Institute: Washington, D.C.
COMSYS. 2017. The COMSYS VSAT Report: Market Summary & Company Profile Hughes. 14th Edition.
de Selding, Peter. 2015. “The List | 2014 Top Fixed Satellite Service Operators.” SpaceNews. July 13. https://spacenews.com/the-list-2014-top-fixed-satellite-service-operators/
DigitalGlobe. 2014. “2013 Form 10-K Annual Report.” https://www.sec.gov/Archives/edgar/data/1208208/000110465914013405/a13-24405_110k.htm
———. 2017. 2016 Annual Report. DirecTV. 2015. 2014 Annual Report.
https://www.sec.gov/Archives/edgar/data/1465112/000104746915001196/a2223104z10-k.htm
Dish. 2017. 2016 Annual Report. http://dish.client.shareholder.com/annuals.cfm ESRI. n.d. “What We Do.” Accessed July 2019. https://www.esri.com/en-us/about/about-
esri. The Economist. 1999. “Cutting the Cord.” October 7.
https://www.economist.com/special-report/1999/10/07/cutting-the-cord Euroconsult. 2014. Profiles of Government Space Programs. February. European Global Navigation Satellite Systems Agency (GSA). 2015. GNSS Market
Report. No. 4. March. Luxembourg. doi: 10.2878/251572

A-2
———. 2017. GNSS Market Report. No. 5. Luxembourg. doi: 10.2878/0426 Federal Aviation Administration (FAA). 2018. 2018 Annual Compendium of Commercial
Space Transportation. Goldman Sachs Equity Research. 2017. Space: The Next Investment Frontier. The
Goldman Sachs Group, Inc. House Committee of Transportation and Infrastructure. 2018. “Summary of Subject
Matter Regarding Subcommittee Hearing on ‘Commercial Space Transportation Regulatory Reform: Stakeholder Perspectives.’” Memo. June 22. https://transportation.house.gov/uploadedfiles/2018-06-26_-_aviation_ssm.pdf
International Monetary Fund (IMF). 2018. “Data Query.” http://data.imf.org/. Lal, Bhavya, Asha Balakrishnan, Alyssa J. Picard, Jonathan R. Behrens, Benjamin A.
Corbin, Roger M. Myers, Ellen K. Green. 2017. Trends in Small Satellite Technology and the Role of the NASA Small Spacecraft Technology Program. IDA Science and Technology Policy Institute: Washington, DC.
Lal, Bhavya, Benjamin Corbin, Roger Meyers, Thomas Colvin, Keith Crane, Cara Cavanaugh. 2018. An Assessment of the Ability of the United States and Other Countries to Extract and Utilize Asteroid-based Natural Resources. IDA Paper P-10372. IDA Science and Technology Policy Institute: Washington, DC.
Monda, Eric. 2016. Space Access ’16. Quoted in Foust, Jeff. “ULA’s Lunar Vision.” May 23. http://www.spacenewsmag.com/feature/ulas-lunar-vision/
Morgan Stanley Research. 2017. Space: Investment Implications of the Final Frontier. October 12. Morgan Stanley. New York, NY.
National Aeronautics and Space Administration (NASA). 2014. Aeronautics and Space Report of the President – Fiscal Year 2012 Activities. NP-2014-0190-1282.
———. 2017. Aeronautics and Space Report of the President – Fiscal Year 2016 Activities. NP-2017-05-2391-HQ.
———. 2018. “FY 2019 Budget Estimates.” https://www.nasa.gov/sites/default/files/atoms/files/fy19_nasa_budget_estimates.pdf
O’Connell, Kevin. 2018. “Remarks on the Trillion Dollar Space Economy”. November 27. U.S. Department of Commerce. https://www.space.commerce.gov/remarks-on-the-trillion-dollar-space-economy/
Organisation for Economic Cooperation and Development (OECD). 2012. OECD Handbook on Measuring the Space Economy. OECD Publishing. Paris, France. http://dx.doi.org/10.1787/9789264169166-en
———. 2014. The Space Economy at a Glance 2014. OECD Publishing. Paris, France. November.
Page, Lewis. 2019. “‘Virgin Galactic Doesn’t Have a Future’: Why Investors Should Shun Shares in Richard Branson’s Space Tourism Venture.” The Telegraph. July 27.

A-3
Ross, Wilbur. 2018 “Remarks by Secretary Wilbur L. Ross at the National Space Symposium 2018.” April 17. https://www.commerce.gov/news/secretary-speeches/2018/04/remarks-secretary-wilbur-l-ross-national-space-symposium-2018
Satellite Industry Association (SIA) prepared by the Tauri Group. 2014. 2014 State of the Satellite Industry Report. https://www.sia.org/
———. 2017. 2017 State of the Satellite Industry Report. https://www.sia.org/ ———. 2018. 2018 State of the Satellite Industry Report. https://www.sia.org/ ———. 2019. 2019 State of the Satellite Industry Report. https://www.sia.org/ Sheetz, Michael. 2017. “Morgan Stanley Predicts Space Industry Will Triple in Size:
Here’s How to Invest”. CNBC .October 12, 2017. https://www.cnbc.com/2017/10/12/morgan-stanley-how-to-invest-in-1-trillion-space-industry.html
Shelton, William. 2017. “Threats to Space Assets and Implications for Homeland Security.” Statement before the House Armed Services Subcommittee on Strategic Forces and House Homeland Security Subcommittee on Emergency Preparedness, Response and Communications. March 29. https://docs.house.gov/meetings/AS/AS29/20170329/105785/HHRG-115-AS29-Wstate-SheltonW-20170329.pdf
Sirius XM Holdings Inc. (Sirius XM). 2016. “2016 Form 10-K Annual Report.” http://www.annualreports.com/HostedData/AnnualReports/PDF/NASDAQ_SIRI_2016.pdf
Space Adventures. 2015. “Space Adventures Announces Contract with Satoshi Takamatsu for a Future Orbital Spaceflight Mission.” Press release, June 22, 2015. http://www.spaceadventures.com/press_releases/space-adventures-announcescontract-with-satoshi-takamatsu-for-a-future-orbital-spaceflight-mission/.
Space Foundation. 2013. “2013 - Chinese Government Space Budget,” The Space Report. https://www.thespacereport.org/resources/economy/government-space-budgets/chinese-government-space-budget/2013-chinese-government-space-budget
———. 2015. The Space Report. Colorado Springs, CO and Arlington, VA. www.SpaceFoundation.org.
———. 2017. The Space Report. Colorado Springs, CO and Arlington, VA. www.SpaceFoundation.org.
———. 2018. The Space Report. Colorado Springs, CO and Arlington, VA. www.SpaceFoundation.org.
———. No date. “Who We Are.” Colorado Springs, CO and Arlington, VA. https://www.spacefoundation.org/who-we-are
Spangler, Todd. 2019. “AT&T Misses on Q1 Revenue as Warner Media Falls Short, DirecTV Subs Continue to Slide.” Variety. April 24. https://variety.com/2019/biz/news/att-misses-on-q1-2019-revenue-warnermedia-directv-1203196427/

A-4
UBS. 2018. “Longer Term Investments – Space.” November 30. https://www.ubs.com/content/dam/WealthManagementAmericas/documents/space-p.pdf
United Launch Alliance (ULA). 2017. On Orbit Refueling: Supporting a Robust Cislunar Space Economy. https://sciences.ucf.edu/class/wp-content/uploads/sites/58/2017/04/ULA-UCF.pdf
U.S. Chamber of Commerce. 2018. “The Space Economy: An Industry Takes Off.” October 11. https://www.uschamber.com/series/above-the-fold/the-space-economy-industry-takes
White House. 2010. “National Space Policy of the United States of America.” June 28. The White House. Washington, D.C. https://obamawhitehouse.archives.gov/sites/default/files/national_space_policy_6-28-10.pdf
———. 2017. “Presidential Memorandum on Reinvigorating America’s Human Space Exploration Program.” December 11. The White House. Washington, D.C. https://www.whitehouse.gov/presidential-actions/presidential-memorandum-reinvigorating-americas-human-space-exploration-program/
Woodward, Aylin. 2017. “SpaceX Just Launched a Device That Will ‘Change How We Interact with Space.’” Futurism. December 15, 2017. https://futurism.com/spacex-launched-device-change-interact-space/

B-1
Abbreviations
DOD Department of Defense FAA Federal Aviation Administration FOMS Fiber Optic Manufacturing in Space FSS fixed satellite service GDP gross domestic product GNSS global navigation satellite systems GPS Global Positioning System GSA European Global Navigation Satellite Systems Agency IDA Institute for Defense Analyses ISS International Space Station NASA National Aeronautics and Space Administration OECD Organisation for Economic Co-operation and
Development OSTP Office of Science and Technology Policy SIA Satellite Industry Association SSA space situational awareness SSL Space Systems Loral STPI Science and Technology Policy Institute UBS United Bank of Switzerland ULA United Launch Alliance VSAT very small aperture terminal


Standard Form 298 (Rev. 8/98)
REPORT DOCUMENTATION PAGE
Prescribed by ANSI Std. Z39.18
Form Approved OMB No. 0704-0188
The public reporting burden for this collection of information is estimated to average 1 hour per response, including the time for reviewing instructions, searching existing data sources, gathering and maintaining the data needed, and completing and reviewing the collection of information. Send comments regarding this burden estimate or any other aspect of this collection of information, including suggestions for reducing the burden, to Department of Defense, Washington Headquarters Services, Directorate for Information Operations and Reports (0704-0188), 1215 Jefferson Davis Highway, Suite 1204, Arlington, VA 22202-4302. Respondents should be aware that notwithstanding any other provision of law, no person shall be subject to any penalty for failing to comply with a collection of information if it does not display a currently valid OMB control number. PLEASE DO NOT RETURN YOUR FORM TO THE ABOVE ADDRESS. 1. REPORT DATE (DD-MM-YYYY) 2. REPORT TYPE 3. DATES COVERED (From - To)
4. TITLE AND SUBTITLE 5a. CONTRACT NUMBER
5b. GRANT NUMBER
5c. PROGRAM ELEMENT NUMBER
5d. PROJECT NUMBER
5e. TASK NUMBER
5f. WORK UNIT NUMBER
6. AUTHOR(S)
7. PERFORMING ORGANIZATION NAME(S) AND ADDRESS(ES) 8. PERFORMING ORGANIZATIONREPORT NUMBER
9. SPONSORING/MONITORING AGENCY NAME(S) AND ADDRESS(ES) 10. SPONSOR/MONITOR'S ACRONYM(S)
11. SPONSOR/MONITOR'S REPORTNUMBER(S)
12. DISTRIBUTION/AVAILABILITY STATEMENT
13. SUPPLEMENTARY NOTES
14. ABSTRACT
15. SUBJECT TERMS
16. SECURITY CLASSIFICATION OF:a. REPORT b. ABSTRACT c. THIS PAGE
17. LIMITATION OFABSTRACT
18. NUMBEROFPAGES
19a. NAME OF RESPONSIBLE PERSON
19b. TELEPHONE NUMBER (Include area code)