measuring user influence on twitter using modified k-shell
TRANSCRIPT

Measuring User Influence on Twitter
Using Modified K-Shell Decomposition
Philip E. Brown Junlan Feng AT&T Labs - Research, United States
[email protected] [email protected]
Abstract
Social influence can be described as power - the ability of a person to influence the thoughts or actions of others. Identifying influential users on online social networks such as Twitter has been actively studied recently. In this paper, we investigate a modified k-shell decomposition algorithm for computing user influence on Twitter. The input to this algorithm is the connection graph between users as defined by the follower relationship. User influence is measured by the k-shell level, which is the output of the k-shell decomposition algorithm. Our first insight is to modify this k-shell decomposition to assign logarithmic k-shell values to users, producing a measure of users that is surprisingly well distributed in a bell curve. Our second insight is to identify and remove peering relationships from the network to further differentiate users. In this paper, we include findings from our study.
Introduction
Social influence can be described as power - the ability of a person to influence the thoughts or actions of others. Information and influence propagation in social networks has been actively studied for decades in the fields of psychology, sociology, communication, marketing, and political science. For online social networks, (Capece et al. 2009) summarized the social structures into three categories: Pyramid, Circular, and Hybrid. An example of the pyramid structure is Twitter. Influencers such as CNN have millions of followers, while the influencer doesn't follow back. Facebook is an example of a circular social structure, where Facebook users befriend only a select number of people or brands. The hybrid social structure combines the circular and pyramid-shaped community frameworks. Automatically detecting influencers on online
Copyright © 2011, Association for the Advancement of Artificial Intelligence (www.aaai.org). All rights reserved.
social networks has recently received great attention from both research and industry. In industry, Klout.com tracks influence of users on online social networks including Twitter and Facebook. It measures users' influence using the Klout score, which is calculated based on 35 variables such as Follower/Follow ratio, unique retweeters, unique messages retweeted, and username mention count. The scores range from 1-100 with higher scores representing a wider and stronger sphere of influence. The size of this sphere is calculated by measuring true reach (engaged followers and friends vs. spam bots, dead accounts, etc.). The strength of influence is calculated by tracking interactions across a user’s social graph to determine the likelihood of someone listening to or acting upon any specific message. TurnRank.com is another tool to measure user influence on Twitter. The TurnRank score is a reflection of both how much attention your followers can directly give you and how much attention they bring you from their network followers. In research, there has been a broad spectrum of algorithms proposed to measure influence on online social networks such as the number of retweets, the number of followers, the number of mentions, PageRank (Page et al. 1999), Hirsch-index or H-index (Hirsch 2005), and the Passive-Influence (PI) algorithm (Romero et al. 2010). PageRank is a link analysis algorithm which assigns a numerical weight called the PageRank value (Page et al. 1999). For online social networks, the higher a user’s value, the more influential he is. (Weng et al. 2010) extended PageRank to consider both the topical similarity between users and the link structure between the user accounts. The Hirsch index (or H-index) is used in the scientific community in order to measure the productivity and impact of a scientist. In a social network such as Twitter, a user will have H-index i if i of his messages have been retweeted or mentioned at least i times each. The higher the H-index is, the more influential the user is expected to be. The PI algorithm was recently proposed in
18

(Romero et al. 2010) to address the observation that the majority of users on Twitter act as passive information consumers and do not forward the content to the network. The PI algorithm interactively estimates the influence and passivity of users based on their information forwarding activity. As we see above, most influence measures address the dynamic characteristics of the social network such as retweets and user mentions. While these types of measures may be good at identifying influence related to frequent use, they typically are not sensitive to influence related to infrequent use (unless a given measure includes data for extended periods). In this paper we focus on measuring a user’s full potential influence inherent in the user connectivity network, which is relatively more static. In particular, we propose a variant k-shell decomposition algorithm to estimate the influence of users on Twitter. The k-shell algorithm, described in (Kitsak et al. 2010), has been shown to be effective at identifying influential spreaders in complex networks. As is the case with infectious diseases within a society, the most efficient spreaders of information are found to be at the core of the network as identified by k-shell decomposition. To use k-shell decomposition effectively for the Twitter network, we make two significant changes. The first change alters the basic algorithm for determining k-shells to produce logarithmic values. The second change is to the manner in which the network structure is interpreted (once with peers included, once with peers excluded). User influence is measured by the logarithmic k-shell value, which is the output of the modified k-shell decomposition algorithm. Our experiments show that these k-shell values for users are surprisingly well distributed in a bell curve. The remainder of this paper elaborates on the algorithm and our analysis of it using a large amount of Twitter data. In the Data section we describe the Twitter data set we use. The Algorithms section introduces the original k-shell decomposition algorithm and our modifications for the Twitter network. In the Experiment section, we share our analysis and findings. We conclude the paper in the last Section.
Data In this paper, we use two twitter datasets. One was collected by KAIST in 2009. Details and analysis of this dataset was reported in (Kwak et al. 2010). It includes 41.7 million user profiles (User Data), and 1.47 billion social relations (Network Data). The other dataset is Usage Data, which was collected by Lehigh University and includes a sampling of more than 80 million actual tweets from October 2009, representing more than 7 million users, or about 17% of the total Twitter user community.
Network data is provided as pairs of values denoting the arcs/edges of the follower relationship for users in the Twitter network. For each pair, the first value is the User ID of a given Twitter user and the second value is the User ID of a known follower. For instance, “998700 342100” and “998700 531240” indicate that users with IDs 342100 and 531240 are followers of the user with ID 998700. User data contains information on individual users such as Account ID, Account Name, Owner Name, Description, and Create Date. Usage data comes in hourly dumps containing information on individual tweets such as Tweet ID, Tweet Timestamp, Tweet Text, Sender ID, and other status information relevant to the tweet and its sender.
Algorithms Original K-Shell Decomposition Algorithm The k-shell decomposition algorithm is a well-established method for detecting the core and the hierarchical structure of a given network (Seidman 1983) (Carmi et al. 2007). Recently, (Kitsak et al. 2010) proposed using k-shell decomposition as a technique for identifying the most efficient, or influential, spreaders in a complex network. This applies to the spread of infectious disease in a society as well as the spread of information in a social network. Viewed as nodes in a graph, the higher the k-shell level assigned, the closer the node is to the core of the graph. The assumption is that, if these nodes are users in a social network, the users in the higher k-shell levels are more influential in the network than users in lower k-shell levels. The k-shell decomposition algorithm groups all nodes in a network that have k (or less) connections or that are only connected to other nodes with k (or less) connections. Once a node has been identified, it is marked (and removed from the network for purposes of the algorithm) and the search continues until all nodes in shell k have been found. The process then moves to the next larger k-shell value (and continues until all nodes have been marked). In this basic algorithm, k-shell values are assigned in a linear fashion. That is, each k-shell value is equivalent to the analyzed connection count. An example of this algorithmic result for a simple network, from (Kitsak et al. 2010), is given in Figure 1. Note that, in this example, no nodes have fallen into k-shell level 0. This is because the connections in this example are undirected. Any node with at least one connection will minimally fall into k-shell level 1. In the Twitter data, connections are directional. It is possible to have a user who follows any number of other Twitter users but has no followers of his own; such a user would be placed in k-shell level 0. Any user that only has followers from k-shell level 0 would also be placed in k-shell 0.
19

This algorithm is simple in theory. In practice, however, it can be very time-consuming for a large network such as Twitter (with its millions of nodes and billions of edges).
Modified K-Shell Decomposition Algorithm We initially used the basic algorithm to analyze the Twitter network (using the Network Data described in the Data section). We observed that the results were highly skewed, with most nodes (or users) falling into the first few (low) k-shell levels, with user counts peaking at k-shell level 4, and the remaining users tailing off over thousands of additional non-empty (higher) k-shell levels. This distribution of nodes made statistical observations hard. Motivated by this difficulty, we modified the original algorithm by applying a logarithmic mapping, where each k-shell level represents roughly the log value of the analyzed connection count. So, whereas the original k-shell decomposition algorithm placed nodes with k (or less) connections into k-shell level k, our modified algorithm places nodes with 2^k - 1 (or less) connections into k-shell level k, effectively consolidating the higher k-shell levels. This modified algorithm produces fewer and more meaningful k-shell values. As the Experiment section will show, the placement of users in the logarithmic k-shell levels produces a more useful distribution. We also found the modified algorithm to be faster than the original algorithm. For a given network, when the original algorithm iterated n times to find a solution, the modified algorithm only needed to iterate log2n times.
Experiment In this experiment, the modified k-shell decomposition algorithm is used to measure user influence in the Twitter network. These measures are validated against Twitter usage data. But, to discuss these measures, it is also necessary to clarify some of the terminology we will use.
Peered vs. Non-Peered The Twitter Network Data only defines connections in terms of users and followers. We define here other relations that are implicit in these connections. We say that a user A with a follower B will also be called a leader of user B. For a given user A, its set of leaders and its set of followers can overlap (see Figure 2). We call the users in this overlap the peers of A (i.e., all users B for which A follows B and B follows A). A follower relationship with peers allowed is called a peered follower relationship. A follower relationship with the peers removed is called a non-peered follower relationship. The same is true for the leader relationship.
Reach vs. Authority Once the peers are identified, a distinction can be made between reach and authority. Reach measures the potential audience for a user’s message, either directly through tweets or indirectly through retweets (via the follower relationship). Authority is a similar, but non-peered, measure in that it excludes peers when interpreting the follower relationship. This is because peering implies a bi-directional (leader/follower) relationship between users whereas authority is inherently uni-directional. This experiment produces and compares user influence measures based on both reach and authority (and a combination of the two).
Results Applied to network data including peer information, and measuring reach, the result of the modified k-shell decomposition algorithm has 13 k-shell levels. These are shown in Figure 3. To capture authority instead of reach when measuring influence, the modified algorithm is then applied to the non-peered network (i.e., the same network with peered relationships stripped out). This result, shown in Figure 4, has only 9 k-shell levels.
k = 0 1 2 3
Figure 1. K-Shell Levels for a Simple Network
Followers Leaders
Peers
Figure 2. Peers Defined by Leader/Follower Overlap
20

Peered K-Shell Connection Count User Count
K0 0 1,592,399
K1 1 3,114,246
K2 2 to 3 8,216,815
K3 4 to 7 15,084,254
K4 8 to 15 8,519,767
K5 16 to 31 2,745,200
K6 32 to 63 1,203,390
K7 64 to 127 576,262
K8 128 to 255 316,872
K9 256 to 511 164,489
K10 512 to 1023 85,765
K11 1024 to 2047 29,101
K12 2048 to 4095 3,670
Figure 3. Peered K-Shell Levels
Non-Peered K-Shell Connection Count User Count
k0 0 3,744,754
k1 1 5,877,317
k2 2 to 3 16,301,730
k3 4 to 7 10,880,232
k4 8 to 15 2,585,116
k5 16 to 31 1,303,296
k6 32 to 63 607,630
k7 64 to 127 346,997
k8 128 to 255 5,158
Figure 4. Non-Peered K-Shell Levels
Overlaying these two sets of measures produces the chart in Figure 5. The (peered) reach measure is shown as a dotted line and the (non-peered) authority measure is shown as a solid line. Notice that both measures produce a clear bell curve distribution. To determine whether either of these results is a good measure and, if so, which is the better measure (or simply the more useful measure when expressing influence for a given user or group of users), we validate each measure against the Twitter usage data. For our validation, we look at the usage characteristics (tweet and retweet behavior) for the user groups defined by the different k-shell methods. In particular, we find the average number of recipients for a given group’s tweets (and the average number of retweets for those tweets). For the peered k-shell values representing reach, the average number of recipients of tweets (and retweets of those tweets) is given in Figure 6. Values have been rounded to the nearest integer.
Peered
K-Shell
Recipients
(Tweets)
Recipients
(Retweets)
K0 0 0
K1 1 0
K2 3 0
K3 8 0
K4 18 0
K5 42 0
K6 101 0
K7 236 0
K8 565 1
K9 1,588 3
K10 5,677 8
K11 20,001 42
K12 12,889 8
Figure 6. Recipients by Peered K-Shell Level
For the non-peered k-shell values representing authority, the average number of recipients of tweets (and retweets of those tweets) is given in Figure 7. Values are again rounded to the nearest integer.
Non-Peered
K-Shell
Recipients
(Tweets)
Recipients
(Retweets)
k0 7 0
k1 12 0
k2 17 0
k3 30 0
k4 61 0
k5 129 0
k6 317 1
k7 1,932 3
k8 104,304 161
Figure 7. Recipients by Non-Peered K-Shell Level
Figure 5. Users per K-Shell (dotted=Reach, solid=Authority)
21

Comparing the two k-shell methods against the usage data shows that the non-peered k-shell (or measure of authority) is more useful than the result for peered k-shell (or measure of reach). The authority measure provides greater discernment between different k-shell levels and its highest level (k8) reflects, by far, the user group with the largest number of recipients for both tweets from the group and for any retweets of those tweets. Note that the drop-off in level K12 of the reach measure may indicate that it is susceptible to a form of self-promotion whereby large numbers of peers are created (either manually or by exploiting other users with accounts set to auto-follow). Although the authority measure has been shown to provide greater discernment than the reach measure, it is useful to know whether a combination of the two methods could provide an even better result. To find out, the user groups defined by each method are further bucketed by both their peered and non-peered k-shell level and these
buckets are then compared to the Twitter usage data. The results are given in Figures 8 through 10, where rows represent peered k-shell levels and columns represent non-peered k-shell levels. As shown in Figure 8, users that fall into the buckets defined by non-peered k-shell level k8 and peered k-shell levels K10 and K11 have the most recipients, by far, for the tweets that they generate. In Figure 9, users from non-peered k-shell level k8 and peered k-shell level K11 also have the highest number of retweet recipients for the tweets that they generate. This particular bucket of users is shown to average over 190,000 recipients per tweet and 398 retweets for each of those tweets. A quick analysis of the user profiles for this group shows a high concentration of CEOs, corporate founders, authors/writer, news feeds, bloggers, and TV/radio/web show hosts. Notably, this group also contains the CEO and two co-founders of Twitter. The size of each user bucket is given in Figure 10.
k0 k1 k2 k3 k4 k5 k6 k7 k8
K0 0 0 0 0 0 0 0 0 0
K1 1 1 0 0 0 0 0 0 0
K2 3 3 3 0 0 0 0 0 0
K3 6 7 7 8 0 0 0 0 0
K4 14 16 16 18 22 0 0 0 0
K5 32 34 37 37 43 54 0 0 0
K6 61 81 77 87 81 104 140 0 0
K7 167 147 173 167 176 185 259 309 0
K8 352 401 370 451 365 395 442 677 415
K9 275 707 594 679 677 747 718 1690 1608
K10 1219 1059 924 1423 1367 1525 1496 4615 132947
K11 0 3003 2286 2228 3611 3584 3791 9543 192975
K12 0 0 0 0 0 3969 5830 15997 12122
Figure 8. Average Tweet Recipients per K-Shell Combo (rounded to nearest integer)
k0 k1 k2 k3 k4 k5 k6 k7 k8
K0 0 0 0 0 0 0 0 0 0
K1 0 0 0 0 0 0 0 0 0
K2 0 0 0 0 0 0 0 0 0
K3 0 0 0 0 0 0 0 0 0
K4 0 0 0 0 0 0 0 0 0
K5 0 0 0 0 0 0 0 0 0
K6 0 0 0 0 0 0 0 0 0
K7 0 0 0 0 1 0 0 1 0
K8 0 1 0 0 0 1 1 1 0
K9 0 0 0 0 3 1 2 3 0
K10 0 0 0 3 14 5 4 8 1
K11 0 0 0 0 3 6 17 20 398
K12 0 0 0 0 0 0 0 29 3
Figure 9. Average Retweet Recipients per K-Shell Combo (rounded to nearest integer)
22
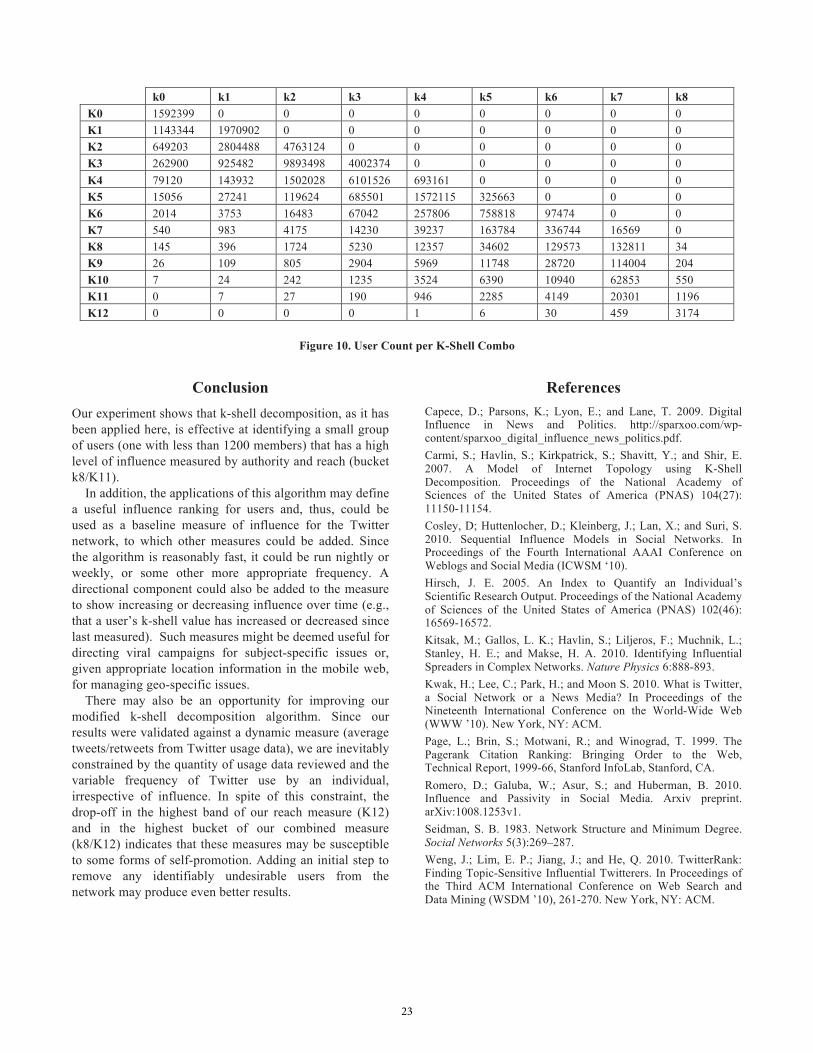
Conclusion Our experiment shows that k-shell decomposition, as it has been applied here, is effective at identifying a small group of users (one with less than 1200 members) that has a high level of influence measured by authority and reach (bucket k8/K11). In addition, the applications of this algorithm may define a useful influence ranking for users and, thus, could be used as a baseline measure of influence for the Twitter network, to which other measures could be added. Since the algorithm is reasonably fast, it could be run nightly or weekly, or some other more appropriate frequency. A directional component could also be added to the measure to show increasing or decreasing influence over time (e.g., that a user’s k-shell value has increased or decreased since last measured). Such measures might be deemed useful for directing viral campaigns for subject-specific issues or, given appropriate location information in the mobile web, for managing geo-specific issues. There may also be an opportunity for improving our modified k-shell decomposition algorithm. Since our results were validated against a dynamic measure (average tweets/retweets from Twitter usage data), we are inevitably constrained by the quantity of usage data reviewed and the variable frequency of Twitter use by an individual, irrespective of influence. In spite of this constraint, the drop-off in the highest band of our reach measure (K12) and in the highest bucket of our combined measure (k8/K12) indicates that these measures may be susceptible to some forms of self-promotion. Adding an initial step to remove any identifiably undesirable users from the network may produce even better results.
References Capece, D.; Parsons, K.; Lyon, E.; and Lane, T. 2009. Digital Influence in News and Politics. http://sparxoo.com/wp-content/sparxoo_digital_influence_news_politics.pdf.
Carmi, S.; Havlin, S.; Kirkpatrick, S.; Shavitt, Y.; and Shir, E. 2007. A Model of Internet Topology using K-Shell Decomposition. Proceedings of the National Academy of Sciences of the United States of America (PNAS) 104(27): 11150-11154.
Cosley, D; Huttenlocher, D.; Kleinberg, J.; Lan, X.; and Suri, S. 2010. Sequential Influence Models in Social Networks. In Proceedings of the Fourth International AAAI Conference on Weblogs and Social Media (ICWSM ‘10).
Hirsch, J. E. 2005. An Index to Quantify an Individual’s Scientific Research Output. Proceedings of the National Academy of Sciences of the United States of America (PNAS) 102(46): 16569-16572.
Kitsak, M.; Gallos, L. K.; Havlin, S.; Liljeros, F.; Muchnik, L.; Stanley, H. E.; and Makse, H. A. 2010. Identifying Influential Spreaders in Complex Networks. Nature Physics 6:888-893.
Kwak, H.; Lee, C.; Park, H.; and Moon S. 2010. What is Twitter, a Social Network or a News Media? In Proceedings of the Nineteenth International Conference on the World-Wide Web (WWW ’10). New York, NY: ACM.
Page, L.; Brin, S.; Motwani, R.; and Winograd, T. 1999. The Pagerank Citation Ranking: Bringing Order to the Web, Technical Report, 1999-66, Stanford InfoLab, Stanford, CA.
Romero, D.; Galuba, W.; Asur, S.; and Huberman, B. 2010. Influence and Passivity in Social Media. Arxiv preprint. arXiv:1008.1253v1.
Seidman, S. B. 1983. Network Structure and Minimum Degree. Social Networks 5(3):269–287.
Weng, J.; Lim, E. P.; Jiang, J.; and He, Q. 2010. TwitterRank: Finding Topic-Sensitive Influential Twitterers. In Proceedings of the Third ACM International Conference on Web Search and Data Mining (WSDM ’10), 261-270. New York, NY: ACM.
k0 k1 k2 k3 k4 k5 k6 k7 k8 K0 1592399 0 0 0 0 0 0 0 0
K1 1143344 1970902 0 0 0 0 0 0 0
K2 649203 2804488 4763124 0 0 0 0 0 0
K3 262900 925482 9893498 4002374 0 0 0 0 0
K4 79120 143932 1502028 6101526 693161 0 0 0 0
K5 15056 27241 119624 685501 1572115 325663 0 0 0
K6 2014 3753 16483 67042 257806 758818 97474 0 0
K7 540 983 4175 14230 39237 163784 336744 16569 0
K8 145 396 1724 5230 12357 34602 129573 132811 34
K9 26 109 805 2904 5969 11748 28720 114004 204
K10 7 24 242 1235 3524 6390 10940 62853 550
K11 0 7 27 190 946 2285 4149 20301 1196
K12 0 0 0 0 1 6 30 459 3174
Figure 10. User Count per K-Shell Combo
23