meat and dairy processingindustry · pdf file3 philippine imports of meat and dairy products:...
TRANSCRIPT

Meat and Dairy Processing Industry:, , ! . l... , , e , . i . . . . i , , . i . . * * i , i • * * * * m * * i * i •
Impact of Trade Policieson Performance, Competitiveness
and Structure. . . . .., , , i , . . . , , , . _ ! . * * * , * * o * i m i * *l* * * * * * *
LoMi C. de Dios
t_SFAKCH PAI_.P,.SERI_.SNo. 94-09
•Philippine Institute for Development Studies
Copyright 1994Philippine Institute for Development Studies
Printed in the Philippines. All rights reserved. The findings, interpretationsand conclusions in this paper are those of the author and do notnecessarily reflect those of PIDS.
Please address all inquiries to the:
Philippine Institute for Development Studies4th Floor, NEDA sa Makati Building106 Amorsolo Street, Legaspi Village
1229 Makati, Metro ManilaFax No. (632) 816-1091Tel. Nos. 893-5705 and 892-4059
ISBN 971-564-002-8RP- 5 _95 - 500
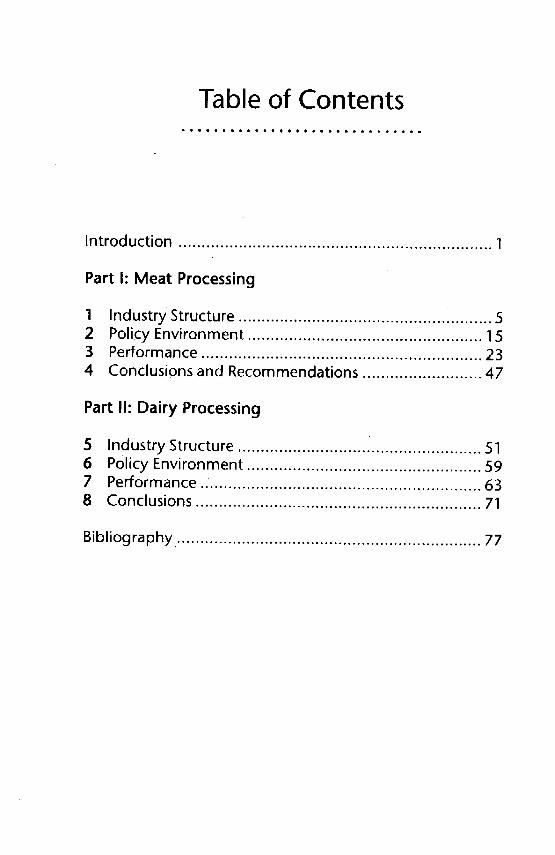
Table of Contents
Introduction .................................................................... 1
Part I: Meat Processing
1 Industry Structure ....................................................... 52 Policy Environment ................................................... 153 Performance ............................................................. 234 Conclusions and Recommendations .......................... 47
Part I1: Dairy Processing
5 Industry Structure ..................................................... 516 Policy Environment ................................................... 597 Performance.. ........................................................... 638 Conclusions .............................................................. 71
Bibliography. ................................................................. 77
iv 4
List of Tables and Appendices
Table 1 Protection and Performance Indicators ............ 20
2 Average Size Indicators .................................... 26
3 Productivity Indicators ............................ :....... 274 Profitability and Production Indicators ............. 285 Concentration Indicators ................................. 29
6 1991 Survey Results ........................................ 317 Size Distribution of Meat Establishments by
Efficiency Level ............................................... 328 Size Distribution of Dairy Establishments by
Efficiency Level ............................................... 33
9 Price Comparisons .......................................... 37
10 Regression Results of DRC/SERfor Meat Firms ................................................ 38
11 Regression Results of DRC/SERfor Dairy Firms ............................................... 39
12 Regression Results of TEC for Meat Firms ..... 40
13 Regression Results of TEC for Dairy Firms ..... 41
Appendix 1 Regional Distribution of Meat and DairyProcessing Firms .............................................. 79
2 Net Sales of Meat and Dairy Firms in 1991 ..... 80
3 Philippine Imports of Meat and Dairy Products:1983, 1985, 1988 and 1991 ............................. 81
4 Philippine Exports of Meat and Dairy Products:1983, 1985, 1988 and 1991 ............................. 86
5 Tariffs on Meat and Dairy Products ................. 89
6 hnport Restrictions and Liberalization
of Meat and Dairy Inputs and Products .......... 977 Protection and Performance Indicators
Using Alternative Assumptions ....................... 1'02
Introductionmlmlo_ol##t Qlmlmammlamaaaalll_
TRAt)rrtON^L trade theory has shown that the opening up ofeconomies to more trade has been generally beneficial, whether in
terms of welfare or efficiency gains. The argument has taken manyforms; most suggest that trade liberalization leads to productivity
growth. Numerous studies have established thispositive link.
However, more recent ones have shown that the relation may be
ambiguous. Furthermore, the literature on total factor productivity or
technical efficiency has provided insights on the importance of otherfactors.
At the same time, the structure of markets has taken an
increasingly prominent role in the analysis.The theory of trade in the
presence of increasing returns is, instead, derived from the explanationof intra-industry trade as due to economies of scale rather than
comparative advantage (Krugman 1979). This has spawned newliterature which links trade theory and industrial organization. The
new thinking questions the presumption that free trade is optimal;whether or not an economy gains from liberalization thus becomes an
empirical question.
The Philippines embarked on a structural adjustment program
which focused on trade policy reform more than a decade ago. The
effects of this policy shift on the industrial sector may now be
examined. Since these industries do not operate in a vacuum, buthave a particular structure partly defined by the nature of the product
and partly owing to the environment, such influences should also be
considered. The broad question that interests us is with what market
structure are efficiency and productivity gains from trade liberalizationmore likely.
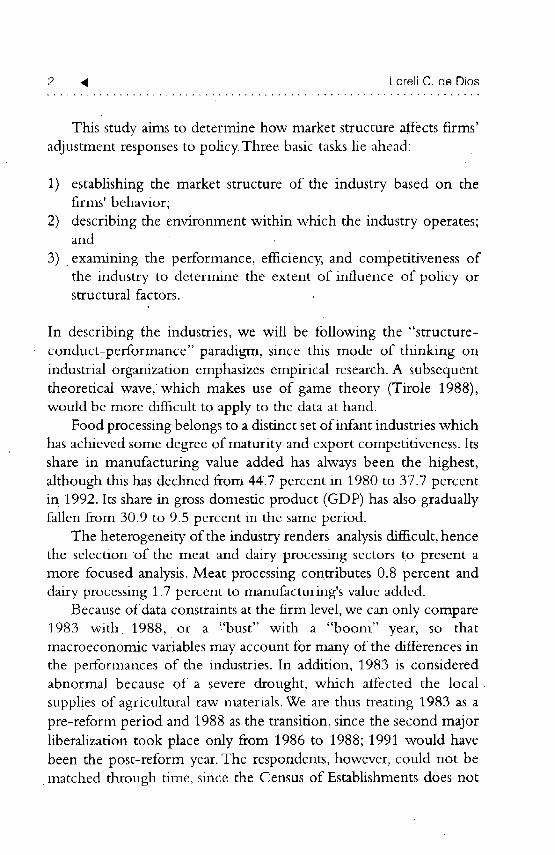
2 4 LoreliC, de Dios
This study aims to determine how market structure affects firms'
adjustment responses to policy. Three basic tasks lie ahead:
1) establishing the market structure of the industry based on thefirms' behavior;
2) describing the environment within which the industry operates;and
3) . examining the performance, efficiency, and competitiveness of
the industry to determine the extent of influence of policy orstructural factors.
In describing the industries, we will be following the "structure-
conductTperformance" paradigm, since this mode of thinking on
industrial organization emphasizes empirical research. A subsequent
theoretical wave, which makes use of game theory (Tirole 1988),
would be more difficult to apply to the data at hand.
Foodprocessing belongs to a distinct set of infant industries which
has achieved some degree of maturity and export competitiveness. Its
share in manufacturing value added has always been the highest,
although this has declined from 44.7 percent in 1980 to 37.7 percent
in 1992. its share in gross domestic product (GDP) has also gradually
fallen from 30.9 to 9.5 percent in the same period.The heterogeneity of the industry renders analysis difficult, hence
the selection of the meat and dairy processing sectors to present a
more focused analysis. Meat processing contributes 0.8 percent and
dairy processing 1.7 percent to manufacturing's value added.
.Because of data constraints at the firm level, we can only compare
1.983 with. 1988, or a t'bust" with a "boom" year, so thatmacroeconomic variables may account for. many of the differences in
the performances of the industries. In addition, 1983 is considered
abnormal because of a severe drought, which affected the local.
supplies of agricultural raw materials. We are thus treating 1983 as a
pre-reform period and 1.988 as the transition, since the second major
liberalization took place only from 1986 to 1988; 1991 would have
been the post-reform year. The respondents, however, could not bematched through time, since the Census of Establishments does not
Introduction _, 3
reveal their identities. The few firms that responded to the surveycould only furnish information for 1991_because past records were nolonger available. Interviews conducted with key informants alsocovered recent years. (Where the specific names of firms arementioned, the sources are published reports from other institutions.)Another constraint derives from the treatment by the Census of multi-product firms as plants in their respective industry classification,making it difficult to capture the effects of concentration, for instance,on firm behavior. These are taken into account in the discussion as
much as possible.
Part I: Meat Processing
1itatltoo.#oo_t.ltlamlmlmllllml
Industry Structure
THE latest available Census of Establishments (1988) shows a total of
70 large firms in the meat slaughtering, preparing and preservingsector (PSIC 3111) with value added of P1,160 million. Four-fifths
(80 percent) were in meat processing while the rest were in
slaughtering (10 percent), poultry dressing and packing (7 percent),
and other processing activities (3 percent). Industry size has more than
doubled since 1983, when only about 22 firms were listed under the
category while average value-added per firm has also grown.In 1988, small meat processing establishments, numbering about
188 (from 119 in 1983), had a total value added of P8.4 million.
Despite the increase in number, the average value added of these firms
has fallen, indicating that many of the firms contributed less than they
did in 1983. The government estimates the number of unregistered
small scale producers at 40 percent of the total, with 3-4 percent oftotal rated capacity (BOI 1989). About 70 percent of poultry
production dlso probably takes place in small entities, since
commercial poultry growers only account for 20-30 percent of
production.
Half of the large firms are based in metropolitan Manila, which
holds 60 percent of the market. Consumer lifestyles, preferences, and
incomes in the area make it a profitable location. Supplies', equipment,
and other services are also readily available here. However, this could
6 ,9 LoreliC, de Dios
only be from the marketing viewpoint since plants .built near
production centers are said to enjoy a 20 percent cost advantage
compared to the Manila-based operations due to savings on freight,
wages, and fuel (WB 1985). Thus, large firms that have also built
slaughtering plants in the provinces are able to Capture both marketing
and input advantages. The rest of the large plants are mostly in
Southern Tagalog, Bicol, and Eastern Visayas (Appendix 1). Many
small establishments are found in Central Luzon, probably because it
is a major source, of raw materials or simply because traditional
culinary skills, which Pampang0s are known for, are put to profitable• use.
There is a consensus among processing firms that two companies
dominate, the industry because they have established their leadership
long ago, produce a wide range of goods, and are able to engage in
advertising and research and development (P,.&D). Purefoods' share
comprises 50 percent while Republic Flour Mills (RFM) captures 37
percent of processed meat industry sales; the remaining 13 percent is
divided among the so-called "followers" in terms of what to produce.For canned meat, the ratio is 35:37:28.This perception is substantiated
by data from the Securities and Exchange Commission (Appendix• 2),
but the top firms hold ahnost equal shares of net sales, with RFM at31..6 percent, Purefoods at 28 percent, and Universal Robina at 23.9
percent; the remaining seven firms hold less than 2 percent each. The
prominence of these leading firms is further reflected in their 1990
rated plant capacities which averaged about 13,000 metric tons
(although no data was available for San Miguel Corporation [SMC]),
in contrast to the medium-scale food processors which had an averageof 2,785 metric tons.
The industry is actually composed of four leaders engaged in
virtually the same operations but with different origins.
The largest, SMC, derives its size from the fact that it has the
widest .range of products, starting with beer and bottled drinks and
expanding to dairy, packaging, processed meats, fruit drinks, cooking
oil, feeds (from brewing by-products), livestock and poultry. SMC isthe only firm with a cattle farm.
MeatProcessing _, 7
RFM started with flour rJailling and went on to feed milling,
piggery and poultry, fruit juices, cooking oil, processed meat; and
margarine. It recendy acquired the Selecta ice cream line.General Milling started with flour and feed milling, corn
processing, poultry and piggery. Its other products include pasta andsnack food, edible oil, and processed milk.
Purefoods, the original meat processor, was established in 1956
and diversified in the 1980s after it was purchased by the Ayala Group.
It integrated its piggery and poultry operations, and engaged in tunacanning, flour and pasta making and marketing of powdered milk. It.
also recently acquired Coney Island ice cream. Both RFM and
Purefoods have licensing agreements with US firms to manufacture
their products here. Thus, the diversification into processed meatfollowed logically from flour or brewery products to feedmills to
livestock. For Purefoods, the process was reversed, flour milling cameafter livestock. Even the less diversifiedVitarich Company started with
feedmilling and went on to poultry and processed meat.
The perennial problem of meat processors is the absence of a
continuous supply of quality meat, which comprises 70 percent of
total production cost. (This finding has already been discussed in
previous studies on the sector [WB 1980, 1985].) Large firms haveovercome this problem by establishing their own sources - backward
integrating - or by contract growing. But according to ofle large
company, "integration is a myth" since the costs of hog raising are sohigh and only 40 percent of the hog (i.e., pri_aals which are thejowls,
belly, and loin) is used in processed meat.This may be one reason why
domestic prices of pork are sometimes double when compared toforeign prices.
Poultry meat is an exception to this problem since supply has been
growing because of the entry of several integrators. Aside from theabovementioned four industry leaders, there are Universal Robina,
Vitarich, and Golden Country, and the successful contract growingschemes among broiler producers. However, this scheme has been
said to reinforce consolidation for large integrators and put small firms
at a disadvantage (WB 1980) in terms of technology and lower priceof inputs. Vertical integration from feeds to livestock means that
8 _ LoreliC,de Dios
pricing policies and raw material control is a step in the production
process which affects all other operations.
An indirect example is the supply of day-old chicks for small
poultry raisers. According to the Bureau of Animal industry (BAI),the five major commercial integrators are a constant source of supply.
However, since the poultry raisers usually need less than the minimum
transaction volume of 1,000 heads, they can only source these from
retailers who in turn get their supply from the distributors of the
commercial integrators. Both types - broilers bred for their meat, andegg-layers - are available from such integrators, but the latter is
sometimes in short supply.These are further classified based on weight
with greater demand for those weighing 35 to 45 grams. The BAI
raises chicks of imported breeds for sale to farmers exclusively for
breeding purpose s.Some 90 percent of dressed chicken undergo modern methods,
since most chicken plants are highly rated in terms of layout,
equipment, quality control, sanitation standards, and others. Hence,
quality has improved but with little additional cost as evidenced by
equal prices for both mechanically and traditionally dressed chicken.Around 84 percent of swine is traditionally raised (MKPFI 1988) and
probably slaughtered similarly. The "aseptic shock" method ofslaughtering (i.e., hitting the animal on the head) is slow compared tothe "electric shock" method employed by modern companies, and
results to lower productivity. However, consumer preferences for the
red meat produced by the old method render the new methods
unmarketable. Ii1 turn, integrated hog raising operations become less
profitable.In addition, because of the lack of national meat grading standards
(Ibarra 1990), little or ilo price differentials exist between different
qualities of meat. Standard cuts are obtainable from institutionalized
markets, but in general, quality is not a major consideration. Only
large integrated meat processors follow a set of standards for quality
control purposes, which also result in higher costs and prices.
Nevertheless, the complaint usually raised about the input supply
is that local slaughterhouses cannot meet the dernand for specific cuts.
The Philippine Association of Hog P,.aisers (PAHP,.I) has responded to
MeatProcessing I_ 9
what it perceives as a marketing problem by setting up a
slaughterhouse in 1992 which would eliminate middlemen by
centralizing slaughtering, selling to buyers onsite and controlling porkprices.
The Philippine Association of Meat Processors (PAMPI),
however, disagrees with this solution since large firms have their own
slaughterhouses; what the srnaller firms need is a continuous supply of
certain cuts. One processing firm commented that prices are
sometimes actually higher in a PAH1LI slaughterhouse. Local pork
prices are sometimes about 50 percent higher than foreign pork
prices, partly because of subsidies given to foreign farmers. Althoughthe country is self-sufficient in pork and choice cuts cannot be
imported, PAHRI is apprehensive about the possibilities of smuggling.
Small processing firms are worried that because of the sudden drop in
domestic supply and due to import restrictions, prices may alsosuddenly rise.
Contributing to the input supply constraint is the inferior
livestock marketing system and poor compliance with abattoir
standards (Ibarra 1990). The methods of transporting livestock often
result in reduced weight and compromise meat quality and enables
unscrupulous traders to delay slaughtering in order to extract lower
prices from livestock farmers. In addition, the already small
population of cattle and carabao is being further depleted because ofpoor reproductive performances caused by poor nutrition and
management, high slaughter rate, and low cow-calf production.Numerous studies have also documented other problems such as
inadequate support services, absence of security of tenure in Pasture
Lease Arrangements (SGV 1988), the shrinking of forage and pasture
lands which were affected by agrarian reform, lack of credit, and the
high cost of importing cattle and semen biologics (DA 1991). Figureson livestock inventory show that the population of cattle and carabao
has declined from 1986 to 1990, but that of hogs, chicken, and duckhas grown.
The more basic problem tbr livestock raisers is the cost of corn,
which is 50 percent of the volume of feed ingredients, but reaching7(1 percent of actual peso costs. There is a need to match seasonal and
10, 4 LoreliC,de Dios
locational demand and supply Of corn. Infrastructure deficiencies are
the main reason why locally _grown corn is more expensive than the
imported, e.g., P5.60/kg from Mindanao versus P5.20/kg landed costfrom the US.
The bulk of fresh meat imports consists of manufacturing grade
beef and offals (Appendix 3) and mutton and pork. Dressed poultry
and poultry cuts and liver are also purchased from abroad. Some
imports of processed meat have been recorded but these comprise a
mere 0.1 percent of total food imports. These may also be attributed
to import restrictions, which were first imposed in 1970, and again in
1983 and 1984, after a few years of deregulation in 1981 and 1982.Non-canned goods are not substantially imported because of their
higher perishability and much lower prices here. Hence, domestic
producers have taken advantage of the market. Smuggling of canned
meat, especially of a particular Chinese brand, has irked local
producers. Labor, raw materials, and power costs are undisputedly
lower abroad, aside from their alleged use of meat extenders and
therefore lower quality and poor packaging:
The country's processed food exports, which consist mainly of
Pork and chicken, have been minimal (Appendix 4), at 0.08 percentof total agricultural exports. Other processed meat has also been sold
abroad such as ham, sausages, other preserved pork cuts, meat flour
and other prepared/preserved meat and offals.The major constraint
to exports is the high quality standards imposed by the importingcountries in the form of sanitary and phyt0sanitary requirements and
technological specifications. For example, a medium-scale processor' s
prospect of selling to Japan did not materialize because of these.Some 80 percent of meat is sold fresh because of Filipino
preferences for fresh home-cooked food. The processed meat market
is probably confined to the urban high- and middle-incomeconsumer, but there are indications that the other mai:kets are buying
more. For instance, producers are segmenting the market into the
high, middle and low income (A, B, and C) groups by producing, for
each market. "Delicatessen" types of processed meat were introduced
by the three leading firms at about the same time to cater to the A
group: This may have been a response to the perception that the
MeatProcessing I_ 11 "
upper-income market served by the hotel-delicatessen outlets may be
penetrated. It is said that this is profitable because price changes here
are more readily absorbed by these consumers (although one large
processor views this as only an "image" strategy) and can subsidize the
production of other goods which are more price-elastic. B consumers
buy cold cuts and canned goods, which are priced more moderately
but are of better quality than goods catering to the C market. Thus
the variety of product choices decreases as one goes down the incomeladder.
The main processed products are frozen meat, corned beef, and
dressed frozen poultry. One particular product -- the hotdog --
dominates production and sales (70 percent), but margins are low andprices do not rise too much because of the leaders would rather not
have their competitors eating into this market. Since medium-scale
producers can only charge prices that are at most equal to that of the
leaders, their objective is to increase their market shares by increasing
productivity or lowering costs. Some achieve this by selling in wet
markets, where turnover is faster and collection periods shorter (ifsomewhat riskier), translating into lower working capital
requirements. These businesses are also usually family-run, which
means lower labor costs, and faster decisionmaking, which enable
them to survive and charge cutthroat prices.Despite the established competition, smaller firms still view the
increasing market segmentation as a growth opportunity.They do notincur as much quality control costs and C market consumers will
ignorequality differences. Thus, unlike large firms who cater to all,many of the smaller firms are confined to the B and C markets. The
exceptions are a few small- or medium-scale businesses which
speci::lize in "delicatessen" products confined to the A market.
Some firms are exclusive suppliers of certain fastfood outlets oroperate franchises or chain stores, which is a direct way of selling. In
fact, one of the leaders established a meat-processing subsidiary for
the sole reason of supplying a fastfood chain. Only one firm actually
started out first in the fastfood business. Such firms are particdlarly
meticulous about quality control, as shown by their adoption of
12 41 LoreliC. de Dios
quality circles, or the "kaizen" productivity improvement program. In
general, all of the larger firms and many of the medium-scale onesdevote resources to research and development (1L&D) and quality
control. The importance of brand names as an indicator of quality
varies directly with the size of the producer, so that the larger firms
need to be strict about quality maintenance to cultivate brand loyalties
and preserve market shares. This is in contrast to small firms who can
simply change brand names because their losses will not be as large,
although the company's reputation may also be partly affected.
Large firms have the technical capability to produce high-quality
products which me'et international standards (BOI 1989), although
they use a mixture of manual, semi-automatic and automatic
operations. Medium-scale firms use batch-type operations, given thesmaller marl<et and low volume of raw materials, even if they have
automated high-volume facilities. Smaller firms use locally-fabricated
equipment with "inferior technology."
A BAI study (1990) reports that there are few meat processing
equipment distributors and most are in Metro Manila. However, thereare several fabricators who can make sets for line operations or
individual machines.These cost more than imported machines.Tiros,
larger firms prefer to import xnachines. Others buy used equipmentand repair or modify them. Given the small price differences between
high- and low-capacity types, many firms choose to buy the former.And since modifications are not subject to any design regulations, the
materials or designs may be below safety or sanitary standards.The rated capacity of 19 major meat processing facilities in 1983
was 59,400 metric tons (WB 1985). However, utilization was only
50-55 percent due to technological deficiencies or overcapacity (BOI1989), and more recently, the restricted market, which forces firms
into batch-type processes and short production runs. For the past three
years the poor economy has kept prices down: Profit margins are
usually 5-1.0 percent for canned goods and 10-15 percent for cold
cuts (BOI 1989), but now smaller firms are only starting to breakeven.
Some 60 percent of processed meat is packed into polyethylene
bags, the rest is canned (WB 1985). Packaging costs are a major
Meat Processing _, 13
headache, accounting for 35 percent of the total (BOI 1989); 5
percent for frozen, 24-39 percent for canned, and 51 percent for
bottled meat (WB 1980). Aside fi'om the higher domestic price of
packaging materials, the supply is inadequate and suppliers often
cannot meet •specifications. LocaUy-made open-top• or sanitary, cansare of inferior quality, making imports necessary for export lines. In
addition, distribution costs often reach 10 percent, owing to poor
infrastructure. Firms are diversifying partly to use their technical and
• marketing capacities more extensively since overhead costs are noteasily reduced anyway.
A large processing firm believes that its so-called inefficiencies are
due, not to uncompetitiveness but to limited demand. Given their
high fixed costs, their large asset base would be justified by increasing
volumes of production. But since demand is inadequate, they cannot
move on to higher value-added aspects of production, However, this
could be a short-term phenomenon related to the recession rather
than a long-,term condition.
2• m_#oQ,-lltoo#e##Q_.lio0 #_#_ml
Policy Environment
FoR the past 20 years, government efforts at developing the local
livestock industry have focused on increasing and improving stocks for• beef and milk. These efforts consisted of.
1) a national breeding program;
2) a •regular dispersal prografn;
3) the Multi-Livestock Dispersal Loan Program, which provides seedfunds to conduit banks to finance loans to farmers for the purchaseof animals from the BAI;
4) an animal health program;
5) forage production and pasture development; and6) livestock auction markets.
The BAI has also started undertaking research and product
development, training, and technical assistance specifically for the
meat slaughter and by-products industry through its Animal ProductsDevelopment Center.
The National Meat Inspection Conmaission (NMIC) regulates the
flow of livestock and its products through inspection services. The
implementation of standards for accreditation is hampered by the lack
of funds. Thus, only a small proportion of slaughterhouses are
accredited e.g., 18 percent in 1991. Moreover, while the regulation •
demands that processing plants be accredited, these can operate legallywithout accreditation (Ibarra 1990), and abattoirs that do not meet
the standards still operate because of the high costs of meeting suchstandards. The NMIC has no jurisdiction over the management of
these slaughterhouses, e.g., small unaccredited ones are under
16 4 LoreliC, de Dios
nmnicipal governments. Thus, the condemnation of meat in the
country is reported to be a mere 0.05 percent, way below the normal
1 percent rate in other countries.The Bureau of Food and Drugs (BFAD) regulates food quality
and safety. This study attempted to examine these rules but copieswere unavailable. The list that was eventually put together shows that
many of the standards are simply copied from the USFDA and may
thus be old and inappropriate and determining which are still in effect
was not easy. Nevertheless, certain basic rules have been laid down
and repeated complaints or obvious large scale violations receive
prompt attention, such as in the case of radioactive-contaminatedpowdered milk from Holland, or the aflatoxin content of peanutbutter. Over 3,000 establishments are inspected and 500 samples
collected annually, e.g., ofnfilk for lead content, meat for nitrites and
nitratesl refined sugar and canned sardines/mackerel for heavy metals,
and others. However, considering the great number of food
establishments and a limited budget, implementation is wanting.
Product testing is undertaken by the Department of Agriculture
(DA), the Department of Science and Technology ITDI, and the NFA
Food Development Center. The latter two accept I:Z&D contracts
with the .(usually small- and medium-scale) private sector. The
University of the Philippines at Los Bafios (UPLB) is another research
facility. Examples of food-related K&D contracts are productdevelopment, thermal processing, waste utilization, chemical and
microbiological hazards, handling and storage, drying, fermentation,
freezing methods, and low cost goods production.
Despite the Obvious involvement of the government in the food
sector, the industry has largely developed with the initiatives and
ability of private business (WB 1985). Among the numerous
regulations that affect the industry are:
• EO 234 of 1970, the carabao slaughter ban, which aimed to boost
the food program. It was amended by EO 626 of 1980, which
allowed the slaughter of seven-year old male and 11-year old female
carabaos; the ban was lifted in 1990;
° EO 626a of 1980, which banned the interprovincial transport of
Meat Processing I_ " 17
carabaos to preserve the carabao population used as work animals.
Unfortunately, this regulation segmented the market, creating
surpluses in some provinces and shortages in others;• R_A 7394 of 1992, the Consumer Act of the Philippines, which
consolidated all rules relating to consumer product quality andsafety;
• R_A7581 of 1992, which stabilized the prices of basic commodities;and
• Memo Circulars and Administrative Orders of the BFAD.
A particular BFAD regulation, Administrative Order No. 88-B of
25 May 1984, affects the variety of products that food manufacturers
decide to produce. It banned the use of superlative such as "premium,
super, special, excellent" and other descriptions on product labels
which connote superiority ox_erother products, unless the company
manufactured different qualities of the same product, for which ajustification to support the claim should be attached.
In 1979, the importation of beef briskets and trirnrmngs from
• Australia and New Zealand was centralized through the PhilBAI, a
government corporation created for the purpose, which was
dismantled in 1986. Since then, meat processors have undertaken their
own importations, but the NMIC has taken charge of import
restrictions on meat and meat products. Only accredited meat
processors and hotels certified by the Department of Tourism were
allowed to import meat. The rated capacity and projected needs of
processors were evaluated and only 50 percent of the requestedvolume was granted. In the case of hotels, size and seating capacity
plus projected requirements were the bases for granting import
licenses. Only frozen meat and choice cuts were allowed. Canned
products are not, and processed frozen products are supposedly
allowed but no requests have as of yet been forwarded.
In 1993, the DA again restricted imports of corn and corn
substitutes, live swine, pork products, live poultry, chicken and other
meat products, by virtue of RA 7607, the Magna Carta of Small
Farmers. Only upon an actual or anticipated shortage of such productswould imports be allowed, but a maxinmm volume would also be
18 ._ LoreliC. de Dios
specified. Accredited importers who are also end-users can import,with the following allocations: 80 percent of the volume or number
of animals for large-scale livestock producers, integrators, or meat
processors, and 20 percent for small-scale producers or meatprocessors. The NMIC still takes charge of meat and meat products;
the BAI supervises live animal imports. Live cattle, beef and beef
products are now freely importable.
The govermnent has also given the industry investment incentives.
However, only the production of livestock and poultry is part of the1992 Investment Priorities Plan. So far, only about 13 meat producers
and 19 projects have availed themselves of BOI incentives since 1976,
of which three firms and five projects have been cancelled. They are
all nonpioneers and most are large. Again the more established firmsare able to consolidate their market position further with these
benefits; smaller firms incur only increased transaction costs if theyavail themselves of these benefits.
The value-added tax (VAT), which was implemented in 1988, is
perceived as another problem by rneat processors, who say that it
increases their costs. Since their agricultural inputs are tax-exempt,
they cannot simply pass on the VAT to the consumer because of thecompetition.There is thus an incentive to underreport sales. Manasan(1993) confirmed that the VAT is biased against food processors,
although to a much lesser extent than previously estimated. In 1983,domestic sales taxes were 1 percent for slaughtering and 5 percent for
processed meat. Advanced sales tax was 10 percent and markups were25 percent.
Appcndix 5 details the tariff rate structure for different meat
products in 1983, 1988, and 1991. The tariff structure has generally
been a "cascading" one, higher for the processed items and lower for
the raw material, with the exception of poultry which has always had
a high tariff. The range also narrowed within the period, because ofincreased rates on live animals in 1991 (but very low tariffs on
breeding animals) and on meat in 1.988 and 1991.
Import restrictions (Appendix 6) were imposed on live animals
and fresh meat in 1975 and 1979, partly removed in 1986 and 1988,
totally removed in 1992, but reimposed in 1993. Restrictions on
MeatProcessing p, 19
processed meat were first imposed in 1970, removed in 1981 and
1982, reinstated in 1983 and 1984, removed again in 1992, and
reimposed in 1993. Today, live chicken, pork, dressed poultry, fresh
meat, and meat products except beef- about 46 percent of
commodity lines -- are still subject to import restrictions. The short
period of liberalization of salted dried and smoked meat (from 1982
to 1983), of other prepared meat (from 1981 to 1984), and of some
types of fresh meat (from 1986 to 1988) together with. theliberalization of live animals indicate that tariff-based effective
protection rates (EPRs) may be understated for beef or pork products,
since the inputs would be both relatively cheap and easy to import
while the outputs have high tariff and non-tariff barriers. Hence, it is
not surprising that import-penetration indices are a mere 0.05 to
0.075 percent for processed meat, 0.9 to 0.45 percent for
slaughtering, and 0.02 to 0.91 percent for other poultry for 1983 and1988.
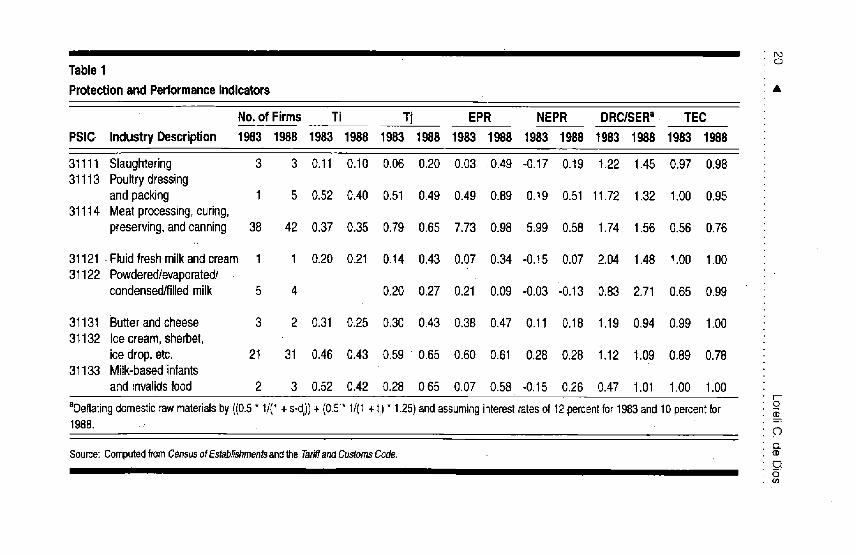
• Table 1 shows the implicit tariffs on the output (T) and inputs(T), which take domestic sales taxes and markups into account. The
Ts were higher than the T s only for meat processing in 1983. The.I I
reverse was true for slaughtering but the same for poultry dressing. In
• 1988, the Tjs were higher than the T_s in all sectors. Again, tariffsincreased rather than decreased on the meat inputs but remained thesame on the output. Furthermore, the performance of each sector
was affected by the presence of nontariffbarriers on both inputs and
output in all sectors (except for canned processed meat) in 1983, and
live swine and fresh meat and all processed meat (except canned beef)
in 1988, not to mention the degree of intensity of these quantitativerestrictions. Such are not accounted for in the implicit tariffs although
they have a bearing on domestic costs• Both the highcr tariffs on meat
and presence of Qlks on input and output prevent us from showing
the effects of trade policy changes on the industry's performance
during the period, but we can still examine the relationship between
the industrial structure and its efficiency in the prescnce of protection.
The impact of such policies may be gauged from their EPKs, also
shown in Table 1. In 1983, these reflected the implicit tariffs on
slaughtering and poultry dressing but the estimate for meat processing
DO0
Table1
Protectionand Performanceindicators •
No.of Firms Ti Tj EPR NEPR DRC/SERi TEC
PSIC tndustryDescription 1983 1988 1983 1988 1983 1988 1983 1988 1983 1988 1983 1988 1983 1988
31111 Slaughtering 3 3 0.11 0.10 0.06 0.20 0.03 .0.49 -0.17 0.19 t.22 1.45 0.97 0.9831113 Poultrydressing
andpacking 1 5 0.52 0.40 0.51 0.49 0.49 0.89 0.t9 0.51 11.72 1.32 1.00 0.9531114 Meatprocessing,curing,
preserving,andcanning 38 42 0.37 0.35 0.79 0.65 7.73 0.98 5.99 0.58 1.74 1.56 0.56 0.76
31121 Fluidfreshmilkandcream 1 1 0.20 0.21 0.14 0.43 0.07 0.34 -0.t5 0.07 2.04 1.48 1.00 1.0031122 Powdered/evaporated/
condensed/filledmilk 5 4 0.20 0.27 0.21 0.09 -0.03 -0.13 0.83 2.71 0.65 0.99
31131 Butterandcheese 3 2 0.31 0.25 0.30 0.43 0.38 0.47 0.11 0.18 1.19 0.94 0.99 1.0031132 Icecream,sherbet,
icedrop, etc. 21 31 0.46 0.43 0.59 0.65 0.60 0.61 0.28 028 1.12 t.09 0.89 0.7831133 Milk-basedinfants
and invalidsfood 2 3 0.52 0.42 0.28 0.65 0.07 0.58 -0.15 0.26 0.47 1.01 1.00 1.00I'--
, 0aDeflatingdomesticrawmaterialsby((0.5* !/(I +s-d,))+(0.5* 1/(1+ti) 1.25)andassuminginterestratesof 12percentfor1983and10percentfor1988. : -C)
CL
Source:ComputedfromCensusofEstablishmentsan_theTariffandCustomsCode. m
I 0cq
MeatProcessing I_ 21
was extremely high, again probably due to the binding import
restrictions on the output (which allows local processors to charge
higher-than-world prices), combined with the relative ease of
importir/g beef inputs. The tight domestic supply situation brought
about by drought may have also affected domestic prices.The EPRs in
1988 increased substantially for slaughtering and poultry dressing but
decreased, also substantially, for meat processing, although they _vere
still on the high side. These relative magnitudes seem to be the reverseof the trend observed in the 1974 protection structure, where EPRs
were very high in slaughtering and poultry dressing (128 percent),
and very low in canned and uncanned meat (5 and 68
percent)(Bautista, Power et al. 1978).This trend was observed despite
the treatment of most processed meat as unclassified consumer goods
(i.e., luxury imports) in the 1970 commodity classification scheme,
and the restriction of live animals and fresh meat imports only in197.5. Across sectors, meat processing was the most protected in both
1983 and 1988 since its T.s were always much higher than its T,s,J
although in 1988 the estimate for poultry dressing was close to that of
meat processing.
The NEPR indicates that slaughtering was penalized by the
overvaluation of the peso in 1983, while the rest of the sectors still
enjoyed some amount of protection. Meat processors were still very
highly protected especially in 1983.
3m • # # • • • .. t t a t i # _ # # _ ou ! _lla m _ m u
Performance
T :E 1 also shows the domestic resource costs (DRCs). DRCs at
shadow prices (DRC/SER) in 1983 reflect a particularly high-cost
foreign exchange saving activity in poultry dressing. But since onlyone firm was sampled, this figure may not be representative.The input
and cornfeed supply problem bears directly on this performance as
lamented by the processors themselves; the effects of the year's
particularly bad drought may have also been partly felt. Poultry
dressing may have been more affected because of import restrictions
on live and dressed poultry up to 1986, which may have been more
binding compared to those imposed on other animals or beef.
Defining the minimal inefficiency range at 1.21 to 1.50, and mild
inefficiency at 1.51 tO 2.0, slaughtering qualifies in the first and meat
processing in the second category. In 1988, however, the situation
vastly improved for poultry dressing (with more respondents), which
became minimally inefficient. This is significant, considering that live
poultry is the only restricted live animal import after its deregulationfrom 1986 to 1992. Integrators gained from protection on both ends
since live poultry and dressed poultry are now restricted imports,
although they were still affected by the corn supply situation. Meat
processing retained its mild inefficiency. Slaughtering worsened
slightly but still kept within the minimally inefficient range.Considering that protection through tari_ and nontariff restrictions
were pervasive in this sector, the results are somewhat unexpected.
Across sectors, meat processing turned in the relatively worst
performance, although it was the most protected both in terms oftari_ and QRs.
24 4 LoreliC. de Dios
As early as 1974, slaughtering and poultry dressing, as well ascanned and uncanned meat, were estimated to be efficient foreign-
•exchange savers, showing DRC/SERs of 0.87, 0.90, and 1.02
respectively (Bautista, Power et al. 1978).•Poultry dressing showed the
most improvement in 1988, with the.lowest DRC/SER ratio..
Although there was a difference in the number of observations, itcannot be denied that the sector was an overall winner: For instance,
an unpublished DRC/SER of a large integrator in 1988 wasestimated at 0.17 and its EPR 53 percent, in contrast to a
slaughterhouse's figures of 2.36 and 52.41 percent respectively (Pineda
1988). The removal of import restrictions on live poultry and dressed
poultry (except chicken) in 1986 may have exerted a discipliningeffect on this sector.
The technical efficiency coefficients (TEC), also in Table 1, show
establishments in slaughtering and poultry dressing to be near thefrontier. However, bec;_Lusethese are averages of the technical levels of
the sampled plants, unity does not necessarily mean state-of-the-art
technical efficiency if their current practices are not up-to-date.Hence, the more observations, the more •dispersed and the lower the
TEC, as is shown by meat processing in both years. However, giventhat its DRC/SER is within the mildly inefficient range, we may
conclude that it is not technically inefficient.This is supported by the• s
finding that many medium- and small-scale firms, which rely on
manual operations, are able to compete with the larger companies interms of price. At the same time, inadequate specialization among
firms producing similar products are said to cause deviations from
"best practice" (Pack and Westphal 1986). And since many meat firmsproduce a wide range of product choices •rather than just one type per
firm, this is probably the case. However, since the production methods
in meat processing are not too dissimilar between products or probably
even between firms, specialization is not a profitable pursuit. Taste
differences are probably the crucial determinant of specialization, and
this does not necessarily entail a different production method.
The TEC of poultry dressing is very close to unity, which isconsistent with the handful of observations and a mininaally inefficient
DRC/SER in 1988. Nevertheless, given that its DRC substantially
MeatProcessing b, 25
improved from 1983, poultry dressing seems to be the economically
and technically efficient sector.This higher relative efficiency has been
ascribed to either its more recent operations, the previous experience
of most entrepreneurs in meat processing, or the help of foreignexpertise (WB 1985).
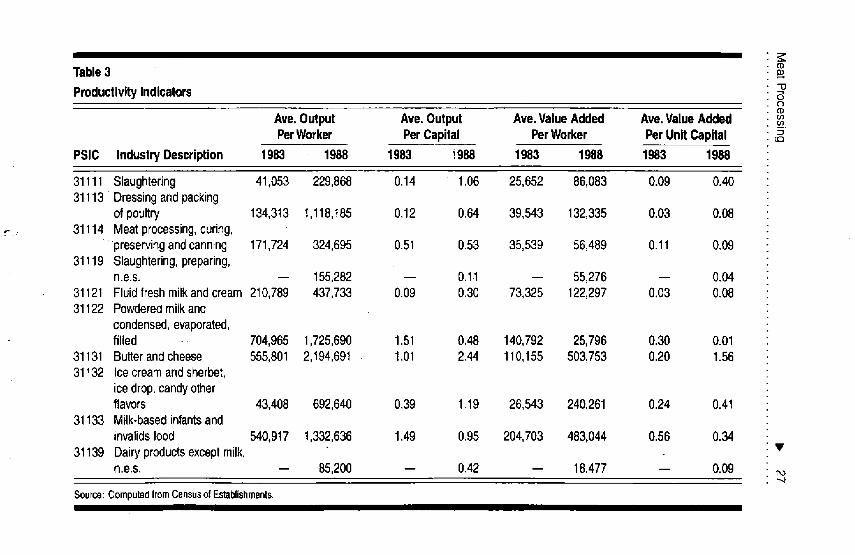
Tables 2 and 3 give the size and productivity indicators for the
industry. In 1983 and 1988, poultry dressing had the highest average
value-added, output, capital, and employment per firm, although
these figures rose for all sectors during the p'eriod. Three out of four
productivity indicators show meat processing as the most productive
in 1983 but in 1988, slaughtering and poultry dressing had the highest
productivity. Moreover, these two sectors showed improved
productivity for the period, based on all indicators. Capital per worker
o (Table 4) which was highest in poultry dressing in both years, grew as
well for meat processing but figures fell for slaughtering.
Price-cost markups are shown in Table 4 and are highest in
slaughtering in both years although these margins dropped for allsectors. The rise in the margins may be due to an increase in value-
added, a drop in wage costs, or a decrease in the value of output, given
the measure for this indicator. The degree of vertical integration, as
defined by the value-added-to-sales ratio, was most pronounced in
slaughtering and much less in poultry dressing, even when theyinvolved essentially the same operations. This is probably due to thegreater value-added in the former. All three sectors showed decreased
vertical integration in 1988, which may be the reason why minimum
efficient scale (MES), defined as the average value-added of the top 50percent of firms in the sector, is also highest in slaughtering (excluding
the single observation for poultry), although in 1988, that of poultry
dressing was not too far behind.The lower MES for meat processors isa reflection of the relative ease with which such firms are estabhshed.
Herfindahl indices and concentration ratios in Table 5 are also
highest in slaughtering (after ignoring the single sample for poultry
dressing), although they are much lower in 1983 than in 1988. Thehigher levels of concentration in sales, revenue, and value added in
1988 for slaughtering indicates fewer firms which are exacting higher
profit margins than other sectors, which is made possible by the
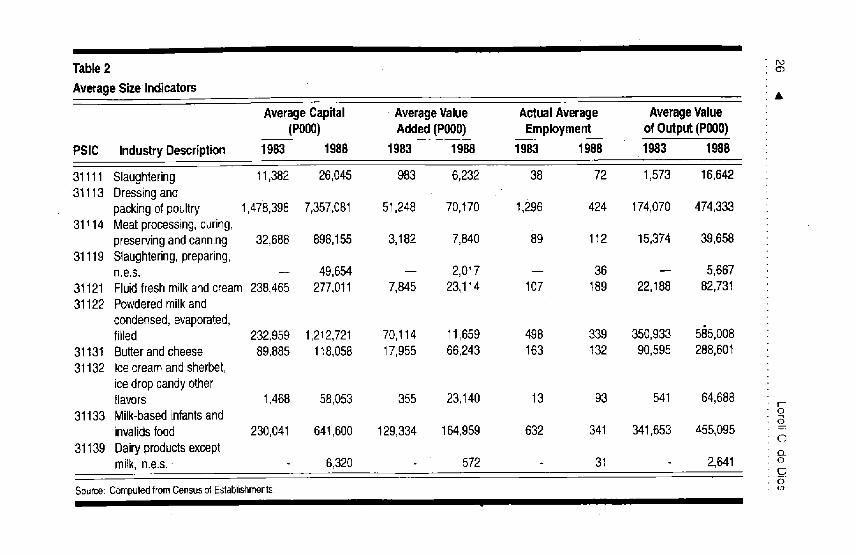
Table2
AverageSizeIndicators •
AverageCapital • AverageValue ActualAverage AverageValue(P000) Added(P000) Employment of Output(P000)
PSIC IndustryDescription 1983 1988 1983 1988 1983 1988 1983 1988
31111 Slaughtering 11,382 26,045 983 6,232 38 72 1,573 16,64231113 Dressingand
pacldngof poultry 1,478,398 7,357,081 51,248 70,170 1,296 424 174,070 474,33331114 Meatprocessing,curing,
preservingandcanning 32,688 898,155 3,182 7,840 89 112 15,374 39,65831119 Slaughtering,preparing,
n.e.s. -- 49,654 -- 2,017 -- 36 -- 5,66731121 Fluidfreshmilkandcream 238,465 277,011 7,845 23,114 107 t89 22,188 82,73131122 Powderedmilkand
condensed,evaporated,filled 232,959 1,212,721 70,114 11,659 498 339 350,933 585,008
31131 Butterand cheese 89,885 118,058 17,955 66,243 163 132 90,595 288,60131132 Icecreamandsherbet,
ice dropcandyotherflavors 1,468 58,053 355 23,140 13 93 541 64,688 t-o
31133 Milk-basedinfantsand $
invalidsfood 230,041 641,600 129,334 164,959 632 341 341,653 455,09531139 Dairyproductsexcept o_
milk,n.e.s. 6,320 572 31 2,641£3o
Source: Computed from Census ot Establishments.
(DTable 3
Productivity Indicators _oO(D
Ave. Output Ave.Output Ave. ValueAdded Ave.ValueAddedPerWorker PerCapital PerWorker PerUnit Capital _
PSIC IndustryDescription 1983 1988 1983 _.988 1983 1988 1983 1988
31111 Slaughtering 41,053 229,868 0.14 t.06 25,652 86,083 0.09 0.4031113 Dressingandpacking
of poultry 134,3t3 t,118,t85 0.12 0.64 39,543 132,335 0.03 0.08_- 31114 Meatprocessing,curing,
' •preservingandcanning 171,724 324,695 0.51 0.53 35,539 56,489 0.11 0.0931119 Slaughtering,preparing,
n.e.s. -- 155,282 -- 0.11 -- 55,276 -- 0.0431121 Fluidfreshmilkandcream 210,789 437,733 0.09 0.30 73,325 122,297 0.03 0.0831122 Powderedmilkand
condensed,evaporated,filied - 704,965 1,725,690 1.51 0.48 140,792 25,796 0.30 0.01
31131 Butterandcheese 555,801 2,194,691 1.01 2.44 110,155 503,753 0.20 1.5631132 Icecreamandsherbet,
ice drop,candyotherflavors 43,408 692,640 0.39 1.19 26,543 240,261 0.24 0.4t
31133 Milk-basedinfantsandinvalidsfood 540,917 1,332,636 1.49 0.95 204,703 483,044 0.56 0.34
31139 Dairyproductsexceptmilk, •n.e.s. -- 85,200 -- 0.42 -- 18,477 -- 0.09
"-4
Source:ComputedfromCensusofEstablishmentsI
I
Table4
PofitabitityandProductionIndicators
PriceCost Capital/Labor ValueAdded/ AverageAgeof MinimumEfficientMark-up (inthousands) Safes Equipment Scale •
PSIC industryDescription 1983 1988 1983 1988 1983 1988 1983 1988 1983 1988
31111 Slaughtering 0.62 0.28 296 215 0.62 0.37 4.75 4.88 0.76 018631113 Dressingandpacking
of poultry 0.29 0.06 1,190 1,734 0.29 0.12 12.30 12.37 1.00 0.8131114 Meatprocessing,curing,
preservingandcanning 0.21 0.07 336 617 0.20 0.17 5.28 _b 0.39 0.7531119 Slaughtering,preparing,
n.e.s. -- 0.29 4 1,360 -- 0.37 -- 5.23 -- 0.6631121 Fluidfreshmilkandcream0.35 0.18 2,228 1,465 0.37 0.28 7_45 13.40 1.00 1.003112:_)Powderedmilkand
condensed,evaporated,filled 0.20 -0.03a 467 3,577 0.20 0.02 6.78 16.30 0.64 0.66
31t31 Buyerandcheese 0.20. 0.18 551 897 0.20 0.23 7.18 7.25 0.78 0.9431132 Icecreamandsherbet,
ice dropcandyotherflavors0.63 0.25 109 583 0.65 0.35 6.44 7.21 0.65 0.6631t33 Milk-basedinfants
andinvalidsfood 0.38 0.27 364 1,409 0.39 0.34 5.48 b 0.74 0.7631139 Dairyproducts
exceptmilk,n.e.s. -- 0.02 -- 203 -- 0.22 -- 6.18 -- 0.53 S-
aNegative,probablyduetoa negativenumeratorbecausecompensationcostscouldhaveexceededvalueadded, obSinceaverageagewascomputedas[(usefullifexdepreciation)- (bookvalue)]/(depreciation),thesesectorshadnegativeresults. D_
Source:ComputedfromCensusotEstablishments. O6
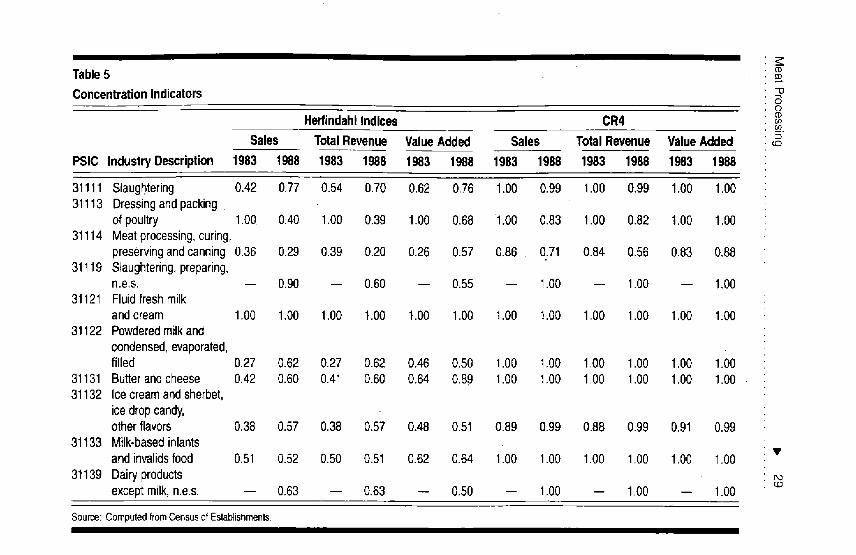
Table5 o
ConcentrationIndicatorsO
HerfindahfIndices CR4u)
Sales TotalRevenue ValueAdded Sales Total Revenue ValueAdded _
PSIC Industry Description 1983 1988 1983 1988 1983 1988 1983 1988 1983 1988 1983 1988
31111 Slaughtering 0.42 0.77 0.54 0.70 0.62 0.76 1.00 0.99 1.00 0.g9 1.00 1.0031113 Dressingandpacking
of poultry 1.00 0.40 1.00 0.39 1.00 0.68 1.00 0.83 1.00 0.82 t .00 1.0031'114 Meatprocessing,curing,
preservingandcanning 0.36 0.29 0.39 0.20 0.26 0.57 0.86 0.71 0.84 0.56 0.83 0.8831t 19 Slaughtering,preparing,
n.e.s. -- 0.90 -- 0.60 -- 0.55 -- t.00 -- 1.00 -- 1.0031121 Fluidfreshmilk
andcream 1.00 1.00 1.00 t.00 t.00 1.00 1.00 1.00 1.00 1.00 1.00 1.0031122 Powderedmilkand
condensed,evaporated,filled 0.27 0.62 0.27 0.62 0.46 0.50 1.00 1.00 1.00 1.00 1.00 1.00
31131 Butterandcheese 0.42 0.60 0.41 0.60 0.64 0.89 1.00 1.00 1.00 1.00 1.00 1.0031132 Icecreamandsherbet,
ice dropcandy,other flavors 0.38 0.57 0.38 0.57 0.48 0.51 0.89 0.99 0.88 0.99 0.91 0.g9
31133 Milk-basedinfantsand invalidsfood 0.51 0.52 0.50 0.51 0.62 0.64 1.00 1.00 1.00 1.00 1.00 1.00
31139 Dairy productsexceptmilk, n.e.s. -- 0.63 -- 0.63 -- 0.50 -- 1.00 -- 1.00 -- 1.00
Source:ComputedfromCensusofEstablishmenls.
30 4 LoreliC, de Dios
existence of binding QRs on live swine that prohibit imports from
exerting their discipline. The opposite situation is true for processed
meat, which, seems logical since more competition means that prices
and profit margins cannot rise as much. The ease of entry into sman-
scale meat processing serves to offset the existence of import
restrictions, which is a major reason for industrial concentration,
especially because of nonbinding import restrictions on one major
import and rampant smuggling of the restricted finished product. The
f0ur-firm concentration ratios (CR4s) show all sectors to be highlyconcentrated.
The leading firms described earlier are multi-product
establishments and although the Census includes plants and not firms,the indices are a fair indication only of the degree of plant
concentration in each sector, not of firms as described earlier. It willbe useful to determine the concentration of firms since these are
engaged in basically the same activities which may be run
independently but nevertheless influence their overall decisions,
strategies, and policy responses.
Poultry dressing again is the most capital-intensive sector in the
industry but it also utilizes the oldest machines. And although
employment was highest for poultry dressers, their value-added was
correspondingly the largest. Thus, contribution per worker was alsoi
the largest; output behaved similarly. Capital productivity, however,
was not as high. Meat processors were the heaviest investors in new
capital goods for large- and medium-scale firmg. Per firm capital,
value-added, output, and employment were also high in this sector
relative to those of slaughtering, but productivities were not always
higher. Capital per worker was only half that of poultry dressing.Table 6 shows the EPRs and DRC/SERs of 11 firms, which were
computed from their 1991 financial statements. In the poultry
dressing sector, the firms were either penalized by the protection
structure or totally unprotected. Based on their DRC/SERs, one was
a high-cost foreign-exchange saver, while the other was efficient, ..
although the former is a multi-product firm whose main activity is
not easily determined and only assumed to be poultry, The latter isalso in the feeds business, so the same difficulty applies. The eight
MeatProcessing i_ 31
I I IIIII
Table6
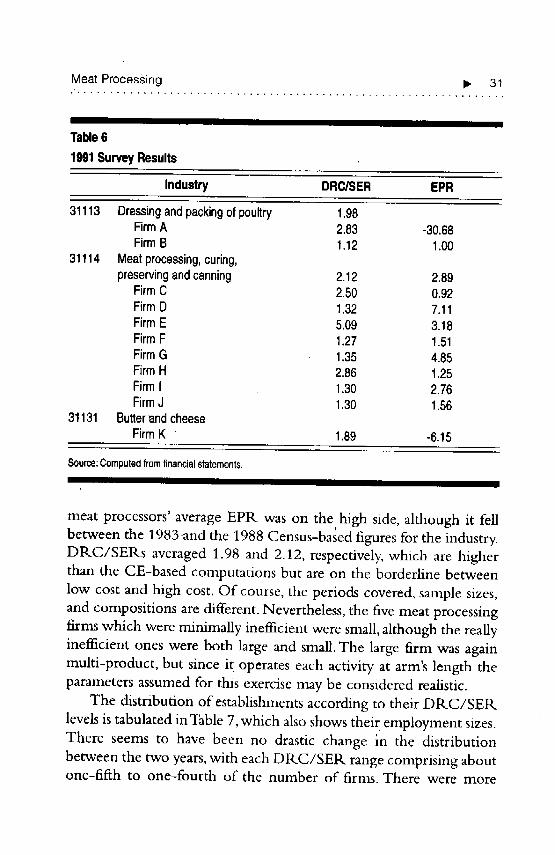
1991SurveyResults
Industry DRC/SER EPR
31113 Dressingandpackingof poultry 1.98FirmA 2.83 -30.68Firm8 1.12 1.00
31114 Meatprocessing,curing,preservingandcanning 2.12 2.89
FirmC 2,50 0.92FirmD 1.32 7.11FirmE 5,09 3.18FirmF 1.27 1.51FirmG 1.35 4.85FirmH 2.86 1.25FirmI 1.30 2.76FirmJ 1.30 1.56
31131 ButterandcheeseFirmK 1.89 -6.15
Source: Computed from financial statements.
I II I II
meat processors' average EPR was on the high side, although it fellbetween the 1983 and the 1988 Census-based figures for the industry.
DRC/SERs averaged 1.98 and 2.12, respectively, which are higherthan the CE-based computations but are on the borderline between
low cost and high cost. Of course, the periods covered, sample sizes,
and compositions are different. Nevertheless, the five meat processing
firms which were minimally inefficient were small, although the really
inefficient ones were both large and small. The large firm was again
multi-product, but since it operates each activity at arm's length the
parameters assumed for this exercise may be considered realistic.
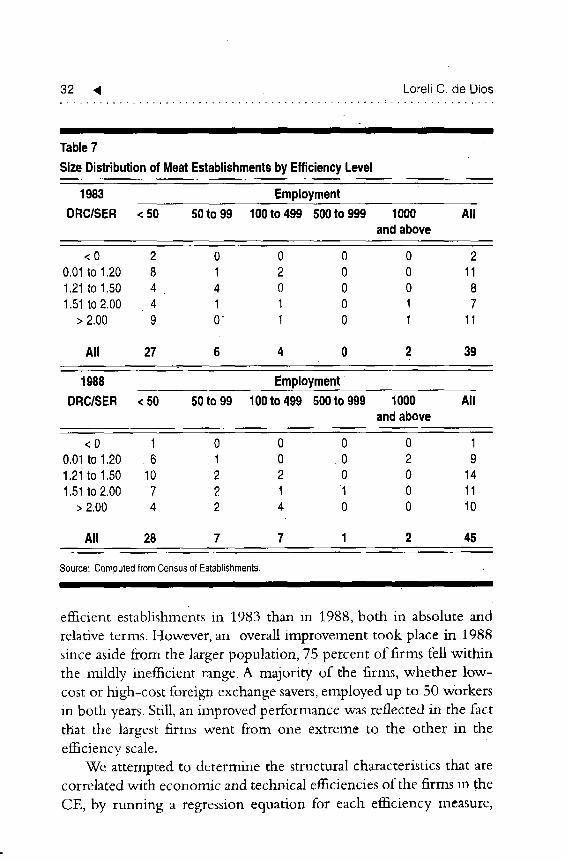
The distribution of establishments according to their DRC/SER
levels is tabulated in Table 7, which also shows thei r employment sizes.
There seems to have been no drastic change in the distribution
between the two years, with each DRC/SER range comprising aboutone-fifth to one-fourth of the number of firms. There were more
32 4 LoreliC. de Dios
I I I I
Table7
SizeDistributionof MeatEstablishmentsbyEfficiencyLevel
1983 EmploymentDRC/SER <50 50to99 100to499 500to999 1000 All
andabove
<O 2 0 0 0 0 20.01to1.20 8 1 2 0 0 111.21to1.50 4 4 0 0 0 81.51to2.00 4 1 1 0 1 7
>2.00 9 O 1 0 1 11
All 27 6 4 0 2 39
1988 EmploymentDRC/SER <50 50to99 100to499 500to999 1000 All
andabove
<0 1 0 0 0 0 10.01to 1.20 6 1 0 0 2 91.21to 1.50 10 2 2 0 0 141.51to 2.00 7 2 1 1 0 11
> 2.00 4 2 4 0 0 10
All 28 7 7 1 2 45
Source: Computed from Census of Establishments.
ii I
efficient establishments in 1983 than in 1.988, both in absolute and
relative terms. However, an overall improvement took place in 1988
since aside from the larger population, 75 percent of firms fell withinthe mildly inefficient range. A majority of the firms, whether low-cost or high-cost foreign exchange savers, employed up to 50 workersin both years. Still, an improved performance was reflected in the fact
that the largest firms went from one extreme to the other in theefficiency scale.
We attempted to determine the structural characteristics that arecorrelated with economic and technical efficiencies of the firms in the
CE, by running a regression equation for each efficiency measure,
MeatProcessing b, 33
I IIIII lib
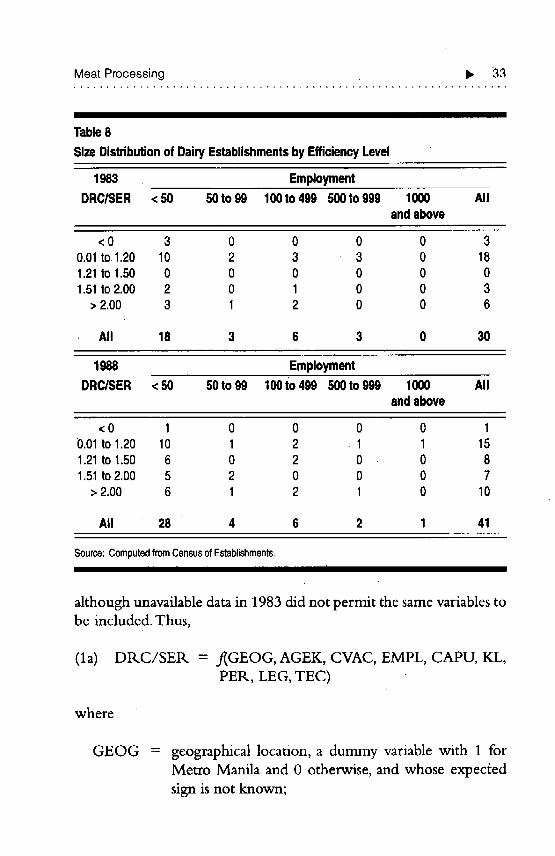
Table8
SizeDistributionofDairyEstablishmentsbyEfficiencyLevel
1983 EmploymentDRCISER <50 50to 99 100to499 500to999 1000 All
andabove
<0 3 0 0 0 0 30.01to 1.20 10 2 3 3 0 181.21to 1.50 0 0 0 0 0 01.51to2.00 2 0 1 0 0 3
>2.00 3 1 2 0 0 6
All 18 3 6 3 0 30
1988 EmploymentDRC/SER <50 50to99 100to499 500to999 1000 All
andabove
<0 1 0 0 0 0 10.01to 1.20 10 1 2 1 1 151.21to 1.50 6 0 2 0 0 81.51to 2.00 5 2 0 0 0 7
>2.00 6 1 2 1 0 10
All 28 4 6 2 1 41
Source:ComputedfromCensusofEstablishments,
although unavailable data in 1983 did not permit the same variables tobe included. Thus,
(la) DRC/SER = .f(GEOG, AGEK, CVAC, EMPL, CAPU, KL,PER, LEG, TEC)
where
GEOG = geographical location, a dummy variable with 1 forMetro Manila and 0 otherwise, and whose expected
sign is not known;
34 41 LoreliC, deDios
AGEK = average age of capital equipment, expected to bepositively correlated with DP,.C since newer
equipment means more efficient technology;
CVAC = value-added per capital which should have a negative
sign because a higher capital productivity shouldtranslate into lower DRC;
EMPL = employment, shows firm size, with an uncertain sign.since domestic costs could be associated with either
more or less employment;
CAPU = capacity utilization which is expected to be negativelycorrelated with DR.Cs because lower utilization means
higher costs;
KL = the capital-labor ratio which could be negatively or
positively correlated with efficiency since the latter
depends on the use of such inputs, and eitherautomation or the abundance of skilled workers raises
productivity;
PER = period of operation, a dummy variable with 1 forfirms established before 1983 and 0 otherwise, also
with an uncertain sign;
LEG = legal organization, another dummy variable with 1.forsingle proprietorships and 0 for corporations, whose
expected sign is also unknown; andTEC = technical efficiency which should be inversely related
with DIKC/SER.
The alternative specification removed variables which were highlycorrelated with each other and included two others instead:
(lb) DRC/SER. = ,f(GEOG, AGEK, PCM, CAPU, PER, LEG, FSIS)
Price-cost mark-ups (PCM) approximate market power. It is
usually associated with inefficiency; market power allowed by
protection encourages excessive entry and ineficient small-scaleproduction (Eastman and Stykolt 1980, arid Dixit and Norman 1980).
Alternatively, protection in sectors with unutilized scale economies
MeatProcessing b, 35
erects entry barriers, which in turn allow firms to exploit market
power (de Melo and Roland-Hoist 1991), with productdifferentiation accounting for the entry barriers, because such firms
face downward-sloping demand curves. In our study, however, we
may find the opposite result, since lower costs are made possible when
firms are efficient, yet these translate into higher margins givenconstant value-added and output.
Because market segmentation allows the existence of small and
large producers, ease of entry-exit also differs between them, assumingthat smaller firms may easily join or leave the business. Consequently,there are lower entry barriers for the small firm and the contestable
markets hypothesis (Baumol, Panzar, and Willig 1982) will apply
wherein a competitive price is adopted because of the threat of entry.This qualifies the importance of sunk costs as an entry barrier since
potential smaller entrants face no sunk costs, yet the large firms which
have high sunk costs still adopt the entry-forestalling prices becausetheir smaller competitors are a threat to their market share.
Market share (FSIS) as a proxy for seller concentration may either
be directly or inversely correlated with the inefficiency level in an
industry composed of a few large firms and a competitive fringe,
assuming free entry and economies of scale, because with protection,they may be operating on the high portion of their cost curves.
Furthermore, oligopolistic firms under protection will forego more
profits if they compete among themselves, so their strategic behavior
favors higher costs, e.g., through outdated technology. A greater
market share, however, also makes firms invest in' productivity-raisingtechnology.
Ideally, market size should also be considered since it influences
productivity, efficiency and product diversity. A limited market
contributes to low capacity utilization, or the lack of specialization
due to fragmented markets results in low productivity (Pack 1984).
But with !ncreasing returns to scale, an expanded market can lead to
more product differentiation. Market expansion through exports alsoleads to higher productivity growth through scale econorvdes and
competitive incentives, but increased import-substitution brought
about by protection leads to lo,_er productivity growth (Nishimizu
36 _ LoreliC.de Dios
and Robinson 1984). Increased openness widens the market, resulting
in increased capacity utilization and scale economies because of
specialization and therefore more efficiency (Havrylyshyn 1990).
Expanding the size of the market will let in a greater variety of
products, which will be limited by increasing returns in production(Grossman 1992). In such an industry, imports force high-cost firms
to concentrate on producing certain products and lowering costs.
The equations for technical efficiency were also tested usingbasically the same variables:
(2a) TEC = f(GEOG, AGEK, CVAC, EMPL, CAPU, KL, PER,LEG, EPR)
(2b)TEC = f(GEOG, AGEK, PCM, CAPU, PER, LEG, FSIS,EPR)
The relationships were expected to be the reverse of those in the
DRC/SER equations since TEC measures technical efficiency. Onlyone more variable (EPR) was added, which has an uncertain sign
given the arguments stenmm_g from the assumption of an imperfectlyc6mpetitive market structure. Protection increases a firm's marketshare, which encourages it to invest in newer technology. But the
strategic behavior of oligopolistic firms instead lead" tounderinvestment and higher costs since internal competition is likely
to reduce the large profits allowed by the protection.The results in Table 10 for the first equation show capital per
worker (KL) to be significantly correlated with DRC/SER in both
years, with a positive sign in 1983 and a negative one in 1988.Thus,the more capital-intensive firms were first high-cost and then low-
cost foreign-exchange savers, which imply higher capital productivity
from one year to the next. In addition, GEOG was negativelyassociated with DRC/SER in 1988, confirming that locating in
Metro Manila lowers costs. Single-proprietorships were likely to be
high-costs, since LEG was negative. For the second equation, only
GEOG came out significant in 1988.
MeatProcessing II, 37
II II I
Table9
PriceComparisons1
Commodity 1985 1986 1987 1988 1989 1990 1991 1992
MeatandmeatproductsSwine,liveweight 2,02 2,28 2.45 2.34 2.42 2.02 2,00 0.87Chicken,liveweight 1,31 1.14 1,20 1.20 1.16 1.15 1:26 1,38Beef,2ndclass 0,84 0,85 0.98 1.02 0.94 0.87 0.82 0,55Pork,2ndclass 1.46 1.23 1.33 1.51 1.60 1.39 1.17 1.21Bacon 1,59 1.62 1.67 1.66 1,26 1.04 1.62 2.03Ham,cooked 2.14 2.33 2,03 1.41 1.02 1.57 2.01 1.57Frankfurters 2.14 1.93 2.09 2.24 1,78 1.74 2.06 2.50Viennasausages 2.40 1,86 1,99 2.28 1.30 1,22 1,46 3.32Liverspread 1.88 1.85 1.99 1.90 1.76 1,82 2.24 2.43
MilkandotherdairyproductsFreshmilk 1.56 1.29 1,21 1.07 1,02 0.78 0.73 1.00Powd(_redmilk 1.30 1.30 1,37 1.36 1,31 1.22 1.76 2.06Evaporatedfilledmilk 1.51 1.39 1.32 1.25 1.30 1,24 1.37 1,50Sweetenedcondensed 1.29 1.14 1.14 1.16 1.27 1,17 1.25 1.47
filledmilkButter 2.26 2.18 2.28 2.15 1.85 1,64 1,83 1.99Cheddarcheese 1.19 0.98 0.98 0.96 1.02 1,01 0,85 0.97
1RatiosbetweendomesticwholesalepricesandHongkongunitimportvalues.
Source:ComputedfromNSOWPIrawdataandHongkongImportsfortheyearsindicated.I II I I I
Table 12 gives the results for TEC. In 1983, AGEK was inversely
and KL direcdy correlated with TEC in the first equation, meaning
newer equipment and higher capital intensity translates into technical
efficiency. In the second equation, PCM and FSIS were bothpositively associated with TEC so that higher margins and larger
market shares meant higher technical efficiency. In 1988, no variables
were significant in the first equation, but in the second, PCM, FSIS
and EPR were directly, and LEG inversely, associated with TEC. Thus,
firms which had higher margins, market shares and protection or were
organized into corporations, were likely to be technically efficient. '
38 '4 Loreli C. de Dios
III IIII I I
Table10
RegressionResultsof DRC/SERfor MeatFirms
1963 Equation(la) Equation(lb)Independent
Variables Coefficient t-values Coefficient t-values
intercept 0,739 0.524 -0 183 -0.122AGEK ' -0,026 -0,727 0.077 1,247PCM -- -- 7.673 1.653CVAC 0.477 0,471 -- --EMPL -0.002 -1.449 -- --
KL 0.00 6,977 -- --LEG 11049 0,598 3.092 1.109FSIS -- -- 2,216 0,623TEC -0,785 -0.357 -- --
Adj R-square 0.606 0.047
1968 Equation(la) Equation(1b)
IndependentVariables Coefficient t-values Coefficient t-values
intercept' 8.202 2,623 3.613 1.632GEOG -4.242 -2.240 -5,772 -2.540AGEK 0.002 0,142 0,002 0.236PCM -- -- 0,706 0.162CVAC -0.170 -0.641 -- --EMPL -0,0001 -0.044 -- --CAPU -0,078 -0.198 -0.124 -0.262
KL -1,3E-0 -4,187 -- --PER -1.236 -0.907 -0.770 -0.458LEG -2.670 -1,943 -0.952 -0.656FSIS -- -- -0,873 -0.175TEC -3.163 -0,925 -- --
Adj R-square 0,345 0.038III II
Meat Processing Ib ' 39
Hi I ill i nil il
Table 11
RegressionResultsof DRC/SERfor DairyFirms
1983 Equation(la) Equation(lb)Independent
Variables Coefficient t-values Coefficient t-values
intercept 2.580 3.210 2.524 3.308AGEK -0,010 -0.164 -0.003 -0.043PCM -- -- -3.196 -2.194CVAC -1.158 -1.299 -- --EMPL 0,00 0.231 -- --
KL 8.3E 0.898 -- --LEG 2.245 1.176 2.026 1.069FSIS -- -- -- _TEC -1,658 -1.028 -1.012 -0.720
Adj R-square 0.157 0.091
1988 Equation(la). Equation(lb)Independent
Variables Coefficient t-values Coefficient t-values
intercept 2,859 3.147 2.497 3,181GEOG -0.915 -1.661 -1.287 -2.456AGEK -0.015 -0.769 0.019 1.097PCM -- -- -4.259 -3.619CVAC 0.002 0.224 -- --EMPL -0,001 -0.752 -- --CAPU -0.009 -0.055 -0.098 -0.632
KL 6.1E 2.393 --PER 0.526 1.094 0.681 1.51iLEG -0,i80 -0,386 -0.318 -0.727FSIS -- -- -0.557 -0,693TEC -2,373 -2.812 -- --
Adj R-square 0.205 0.256II I III I Ell
40 ,4 Loreli C. de Dios
I I III I
Table12
RegressionResultsofTECforMeat Firms
• 1983 Equation(la) Equation(lb)Independent
Variables Coefficient t-values Coefficient t-values
intercept 0.584 10.804 0.495 6.451AGEK -0,005 -1,847 -0,001 -0.343PCM -- -- 0.536 2.374CVAC 0.107 1376 -- --EMPL -6.3E-06 -0.057 -- --
KL 2.793 2.318 -- --LEG 0,114 0,806 0.078 0.574FSIS -- -- 0,302 1.725EPR -9.3E-05 -0.805 -6.5E-05 -0.678
Adj R-square 0.142 0.243
1988 Equation(la) Equation(lb)
IndependentVariables Coefficient t-values Coefficient t-values
intercept 0.731 7.487 0.726 9.904GEOG -0.057 -0.606 0.003 0.037AGEK -2.1E-04 -0.330 -4.6E-05 -0.131PCM -- -- 0.440 3.053CVAC -0.011 -0.794 -- --EMPL 2.2E-04 1.310 -- --CAPU -0.001 -0,038 0.001 0,090
KL -4.5E-04 -0.286 -- --PER 0.046 0.694 -0.017 -0.310LEG -0,094 -1.392 -0.133 -2.749FSIS ' -- -- 0.467 2,808EPR 4.7E-05 1.651 4.1E-05 1.861
AdjR-square -0.012 0.348Ull I I I I I
Meat Processing I_ 41
IIII I IIIIIIIIII
Tabk_13
Regression Results of TECfor DairyFirms
1983 Equation (la) Equation (lb)Independent
Variables Coefficient t-values Coefficient t-values
intercept 0.845 3.959 0.697 4.966AGEK 0,006 0.872 0,002 0.410PCM -- -- 0.386 2.680CVAC 0.t 79 1.890 -- --EMPL -2.7E-05 -0.143 -- --
KL 1.15E-07 1.050 -- , --LEG 0.183 0.876 0,324 1.774FSIS -- -- 0.506 2.931EPR -0.007 -2.844 -0.006 -3.745
Adj R-square 0.626 0.719
1988 Equation(la) Equation(lb)
IndependentVariables Coefficient t-values Coefficient tovalues
intercept 0.569 3.368 0.446 3223GEOG 0.071 0.642 0.087 0.973AGEK -0.008 -2.066 -0.010 -3,173PCM -- -- 0,591 2.923CVAC 0.003 1,530 -- --EMPL 9.7E-05 0.657 -- --CAPU 0.036 1,099 0.026 0.979
KL 1,7E-08 0.306 -- --PER 0.091 0.938 0,059 0.753.LEG -0,071 -0.751 0,024 0.326FSIS -- -- 0,495 3.581EPR -0.001 -1.740 -0.001 -2,139
Adj R-square 0.204 0.460II I
42 _ LoreliC. de Dios
We may determine how establishments responded to policychanges only in 1988 and 1992, since only minor liberalization efforts
took place in the industry from 1983 to 1988 and mainly affecting live
and dressed poultry in 1986. Restrictions that were removed in 1981and 1982 were immediately reinstated and tariffs on meat were even
raised. The 1992 delisting was also revoked a few months after, aside
from the difficulty of delineating these adjustments from those
brought about by the recession, which occurred simuhaneously.
Nevertheless, their responses most likely differ according to firm size
only in degree, at least based on some interviews. For instance, to bemore cost-effective in the face of domestic and potential import
competition, small- and medium-scale firms have cut down on labor
expenses by reducing work hours, trying other formulations, or
searching for cheaper raw materials. Medium and large ones are
engaging in R&D, and trying to automatize partly to meet theshortage of skilled workers.
All firms are diversifying their products: smaller long-established
firms which have a steady clientele are assured of a ready niche because
of traditional methods that attract patronage. Many firms now use
chicken increasingly because of its availability and relatively low prices;
other firms plan to use turkey meat, which is acceptable to consumersand cheaper. Medium-sized firms are taking advantage of their lower
overhead relative to large Competitor s, and increasing their productchoices to include native dried or cured meat. Competition in the
different product lines also seems keen for large firms, based on their
aggressive marketing and advertising. Increased product differentiationlowers unit costs with increased throughput; this is one recommenda-
tion given in 1980 (WB 1980) together with more aggressive sales and
better product presentation. Overall, however, it may be more a result
of the marketing strategy of the establishments based on their
perception of how the market is segmented, rather than on thepreviously described BFAD labelling regulation. Many firms produce
not only different types of the same product, but complete lines fordifferent markets.
All meat processing firms, rcggrdless of size, seek to stabilize prices
by using least-cost formulations, especially since different products
MeatProcessing Ib 43
have different shelf-lives and prices. Canned pork turns rancid afterseveral months (BOI 1989), but it is more marketable because it is
cheaper. Canned beef lasts longer, but is also more expensive, so firms
opt to produce a combination that will be profitable.
At least two firms have left the industry. New small firms have
entered the industry in the past five years or so, based on updated lists
of establishments engaged in meat processing.
Despite the opportunity for members of the association to agreeon common prices for their products in wet markets, they have
refused to do so. Their general attitude is to compete independently,but they take a united stand against issues that affect them as a whole.
Whether to what extent the existence of QRs influence this attitude
is an interesting question. The common perception is that it will be
more profitable for them to be traders rather than producers if imports
are liberalized or tai:iffprotection is inadequate. (For example, all agreethat a 100 percent tariffis not enough.) It is thus possible that QRs
have created more domestic market power than tariffs (Bhagwati
1965), which they want to share among themselves, given theirproclivity for protection in the form of QRs. At the same time, the
existence of QRs did not diminish domestic competition, since they
seem to be adopting competitive prices, even if the threat of imports
has been eliminated.This perverse result qualifies the prescription thatliberalization will result in gains through the promotion ofcompetition (Krugman 1985).
The resistance to the removal of import restrictions is difficult ro
understand in the case of noncanned processed meat, since the
imported substitutes may become more expensive because of importbarriers, so that a relatively low tariff would suffice.
Table 9 shows the estimated price differences, inclusive of tariff,
between domestic and foreign (Hong Kong) products. It shows that
bacon is priced similarly in the country, and is sometimes even
cheaper. Ham, frankfurters, Vienna sausages, and liver spread were
generally more expensive, but became cheaper in some years. Canned
beef products are cheaper abroad. With liberalization, imports have
reached the domestic market at about the same prices as domestic
products. QRs, however, still cover most of the meat products. The
44 _ Loreli C, de Dios
price ratios further show that live swine is much more expensive here,
but live chickcn, beef and pork are competitively priced. The ease of
importing cattle and beef, the high productivity in poultry
production, and the high costs of swine-raising may partly explain thisresult.
Given the perception that the market for their products is limitedand depressed even more by the recession, competition has become so
fierce that most information is kept secret by firms, given their highly
similar operations and technology which makes it easy to predict their
competitive plans and preempt these. Acute awareness of each others'actions is a major factor upon which decisions are based. For instance,
SMC's announcement of a new line of processed meat products for
the A market prompted their competitors to introduce similar
"European-quality" lines which they advertised heavily. Although
SMC did.not pursue the line vigorously, it is an acknowledged leader
in product determination. In fact, one of its competitors simply
watches which .of its new products sells, and simply follows suit. Thecurrent limited market rnay be temporary, however, considering that
the population is growing and incomes will improve after therecession.
Several barriers to entry exist for a potential large meat processor.
The first is the high cost of capital, which increases sunk costs and
deters entrants from committing their resources. Another barrier is
the high degree of product differentiation, (which reflects learning
and scale econmmes), accompanying brand loyalties, and advertising
expenses. Introducing new product lines, dispersing outletsgeographically, and maintaining extensive distribution channels may
fill product niches and maintain market shares.Thus, potential entrants
are forced to sell in less profitable markets, or submit to an implicit
limit price which prevents them from recovering costs, unless they are
.large enough to impose their own prices and sell at a loss first.
Advertising is important for product awareness, whether it be TV,broadcast or print., media. Tie-ups of large firms with foreign
companies enable them to ride on the following for these foreignbrands. Still another deterrent i; the extensive din'ibution channels
which large firms have developed. A relatively fixed livestock
MeatProcessing I_ 45
population and lack ofskiUed labor also pose as entry barriers because
major raw material inputs and competent workers are not readily
available, making backward integration an advantage. Nevertheless,
• the common perception is that there are too many competitors in theindustry, and this applies more to the smaller firms which face fewer
entry barriers and have a limited market.Their ease of entry is shown
by the continued addition of such firms in the business.
The many changes between July 1992 and February 1993 in the
liberalization and tariff adjustments for livestock, poultry, meat and
feeds and the eventual reimposition of restrictions are mainly a result
of intense lobbying by industry organizations. In contrast, in the early
1980s, there was no such association that could bring the industry's
problems to the attention of the government (WB 1980).The danger
posed by this response is that entrepreneurial activity may be more
devoted to predicting economic policy rather than production, since
businesses will be encouraged to lobby instead of simply adjusting to
policy when lobbying is proven effective. Of course, some flexibility is
al_o needed, especially when changes are made during difficult
periods. The government's indecisive implementation is not a good
signal for the private sector and may compromise past efforts at tradereform.
Another example of adhoc implementation is allowing the
importation of hatching eggs during supply shortages. This removesthe pressure on local breeders to stay efficient and discourages them
from improving productivity since they have to compete with cheap
inputs when the government perceives that domestic prices are too
high. Retail margins should also be addressed, since retail prices
remain high even if wholesale prices fall. Requiring poultry
integrators to maintain grandparent stocks is an expensive alternative,given the world market oversupply. Depending on the productivity of
these farms, the costs are passed on to breeders.
Government intervention and frequent changes in regulations
increase business risk and discourage new investment.The unintended
effects of policies have often discouraged potential investors. In
livestock operations, ranches that require large areas for forage and
pasture were affected by agrarian reform (although the Supreme
46 _ LoreliC.de Dios
Court subsequently upheld their exemption), hence the disincentive
to such ventures, with the consequent supply effects. Moreover,
liberalized feeder-cattle imports and the carabao slaughter ban, whichwere meant to arrest the decline of ruminants instead made it
disadvantageous for local farmers who aimed for sustainable suppliesof feeder cattle and were deprived of market opportunities for
carabaos. Such a pattern eventually perpetuated the shortage of feeder
cattle. The strong links between feedmilling and livestock and poultry
and the existence of integrated firms necessitate a balanced pricing
policy, just as price control over products which are seasonal by naturehurts business.
4
Conclusions and Recommendations
STRIKING a balance between the needs of the different sectors is a
difficult task for the government. Part of the difficulty is the
uncertainty of agricultural production which results in supply
imbalances and fluctuating prices. The need to know the correct
priorities and at the same time to be flexible, and to be able give the
correct signals to encourage production, are all exacting demands on
the government.
Although the government's efforts to achieve a balanced agro-industrial structure are laudable, the failure of certain industries after
years of support may signal that perhaps no comparative advantagewill ever be coaxed out of them. For instance, the private sector would
rather not invest in the cattle industry because of its high costs, andconversely, private businesses can tell which industries will be
profitable even with little government intervention. Other countries
have resorted to subsidies since food security warrants the highpriorities given to agriculture and many agricultural activities have a
long gestation period. What is unfortunate is that the country seems
to have lost its comparative advantage in certain activities even on
indigenous breeds such as carabaos. Misdirected or inadequate
government involvement, non-implementation of regulations andindecisive policy have taken their toll.
Trade policy has always been protective of the meat slaughteringand processing industry in terms oftarifl_ and import restrictions.This
has exac.ted a heavier toll on inefficiencies, although the downstream
industry has usually been accorded more protection than the upstream
source of inputs. Liberalization has only become permanent for live
animals, live and dressed poultry other than chicken, beef and mutton,
48 ,q LoreliC de Dios
and processed beef, turkey and duck meat. The result is that anincrease in effective protection are associated with lower DRCs,
although EPRs are still high.Thus, although there were more efficient
firms before, performance generally improved from 1983 to 1988,based on the indicators, with more firms in the mildly inefficient
range. The influences of the factor-input mix, geographical location
and legal organization were significant on the firms' foreign-exchange
saving etticiency. For technical efficiency, the significant variables were
the age of equipment, capital-labor ratio, price-cost markup, market
share, EPR, and legal organization.
The meat processing industry may be characterizedas an
oligopoly with a competitive fringe since it consists of four large
leading multi-product and several single-product establishments.
However, product differentiation, whether a result of BFAD rules,
unused capacity or "image" strategy, allows competition in the whole
industry since competitive prices are important for the market shares
of large firms, aside from the relative ease of entry into smaller-scale
production. After all, commercial meat processing is a simpleextension of the entrepreneur's culinary talent. The existenc_ of
import restrictions does not seem to discourage domestic
competition: Producers face the same limited captive market andinput constraints because of nontariff barriers. Right now, meat
processors are willing to pay high tariffs on inputs as long as they are
importable, but even with a high tariff rate on their product and no
import restrictions, their perception is that it will be more profitablefor them to become traders rather than producers because of these
input constraints. Thus, although both economic and technical
efficiencies have improved, the question is, would this still be possiblein a freer trade situation? The prognosis looks good if the poultry
dressing sector is used as the basis, since QRs were removed and
DRCs dropped here, even if EPRs doubled. Ironically, the reirnposed
import restrictions include chicken.It is obvious that firms are responsive to market demands. They
continuously search for and implement more efficient methods to cut
costs, showing continuous improvement in their use of resources over
time and large potentials for even better performances. The limited
MeatProcessing I_ 49
demand may only be a temporary problem due to the recession,
although consumer tastes which take longer to adjust may be the
constraining factor.The most immediate need is to reduce t.he costs of
inputs that are especially due to infrastructural deficiencies, before or
at the same time that we reduce protection. Considering that the
industry has been on its own from the start, government policy would
be more cost-effective if, instead of regulating, it provided basic
support services. For example, traders who usually provide storage,
trucking and credit benefit from the seasonality of corn harvests,
"buying cheap and selling dear," since these facilities are otherwise
unavailable. Or at the minimum, since food must be regulated for
safety and health considerations, standard guidelines must be
implemented properly (e.g., abattoir standards, livestock market
guidelines, food quality).
It seems that the immediate removal of import restrictions on
certain, meat products (e.g., frozen meat) will not harm the industry
because of the natural protection afforded by their perishability and
lower domestic prices. For canned products, the problem of packaging
must be addressed first. It will also make sense to deregulate imports
of meat inputs after feed supply conditions are met, given the self-
sufficiency in hog production but high domestic prices traceable to
corn input costs.The difficulties of developing a livestock base shouldfinally be resolved, if the country is to gain independence from
imports of basic agricultural commodities. Before we can hope to see
improvements in the quality of local meat, which in turn will translate
into better processed meat that meets export standards, quantities
must first be available. Tariffs should provide enough protection,
especially when seasonal supply problems are the only constraint.
Then, we may witness even higher efficiencies, enough to make
elusive competitiveness a more concrete possibility.
Part H: Dairy Processing
Chapter 5# o #o o o o _ a _lllo • • # # a oe i # • # • • # i #
Industry Structure
D^zRY processing may be divided into milk processing and other dairy
products.The 1988 Census of Establishments lists only five large firmsin the milk-processing sector (PSIC 3112, fresh and preserved milk)
with value-added of P208 million, or an average of P41.5 million perfirm. Three establishments were in Metro Manila, and two in South
Tagalog. One firm was foreign-owned. The sector comprising other
dairy products (PSIC 3113) consisted of 49 large firms with value-
added of P2,308 million or an average of P47 million per firm. Only
two firms had controlling foreign equity. In addition, there were 324
small establishments with P13.7 million in value-added engaged in
cheese and ice cream making, or an average ofP42,300 per firm.Thenumber of large dairy processors did not change from the figures givenin the 1983 Census, but there were much fewer, i.e., fourteen,
nonmilk dairy producers. Value-addecl per large firm was about the
same, at P44 million. As for the smaller counterparts, 284 were listed
in 1983 with P18,900 average value-added.
Despite the greater number of nonmilk producers, the value ofindustry output is dominated by milk processing, which serves a more
basic consumption need. It is composed of the preserved milk sector,
which reprocesses or repacks milk and provides 98 percent of total
consumption, and the dairy farming sector, which actually produces
raw milk and provides the remaining two percent (PDC 1991). The
52 4 Loreli C, de Dios
former grouping corresponds to PSIC 31122 (powdered, condensedand evaporated milk). These establishments import majority of theirraw material inputs. Firms engaged in the processing of fluid/freshmilk and cream (PSIC 31121) source their inputs from local dairyfarms, which supply cooperatives run either by the government orprivately; only one large processor maintains its own farm.
The industry is composed of a few large multi-product firms andseveral medium-scale and small competitors in each sector. SMC isthe undisputed industry leader. It started well ahead of the others(having bought the Magnolia ice cream plant in 1925) and carriesmany product lines - fresh and UHT milk, yoghourt, cottage cheese,dressings, ice cream, butter, margarine and cheese. It has become theonly integrated producer of milk, having the largest commercial dairyfarm and the most modern processing plant in Southeast Asia, andeven a joint venture in Taiwan. It serves 78.4 percent of the ice creammarket (Appendix 2).
The closest contender in the fresh milk and ice cream sector is
Selecta (with its 15.0 percent market share), which was acquired byRFM in 1990, although the firm has also been in the business since1925. Using a carabao milk formulation, it managed to sustain afollowing, but did not expand as much until the buy-out. For the pasttwo years,it has concentrated on ice cream and penetrated the marketby differentiating its product between a cheaper and more expensiveline, using its traditional carabao milk formulation for the latter.
Other fresh-milk producers are cooperatives put up by small dairyfarmers. Sta. Maria Dairy Cooperative started in 1946 by selling freshmilk and then acquiring equipment in 1950 for pasteurized milk.Thcre are, at present, four dairy federations composed of a total of2,303 farmers, as well as 35 independent cooperatives in six regions.
There are two other large ice cream makers and some smallerones. CFC Corporation carries the Presto brand, which has beenselling for more than a decade. Coney Island, a US franchise ownedby Seamark Enterprises, was purchased by Purefoods some three yearsago. The small producers are old cottage-type businesses which caterto a limited market usually defined by their location.
DairyProcessing I_ 53
The powdered/condensed/evaporated milk sector consists of fourmain producers which import dried milk and repack or reconstitutethis into evaporated full cream, filled milk, or sweetened condensedfilled milk. As early as the 1930s, four bottling plants were alreadyinvolved in reconstituting. Nestle, which is a 55-45 percent jointventure between the Swiss parent company and SMC (MKPFI 1987),is now considered the leading producer in terms of number of brands.The others are Holland (a General Milling company), Kawsek, andCFC who produce several popular brands each. Liberty wasproducing milk and meat products but stopped in 1990.
Only three firms process butter and cheese: the Philippine DairyProducts Corporation (PDPC)(with a 36.6 percent market share),Kraft (48.8 percent), and New Zealand Creamery (15.0 percent).PDPC is a joint venture with the New Zealand Dairy Board. Kraft isa subsidiary of Kraft USA which introduced blended processed cheeseand set. up the first commercial production in the country in 1964.(Margarine is excluded from this discussion, since it is principallymade up of vegetable oils and animal fats.)
Milk-based infant foods are produced only by Wyeth-Suaco, ajoint venture with the US company that first introduced infantformula, and Mead-Johnson, a subsidiary of Bristol-Myers. Yakultmanufactures fermented skim milk with lactic acid bacteria, and is
classified under "other dairy products."Dairy products comprise 77 percent of processed-food imports,
amounting to $475 million in 1990 or $1.5 billion over the lastdecade, increasing at 18 percent annually. Powdered milk holds 80percent of this proportion; butter, cheese, and curd share five percent.Appendix 3 gives the import figures in detail. The major sources ofthese imports are Australia, New Zealand and the Netherlands,although recently, evaporated and condensed milk imports have beenrecorded from Thailand, Malaysia, Hongkong, and Singapore.
Although prices abroad are low, they have been increasing in thelast five years. This has become a source of concern for thegovernment. The major producing countries have signed dairyprotocols increasing the world prices for dairy exports. They nowcontrol production becausse of subsidy cuts. (Milk powder is highly

54 _1 LoreliC.de Dios
processed and is expensive if unsubsidized.) In the US, dairy animals
are being sold for slaughter or export under their dairy termination
program, while Western Europe and North America have imposed
quotas on milk marketing. Another development which has forcedcheese manufacturers to shift from subsidized to nonsubsidized
imports, is the use of the Home Consumption Valuation (HCV)method, since it increased the value of subsidized imports.
One major local producer, however, perceives the situation
differently. Apparently, despite these developments, dumping is still
likely, given the increasing health consciousness and consequent
declining demand in "these Western supplier-countries. If subsidiescontinue, there will still be excess output, given that subsidies are
output-based. And when trade barriers are removed, competitionamong subsidizing countries will even be keener. This perception is
partly the reason why this producer has been selling off its excesscattle, especially since upkeep is costly, imported milk powder is P5
cheaper per liter than local raw milk, and a major market for its
premium lines (the US military in the former baselands) no longerexists.The necessity of cost-effectiveness is made more urgent by the
strategy of other major dairying countries, such as New Zealand, to
compete in "branded" markets where value-added is higher.Since 1964, the government has tried to establish dairy farms and
milk collection schemes, but these efforts have met difficulties similar
to those plaguing the cattle industry, e.g., the lack of suitable breedsand inefficient feeding practices that result in low yields, andhighcollection and maintenance costs because of bad roads and long
distances. Dairy development also needs refrigeration facilities, a
mechanism for replacement or refund if milk is rejected, and the
capability to process soured milk.The domestic supply of raw milk comes from either commercial
(64 percent), or backyard and government farms (36 percent). In
physical terms, production from these three sources in 1990 amountedto 12.29, 5.8, and 1.07 thousand metric tons, respectively (BAS).
Magnolia and its sister company, Monterey, have the largestcommercial farms, contributing more than 50 percent to the industry
total in 1984 (WB 1985). Except for these farms, the DA dramatizes
DairyProcessing I_ 55
the contribution of dairy farms as "3 drops per day per person" (DA-PDC 1986). Part of the reason is that backyard milk production ismerely an ofl_hoot activity of livestock-raising, which are meant formeat and draft power. Since backyard carabao and cattle populationhas remainedconstant, milk production has been kept low andstagnant.
Daily per capita consumption is only half of the recommendeddietary allowance of 82 grams; in 1990, it was 51.8 grams. For self-suflqciency, the ideal number of milking cows is pegged at 600,000(Dulay 1988). Actual numbers total only 44,000 dairy cattle (DA1992). Children below five consume the largest amounts of milk, andgiven our rapid population growth, demand is expected to grow.Metro Manila shows the highest consumption in locational terms.
Altogether, the dairy market is estimated to be worth P14 billion.There is a wide market base and product range, and an establishedmarket for local products (BOI 19B9), especially for powdered andevaporated filled milk. Intermediate users, such as confectioners, foodprocessors, bakeries, and hotels are also a reliable market. For the non-institutional market, the generally low consumption level is influencedby low incomes or purchasing power, milk being highly income-elastic. This is a basic problem for local dairy cooperatives. Mostconsumers cannot discern or afford to pay for qualitydifferences, andtherefore buy low quality (highly-processed) import-based milk,rather than the more expensive highly nutritious (fresh) local milk.
For milk companies that compete in a single product line suchaspowdered milk, distribution and brand awareness are critical.Processed milk is also price-elastic, and prices are dependent on bothimport prices (since raw materials are 70 percent of production cost),as well as packaging (which could amount to 28 percent for cannedmilk). Powdered milk repackers are using retail packs, which is whatlower-income buyers can afford.
Milk production requires a good infrastructure system because ofits high perishability and short turnaround period. For cooperatives,this is manifested in the high costs of collect_g milk from members.Thus, marketing costs are even higher than processing costs; for fresh
56 '11 LoreliC.de Dios
milk, it may reach 22 percent 0301 1988).A major repacker of milk
powder has thus invested heavily in a distribution system.
Milk accounts for 80 percent of total consumption of dairyproducts. Condensed and evaporated filled milk, powdered milk,
processed cheese and ice cream are the most popular product forms.Shelf life is a crucial determinant in consumer choices. Processed milk
is the exception to the rule that processing translates into higher
prices, since technology has instead brought both longer shelf life and
lower prices, hence the imported powdered raw material is cheaper.
A premium is instead paid for freshness, since it is deemed more
nutritious, fresh milk needs refrigeration and costs more to produce.Its high perishability, however, limits its market reach. Full cream milk
is also more expensive than filled or skim milk.
Butter and cheddar cheese are not as popular as their cheaper
substitutes, margarine or butter compound and filled cheese. And just
like other food products which need low-cost formulation. The
cheaper substitutes were most likely developed to capture lower-
income consumers, who have a taste for these. Demand is generallyerratic and lower during hot months.
One source of rising demand for cheese is the rapid growth of thefastfood industry in the 1980s (BOI 1989). However, this trend has
also led to increased imports of curd, since locally-produced curd is
not suitable for processing. The technology for curd making is not
complicated but the liquid milk requirement for an economic-sized
production is large i.e., ten kilograms for every kilogram of cheese.
Curd prices rise along with milk prices, but the substitution effect also
works, since the demand for milk then declines and cheesemaking
becomes more profitable. Current health concerns have also created a
demand for skim milk, which has made butterfat cheaper.Exports usually consist of ice cream, liquid and powdered cream,
processed cheese, milk powder, and condensed sweetened filled and
evaporated filled milk (Appendix 4). Considering that the raw
material inputs are largely imported, these are basically re-exports,The level of technology in reconstituting or recombining is of the
intermediate and final processing type, since the raw material has
already been processed into its dry form. In 1957, the recombining
DairyProcessing I_ 57
method, which uses imported skimmed milk powder and vegetable
(coconut) oil, was first developed here to produce filled milk and thencondensed sweetened filled milk in 1967. The plant and facilities of
repackers are old but properly maintained, and comparable to those in
other Asian countries. Equipment costs may be lowered by
substituting imported types with locally fabricated ones, although a
homogenizer is more complex to manufacture (BOI 1989). Basic
cheesemaking equipment is also manufactured by local fabricators,
although these may not be as efficient or have the same capacity as
imported machinery.
The productionprocesses are not very complicated, involvingbasic pasteurization and homogenization for milk (also denaturization
for UHT), blending for ice cream and cheese, and ripening or
incubation for cheese and yoghurt. Nonetheless, the industry is
capital-intensive, being highly dependent on processing equipment
and process technology and facilities. In fresh milk processing,
Magnolia uses the most modern integrated automated operationseven up to UHT processing, which increases the shelf life of milk and
eliminates the seasonal problem of oversupply. It is estimated to
produce four million liters yearly (BOI 1989), which is a little morethan the combined production of the Laguna Processing Center, the
Southern Tagalog Dairy Cooperative, and the Dairy Training andResearch Institute. The latter three use the basic methods with semi-
mechanized and manual operations. Other cooperatives plan to invest
in a locally developed medium-scale spray dryer and in more
pasteurizing plants.
Magnolia also utilizes modern dairy farming methods, which itlocates suitably. It maintains and upgrades an economic-sized herd. It
has a complete "cold chain" which reduces losses in the collection,
storage, processing and distribution of milk. In fact, it can supply the
dairy cattle requirements of the industry easily, i.e., the capability exists
but is not efficient because imported milk powder is still cheaper to
use. Quality control is crucial even in the early stages of milk
production, e.g., udders that are not milked stop producing and one
defective tit affects the rest. Moreover, because the quality of feeds
determines the productivity and milk quality of the animal, their
58 _ LoreliC.deDios.
availability is also important. These factors increase production costsand the need for economies of scale.
The production costs of local milk manufacturers, especiallycooperatives, are higher than those of foreign producers who haveattained scale economies, are subsidized, and have their own sufficientsupply of raw milk. A steady supply of large amounts is crucial since ittakes 11 liters of fresh milk to produce one kilogram of powdered_and a minimum of 10 tons of liquid milk to produce the powderedform economically. The underutilized capacities of dairy farmcooperatives, however, result more from marketing difficulties ratherthan from the lack of a continuous supply of raw milk.
6oaQ_,_it o_mo#o_#oo,e#lla#_
Policy Environment
Dairy Act of 1961, Republic Act 4041, officially established thedevelopment of an indigenous dairy industry through the BAI. Sincethen, considerable efforts were undertaken to help the industryfurther, among which was the establishment of the Dairy Training andResearch Institute at the UPLB. In 1979, the Dairy IndustryDevelopment Act or Batasang Pambansa Bilang 21, creating thePhilippine Dairy Corporation (PDC), was passed. A National DairyDevelopment Bill was filed in 1988 and refiled in 1992. The DA'sMedium Term Dairy Development Program was launched in 1990.
The DA now bases the growth of the dairy industry on thedevelopment of smallhold dairy farming and the organization offarmers into viable cooperatives. The BAI focuses on backyardproducers by rendering dairy husbandry and technology trainingservices. A milk collection scheme, for instance_ was restored recently ,in Nueva Ecija, after a large company pledged to buy the collectedmilk, presumably for its ice cream line. The BAI has also launched abreed-upgrading program, under which it provides hormones formass heat synchronization.
The dairy program, which aims "to help small farmers producemore milk and make more money from producing it,' is implementedby the PDC and BAI, and consists of three levels:breeder foundation,dairy modules and integration of support. Dairy modules consist ofdairy production units composed of 300 dairy animals owned byaround 100 farmers, a dairy market base, a collection unit and aprocessing unit. The aim is to consolidate the output of each moduleto achieve efficiencies in collection, processing and marketing.Milkshed areas are a network of modules. Cooperatives are tapped to
60 4 LoreliC.de Dios
collect, process and market milk. The model for this is the Alabang
Milk Processing Plant run by the Southern Tagalog Dairy
Cooperative. It has shown the benefits of using government-owned
infrastructure in generating income for small dairy farmers. The Cebu
and Davao projects under the program have so far been successful, and
provide good examples for the facilitating, rather than regulating, roleof government.
In 1992, a Task Force on Dairy of the Philippine Chamber of
Commerce and Industry reviewed and analyzed all existing programs
and policies covering the industry. It observed that the objective of
supplying the country_ dairy needs cannot be justified from an
economic viewpoint. It then recommended the satellite farming
approach for new entrants to establish the requirements of a viable
project, and better entrepreneurship of milk and meat for existingdairy ventures.
Government policies relating to the meat industry also affect the
dairy industry, since both depend on the existence of a livestock base.
The carabao slaughter ban runs counter to the need to produce more
animals, because in practice, this law is often violated with impunity.
Carabao- or cattle-raising should be made a business enterprise. The
BAI has proposed to "save the herd," so that the government buy all
carabaos put up for sale, or provide for a mechanism which will allowfarmers to borrow money against their pregnant cows. Another
recommended measure is to ban the slaughter of female carabaos,
because they have a 15-year productive life, aside from the superior
quality of carabao milk compared to that of any other dairy animal.
The Multi-Livestock Dispersal Loan Program described earlierhas also met implementation constraints: the stocks are not yet
breedable, and the farmers find the 10 percent interest too high. In
addition, the number of animals given to beneficiaries is limited,income-augmentation rather than eEonomic viability has been the
basis for the program, and the poor prioritization of the subsidy to this
effort are some reasons why it had no significant impact.
The BFAD is in charge of implementing food safety regulations;
those specific to the dairy industry, have so far involved powdered
milk imported from countries affected by the Chernobyl nuclear plant
DairyProcessing I_ 61
accident, and the regular destruction of infant formula past theirexpiry date. The labeling regulation described earlier also affects milk
products, particularly ice cream, since this is where differentiation has
been pronounced.
Fresh and processed milk are considered basic necessities_ other
dairy products are prime commodities under Republic Act 7581, the
Pri_-" Act of 1992, which seeks to protect consumers from
un_ _onable price increases during emergency situations. Prices are
_nonitored regularly by the DA and the Department of Trade and
Industry (DTI), which recommend price ceilings when necessary.
Hoarding, profiteering, and cartels are also deemed illegal.
Appendix 5 shows that tariffs generally increase with processing.
There were no changes exc%,t for the slight rise in raw materials
duties.The rates on fresh milk and cream were 5 percent in 1983, 20
percent (for canned) and 10 percent (other) in 1988, and 10 percent
in 1991. For wiley and milk powder, it wag 5 percent in 1983, and 10
percent (bulk) and 20 percent (other) in 1983 and 1991. For preserved
concentrated sweetened cream, it was 10 percent in all years except
for those in containers other than bulk, which had 20 percent rates.For butter, it was 40 percent in 1983 and 30 percent in 1988 and
1991, while other anhydrous nfilk fat had 10 percent throughout.
Yoghourt and other ferm,mted milk had 10, 20, or 50 percent,depending on contents in ;988 and 1991. Curd had 30 percent and
cheese had 40 percent. Ice cream had 50 percent and infant formula
20 percent throughout.
Implicit tariffs on the output and input in 1983 were almost equal
for milk, butter and cheese, higher on the output than on the inputfor ice cream, and the reverse for infant formula (Table 1). In 1988,
implicit tariffs were higher on the output than on the input for allsectors.
Except for a few restricted lines in 1970 and 1975, imports ofmilk and cream were restricted in 1976, but deregulated shortly in
1977 (Appendix 6). Restrictions were imposed once more in 1983
and totally removed in 1985. Butter, cheese, and curd were subject torestrictions in 1970 and 1975, delisted in 1982, again restricted in
1984, and finally liberalized in 1985.
62 41 LoreleiDe Dios
The impact of policies as measured by the EPRs and NEPRs
shown in Table 1 were computed from the censuses of 1983 and 1988,
which may denote the pre- and post-liberalization periods given data
constraints. Fresh milk (one observation) and infant formula
producers were the least protected in 1983, while powdered/
evaporated milk processors had the lowest EPRs in 1988. Ice cream
makers were the most protected in both years. Except for powdered/
evaporated milk producers, all sectors enjoyed increased protectionlevels between the two years. The combination of high EPRs and low
DRC/SERs suggests monopoly rents.The 1988 results seem to be a continuation of the 1974 estimates
of 5 percent for evaporated/condensed milk, and 52 percent for
butter, cheese, and other dairy (Bautista, Power et al. 1978). However,
the negative NEPRs in fresh milk, powdered milk, and infant milk
production indicate that they were penalized by the overvalued
exchange rate but the relatively high NEPR for ice cream shows thatit still receives high protection. Indeed, the 1991 estinaate of the only
butter and cheese manufacturer in Table 6 also indicates a net penalty;
its survival likewise indicates its efficiency, which follows frorn being
the most productive and among the efficient sectors even in 1988.
7# a i o o • m i # o # o i i o _ # _ • o# # B i a a Q, i #
Performance
THE shadow DRC/SERs (Table 1) in 1983 show all sectors in the
industry except for flesh milk to be efficient foreign-exchange savers.
The picture-changed drastically in 1988 for powdered/evaporated
milk processors who became high-cost and switched places with fresh
milk producers who became only minimally inefficient. (The 1991
financial statement-based estimate of 1.58 for the single butter
producer shows a mild level of inefficiency.) Thus, the powdered/
evaporated milk processing sector seemed to have lost its comparativeadvantage, considering that it had a DRC/SERin 1974 of 0.18. But
ice cream production, which had a ratio of 0.88 in 1974, maintained
its efficiency. Butter and cheese, coming from a DRC/SER of 1.97 in
1974, also seem to be gaining efficiency (Bautista, Power et al. 1978).
The production of fresh milk necessarily involves dairy farming,
since it does not merely consist of bottling milk and cream sourced
abroad, an arrangement rendered infeasible by the high perishabilityof raw milk. And because small dairy farrb.s have been shown to be
efficient foreign exchange savers in certain areas (Cabanilla, UPLB
1983), the contention that smallholders have the potential
comparative advantage finds support, considering that the sector was
only minimally inefficient in 1988. If large-scale integrated milkproduction is not economic, then small-scale ventures should be
encouraged instead.
Although TECs given in the same table show that ice cream
makers ai:e relatively far fi:om the frontier, this should be qualified by
the presence of two kinds of producers here -- a few technologically
advanced and several smaller, labor-intensive establishments using
simpler and possibly older machines. The rest of the sectors are close
64 4 LoreliC. de Dios
to the average technically advanced firm. Of course, more
observations mean lower TECs. And if the methods currently
employed are not necessarily the most modern, unity results do notmean the most advanced level.
Based onTable 2, processors of infant formula and powdered milk
were the largest in terms of all indicators except for average value-
added in 1988 where the latter sector was replaced by butter and
cheese makers, and average capital in 1983 where three sectors had
sinfilar sizes. The lowest indicators were registered by the ice cream
sector. Employment dropped in three sectors, but the rest of the size
indicators rose for all sectors except again for value-added in processedmilk.
Table 3 shows that butter and cheese were the most productive
sectors in 1988; fresh milk and processed milk manufacturers were the
least productive, depending on the indicator. In 1983, processed milkand infant milk fon;_ulators took the lead, and fresh milk and ice
cream producers trailed behind. Productivity fell only for processedlnilk and infant formula makers.
Table 4 shows that capital per worker was highest in fresh milk
production in 1983, then in processed milk, which seems to coincide
with the Switch in efficiency described earlier; the ratio for the former
sector also dropped_These sectors also had the oldest equipment. Icecream makers were the least capitalintcnsive, which is a manifestatior_
of the small size of these ventures and the relative ease of setting one
, up. They were also the most vertically integrated, as approximated by
the ratio of value-added to sales, although the figures do not vary too
much between, sectors except for the low ratio of powdered milk
producers in 1988. Mininmm efficient scales were also similar in 1983,but in 1.988, butter and cheese differed from the rest with its high
ratio. Age of equipment again was almost the same for all sectors in
1983 and went from 16 years for powdered milk to seven years for ice
cream and butter and cheese; these correspond to the productivity
rankings found earlier such that the sectors equipped with newer
machinery seemed to be the m.ost productive.
Price-cost margins, computed as the ratio of the difference
between value-added and compensation costs to output, were higher
DairyProcessing i_ 65
in 1983 than in 1988 for all sectors, reflecting decreased profitabilities,which were probably partly attributable to the removal of QRs. Ice
cream processing had the highest markup in 1983 and infant formula
in 1988, although its figure was not much higher than that of ice
cream. This seems to have been a signal for more aggressive behavior
from Magnolia's competitors, or more infant formula productdifferentiation. The sector with the highest output, powdered/
evaporated milk processors, invested among the largest amounts of
capital and had one of the lowest profit margins in 1988, while ice
cream makers who were the smallest, and infant formula producers
who were the largest and were highly-productive, had much highermarkups. In 1988, butter and cheese, the most productive sector,ranked among the low-profit sectors both in 1983 and in 1988.
Based on comparative prices, wide price-cost margins exist in
repacking (Dulay 1988). It was discovered that retail prices forevaporated milk are thrice their import cost, while that of full creammilk is double its landed cost. The differences more than account for
the large shares in costs of packaging, distribution, reprocessing, orcredit, and may be attributed to profits.To the extent that this is made
possible by the protective structure, a possible explanation is that in
sectors with unexploited economies of scale, protection erects entrybarriers that allow firms to exploit market power (de Melo and
Roland-Holst 1991). Otherwise, the monopoly rents generated
through protection encourage excessive entry instead, which may
result in inefficient small-scale production, or lower margins.Herfindahl indices in Table 5 were surprisingly similar for ice
cream and infant formula processing despite the difference in numberof establishments.Thus even with 31 firms in ice cream, there tends to
be some concentration. On the other hand, the indices show relativelyequal market shares for the three observations in infant formula. For
powdered milk and butter and cheese however, the formula indicates
some concentration which became pronounced in 1988. The four-
firm concentration ratios show all sectors to be monopolies instead.
Table 8 reflects the distribution of dairy establishments by
efficiency level and their corresponding employment sizes. More firms
were efficient in 1983 than in 1988, although about the same
66 _1 LoreliC. de Dios
proportion were high-cost foreign-exchange savers in both years.
Only 10 percent were minimally to mildly inefficient in 1983
compared to 36.6 percent in 1988. Most of the firms employed lessthan 50 workers in both years, whatever their efficiency level.
Historically, the country has never gone into large-scale milk
production because the needed pasture lands have been limited bymore immediate rice growing needs. Furthermore, rice-growingunlike wheat cultivation does not allow land to lie fallow for long
periods and neither is the country's general climate conducive to
raising dairy Cattle. Aside from this, milk-drinking is not a natural
habit for Filipinos, who" like other Asians are lactose-intolerant.The country has thus manifested a general dependence on
imports, and the consequent investment in processing technology
geared for this f'orm of input. With lower-priced imported inputs,
processors have enjoyed high profit margins, although the recent risein world prices has cut through these profits. Large capital
requirements, breeding, feeding, and distribution costs, and the long
gestation period before profit rnargins are realized serve asdisincentives to dairy ventures.
Unutilized capacity in dairy cooperatives and large fresh milk and
cheese processors is more an indication of insufficient raw milk inputsthan of low demand, since imports have been rising to meet thisdemand. These disincentives act as barriers to entrants not only in
processing but also in raw milk production.
Magnolia has all the advantages of a first-mover, having beenestablished way ahead of the others, and having invested in integrated
operations even up to packaging (e.g., Tetrabrik), which is crucial to
milk production and is a major cause of high. costs. Such advantagesare also shown in butter and cheese, as well as in the infant formula
sectors, where high capital intensities and large capacities effectively
prevent the entry of new firms.RFM's entry into ice cream production through its purchase of
•Selecta has fostered competition since it combined the large resources
of an established company with the goodwill of an old brand name.
Products have proliferated to give the consumer a wide range of
flavors and prices to choose from. Even the third major ice cream
DairyProcessing I_ •67
maker has started to advertise heavily; it was the first to try out otherfrozen forms on the market. "Buy-one-take-one" deals, whichsources say were due to slow-moving sales, have also occurred. Andwhile BFAD labeling regulations may affect the decisiom of ice creamproducers on the number of products to offer, their desire to maintainmarket shares probably plays a larger role. An interesting observationmade by an industry source is that there hasbeen an intra-firm transferof technical personnel in the ice cream business, which accounts foran observed similarity of taste in products and even in productofferings.
The introduction of several other types of frozen ice products inthe market is a way of filling all possible product niches, which alsodeters potential entrants. The setting up of plants in the South has,meanwhile, dispersed products geographically. Advertising todifferentiate products or maintain brand awareness has also been
practiced by other sectors in the industry, although to a lesser extentthan ice cream. The establishment of a plant abroad by Magnoliafurther illustrates its rank in the business.
All large firms devote a proportion of their budgets to R&D andquality control, which some producers say is crucial to maintainingmarket shares. Those who have foreign equity are able to use theparent company's resources or goodwill, and often try to utilizelocally-available raw materials.
Only one firm was found out to have exited from the industry,but several other repackers of powdered-and evaporated milk haveemerged in the past five years, based on the increased number ofcanned milk brands availablein the market which carry the repackers'names. Their large capital expenditures, as shown by the Census,indicates a positive supply response to the liberalization of imports.Some repackers probably import finished goods, if the labels on themilk cans are to be interpreted literally.If this means that the produceris also the importer, the discipline expected to be provided byliberalized imports will not be realized. However, there geem to be noentry barriers to importing, so this is not likely to happen.
Import-penetration indices rose from 29.12 to 45.10 percent forprocessed milk, and declined from 18.38 to 10.87 percent for other
68 4 LoreliC. de Dios
dairy processing from 1983 to 1988. This indicates-that the domesticdemand for milk was increasingly served by imports partly because of
relaxed rules on importation or because domestic supply was simply
lacking.
Fresh and processed milk are still subject to price control but only
during emergency situations. Price data show reasonable price
changes within the last three years, either because manufacturers are
constrained by competition due to raising prices, or high price-elasticity. In the 1970s, price control squeezed margins and forced the
three major companies then to stop operations. One firm took
advantage of this situation and captured a substantial market share by
advertising.
Comparing domestic prices with Hong Kong unit import values
(Table 9) and assuming the same quality, domestic prices were much
greater than those of imported substitutes of powdered, evaporatedfilled, sweetened condensed milk, and butter. (Powdered milk prices
were an average of regular and infant formula milk prices.) Fresh milk
was more expensive locally only in the early part of the period coveredwhile cheddar cheese was competitively priced and even domestically
cheaper in some years. Tariffs could explain the excess of the ratiosover unity for all except butter, whose local prices were double the
border. And except for powdered milk whose ratios were almost
constant, the price differences narrowed after 1985, which shows thatthe liberalization was effective. For cheese, imports are not a threat
because of their generally higher border prices.What they provide is a
wider choice of products which only upper-income consumers can
afford. And although imports of cheese as well as fresh milk have been
growing, there have been substantial quality differences which are notreflected in the price ratios.
Given the efficiency of butter producers, the relatively high prices
they charge indicates that entry barriers due to sunk costs are effectivesince there are only three of them with almost equal market shares.
There is also unutilized capacity, which enables them to respond toincreases in market demand. But because price-cost margins are
among the lowest in the industry, these prices probably reflect
production costs.
DairyProcessing I1,, 69
To test the importance of structural or policy influences on the
economic and technical efficiencies of dairy firms, the two equationsdescribed in the meat section were run for the dairy (milk andnonmilk) industry combined. Table 11 shows that for the first
equation in 1983, no variable was significant, but for the second
equation, the significant variable was the price-cost markup (PCM),
which is negatively correlated with DRC/SER.Thus, firms with high
margins are likely to be efficient. This could be due to the way thevariable was defined, so that higher PCMs are either because of higher
value-added or lower wage costs, hence the negative correlation is not
surprising. In 1988,.the capital-labor ratio (KL) was positively and the
technical efficiency level (TEC), negatively associated with DRC/
SER in the first equation. For the alternative specification, location
(GEOG) and price margins (PCM) were both significant withnegative signs. Thus, firms which located in Metro Manila were also
less inefficient, which confirms the finding mentioned earlier that
such a location gives firms a cost advantage.
To explain technical efficiency in 1983 (Table 13), capital
productivity (CVAC) and EPR were significant, with the expectedpositive and negative signs, respectively. The second specification
yielded a better fit and more significant variables: PCM, LEG, and
FSIS with positive signs, and EPR with the expected negative sign.
Hence, technical efficiency was associated with higher margins, single
proprietorships, larger market shares, and lower effective protection.
In 1988, age of equipment (AGEK) and EPR again were negatively
correlated with TEC in the first equation. And virtually the samevariables in the second equation came out as significant: PCM and
FSIS with positive and AGEK and EPR with negative signs, so that
high margins, large market shares, new equipment and low effective
protection characterized the technically efficient establishments. Of
course, market shares especially in dairy processing, are mainly a result
of historical advantage and efficiency.
The presence of economies of scale has implications other than its
relationship with market power mentioned earlier. If it limits diversity,
expanded markets would result in greater differentiation, but the
opposite is also possible, i.e., since fragmented markets result in too
70 _ LoreliC,de Dios
much diverse products (Pack 1984), enlarging the market would lead
to economies of scale due to specialization (Havrylyshyn 1990). In the
dairy processing industry, there seems to be large raw material inputs
required for viability, although in one sector (ice cream making),
small-scale production is possible. The large capital requirements are
also defined by technology and the availability of the major inputs at
low prices.The limiting factor at present is the absence of this supply,
which prevents the firms from fully utilizing their capacities and
realizing these scale economies. Nevertheless, the products seem to be
more diverse, especially in the case of ice cream processors.
8oo_e.ooooQo_t _u.l..lao_ot oml_
Conclusions
MILX processing has received low to moderate protection compared
to other industries. While technically efficient, it was either mildly or
highly inefficient by the end of the 1980s, the surprising result beingthe switch from one to the other extreme efficiency level within the
five-year period. Other dairy products which received much higher
effective protection were efficient foreign exchange savers, which is
an improvement from their previously already very minimal
inefficiencies. The unfortunate change was for the preserved milk
sector, which turned around completely from foreign-exchange-saving to -using, yet it also used cheap imported raw materials. Perhaps
such use of imported inputs is not, after all, crucial to efficiency since
the fresh milk producer's performance improved even when it used
so-called expensive, locally-sourced inputs.Trade policy has benefited the processed milk sector more in
terms of the removal of QRs (although these were not binding for
milk powder which, being an essential commodity, received dollarallocations during rationing in the early 1970s) rather than tariff
adjustments, which were not at all substantial. Given the cheap
imported raw material and the relatively higher border prices of
foreign brands of finished milk products (not to mention the
perishability of these products which act as a natural barrier, aside
from transport costs), it is thus surprising that not all (nonfresh-rrfi_lk)sectors experienced higher efficiencies when they all use similar
imported milk powder, curd, and whey, as basic inputs. Of course,
there were macroeconornic reasons for this differential performance.
The important point is that despite the liberalization of both inputs
72 _1 LoreliC, de Dios
and outputs, nonmilk dairy processing proved itself capable of
achieving comparative advantage.
Price-cost margins declined as the ratios between domestic to
border prices generally fell after the liberalization.The variables foundassociated with inefficiency were markups (-), factor-input mix (+),
technical effÉciency (-), and geographical location (-). Technical
efficiency was correlated with markups (+), effective protection (-),
market share (+), capital-productivity (+), legal organization (+), and
age of equipment (+).These efficiency estimates, however, must be qualified to the
extent that the imported inputs and outputs are subsidized by the
producer countries. This makes border prices understated if the
dumping prices are much lower than world prices. Incorporating this
into the computations would lower the DRCs and EPRs, even
possibly resulting in efficient levels.
The disciplining effect of imports is alsoqualified by the
phenomenon of dumping. In our case, the production of powderedmilk has not been undertaken, which is most likely the result of
dumping, which has gone on for a long time and is expected tocontinue. The consensus is to avail of cheap raw materials since no
local producer is hurt. This observation may extend to the fact thatthe liberalization of dairy products was among the "uncontested"
policy moves. The long-term effect, however, has been import-dependence, and the failure to encourage dairying. Protection may
seem to be justified when dumping occurs, but industry observers
seem to agree that this should take place only if predatory pricing is
the reason for low border prices.For most sectors in dairy processing, entry barriers due to sunk
costs are formidable, but for the others, notably dairy farming and ice
cream making, smaller-scale investment is possible. Here,
contestability may be the reason for competitive priccs. However, for
reprocessors, butter and cheese, or infant formula producers, prices
need not forestall potential entrants, although the desire to maintain
market shares among existing competitors may result in competitive
prices, aside from the limited market which constrains the entry ofnew firms.
DairyProcessing I_ 73
The industry consists of a few large multi-product firms and
several medium and small competitors in each sector, with milk
processing dominating the whole industry. The structure, however,
does not seem to influence the relative efficiencies, considering thatthe different concentration levels in the nonmilk dairy sector are
associated with similarly efficient foreign-exchange saving ability, or
the oligopolistic powdered milk sector and monopolistic fresh milksector are both inefficient savers. The similar Herfindahls in 1988
suggest some critical market share as an efficient level. Price-cost
margins are higher for some but not all efficient sectors and in 1988,
they varied much less between sectors,
Although natural barriers to imports exist, the common response
of these firms perhaps to decreased protection has been to differentiatetheir products to capture market shares, or what is known as "market
positioning." There are at least five brands of evaporated filled milk
produced by each processor in the sector, or powdered skimmed milk,'
several classes of ice cream, "filled" cheese, or butter "compounds." Of
course, this may be partly in response to the recession, that is, given
the broad market but low incomes, firms have to produce what theconsumers can afford, especially to maintain their market shares or
earn enough on their investments. However, increased productdifferentiation, which could also be an indication of the use of scale
economies, started even before the recession and may only be morepronounced now. More repackers have entered the industry and the
largest expenditures on new assets were undertaken by the preservedmilk sector.
Whether imports have disciplined the industry depends on acombination of reasons. One is the sectoral differences in scale
economies, which could pose as an entry barrier that renders import
discipline ineffective. Another is th_ nature of the product, e.g.,
perishability, which gives domestic producers natural protection
against imports.Yet, dumping enables both small and largc producers•to take advantage of cheap imports and lower costs.
Milk processing must be large-scale, so that local procurement by
big companies may not be possible as of yet because of the large
volumes their plants need (i.e., 50,000 liters ,)f fi-csh milk per day for
74 41 LoreliC de Dios
a medium-sized plant versus current production of 11,022 liters per
day []30I 1989]). Still, we have the ironic difficulty of disposing of the
milk output at the dairy farm level despite the fact that the volume of
local produce is an insignificant proportion of the total requirement.While a large processor disputes the efficiency ofsmallholding relative
to large_scale farming (although Cabanilla's result proves their
efficiency), the past low supplies and low selling prices have been the
result of this very difficulty, and the consequences have been low
returns to the farmers.The cooperatives argue that the relative ease of
setting up dairy farms and the lower costs of smaUholding indicatethat there exists a large potential source of raw milk, not to mention
the high animal yields in certain larger farms. What is difficult is
sustaining production, if there is no forward linkage in which the
farmer can profitably cooperate, so that he goes beyond the"livelihood" into the "for profit" thinking.Thus, farm dairying cannot
be stimulated without the support of the commercial processors.
A lesson may be learned from the Indonesian experience: Dairy
companies were required by law to purchase a fixed portion of their
milk inputs from local dairy farmers. Perhaps we need to hurdle acertain volume of production before local raw milk will be just as
cheap as imports.The government seems to have wisely assigned high priorities to
smallhold dairy farming, since dairying is really a by-product ofcarabao or cattle-raising and hence takes little else to promote.
Moreover, milk is a basic consumption need by vulnerable age groups,
which defines the need to be less import-dependent (especially since
subsidy cuts abroad are a reality) if not self-sufficient. Previous
government efforts are already paying off, as small dairy farms havebeen shown to be efficient foreign-exchange savers, and milk-
intensive breeds adaptable to our climate have already been discovered.
The quandary of the small milk producers exists however, since
competing raw material imports are cheap and processing costs are
much higher here.
The long gestation period characterizing integrated milk
processing makes repacking a more profitable venture, but the
potential efficiencies for locally-sourced milk should serve as a
DairyProcessing I_ 75
counter-example. For instance, the high productivities of small dairyfarms may be as effectively exploited, together with the market-responsiveness of farmers. The crucial link is to the milk processorwho would be the more immediate market for dairy farmers to allowthem to move on to larger production volumes sooner. Allowingcarabao and cattle raisers to engage in trading activity for profit wouldalso help in this objective. Of course, infrastructure such as farm tomarket roads, large-scale refrigeration, an efficient transport system,and credit are just as crucial, aswell as a feedgrains base.The problemsbuild up when one important infrastructural link is absent, e.g.,cornfeed is available ih Davao but cargo rates are too low to beprofitable for the shipper to transport it.
It is obvious that we do not lack ideas to promote the dairy sector,especially considering the multitude of recent proposals. However,the key problems faced by the industry as perceived by governmentagencies are that government initiatives are uncoordinated and thatthere is uncertainty about the direction of policy and the commitmentof resources to the industry. In this context, it is not surprising thatThailand's efforts have been successful: Its government supported theindustry "at all costs."The urgency for us is heightened by the need toregain what we already had in the past. It would seem that the nextstep for government is to facilitate the link between small-farmdairying to large-scale processing. Then perhaps the potentials forefficiencies will be realized, at relatively low cost, and so will thebenefits of directing resources toward their highest potentialprofitabilities.
Ak
Bibliography
Bautista, Romeo M., John H. Power and Associates. Industrial Promotion
_' ,licies in the Philippines. Makati: Philippine Institute for DevelopmentStudies, 1979.
Board of Investments• "Long-Term Development Plan of the Dairy
Subsector." Unpublished paper• Board of Investments, 1989.
•"Long-Term Development Plan of the Processed Meat and Meat
Products Subsector." Unpubli_l_ed paper_ Board of Investments, 1989.
Bureau of Animal Industry• Annual Report. Manila: Department of
Agriculture, 1991.
Cabanilla, Liborio. Economic Incentives and Comparative Advantage in the
Livestock Industry. Laguna: University of the Philippines at Los Bafios,1983.
Dairy Development Foundation of the Philippines. An Overview of the
Philippine Dairy Industry. Manila: Philippine Dairy Corporation, 1991.
De Melo, Jaime and David Roland-Hoist. "Industrial Organization and
Trade Liberalization: Evidence from Korea."Working Paper of the Policy,
Research, and External Affairs Complex. Washington, D.C.:World Bank,1991.
Department of Agriculture. Mid-Term Development Plan for the Dairy Sector,
1989-93. Manila: Department of Agriculture, 1989.
Havrylyshyn, Oli. "Trade Policy and Productivity Gains in Developing
Countries: A Survey of the Literature•" World Bank Research Observer 5, 1
(january 1990): 1-24.
Ibarra, Perlito I. The Meat Industry in the Philippines. Manila. Bureau of Animal
Industry, 1990.
Krugman, Paul R. "Increasing Returns, Monopolistic Competition and
International Trade." Journal q_ International Economics 9 (1979): 469-79•
78 41 Loreli C. de Dios
. "Industrial Organization and International Trade." In Richard
Shmalensee and P,.obert Willg (eds.) Handbook qfIndustrial Organization,
Vol. I1. North-Holland, 1989•
Mahal Kong Pilipinas Foundation Inc_ Philippine Company .Profiles.Manila:
MKPFI, 1987.
. Philippines' Best 1000 Corporations 1988, 1990, 1991. Manila:MKPFI.
Manasan, Rosario G. "The Taxing Issue of the PhilippineValue-Added Tax:
Its hnpact on Agro-Processors." Unpubhshed paper, 1993.
Maranan, Norberto L. "The Legal Framework." Paper presented at the
Regional Seminar/Workshop on Agricultural Livestock Marketing,
Bureau of Animal Industry, Manila, 1989.
Natiomd Meat Inspection Corn.mission. Annual Report. Manila: Department
of Agriculture, 1991.
Nishimizu, Mieko and Sherman Robinson. "Trade Policies and Productivity
Change in Semi-Industrialized Countries." Journal _ Development
Economics 16 (1984): 177-206.
Pack, Howard and Larry Westphal. "Industrial Strategy and Technological
Change: Theory versus Reality." Journal qf Development Economics 22
(1986): 87-128.
Philippine Chamber of Food Manufacturers. Philippine Food Manufacturin£
Factbook and Directory. Manila: PCFM, 1989.
Philippine Dairy Corporation. Dairy Deveh.tpment Plan 1992. Manila:
Departmen t of Agriculture.
Pineda,Virginia. " Livestock Industry Study." Unpubhshed paper, 1988.
Sycip, Gorres and Velayo, Co. Barriers to Entry. Manila: SGV, 1.988.
Task Force on Dairy. "Terminal P,,eport." Manila: Philippine Chamber of
Commerce and Industry, 1992.
World Bank. Development Strategy and Policies in the Philippines. Washington,
D.C.: World Bank, 1980.
• 'lhe Philipp#_es: Food Processin,_Sector - Development Potential and
Constraints. Washington, D.C.: World Bank, 1985.
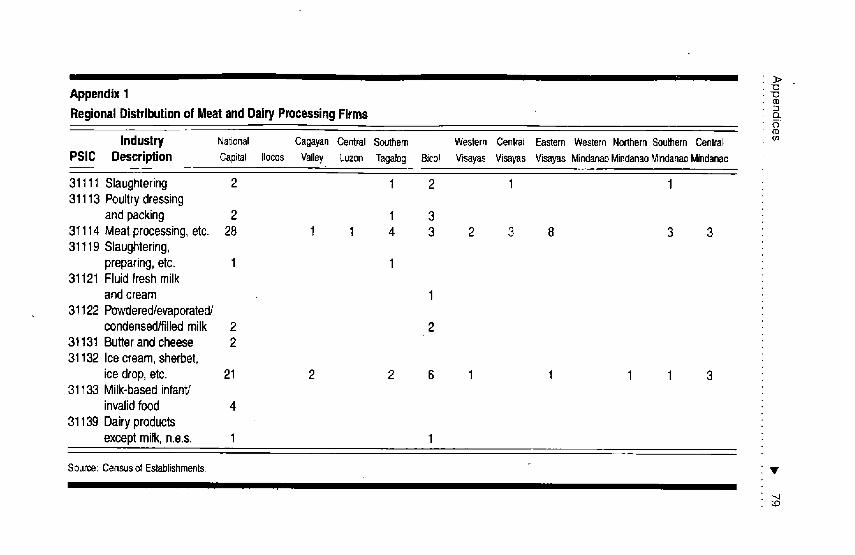
"O
Appendix1 -o
RegionalDistributionof MeatandDairyProcessingFirms cz(o
Industry National CagayanCentralSouthern WesternCentralEasternWesternNorthernSouthernCentra_PSIC Description Capital Ilocos Valley LuzonTagaFog8icol VisayasVisayasVisayasMindanaoMindanaoMindanaoMindanao
31111 Slaughtering 2 1 2 1 131113 Poultrydressing
and packing 2 1 331114 Meatprocessing,etc. 28 1 1 4 3 2 3 8 3 331119 Slaughtering,
preparing,etc. 1 131121 Fluidfreshmilk
andcream 131122 Powdered/evaporated/
condensed/filledmilk 2 231131 Butterandcheese 231132 Icecream,sherbet,
ice drop,etc. 21 2 2 6 1 1 1 1 331133 Milk-basedinfant/
invalidfood 4
31139 Dairyproductsexcept milk,n.e.s. 1 1
Source:CensusofEstablishments. •
_D
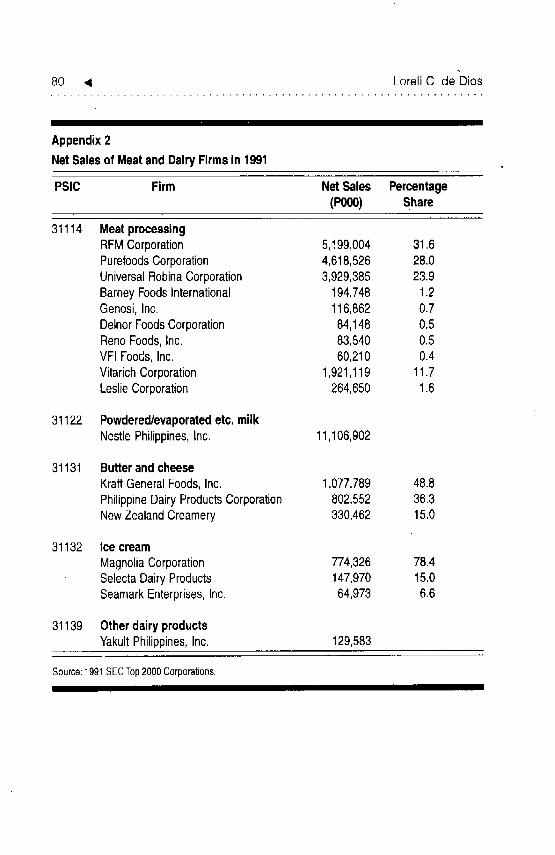
80 _1 Loreli C, de Dios
I IIII
Appendix2
NetSalesof MeatandDairyFirmsin 1991
PSlC Firm Net Sales Percentage(P000) Share
31114 MeatprocessingRFMCorporation 5,!99,004 31.6PurefoodsCorporation 4,618,526 28.0UniversalRobinaCorporation 3,929,385 23.9BarneyFoodsInternational 194,748 1.2Genosi, Inc. 116,862 0.7DelnorFoodsCorporation 84,148 0.5RenoFoods,Inc. 83,540 0.5VFI Foods,Inc. 60,210 0.4VitarichCorporation 1,921,119 11.7LeslieCorporation 264,650 1.6
31122 Powdered/evaporatedetc, milkNestlePhilippines,Inc. 11,106,902
31131 ButterandcheeseKraftGeneralFoods,Inc. 1,077,789 48.8PhilippineDairyProductsCorporation 802,552 36.3NewZealandCreamery 330,462 15.0
31132 Ice cream
MagnoliaCorporation 774,326 78.4SelectaDairyProducts 147,970 15.0SeamarkEnterprises,Inc. 64,973 6.6
31139 OtherdairyproductsYakultPhilippines,Inc. 129,583
Source:1991SECTop2000Corporations,
i i al l lll lab I
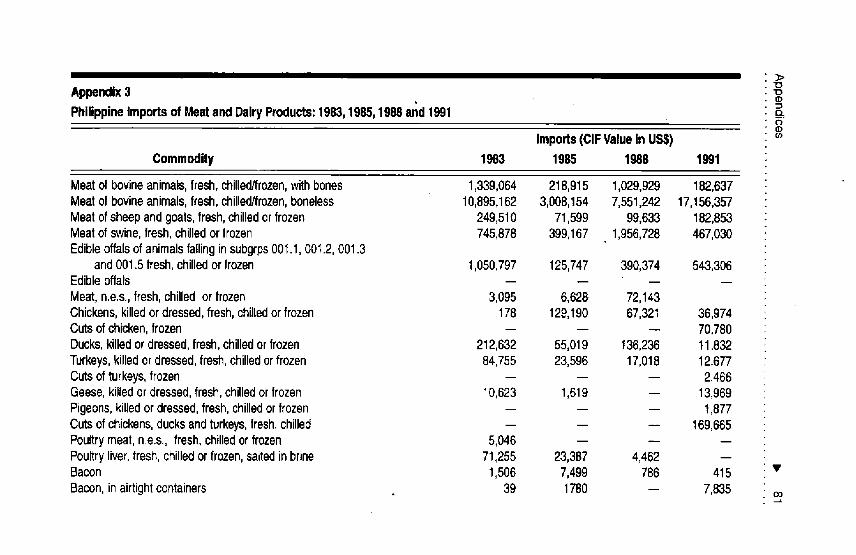
_>
Appendix3PhilippineImportsof MeatandDairyProducts:1983,1985,1988and1991 ,
O(D
Imports(CIFValuein US$)Commodity 1983 1985 1988 1991
Meatofbovineanimals,fresh,chilled/frozen,withbones 1,339,064 218,915 1,029,929 182,637Meatofbovineanimals,fresh,chilled/frozen,boneless 10,895,162 3,008,154 7,551,242 17,156,357Meatofsheepandgoats,fresh,chilledorfrozen 249,510 71,599 99,633 182,853Meatof swine,fresh,chilledor frozen 745,878 399,t67 1,956,728 467,030Edibleoffalsofanimalsfallinginsubgrps001.1,001.2,001.3
and001.5fresh,chilledorfrozen 1,050,797 125,747 390,374 543,306Edibleoffats ....Meat,n.e.s.,fresh,chilledorfrozen 3,095 6,628 72,143Chickens,killedordressed,fresh,chUledor frozen 178 129,190 67,321 36,974Cutsofchicken,frozen -- -- -- 70,780Ducks,killedordressed,fresh,chilledor frozen 212,632 55,019 t36,236 tl ,832Turkeys,killedordressed,fresh,chilledorfrozen 84,755 23,596 17,018 12,677Cutsofturkeys,frozen -- -- -- 2,466Geese,kiltedordressed,fresh,chilledor frozen 10,623 1,619 -- 13,969Pigeons,kil}edordressed,fresh,chilledorfrozen -- -- -- 1,877Cutsofchickens,ducksandturkeys,fresh,chilled -- -- -- 169,665Pouttrymeat,n.e.s.,fresh,chilledor frozen 5,046 -- -- --Pouttryliver,fresh,chilledor frozen,saitedinbrine 71,255 23,387 4,462 --Bacon 1,506 7,499 786 415 v
Bacon,inairtightcontainers 39 1780 -- 7,835 co
Appendix3 continued _°°
imports(CIF Valuein US$) •
Commodity 1983 1985 1988 1991
Hamandshoulders,dried,saltedorsmoked -- 4,543 121 --Ham, in airtightcontainers 5,732 2,216 -- 22,755Sausagesofallkinds,not inairtightcontainers 50,576 19,021 35,564 20,454Sausagesof all kinds,in airtightcontainers 5,695 t,930 4,068 --Pork, in airtightcontainers 201 -- 9,300 --PorkJuncheonmeat, inairtightcontainers 1,015 -- 77,464 --Beef andveal 15,984 2,021 3,677
Beef,in airtightcontainers 1,693 --Corned beef,in airtight containers 8,373 -- 6,145Chickenmeat,salted,driednot in airtightcontainers 19,048 70,043Duckmeatandgoosemeat,saltednot in airtightcontainers 1,957 163 1,756Turkeymeat,in airtightcontainers 3,130Turkeymeat,salted,in brine,dried/smoked 103Meatandmeatpreparation,in airtightcontainers 245,551 856 33,456Edibleoffalsof swinesalted,in brine,dried,smoked 24,050Otherpreparedor preservedmeatandedibleoffals 22,107 4,955 24,744 48,183
Othermeatandediblemeatoffalssalted,in brine,dried,smoked 138 5-Duckand goosemeatandoffal (otherthanliver)prepared/preserve,n.e.s 3,388 $__Liverof anyanimal,prepared/preserved,n.e.s. 45222 c_Meatextracts 16,472 7,373 39,430 60,570 o_
Extractsandjuices,of crustaceans,molluscs/otheraquaticinvertebrate 836OG')
Appendix3 continued >"0C.D,
Imports(CIFValueInUS$) 0('D
Commodity 1983 1985 1988 1991 o,
Meatpastesandspreads 8,661 1,205 3,951Milk,fatexceeding1%,notconcentratednorsweetenedwipreservativeincans 194,675Milk,fatnotexceeding1%,notconcentratedsweetened,otherthanO(NK)01 523,934Milk,fatexceedingI% not6%notsweetened/concentrated,w/preservative/incans 12,621Milk,fatexceeding1%not6%,notsweetened/concentrated,otherthanO(NK)O1 311,239Cream,fatexceeding6%,notconcentratednorsweetened,w/preservative/incans 38,532Creamfatexceeding6%,notconcentratedsweetened,other0221301 95,105Naturalmilk,inhermaticallysealedcans 545,444 98,136 1,706,857Milk,insolidform,fatnotexceeding1.5%gmt20k/more,concentrated/sweetened 96,502,368Milk,insolidform,fatcontentbyweight,exceeding1.5%otherthan022.22-0t 1,070,756Milk,insolidform,fatexceeding1.5%notcontainingaddedsugar/othersweetening 39,198,176Milk,insolidform,fatcontent,byweightexceeding1.5%otherthanO(NK)O1 24,039,772Cream,insolidform,fatexceeding1.5%not'containingaddedsugar/othersweetening 30,478Cream,insolidform,fatcontentbyweightexceeding1.5%otherthan022.22-03 3,116Skimmilk,powderedinbulkcontainers 50,744,711 38,885,028 73,450,701Skimmilk,powderedJnconsumercontainers 550,976 2,716 264,239Milkinpowderorgranules,inbulkcontainers 16,80t,330 11,997,635 30,727,388Milkinpowderorgranules,inconsumercontainers 37,849,834 12,750,294 28,567,109Creaminpowderorgranules,inconsumercontainers 377 --Evaporatedfullcreammilk 1,687 547,541 3,350,130 TEvaporatedreconstitutedmilk 68,872
OO.CO
Appendix3 continued o_
Imports(CIFValuein US$) •Commodity 1983 1985 1988 1991
Evaporatedfilledmilk 2,511,967Condensedsweetenedfullcream(whole)milk 344 1,215,968 91,510Condensedsweetenedreconstitutedmilk -- 20_,518Condensedsweetenedfilledmilk 1,544,217Productsconsistingofnaturalmilkconcentrated,sweetened,
otherthan0224901 43,39tCream,preserved 1,472,195 508,668 462,936Othermilkandcream,n.e.s 154,256 98,349 676,138Butterfat(anhydrousmilkfat) 17,077,546 8,223,833 12,345,678 I7,204,730Butter,inairtightcontainers 50,555 10,079 319,063Freshbutter,notinairtightcontainers 18,316,540 74,487 233,103 466,556Cheese 696,429 537,793 1,242,685 1,934,272Grated/powderedcheese,of allkinds 119,104Processedcheese,notgrated/powdered 199,494Blue-veinedcheese 26,808Freshcheese(includingwheycheese),notfermented 322Othercheese 1,588,544 r-
O
Curd 8,287,118 4,347,554 11,258,446 14,973,124Icecream,containingcocoa/not 93,900Icecreammixesandpowders 13,295
CO.
Wheypreserved,concentratedorsweetened 3,403,658 1,195,114 ?,651,911 6,052,654Oco
'uCD
,0_D
Appendix3 continued
Imports(CIFValuein US$)Commodity 1983 1985 1988 1991
Yogurt,containingfruits,nuts,cocoa/flavoringmatter;liquidyogurt _/,035Yogurt,concentrated,sweeetenedw/preservative/inS,Dcans 6,101Otheryogurt,wtr/notconcentrated 23,906Buttermilk,wtr/notconcentrated/containingsugar/sweetening/fruits,nuts/cocoa 122,279Buttermilk,wtr/notconcentrated/containingsugar/othersweetening,otherthan0223201 14,620,388Sourmilkwtr/notconcentrated/containing-sugar/sweetening/fruits,nuts/cocoa 2,825Otherfermented/acidifiedmilI,Jcream,concntrated,sweetened,otherthan0223209&02232198,177
Source:ForeignTradeStat_'cs (1983,1985,1 988, 1991).
V
CO
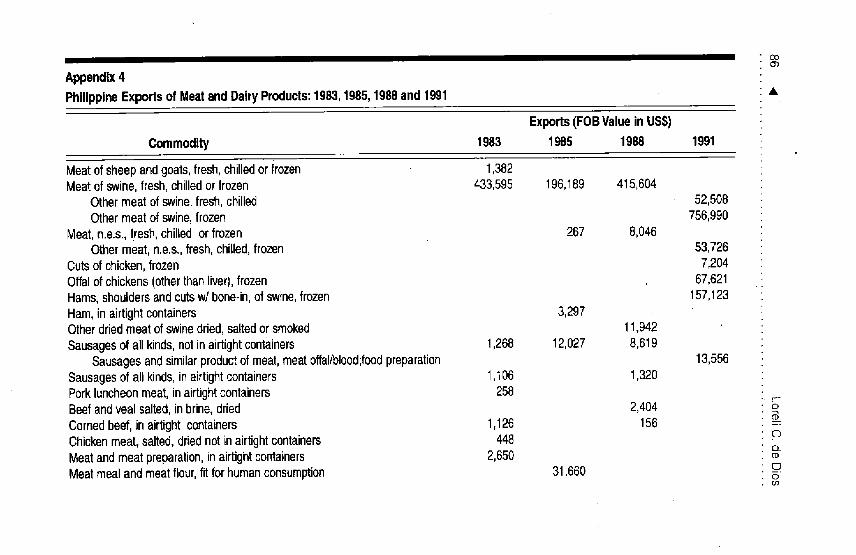
Co
Appendix4
PhilippineExportsof MeatandDairyProducts:1983,1985,1988and1991 •
Exports(FOBValueinUS$)
Commodity 1983 1985 1988 1991
MeatofSheepandgoats,fresh,chilledor frozen 1,382Meatof swine,fresh,chilledor frozen 433,595 196,189 415,604
Othermeatofswine,fresh,chilled 52,508Othermeatofswine,frozen 756,990
Meat,n.e.s.,fresh,chilledorfrozen 267 8,046Othermeat,n.e.s.,fresh,chilled,frozen 53,726
Cutsof chicken,frozen 7,204Offalofchickens(otherthanliver),frozen 67,621Hams,shouldersandcutsw/bone-in,ofswine,frozen 157,123Ham,in airtightcontainers 3,297Otherdriedmeatofswinedried,saltedorsmoked 11,942Sausagesof allkinds,notinairtightcontainers 1,268 12,027 8,619
Sausagesandsimilarproductof meat,meatoffal/blood;foodpreparation 13,556Sausagesof allkinds,inairtightcontainers 1,106 1,320Porkluncheonmeat,inairtightcontainers 258 r-
Beefandvealsalted,inbrine,dried 2,404 oCornedbeef,inairtightcontainers 1r126 156 -'=Chickenmeat,salted,driednotinairtightcontainers 448 oc'J
Meatandmeatpreparation,inairtightcontainers 2,650 oMeatmealandmeatflour,fitforhumanconsumption 31,660 o_o
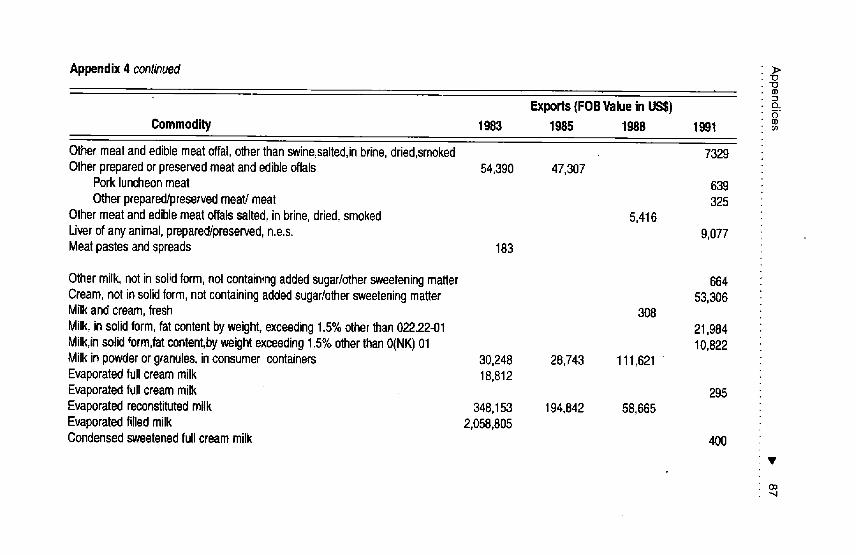
Appendix4 continued J>"O"OQ)
Exports{FOBValuein US$) o_5Commodity 1983 1985 1988 1991
Othermeatandediblemeatoffal,otherthanswine,salted,inbrine,dried,smoked 7329Otherpreparedorpreservedmeatandedibleoffals 54,390 47,307
Porkluncheonmeat 639Otherprepared/preservedmeat/meat 325
Othermeatandediblemeatoffatssalted,inbrine,dried,smoked 5,416Liverofanyanimal,prepared/preserved,n.e.s. 9,077Meatpastesandspreads 183
Othermilk,notinsolidform,notcontainingaddedsugar/othersweeteningmatter 664Cream,not insolidform,notcontainingaddedsugar/othersweeteningmatter 53,306Milkandcream,fresh 308Milk,insolidform,fatcontentbyweight,e_ceeding1.5%otherthan02222-01 21,984Milk,insolidform,fatcontent,byweightexceeding1.5%otherthanO(NK)01 10,822Milkinpowderorgranules,inconsumercontainers 30,248 28,743 111,621"Evaporatedfullcreammilk 18,812Evaporatedfullcreammilk 295Evaporatedreconstitutedmilk 348,153 194,842 58,665Evaporatedfilledmilk 2,058,805Condensedsweetenedfullcreammilk 400
{3O"M
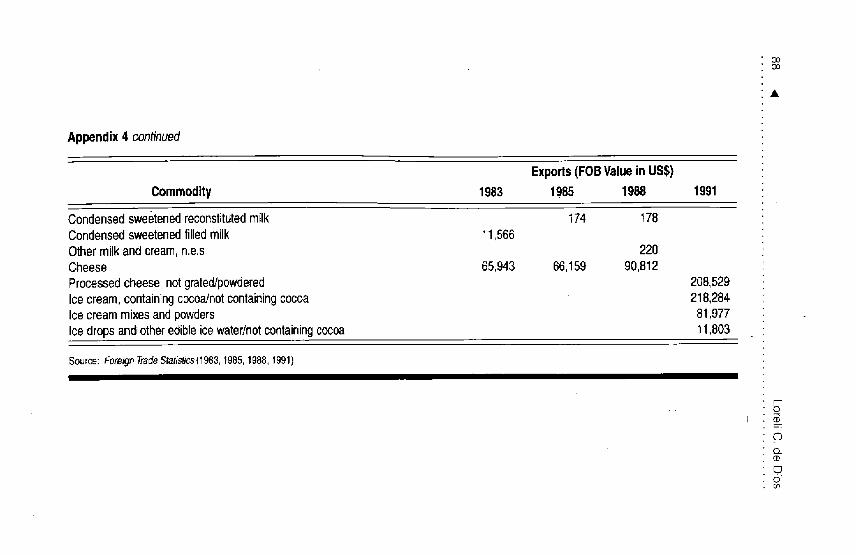
OOOO
Appendix4 continued
Exports(FOBValueinUS$)
Commodity 1983 1985 1988 1991
Condensedsweetenedreconstitutedmilk 174 178Condensedsweetenedfilledmilk 11,566Othermilkandcream,n.e.s 220Cheese 65,943 66,159 90,812Processedcheese,notgrated/powdered 208,529Icecream,containingcocoa/notcontainingcocoa 218,284Icecreammixesandpowders 81,977Icedropsandotheredibleicewater/notcontainingcocoa 11,803
Source: Foreign Trade Statistics(1983, '_985, 1988, 1991),
t-o
('3
(3.
oco
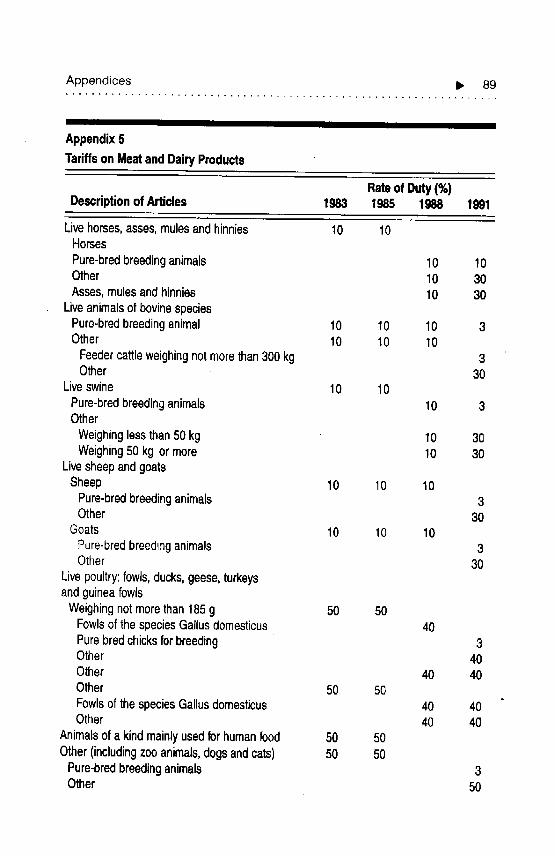
Appendices I_ 89
_1 I I I1 I
AppendixG
Tariffson MeatandDairyProducts
Rateof Duty(%)Descriptionof Articles 1983 1985 1988 1991
Livehorses,asses,mulesandhinnies 10 10Horses
Pure-bredbreedinganimals 10 10Other 10 30
Asses,mulesand hinnies 10 30Liveanimalsof bovinespecies
Pure-bredbreedinganimal 10 10 10 3Other 10 10 10
Feedercattleweighingnot morethan300kg 3Other 30
Liveswine 10 10
Pure-bredbreedinganimals 10 3Other
Weighinglessthan50 kg 10 3(]Weighing50 kg or more 10 30
LivesheepandgoatsSheep 10 10 10
Pure-bredbreedinganimals 3Other 30
Goats 10 10 10
Pure-bredbreedinganimals 3Other 30
Livepoultry:fowls,ducks,geese,turkeysandguineafowls
Weighingnot morethan 185g 50 50Fowlsof the speciesGallusdomesticus 40Purebredchicksfor breeding 3Other 40Other 40 40Other 50 50
Fowlsof the speciesGallusdomesticus 40 40Other 40 40
Animalsof a kind mainlyusedfor humanfood 50 50Other(includingzooanimals,dogsandcats) 50 50
Pure-bredbreedinganimals 3Other 50
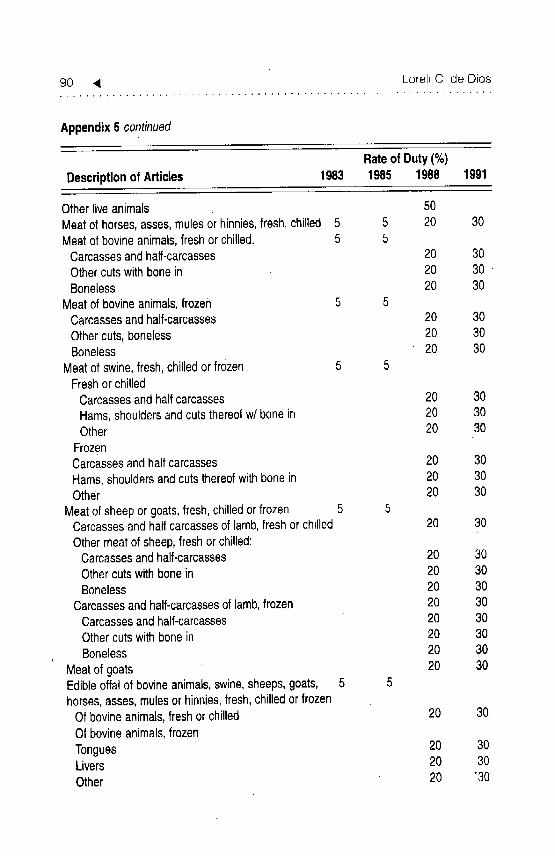
90 _1 Loreli C, de Dios
Appendix5 continued
Rateof Duty(%)
Descriptionof Articles 1983 1985 1988 1991
Otherliveanimals 50Meatof horses,asses,mulesor hinnies,fresh,chilled 5 5 20 30Meatof bovineanimals,freshor chilled. 5 5
Carcassesandhalf-cai'casses 20 30Othercutswithbonein 20 30Boneless 20 30
Meatof bovineanimals,frozen 5 5Carcassesandhalf-carcasses 20 30Othercuts,boneless 20 30Boneless 20 30
Meatof swine,fresh, chilledor frozen 5 5Freshorchilled
Carcassesandhalfcarcasses 20 30Hams,shouldersandcutsthereofw/bone in 20 30Other 20 30
FrozenCarcassesandhalf carcasses 20 30Hams,shouldersandcutsthereofwithbonein 20 30Other 20 30
Meatof sheepor goats,fresh,chilledor frozen 5 5Carcassesand halfcarcassesof lamb,freshor chilled 20 30
Othermeatof sheep,freshor chilled:Carcassesandhalf-carcasses 20 30Othercutswith bonein 20 30Boneless 20 30
Carcassesand half-carcassesof lamb,frozen 20 30Carcassesandhalf-carcasses 20 30Othercuts withbonein 20 30Boneless 20 30
Meatof goats 20 30Edibleoffalof bovineanimals,swine,sheeps,goats, 5 5horses,asses,mulesor hinnies,fresh,chilledor frozen
Of bovineanimals,freshor chilled 20 30Of bovineanimals,frozenTongues 20 30Livers 20 30Other 20 "30
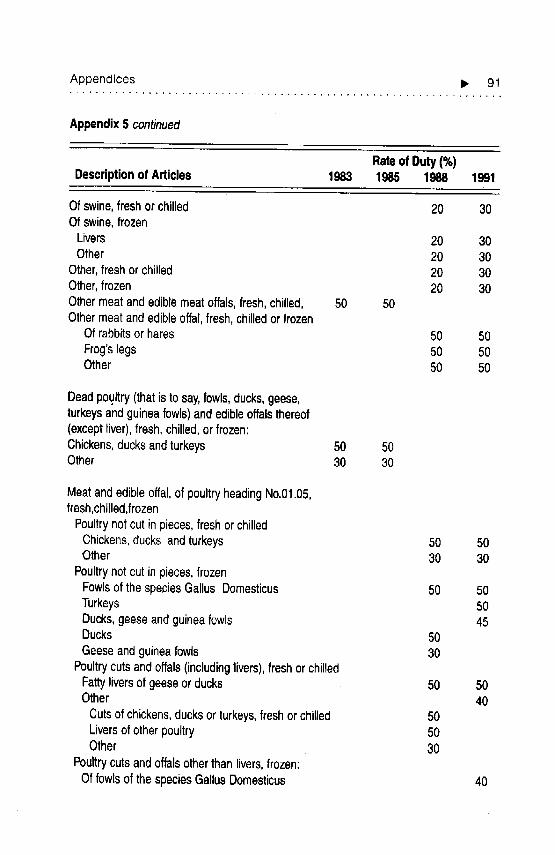
Appendices _ 91
Appendix5 continued
Rateof Duty(%)Descriptionof Articles 1983 1985 1988 1991
Ofswine,freshor chilled 20 30Of swine,frozen
Livers 20 30Other 20 30
Other,freshor chilled 20 30Other,frozen 20 30Othermeatandediblemeatoffals,fresh,chilled. 50 50Othermeatandedibleoffal,fresh,chilledor frozen
Of rabbitsor hares 50 50Frog'slegs 50 50Other 50 50
Deadpoultry(that is to say,fowls,ducks,geese,turkeysandguineafowls)andedibleoffalsthereof(exceptliver),fresh,chilled,or frozen:Chickens,ducksandturkeys 50 50Other 30 30
Meatandedibleoffal,of poultryheadingNo.01.05,fresh,chilled,frozen
Poultrynot cut in pieces,freshorchilledChickens,ducks andturkeys 50 50Other 30 30
Poultrynotcut in pieces,frozenFowlsof the speciesGallus Domesticus 50 50Turkeys 50Ducks,geeseandguineafowls 45Ducks 50Geeseandguineafowls 30
Poultrycuts andoffals(includinglivers),freshor chilledFattyliversof geeseor ducks 50 50Other 40
Cutsof chickens,ducksor turkeys,freshor chilled 50Liversof otherpoultry 50Other 30
Poultrycutsandoffalsotherthan livers,frozen:Of fowlsof the speciesGallusDomesticus 40
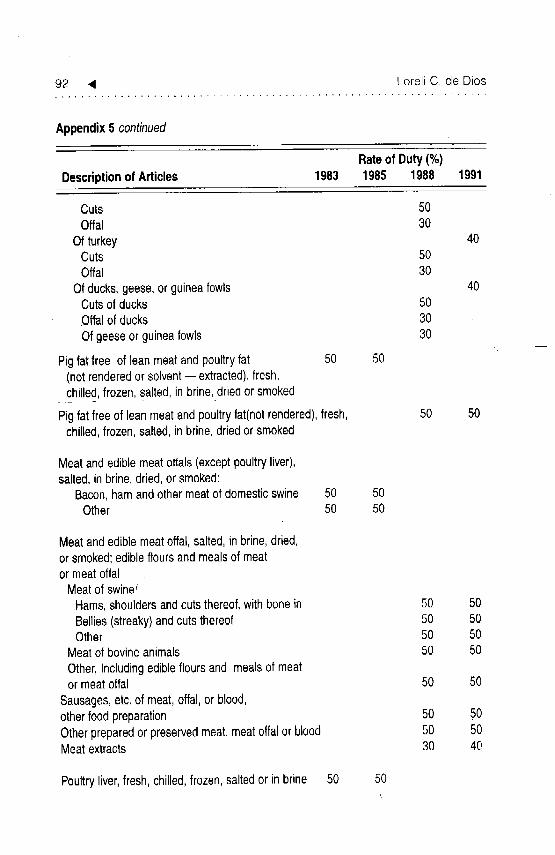
92 4 Loreli C, de Dios
Appendix5 continued
Rateof Duty(%)Descriptionof Articles 1983 1985 1988 1991
Cuts 50Offal 30
Of turkey 40Cuts 50Offal 30
Of ducks,geese,orguineafowls 40Cutsof ducks 50.Offalof ducks 30Of geeseor guineafowls 30
Pigfat free of leanmeatandpoultryfat 50 50(notrenderedor solvent-- extracted),fresh,chilled,frozen,salted,inbrine,driedorsmoked
Pigfat freeof leanmeatandpoultryfat(notrendered),fresh, 50 50chilled,frozen,salted,in brine,driedor smoked
Meatandediblemeatottals(exceptpoultryliver),salted,inbrine,dried,or smoked:
Bacon,hamandothermeatof domesticswine 50 50Other 50 50
Meatandediblemeatoffal,salted,in brine,dried,or smoked;ediblefloursand mealsof meator meatoffal
Meatof swine"Hams,shouldersandcutsthereof,withbonein 50 50Bellies(streaky)andcutsthereof 50 50Other 50 50
Meatof bovineanimals 50 50Other,Includingediblefloursand mealsof meator meatoffal 50 50
Sausages,etc.of meat,offal,or blood,otherfoodpreparation 50 50Otherpreparedor preservedmeat,meatoffalor blood 50 50Meatextracts 30 40
Poultryliver,fresh,chilled,frozen,saltedor in brine 50 50
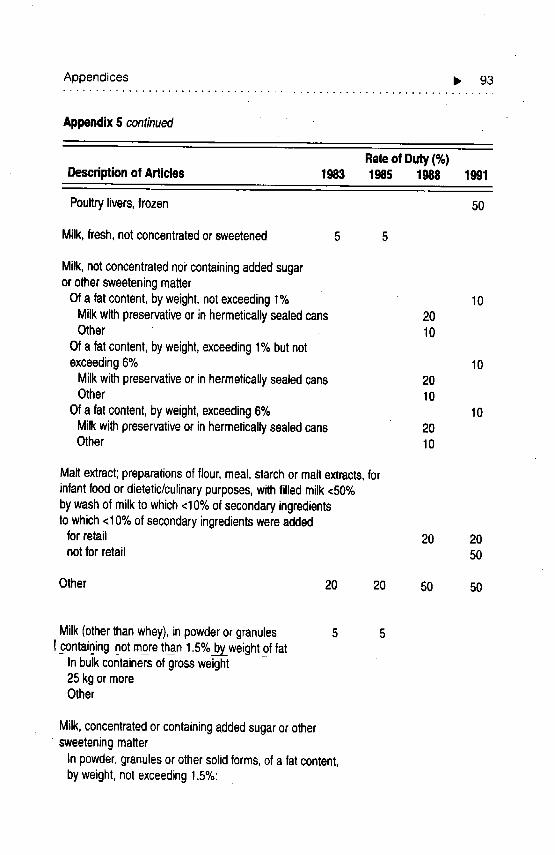
Appendices I_ 93
AppendixS continued•
Rateof Duty(%)Descriptionof Articles 1983 1985 1988 1991
Poultrylivers,frozen 50
Milk,fresh,notconcentratedor sweetened 5 5
Milk,notconcentratednorcontainingaddedsugaror othersweeteningmatter
Of a fat content,by weight,notexceeding1% 10Milkwithpreservativeor inhermeticallysealedcans 20Other 10
Of a fat content,byweight,exceeding1%but notexceeding6% 10
Milkwithpreservativeor inhermeticallysealedcans 20Other 10
Of a fat content,by weight,exceeding6% 10Milkwithpreservativeor in hermeticallysealedcans 20Other 10
Malt extract;preparationsof flour,meal,starchor maltextracts,forinfantfoodor dietetic/culinarypurposes,withfilled milk<50%bywashof milkto which<10%of •secondaryingredientsto which<10%of secondaryingredientswe[eadded
for retail 20 20not for retail 50
Other 20 20 50 50
Milk(otherthanwhey),inpowderorgranules 5 5! _contain_ing_notmorethan1.5%byweight_o.ffat
In bulkcontainersof grossweight25 kg ormoreOther
Milk,concentratedor containingaddedsugarorother• sweeteningmatter
In powder,granulesor othersolidforms,of a fatcontent,by weight,not exceeding1.5%:
94 _ Loreli C, cle Dios
Appendix5 continued
Rateof Duty (%)Descriptionof Articles 1983 1985 1988 1991
In bulkcontainersof grossweight20kg or more 10 10Other 20 20
Milk (otherthanwhey),in powderor granulescontainingmorethan 1.5%by weightof fat:
Milk 5 5Other
Milk,concentratedor containingaddedsugaror othersweeteningmatter
In powder,granulesor othersolidforms,of afat content,by weightexceeding1,5%•
Notcontainingaddedsugaror othersweeteningmatter:In bulkcontainersof grossweight20 kg ormore 20 20Other " " 20
Other: 20
In bulkcontainersof grossweight20 kg or more 20 20Other 20
Other:
Notcontainingaddedsugaror othersweeteningmatter 20Milk 2O
Other 20Milk 20
Milk (otherthan whey)cream,in formsother
than powderor granulesMilk 5 5
Cream,in powderor granulescontaining 10 10morethan 1,5%by weightof fatCream,in formsotherthan powderor granules 10 10
Cream,notcontainingaddedsugar 10Cream 10Cream 10Cream 10
Buttermilk
Appendices li_ 95
Appendix5 continued
RateofDuty(%)Descriptionof Articles 1983 19_ 1988 1991
CheeseandcurdCurd 30 30Cheese 40 40
CheeseandcurdFreshcheese(includingwheycheese),unripenedoruncuredandcurd;
Curd 30 20Freshcheese(includingwheycheese),unripenedoruncured 40 40
Gratedorpowderedcheese,ofallkinds 40 40Processedcheese,notgratedorpowdered 40 40Blue-veinedcheese 40 40Othercheese 40 40
Foodpreparationnotelsewherespecified 50 50Flavored/coloredsyrups 50 50
Icecream,andothericecreamproducts 50 50
Milkandcream,preserved,concentratedorsweetened:
Whey 5 5Whey,whetherornotconcentratedor containingaddedsugarorothersweeteningmatter;productsconsistingofnaturalmilkconstituents,whetherornotcontainingaddedsugarorothersweeteningmatter,not elsewherespecifiedorincluded.
Whey,whetherornotconcentratedorcontainingaddedsugarorothersweeteningmatter 10 10
Other:Concentrated,sweetened,withpreservativeaddedorinhermeticallysealedcans 20 20Other 10 10
96 4 Loreli C. de Dios
Appendix5 continued ....
: .. Rateof Duty(%)'Descriptionof Articles ,,,, 1983 1985 1988 1991
" Butter:. Butter . . 40 30Butter 30 30
Butterandotherfats andoils derivedfrommilkButter(anhydrousmilk fat)otherthanbutter 10 10
Butterfat (anhydrousmilk fat)otherthanbutter 10 10
Buttermilk,curdledmilkandcream,yogurt,kephirandotherfermentedor acidifiedmilkandcream,whetheror not concentratedorcontainingaddedsugaror othersweeteningmatteror flavouredorcontainingaddedfruitor cocoa.
Yogurt:Containingfruits,nuts,cocoaor flavouringmatter; 50 50liquidyogurtConcentrated,sweetened.,with pi'eservative 20addedor in hermeticallysealedcansOther 20 20
Other: ..Buttermilk
Containingfruits,nuts,cocoa,or flavouringmatter 50 50Other 10 10
Other:
Containingfruits,nuts,cocoaor flavouringmatter 50 50Concentrated,sweetened,with preservative 20addedor in hermeticallysealedcansOther 10 20
Edibleproductsof animalorigin,not elsewhere 50 50 50 50specifiedor included.
Source:TariffandCustomsCodeofthePhilippines,variousyears.EE I III III II
Appendices Ib 97
I I I I II I
Appendix6
ImportRestrictionsandLiberalizationofMeatandDairyInputsandProducts
PSCC Description
001.1100Bovineanimals,purebreed,forbreedingand R75R79L88'scientificpurposes
001.1900Bovineanimals,live,otherthanpurebreed R75R79L88forbreedingandscientificpurposes
001.2101Sheep,live,forbreedingandscientific R75R79L88purposes
001.2109Sheep,live,otherthanforbreedingand R75R79L88scientificpurposes
001.2201Goats,live,forbreedingandscientific R75R79L88purposes
001,2209Goats,live,otherthanforbreedingand R75L92R93L93purposes
001.3100Swine,live,forbreedingandscientific R75R79L88purposes
001.3900Swine,live,otherthanforbreedingand R75L92R93L93scientificpurposes
001,4101Chickens,live,notexceeding185g, R79R84L861.92R93L93forbreeding
001.4102Ducksandgeese,livenotexceeding185g, R79R83R84L86L92R93forbreeding L93
001.4103Turkeys,live,notexceeding185g, R79R83R84L86L92R93forbreeding L93
001.4109Otherlivepoultryofaweightnotexceeding R75R79R83R84L86L92185g,n.e.s. R93
001.4901Chickens,live,ofa weightexceeding185g R79R83R84L86L92R93forbreeding
001.4902Chickens,live,ofa weightexceeding185g, R75R79R83R841.86L92otherthanforbreeding R93
001.4903Ducksandgeese,live,ofa weightexceedingR79R83R84L86L91185g,forbreeding
001.4904Ducksandgeese,live,ofa weightexceedingR75R79R83R84L86L92185g,otherthanforbreeding R93L93
001.4905Turkeys,live,ofa weightexceeding185g, R79R83R84L86L91forbreeding
001.4906Turkeys,live,ofa weightexceeding185g R75R79R83R84L86L92otherthanforbreeding R93L93
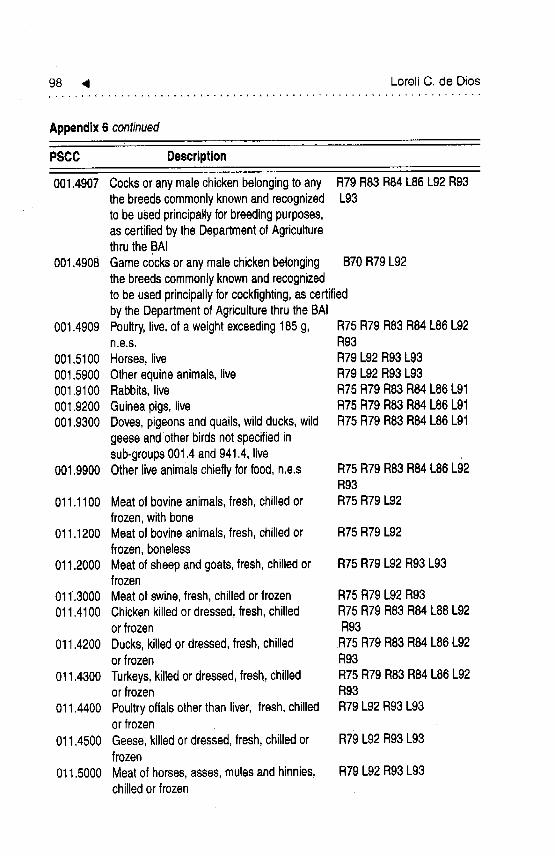
98 <1 Loreli C, de Dios
Appendix6 continued
PSCC Description
001.4907 Cocksoranymalechickenbelongingto any R79R83 R84L86 L92R93thebreedscommonlyknownandrecognized L93to beusedprincipallyforbreedingpurposes,ascertifiedbytheDepartmentofAgricuffurethrutheBAI
001.4908 Gamecocksor anymalechickenbelonging . BT0R79 L92thebreedscommonlyknownandrecognizedtobe usedprincipallyforcockfighting,ascertifiedbythe DepartmentofAgriculturethrutheBAI
001.4909 Poultry,live,of a weightexceeding185g, R75R79R83 R84L86L92n.e.s. R93
001.5100 Horses,live R79L92R93L93001.5900 Otherequineanimals,live R79L92R93L93001.9100 Rabbits,live R75R79 R83R84L86L9100i.9200 Guineapigs, live R75R79 R83R84 L86L91001.9300 Doves,pigeonsandquails,wild ducks,wild R75R79 R83R84 L86L91
geeseandother birdsnotspecifiedinsub-groups001.4and941.4,live
001,9g00 Otherlive animalschieflyforfood,n,e,s R75R79 R83R84 L86L92R93
011.1100 Meatof bovineanimals,fresh,chilledor R75R79 L92frozen,with bone
011.1200 Meatof bovineanimals,fresh,chilledor R75R79 L92frozen,boneless
011.2000 Meatof sheepandgoats,fresh,chilledor R75R79 L92R93L93frozen
011.3000 Meatof swine,fresh,chilledor frozen R75 R79L92R93011.4100 Chickenkilledor dressed,fresh,chilled R75 R79R83R84 L88L92
or frozen R93
011.4200 Ducks,killedordressed,fresh,chilled R75 R79R83 R84L86L92or frozen R93
011.4300 Turkeys,killedor dressed,fresh,chilled R75R79 R83R84L86L92or frozen R93
011.4400 Poultryoflalsotherthan liver, fresh,chilled R79L92R93 L93or frozen
011.4500 Geese,killedor dressed,fresh,chilledor R79L92R93 L93frozen
011.5000 Meatof horses,asses,mulesand hinnies, R79L92 R93L93chilledor frozen
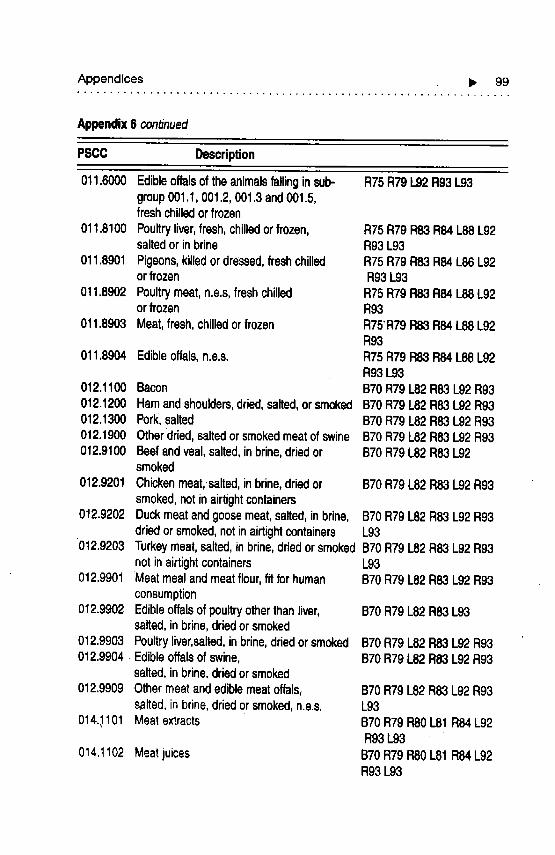
Appendices _, 99
Appendix6 continued
PBCC Description
011.6000Edibleoffalsoftheanimalsfailinginsub- R75R791.92R93L93group001.1,001.2,001.3and001.5,freshchilledor frozen
011.8100Poultryliver,fresh,chilledor frozen, R75R79R83R84L88L92saltedor inbrine R93L93
011.8901Pigeons,killedordressed,freshchilled R75R79FB3R84L86L92orfrozen R93L93
011.8902Poultrymeat,n.e.s,freshchilled R75R791183R84L88L92or frozen R93
011.8903Meat,fresh,chilledor frozen R75'R79R83R84L88L92R93
011.8904Edibleoffals,n.e.s. R75R79R83R84L88L92R93L93
012.1100Bacon B70R79L82R83L92R93012.1200Hamandshoulders,dried,salted,orsmokedB70R79L82R83L92R93012.1300Pork,salted B70R79L82R83L92R93012.1900Otherdried,saltedorsmokedmeatofswine B70R79L82R83L92R93012.9100Beefandveal,salted,inbrine,driedor B70R79I..82R83L92
smoked012.9201Chickenmeat,salted,inbrine,driedor B70R79L82R83L92R93
smoked,notinairtightcontainers012.9202Duckmeatandgoosemeat,salted,inbrine, B70R79L82R83L92R93
driedorsmoked,notinairtightcontainers L93012.9203Turkeymeat,salted,inbrine,driedorsmokedB70R79L82R83L92R93
notinairtightcontainers 1.93012.9901Meatmealandmeatflour,fitforhuman B70R79L82R83L92R93
consumption012.9902Edibleoffalsofpoultryotherthanliver, B70R79L82R83L93
salted,inbrine,driedorsmoked012.9903Poultryliver,salted,inbrine,driedorsmoked B70R79L82R83L92R93012.9904.Edibleoffalsofswine, B70R791.82R83L92R93
salted,inbrine,driedorsmoked012.9909Othermeatandediblemeatoffals,. B70R79L82R83L92R93
salted,inbrine,driedorsmoked,n.e.s. L93014.1101Meatextracts B70R79R80L81R84L92
R93L93014.1102Meatjuices B70R79R80L81R84L92
R93L93
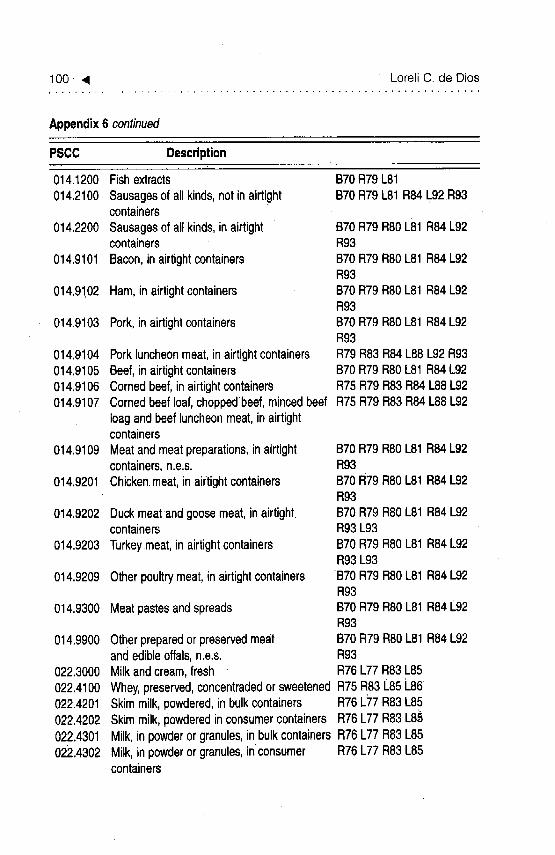
100 • ,4 Loreli C, de Dios.................................. • ............................. t" "
Appendix 6 continued
PSCC Description
014.1200 Fishextracts B70R79L81
014.2100 Sausagesofallkinds,notinairtight B70R79L81R84 L92R93containers
014.2200 Sausagesofall kinds,inairtight B70R79R80 L81R84L92containers R93
014.9101 Bacon,inairtightcontainers •B70R79R80 L81R84L92R93
014.91.02 Ham,inairtightcontainers B70R79RS0L81R84L92R93
014.9103 Pork,inairtightcontainers B70R79 R80L81R84L92R93
014.9104 Porkluncheonmeat,inairtightcontainers R79R83 R84L88L92R93014.9105 Beef,inairtightcontainers B70R79 R80L81R84L92014.9106 Cornedbeef,inairtightcontainers R75R79 R83R84 L88L92014.9107 Cornedbeef loaf,choppedbeef,mincedbeef R75R79 R83R84 L88L92
Ioagand beefluncheonmeat,inairtightcontainers
014.9109 Meatandmeatpreparations,inairtight B70R79 RS0L81R84L92containers,n.e.s. -R93
014.9201 Chicken.meat,inairtightcontainers B70R79 RS0L81R84L92R93
014.9202 Duckmeatandgoosemeat,inairtight. B70R79 RS0L81R84 L92containers R93L93
014.9203 Turkey.meat,inairtightcontainers B70R79 R80L81R84 L92R93 L93
014.9209 Otherpoultrymeat,inairtightcontainers B70 R79 RS0L81R84 L92R93
014.9300 Meatpastesandspreads B70R79 RS0L81R84 L92R93
014.9900 Otherpreparedorpreservedmeat B70R79 RS0L81R84 L92andedibleoffals,n.e.s. R93
022.3000 Milkandcream,.fresh R76L77R83L85022.4100 Whey,.preserved,concentradedorsweetenedR75R83 L85L86022.4201 Skimmilk,powdered,in bulkcontainers R76L77.R83L85022.4202 Skimmilk,powderedinconsumercontainersR76L77 R83L85022.4301 Milk,inpowderorgranules,inbulkcontainersR76L77 R83L85022.4302 Milk,inpowderorgranules,inconsumer R76L77 R83L85
containers
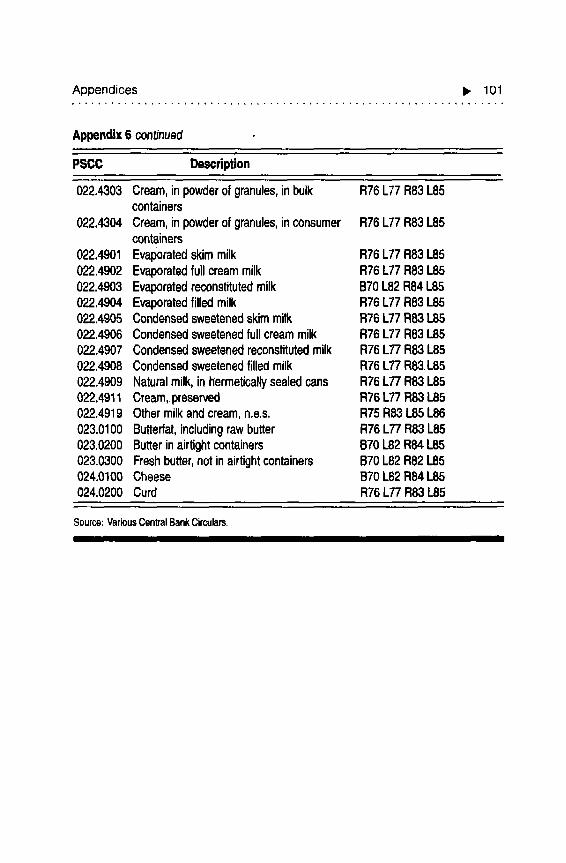
Appendices I_ 101°. ................................................................
Appendix6 continued
PSCC Descdption
022.4303 Cream,inpowderofgranules,inbulk R76 L77R83L85containers
022.4304 Cream,inpowderofgranules,inconsumer R76 L77R83L85containers
022.4901 Evaporatedskimmilk R76 L77R831.85022.4902 Evaporatedfullcreammilk R76 L77R83L85022.4903 Evaporatedreconstitutedmilk B701.82R841.85022.4904 Evaporatedfilled milk R76 L77R83L85022.4905 Condensedsweetenedskimmilk R76 L77R83L85022.4906 Condensedsweetenedfullcreammilk R76 L77R831.85022.4907 Condensedsweetenedreconstitutedmilk R76L77R83L85022.4908 Condensedsweetenedfilledmilk R76L77R831.85022.4909 Naturalmilk,inhermeticallysealedcans R76L77R83L85022,4911 Cream,preserved R76 L77R83I..85022.4919 Othermilkandcream,n.e.s. R75R&3L85L86023.0100 Butterfat,includingrawbutter R76L77R83L85023.0200 Butterinairtightcontainers 1370L82R84L85023.0300 Freshbutter,notinairtightcontainers B70L82R821.85024.0100 Cheese B70L82R84L85024.0200 Curd R76L77R831.85
Source:VariousCentralBankCirculars.I II II II III II
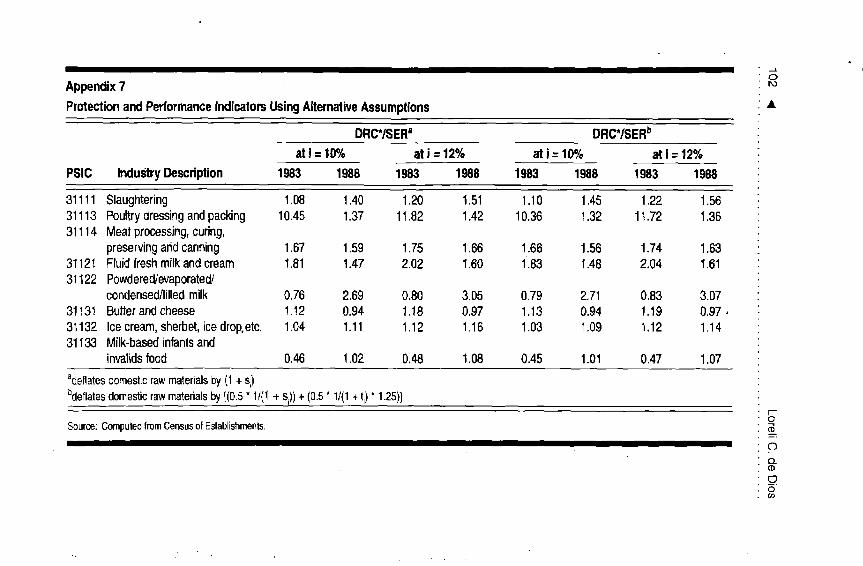
Appendix7 ro
ProtectionandPerformanceIndicatorsUsingAlternativeAssumptions •
DRC*/SERa DRC*/SERb
at i = tO% at i = 12% at i = llP/o at i = 12%
PSIC IndustryDescription 1983 1988 1983 1988 1983 1988 1983 1988
31111 Slaughtering 1.08 1.40 1.20 1.51 1.10 1.45 1.22 1.5631113 Poultrydressingandpacking 10.45 1.37 11.82 1.42 10.36 1.32 11.72 1.3631114 Meatprocessing,curing,
preservingandcanning 1.67 1.59 1.75 1.66 1.66 1.56 1.74 1.6331121 Fluidfreshmilkandcream 1.81 t.47 2.02 t.60 1.83 1.48 2.04 1.6131I 22 Powdered/evaporated/
condensed/filledmilk 0.76 2.69 0.80 3.05 0.79 2.71 0.83 3.073113t Butterandcheese 1.12 0.94 1.18 0.97 1.13 0.94 1.19 0.97 •31132 Icecream,sherbet,icedrop,etc. 1.04 1.11 1.12 1.16 1.03 1.09 1.12 1.1431133 Milk-basedinfantsand
invatidsfood 0.46 1.02 0.48 t.08 0.45 1.01 0.47 1.07
_'deflatesdomestLcrawmaterialsby(1+s)bdeflatesdomesticrawmaterialsby[(0.5* 1f(1+ S,))+ (0.5* 1f(1+ti)*1.25)]
0Source:ComputedfromCensusofEstablishments.
('30..Q)
_o0(,,,,;,
• . . ....