mécanismes de solidification des magmas basaltiques : Étude
TRANSCRIPT
HAL Id: tel-00544904https://tel.archives-ouvertes.fr/tel-00544904
Submitted on 9 Dec 2010
HAL is a multi-disciplinary open accessarchive for the deposit and dissemination of sci-entific research documents, whether they are pub-lished or not. The documents may come fromteaching and research institutions in France orabroad, or from public or private research centers.
L’archive ouverte pluridisciplinaire HAL, estdestinée au dépôt et à la diffusion de documentsscientifiques de niveau recherche, publiés ou non,émanant des établissements d’enseignement et derecherche français ou étrangers, des laboratoirespublics ou privés.
Mécanismes de solidification des magmas basaltiques :Étude quantitative texturale et géochimique des laves du
volcan Kilauea, HawaïNicolas Vinet
To cite this version:Nicolas Vinet. Mécanismes de solidification des magmas basaltiques : Étude quantitative texturaleet géochimique des laves du volcan Kilauea, Hawaï. Géologie appliquée. Université du Québec àChicoutimi, 2010. Français. <tel-00544904>
THÈSE PRÉSENTÉE À
L’UNIVERSITÉ DU QUÉBEC À CHICOUTIMI
COMME EXIGENCE PARTIELLE
DU DOCTORAT EN RESSOURCES MINÉRALES
PAR
NICOLAS VINET
MÉCANISMES DE SOLIDIFICATION DES MAGMAS BASALTIQUES : ÉTUDE
QUANTITATIVE TEXTURALE ET GÉOCHMIQUE DES LAVES DU V OLCAN
KILAUEA, HAWAII
NOVEMBRE 2010
ii
RÉSUMÉ
Le volcan Kilauea, Hawaii, est probablement le système magmatique basaltique actif le
plus étudié sur Terre, et représente donc un site privilégié pour l’étude des processus de solidification basaltique en milieu naturel. Une meilleure compréhension de la solidification magmatique est d’importance majeure dans le raffinement de modèles expliquant le dynamisme des chambres magmatiques, et son étude détaillée est susceptible de grandement améliorer notre connaissance de l’évolution globale des systèmes magmatiques. Dans ce contexte volcanique, les lacs de lave offrent une rare opportunité d'étudier directement la solidification magmatique et peuvent être considérés, en première approximation, comme des analogues superficiels de petites chambres magmatiques.
Le but premier de ce doctorat est de déterminer et quantifier les principaux processus de solidification magmatiques à l'œuvre dans la genèse des basaltes tholéiitiques. Ce travail s’articule autour du minéral olivine comme composant central. Dans les deux premiers chapitres, l'approche est double, texture et géochimie, mais l'emphase porte sur l'aspect textural dont l’analyse de la distribution de la taille des cristaux (CSD) est la composante phare. Ce travail a été réalisé sur les laves produites par les éruptions de 1969-1974 (Mauna Ulu) et 1959 (Kilauea Iki) du volcan Kilauea. L’étude des coulées de lave produites par l’éruption du Mauna Ulu permet de mieux comprendre les processus actifs de solidification dans tout le système magmatique superficiel (la "tuyauterie") de l’édifice. L’étude du lac de lave Kilauea Iki renseigne quant à elle sur la solidification en système semi-fermé en sub-surface. Dans un dernier temps, il est question d'évaluer plus en détail l'influence de la déformation magmatique sur la structure interne des olivines, et de la quantifier, en utilisant une technique in situ récente de micro-diffraction des rayons X. Chacun des trois chapitres de cette thèse est un article publié ou destiné à la publication dans une revue scientifique internationale.
L'article 1 présente les résultats en éléments majeurs et traces (roche totale), les compositions de l’olivine, et les CSDs de 11 échantillons de laves du Mauna Ulu. Les variations chimiques en roche totale sont interprétées comme étant partiellement produites par addition d’olivine dans le système magmatique. Les profiles CSD suggèrent qu’au moins deux populations d’olivines interviennent : (1) une population d’âges 3-40 ans, caractérisée par une faible densité de "gros" cristaux et des pentes CSD relativement faibles ; et (2) une population d’âges 1,5-15 ans, marquée par une forte densité de petits cristaux et des pentes CSD plus fortes. La gamme de compositions de l'olivine suggère que ces cristaux se sont formés à partir de magmas différents, probablement reliés par crystallisation fractionnée. La présence d'olivines déformées de toutes tailles couvrant la totalité de la gamme de compositions, montre que la population 1 provient principalement de la désintégration et assimilation d'un cumulat déformé. Cette population d'olivines représente un composant magmatique cumulatif précoce qui a subi du mûrissement textural. A l'inverse, la population 2 représente un composant magmatique tardif formé dans la région sommitale de stockage de magma. Nos résultats sont en accord avec l'hypothèse que ces deux composants magmatiques ont suivi deux trajets différents avant d'alimenter l'éruption du Mauna Ulu. Le magma contenant les olivines déformées aurait transité le long du décollement basal sous le Kilauea, puis remonté verticalement par des conduits de type "pipe" sous le rift du Mauna Ulu. Le magma contenant la plupart des olivines non déformées aurait quant à lui transité
iii
vers le réservoir sommital à travers le conduit magmatique principal, puis le long de la rift zone où les magmas se seraient finalement mélangés dans de petites chambres magmatiques satellites. La présence de fines zonalités inverses à la bordure de certains cristaux suggère que le mélange s'est fait juste avant l'éruption.
L'article 2 présente les compositions et CSDs d'olivine provenant de scories et d'échantillons de forage (0-90 m de profondeur) du lac de lave Kilauea Iki. Trois populations d'olivines sont distinguées sur la base de leur composition en forstérite (Fo) : (1) une population riche en Fo (Fo85-88) ; (2) une population intermédiaire (Fo77-81) ; et (3) une population mineure appauvrie en Fo (Fo72-76). Les populations 1 et 2 sont composées à la fois de cristaux déformés et non déformés. La troisième population pourrait résulter d'une phase de recroissance tardive. Dans les 60 derniers mètres du lac, l'olivine est moins riche en Fo et la proportion de cristaux déformés augmente. Ces observations laissent penser à l'existence d'une stratification minéralogique et chimique verticale dans le lac de lave. L'analyse CSD a permis d'estimer les temps de résidence des olivines dans le magma, 1-60 ans, valeurs qui sont en accord avec les estimations préexistantes. Les CSDs sont globalement uniformes eu égard à la profondeur. Cependant, certaines caractéristiques spécifiques ressortent. Ainsi, les CSDs courbées sont considérées comme évidence de mélange de magmas ou de cristaux. L'inversion de pente aux petites tailles de la plupart des CSDs du lac de lave est interprétée comme résultant du mûrissement. Les résultats de la modélisation CSD suggèrent que la décantation / sédimentation des olivines et la convection à grande échelle ne sont pas significatives dans l'évolution du lac de lave. Enfin, la stratification verticale du lac peut être expliquée de différentes façons. Il peut s'agir d'une caractéristique originelle, résultat de la stratification de la chambre magmatique source. Cependant, plusieurs évidences montrent que le magma du lac a été fortement brassé pendant toute la durée de l'éruption ; cette première hypothèse n'est donc pas crédible. Le remplissage par la base du lac durant l'éruption serait une autre hypothèse à même d'expliquer cette stratification. Cependant, il nous manque encore de quoi définitivement valider cette théorie.
L'article 3 présente l'analyse microstructurale in situ par micro-diffraction des rayons X (µXRD) d'olivines déformées et non déformées provenant d'une sélection d'échantillons préalablement étudiés dans les articles 1 et 2. Cette étude utilise une technique innovante, non destructive, peu coûteuse et rapide à mettre en œuvre permettant de recueillir des informations sur la structure interne des cristaux, ainsi que le mode et l'intensité de déformation. Les résultats ont permis de valider les observations pétrographiques de déformation faites à l'aide du microscope. Cette analyse µXRD a aussi permis de confirmer la présence de déformation pour toutes les tailles de grains d'olivine, sans corrélation simple avec leur chimie, et de quantifier cette déformation. Cette technique ne permet cependant pas une estimation simple des conditions pression-température de déformation ou de formation des cristaux, ni d'apporter d'informations sur l'histoire magmatique. Il a cependant été possible de fixer un seuil quantitatif au-delà duquel toute olivine est déformée de façon significative : full width at half maximum (FWHM) > 1°.
Mots-clés : Kilauea ; Hawaii ; solidification magmatique ; basalte tholéiitique ; olivine ; distribution
de la taille des cristaux (CSD) ; géochimie ; déformation cristalline ; Mauna Ulu ; Kilauea Iki ; lac de
lave.
iv
REMERCIEMENTS
« N'allez pas là où le chemin peut mener.
Allez là où il n'y a pas de chemin et laissez une trace ».
[Ralph Waldo Emerson]
Mener à bien une thèse de doctorat est une longue et parfois pénible affaire qui comporte de
multiples étapes de travail, étroitement associées à de multiples états de soit : on passe
inévitablement par des hauts, des bas, le doute, l’excès de confiance, le stress d’avant
présentation, le stress du travail qui n’avance pas assez, le stress des « deadlines », et j’en oublie…
Il va de soit que l’aboutissement d’un tel travail, tout universitaire soit-il, s’accompagne de l’aide
et l’implication de nombreuses personnes ; je m’attache donc ici à les remercier.
Mes remerciements vont tout d’abord à mon directeur de thèse, Michael D. Higgins, sans qui cette
thèse n’aurait pu voir le jour, bien entendu. Michael a su me transmettre une partie de sa maîtrise
de la CSD ; il a également su m’encourager et me soutenir tout au long du doctorat ; il a enfin su
être présent aux moments opportuns, et ce même lorsque je le lui mettais une certaine pression
(voire une pression certaine !), bien qu’il fût parti 6 mois en sabbatique au Chili au beau milieu du
doctorat. Je tiens ensuite à remercier Dr. Roberta Flemming, The University of Western Ontario,
London, pour son accueil sur place, son inébranlable bonne humeur, et bien sûr son aide précieuse
lors des analyses de diffraction des rayons X et de l’interprétation des résultats. Je voudrais aussi
adresser ma gratitude aux membres du jury, Messieurs Pierre Cousineau, Anthony Fowler, Edward
Sawyer et Ross Stevenson, qui ont accepté de lire et juger ce travail.
J’aimerais par ailleurs souligner l’implication et l’aide précieuse de certaines personnes dans mes
travaux, implication sous la forme de discussions scientifiques enrichissantes, d’aide aux analyses
ou à l’échantillonnage, et de relecture d’une partie du manuscrit : Sorena Sorensen et Leslie Hale,
National Rock and Ore Collections, National Museum of Natural History, Smithsonian Institution,
Washington D.C. ; Rosalind T. Helz, USGS ; Don Swanson, USGS ; Rhonda Loh, Acting Chief, Natural
v
Resources Division, Hawaii Volcanoes National Park ; Michael O. Garcia et Jared P. Marske,
University of Hawaii ; Judit Ozoray.
Merci aussi à tous les étudiants du REDiST à Chicoutimi pour ces beaux moments partagés
ensemble, ou tout simplement pour m’avoir accompagné à un moment donné dans ce doctorat ;
je parle ici, et dans le désordre, de : Fab, Domi, Stéph, Bélinda, J-F, Sam, Levin, Marjo, Séb, Carlos-
El-Peruano, Carlos-El-Colombiano, Lyndsay, Julien, Aïssatou, Tafa, Nadège, Olivier, Nancy, et tous
les autres.
Mes pensées et ma reconnaissance vont également aux étudiants et autres personnes du
GEOTOP-UQAM qui m’ont côtoyé et supporté sur la fin, alors que je hantais leurs couloirs et
bureaux (parfois simplement en quête d’une âme qui vive avec qui jaser… et boire un espresso) ; il
s’agit de : Jenny, Jean-B, Quentin, Laurence, Christelle, Benoît, Olivia, Chantal, Josée, Sandrine, et
d’autres que j’oublie certainement. Une pensée toute particulière pour Jenny et Jean-B pour nos
longues fins de semaine adirondackiennes mémorables (pour ne citer que le tout meilleur) ! Le
GEOTOP-chalet ou même la GEOTOP-yourte sont des projets auxquels je pense toujours…
Je ne peux oublier mes parents et mon frère, qui m’ont apporté soutien et confiance tout au long
de cette « aventure » en terres québécoises. Je n’oublie pas non plus tous mes autres bons z’amis
du Québec et d’ailleurs (France, Angleterre) ; ils se reconnaîtrons.
Et le meilleur pour la fin ! Un énorme merci à ma moitié, Émilie, pour sa patience, son soutien
perpétuel et sa sagesse lorsque je commençais à devenir vraiment « invivable ». Cette thèse
n’aurait probablement pas aboutie sans sa douce présence, son abnégation et la confiance qu’elle
a su m’insuffler en tout temps.
vi
TABLE DES MATIÈRES
RÉSUMÉ................................................................................................................................ ii REMERCIEMENTS................................................................................................................ iv TABLE DES MATIÈRES.......................................................................................................... vi LISTE DES TABLEAUX........................................................................................................... ix LISTE DES FIGURES ............................................................................................................... x INTRODUCTION....................................................................................................................1 1 Problématique ...............................................................................................................5 1.1 Mécanismes physiques de solidification magmatique...........................................5
1.1.1 PROCESSUS CINÉTIQUES : NUCLÉATION ET CROISSANCE CRISTALLINES......................................... 6 1.1.2 PROCESSUS DE RÉÉQUILIBRAGE : MÛRISSEMENT TEXTURAL .................................................... 11 1.1.3 PROCESSUS DE SÉPARATION MÉCANIQUE ENTRE LIQUIDE SILICATÉ ET CRISTAUX ......................... 13 1.1.4 AUTRES PROCESSUS......................................................................................................... 17
1.2 Modèles de solidification des magmas basaltiques .............................................19 1.2.1 SOLIDIFICATION EN PROFONDEUR DANS UNE CHAMBRE MAGMATIQUE..................................... 19 1.2.2 SOLIDIFICATION EN SUB-SURFACE DANS UN LAC DE LAVE........................................................ 20
1.3 Déformation des olivines......................................................................................25 1.4 Synthèse................................................................................................................28
2 Objectifs .......................................................................................................................30 3 Méthodologie ..............................................................................................................32 4 Format de la thèse .......................................................................................................40 RÉFÉRENCES.......................................................................................................................43
CHAPITRE 1 MAGMA SOLIDIFICATION PROCESSES BENEATH KILAUEA VOLCANO, HAWAII:
A QUANTITATIVE TEXTURAL AND GEOCHEMICAL STUDY OF THE 1969-1974 MAUNA ULU LAVAS
1.1 Abstract.................................................................................................................53 1.2 Introduction ..........................................................................................................54 1.3 Mineralogy and petrography................................................................................61
1.3.1 SAMPLING ..................................................................................................................... 61
1.3.2 MACROSCOPIC CHARACTERISTICS ...................................................................................... 63
1.4 Chemical studies ...................................................................................................67 1.4.1 ANALYTICAL METHODS..................................................................................................... 67
1.4.2 WHOLE-ROCK GEOCHEMISTRY .......................................................................................... 67
1.4.2.1 Major elements................................................................................................... 67 1.4.2.2 Ni and Cr content ................................................................................................ 72
1.4.3 OLIVINE CHEMISTRY ........................................................................................................ 75
vii
1.5 Quantitative textural measurements: Crystal Size Distribution (CSD).................85 1.5.1 CSD THEORY .................................................................................................................. 85
1.5.2 ANALYTICAL METHODS..................................................................................................... 89
1.5.3 CSD RESULTS ................................................................................................................. 99
1.6 Discussion ...........................................................................................................106 1.6.1 ORIGIN OF MAUNA ULU OLIVINE: MANTLE, CRUST OR BOTH? .............................................. 106
1.6.2 WHERE AND WHEN DID THE CRYSTALLISATION OCCUR? ....................................................... 109
1.6.3 ADDITION AND DEFORMATION OF OLIVINE ........................................................................ 112
1.6.4 AGGREGATION AND TEXTURAL COARSENING...................................................................... 117
1.6.5 DISRUPTION OF THE CUMULATE AND INCORPORATION INTO THE MAGMA............................... 120 1.6.6 MOVEMENT TO THE SUMMIT AND RIFT ZONES – MULTIPLE MAGMA MIXING EVENTS?.............. 122
1.7 Model of Mauna Ulu magma dynamics in the context of Kilauea dynamics .....126 1.8 Acknowledgements ............................................................................................130 1.9 References ..........................................................................................................130
APPENDIX 1-1.................................................................................................................. 140
CHAPITRE 2 WHAT CAN CRYSTAL SIZE DISTRIBUTIONS AND OLIVINE COMPOSITIONS TELL US ABOUT
MAGMA SOLIDIFICATION PROCESSES INSIDE KILAUEA IKI LAVA LAKE, HAWAII?
2.1 Abstract...............................................................................................................142 2.2 Introduction ........................................................................................................143 2.3 The 1959 Kilauea Iki eruption .............................................................................145 2.4 Mineralogy and petrography overview ..............................................................148
2.4.1 SAMPLING ................................................................................................................... 148
2.4.2 MACROSCOPIC CHARACTERISTICS .................................................................................... 150
2.4.2.1 General remarks ............................................................................................... 150 2.4.2.2 Olivines ............................................................................................................. 150 2.4.2.3 Olivine aggregates............................................................................................ 151 2.4.2.4 Other minerals .................................................................................................. 152 2.4.2.5 Vertical olivine-rich bodies................................................................................ 153 2.4.2.6 Olivine-depleted zone ....................................................................................... 153
2.4.3 CHEMICAL STUDIES........................................................................................................ 154
2.4.3.1 Analytical methods ........................................................................................... 154 2.4.3.2 Olivine core and rim composition distribution.................................................. 155 2.4.3.3 Zoning ............................................................................................................... 160 2.4.3.4 CaO and NiO composition................................................................................. 163
2.4.4 DEFORMED OLIVINE CRYSTALS......................................................................................... 165
2.5 Quantitative textural measurements: Crystal Size Distribution (CSD)...............169 2.5.1 METHODS ................................................................................................................... 169
2.5.2 CSD RESULTS ............................................................................................................... 179
2.5.2.1 General remarks ............................................................................................... 179 2.5.2.2 CSD variations for sizes <1.0 mm...................................................................... 180
viii
2.5.2.3 CSD variations for sizes >1.0 mm...................................................................... 181 2.5.2.4 Other CSD-derived results ................................................................................. 182 2.5.2.5 Lateral and depth-related evolution: centre versus margin of the lake ........... 186 2.5.2.6 Size distributions of deformed crystals ............................................................. 189 2.5.2.7 Olivine size distribution in the vorbs ................................................................. 193
2.6 Discussion ...........................................................................................................195 2.6.1 RESIDENCE TIMES OF OLIVINE IN KILAUEA IKI MAGMAS........................................................ 195
2.6.2 PROCESSES ACTIVE IN KILAUEA IKI MAGMA SYSTEM BEFORE ERUPTION................................... 197
2.6.2.1 Mixing ............................................................................................................... 198 2.6.2.2 Coarsening ........................................................................................................ 203 2.6.2.3 Crystal deformation .......................................................................................... 204
2.6.3 PROCESSES ACTIVE IN KILAUEA IKI LAVA LAKE..................................................................... 206
2.6.3.1 Crystal settling .................................................................................................. 206 2.6.3.2 Convective or advective redistribution of crystals ............................................ 212 2.6.3.3 Final crystal growth .......................................................................................... 214 2.6.3.4 Origin of the chemical and mineralogical vertical stratification ...................... 215
2.7 Conclusions .........................................................................................................218 2.8 Acknowledgements ............................................................................................219
2.9 References ..........................................................................................................219 APPENDIX 2.1 ...................................................................................................................228
CHAPITRE 3 CRYSTAL STRUCTURE, MOSAICITY AND STRAIN ANALYSIS OF HAWAIIAN OLIVINES USING
IN-SITU MICRO X-RAY DIFFRACTION (µXRD)
3.1 Abstract...............................................................................................................234 3.2 Introduction ........................................................................................................235 3.3 Materials and methods.......................................................................................237
3.3.1 MATERIALS .................................................................................................................. 237
3.3.2 MICRO XRD METHODS .................................................................................................. 237
3.4 Results and discussion ........................................................................................239 3.5 Concluding remarks ............................................................................................257 3.6 Acknowledgements ............................................................................................258
3.7 References ..........................................................................................................259 SYNTHÈSE ET CONCLUSION .............................................................................................261 ANNEXE 1 .........................................................................................................................267 ANNEXE 2 .........................................................................................................................287 ANNEXE 3 .........................................................................................................................315 ANNEXE 4 .........................................................................................................................317 ANNEXE 5 .........................................................................................................................318
ix
LISTE DES TABLEAUX
CHAPITRE 1 Table 1-1. Sample locations of Mauna Ulu lava flows...................................................................... 62 Table 1-2. Whole-rock major-element, plus Ni and Cr compositions and olivine modal abundances
of the Mauna Ulu samples............................................................................................... 71 Table 1-3. Representative microprobe analyses of olivine cores and rims from Mauna Ulu samples........................................................................................................................................................... 82 Table 1-4. Crystal size ranges expressed as the number of crystals per unit area........................... 96 Table 1-5. Textural data (input and output) from CSDCorrections................................................... 97 Table 1-6. CSD results including slope and intercept data calculated by CSDCorrections for each
sample ............................................................................................................................. 98
CHAPITRE 2 Table 2-1. Representative microprobe analyses of olivine cores and rims from Kilauea Iki surface
and lake samples ........................................................................................................... 157 Table 2-2. Textural data (input and output) from CSDCorrections................................................. 168 Table 2-3. Crystal size ranges expressed as the number of crystals per unit area......................... 175 Table 2-4. CSD results including slope and intercept data calculated by CSDCorrections for each
sample ........................................................................................................................... 177
CHAPITRE 3 Table 3-1. Comparison between petrographic and µXRD evidence of deformation ..................... 252 Table 3-2. Full width at half maximum (FWHM) for single deformed and undeformed olivine
crystals from Mauna Ulu and Kilauea Iki volcanic rocks................................................ 254
x
LISTE DES FIGURES
INTRODUCTION Figure 1. Développement des textures magmatiques........................................................................ 4 Figure 2. Énergie libre totale et degré de surfusion vs. Nucléation ................................................... 9 Figure 3. Taux de nucléation ou de croissance en fonction du degré de surfusion ......................... 10 Figure 4. Schéma de l'effet du mûrissement textural sur des cristaux de plagioclase immergés dans
un magma basaltique ........................................................................................................ 12 Figure 5. Colonne de magma schématique ...................................................................................... 15 Figure 6. Accumulation et capture de cristaux au niveau du front de solidification supérieur ....... 15 Figure 7. Modèle simple d'un lac de lave ......................................................................................... 22 Figure 8. Schémas descriptifs des modèles de solidification du lac de lave du Kilauea Iki .............. 23 Figure 9. Photographies des zones étudiées : Mauna Ulu et Kilauea Iki, Hawaii ............................. 34 Figure 10. Différents types de zonalité chimique de l'olivine et autres observations...................... 37
CHAPITRE 1
Figure 1-1. (a) Sketch map of Kilauea Volcano, showing the summit region, the two rift-zones and the Mauna Ulu lava field 1969-74. (b) Mauna Ulu lava sampling map .......................... 59
Figure 1-2. Representative photomicrographs of the different types of Mauna Ulu olivine crystals........................................................................................................................................................... 66 Figure 1-3. Whole-rock MgO variation diagrams for the Mauna Ulu lavas compared to other
historical Kilauea lavas.................................................................................................... 69 Figure 1-4. Selected major-oxide variation diagrams....................................................................... 70 Figure 1-5. Variations of Ni and Cr compositions versus K for Mauna Ulu lavas compared to some
other historical Kilauea lavas.......................................................................................... 73 Figure 1-6. Ni and Cr content versus olivine abundance for the Mauna Ulu lavas .......................... 74 Figure 1-7. Whole-rock Mg-number plotted against olivine core composition for Mauna Ulu lavas
........................................................................................................................................ 78 Figure 1-8. CaO content versus Fo content of the core of both the undeformed and deformed
olivine crystals analyzed in the Mauna Ulu lavas ........................................................... 79 Figure 1-9. Variation of Fo content from core to rim versus Fo composition or rim, for the olivine
grains analyzed in different Mauna Ulu samples ........................................................... 80 Figure 1-10. Schematic examples of processes that can influence the shape of the CSD ............... 88 Figure 1-11. Stitched photomicrographs and digitized olivine texture images................................ 92 Figure 1-12. Olivine crystal size distributions of the Mauna Ulu lavas............................................. 93 Figure 1-13. Schematic diagrams illustrating the segmentation of CSDs......................................... 94 Figure 1-14. Characteristic length versus olivine volumetric proportion in the Mauna Ulu lavas ... 95 Figure 1-15. Olivine CSDs of Mauna Ulu lavas plotted separately.................................................. 103 Figure 1-16. Effects of the presence of deformed crystals on the crystal size distribution ........... 104 Figure 1-17. Plot of I/L versus S/I ratios for Mauna Ulu lavas ........................................................ 105 Figure 1-18. (a) Plot of olivine volumetric abundance versus whole-rock MgO content for the
Mauna Ulu lavas. (b) Variations of Ni against MgO contents for Mauna Ulu lavas ... 115
xi
Figure 1-19. Plot of Ni versus MgO for Mauna Ulu lavas and both undeformed and deformed olivines........................................................................................................................ 116
Figure 1-20. Schematic cross-section of Kilauea's magmatic plumbing system underneath the summit and upper East Rift Zone ............................................................................... 129
Figure 1-A1. CSD plots of the undeformed olivine population versus the total (deformed + undeformed) population for individual samples from Mauna Ulu ............................ 140
CHAPITRE 2
Figure 2-1. a) Plan view of the post-1959 surface of Kilauea Iki. b) N-S cross-section of Kilauea Iki lava lake ........................................................................................................................ 147
Figure 2-2. Histograms of olivine microphenocryst and phenocryst core compositions in lake and surface scoria samples.................................................................................................. 149
Figure 2-3. Histogram of olivine rim compositions (in Fo %) in lake samples ................................ 156 Figure 2-4. Variation of Fo content from core to rim versus Fo composition or rim, for the olivine
grains analyzed in Kilauea Iki samples, regarding the depth........................................ 162 Figure 2-5. CaO (a) and NiO (b) content versus Fo content of the core of both the undeformed and
deformed olivine crystals analyzed in the lake samples .............................................. 164 Figure 2-6. Ratio of deformed crystals to the total population plotted against the depth in the lava
lake ............................................................................................................................... 167 Figure 2-7. Olivine crystal size distributions of surface and lake samples...................................... 172 Figure 2-8. Characteristic length versus olivine volumetric proportion in the surface and lake
samples......................................................................................................................... 174 Figure 2-9. Maximum 3-D size (Lmax) plotted against the depth in the lava lake............................ 185 Figure 2-10. Characteristic length plotted against the depth in the lava lake ............................... 188 Figure 2-11. Representative CSDs of undeformed versus total olivine populations...................... 191 Figure 2-12. Crystal size distribution of (a) the vorb-only part of selected samples; and (b) the vorb
and non-vorb parts of KI81-2-185.7 ........................................................................... 194 Figure 2-13. Comparison of our mean surface CSD versus recalculated pumice CSD from data of
Mangan (1990) ........................................................................................................... 202 Figure 2-14. Olivine abundance plotted against the depth in the lava lake................................... 210 Figure 2-15. Modeled CSDs after olivine settling ........................................................................... 211
CHAPITRE 3
Figure 3-1. Micro X-ray diffraction data from MU69-1b-grain 15 .................................................. 244 Figure 3-2. Full width at half maximum values for undeformed, deformed and ambiguous olivine
grains ............................................................................................................................ 246 Figure 3-3. Full width at half maximum versus olivine core forsterite content ............................. 247 Figure 3-4. Full width at half maximum versus crystal size for all hkl indexes at a time................ 248 Figure 3-5. Full width at half maximum versus crystal size for selected individual hkl indexes..... 249 Figure 3-6. Full width at half maximum versus crystal size for each analysed sample .................. 250 Figure 3-7. Polarizing light microscope images and μXRD data for strained versus unstrained
Kilauean olivine............................................................................................................. 251
1
INTRODUCTION
La solidification du magma est un des problèmes fondamentaux en pétrologie ignée et
volcanologie ; la surface de la Terre, qui est en perpétuelle évolution, est composée en partie de
roches solidifiées dérivées d’un magma. La solidification comprend principalement la
cristallisation, mais peut aussi inclure la dissolution des cristaux. Bien comprendre la solidification
du magma est importante pour le raffinement de modèles concernant le dynamisme des
chambres magmatiques, par exemple. Son étude détaillée peut améliorer notre connaissance de
l’évolution des systèmes magmatiques, depuis la génération de magma au niveau de la frontière
croûte-manteau ou dans le manteau plus profond, jusqu’à l’éruption volcanique en surface suite à
la remontée de magma. Il y a solidification du magma en profondeur, dans le système
magmatique de l’édifice volcanique, ou bien en surface, lors de l’éruption volcanique ainsi que la
mise en place et le refroidissement des laves. Les roches volcaniques et leurs cristaux apportent
ainsi de l’information sur les conditions de solidification du magma. L’information peut être
recueillie à partir de la texture d’une roche (par exemple, la taille, type et distribution de ses
cristaux), de sa composition chimique et minéralogique, mais aussi à partir de la composition
chimique des cristaux. L’étude de la solidification du magma peut aussi aider à reconstruire la
dynamique de transport et les trajets empruntés par le magma à travers l’ensemble du système
magmatique sous-édifice.
L’information recueillie sur la solidification magmatique permet une meilleure
détermination des principaux mécanismes physiques influençant le refroidissement, la
solidification et la différenciation chimique d'un corps magmatique ; il s’agit d’un grand défi en
2
pétrologie ignée (e.g. Jellinek and Kerr, 2001). Les processus de refroidissement et de
cristallisation sont par ailleurs les clés de la compréhension de l'évolution crustale continentale et
océanique (e.g. Rupke and Hort, 2004). La solidification magmatique est cependant un processus
complexe qui demeure mal compris et peu quantifié aujourd’hui, malgré les nombreuses études
entreprises depuis quelques décennies. Son étude en milieu naturel, bien que généralement
problématique, mérite une attention toute particulière.
La solidification magmatique comporte de nombreux processus intrinsèques, variables en
nombre comme en importance suivant les conditions et l’environnement de refroidissement (e.g.
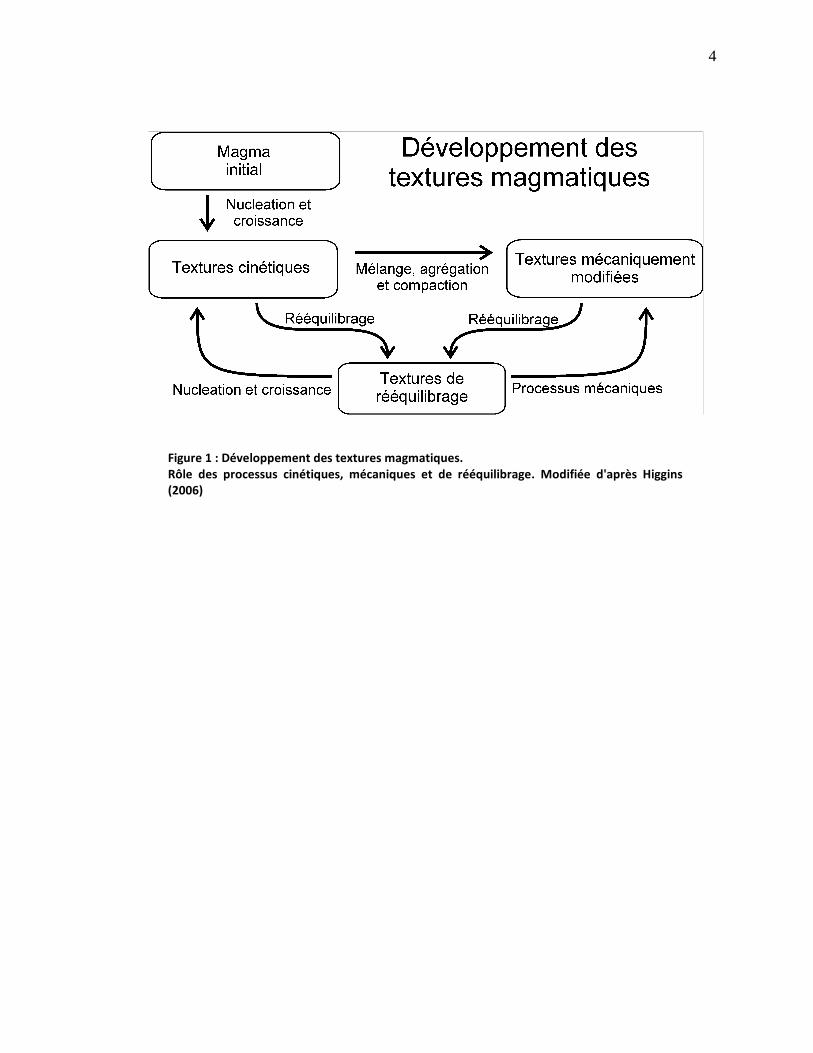
Cashman, 1993). Le développement des textures ignées est grandement influencé par ces
processus qui peuvent être de nature cinétique, mécanique ou de rééquilibrage. Des processus
cinétiques produisent des populations cristallines qui peuvent ensuite être modifiées par des
processus mécaniques, puis se rééquilibrer partiellement lorsque les forces cinétiques sont
réduites (Fig. 1). La texture finale d'une roche ignée est donc le résultat de la combinaison entre
effets cinétiques et effets liés au rééquilibrage (Higgins, 2006), s'il n'y a aucune réaction
minéralogique subséquente. Les mécanismes spécifiques impliqués dans ces trois grands groupes
se résument comme suit : (1) pour les processus cinétiques, il s'agit de la nucléation et croissance
cristallines (e.g. Bonin, 1998; Dowty, 1980a; Lofgren, 1980) ; (2) pour les processus de
rééquilibrage, le mûrissement textural (e.g. Baronnet, 1984; Cabane et al., 2005; Higgins, 1998;
Higgins and Roberge, 2003; Holness et al., 2007; Hunter, 1996; Park and Hanson, 1999; Voorhees,
1992) ; et (3) pour les processus mécaniques, correspondant pour la plupart à la séparation entre
liquide silicaté et cristaux, il s'agit de la décantation gravitaire des cristaux (Helz, 1980; e.g. Helz,
1987a; Higgins, 2002; Hort et al., 1993; Hoshide et al., 2006; Jellinek and Kerr, 2001; Marsh, 1988,
1996; Martin and Nokes, 1988, 1989; Rudman, 1992), l'agrégation (e.g. Schwindinger, 1999;
3
Schwindinger and Anderson, 1989), et la compaction et formation de chaînes de cristaux (e.g. Gray
et al., 2003; Jerram et al., 2003; Philpotts et al., 1999; Philpotts and Philpotts, 2005). La convection
(ou advection) dans le corps magmatique (e.g. Bartlett, 1969; Brandeis and Jaupart, 1986;
Campbell, 1996; Couch et al., 2001; Davaille and Jaupart, 1993; Hort et al., 1999; Huppert and
Sparks, 1984; Jaupart and Tait, 1995; Martin et al., 1987; Neri, 1998; Turner and Campbell, 1986;
Worster et al., 1993) et le mélange de magmas (e.g. Clague et al., 1995; Helz, 1987b; Jellinek and
Kerr, 2001; Martin et al., 2006; Rhodes et al., 1979; Shamberger and Garcia, 2007; Thornber, 2003;
Worster et al., 1993; Wright, 1973; Wright et al., 1975), peuvent également jouer un rôle
important en tant que processus mécaniques.
Ces processus peuvent marquer de leur empreinte la texture et/ou la chimie des roches
volcaniques qui en résultent. L'approche est donc double dans ce travail de doctorat, texture et
géochimie, mais l'emphase porte sur l'aspect textural.
4
Figure 1 : Développement des textures magmatiques. Rôle des processus cinétiques, mécaniques et de rééquilibrage. Modifiée d'après Higgins (2006)
5
1 Problématique
Cette thèse s'intéresse spécifiquement à la solidification des magmas basaltiques (senso
lato), et s'articule autour d’un composant central : l'olivine. Il s'agit de mieux comprendre (et
quantifier) les processus de solidification des magmas basaltiques par le biais d'une étude
texturale et géochimique quantitative appliquée en milieu naturel, les laves du volcan Kilauea,
Hawaii. Dans un premier temps, je traiterai des différents mécanismes de solidification
magmatique, puis de quelques modèles de solidification des magmas basaltiques, et enfin de la
déformation de l’olivine.
1.1 Mécanismes physiques de solidification magmatique
La solidification magmatique se caractérise, comme pour tous les processus de pétrologie
ignée, par un transfert d’énergie et éventuellement de masse, de façon à atteindre un état
d’équilibre à un niveau d’énergie plus faible (Bonin, 1998). La solidification d’un magma est en
général une conséquence directe de son refroidissement. Les mécanismes physiques intervenant
lors de la solidification des magmas basaltiques peuvent se décomposer en trois grandes
catégories (fig. 1) : (1) les processus cinétiques ; (2) les processus de rééquilibrage ; et (3) les
processus de séparation mécanique entre liquide silicaté et cristaux. A l'intérieur du corps
magmatique basaltique en cours de refroidissement, deux contextes physiques de solidification
peuvent être différenciés : (i) les mécanismes au niveau des fronts de solidification (Marsh, 1996),
couches limites partiellement cristallisées ; et (ii) les mécanismes ayant lieu à l’intérieur même du
corps magmatique, dans la partie dominée par le liquide silicaté. Suivant l’environnement
6
magmatique considéré – chambre magmatique, lac de lave, ou coulée de lave, par exemple – tous
ces processus peuvent varier en nature comme en importance.
1.1.1 Processus cinétiques : nucléation et croissance cristallines
Les processus de solidification majoritairement contrôlés par des effets cinétiques,
dépendent directement du degré de surfusion ("undercooling") du système (e.g. Dowty, 1980a;
Lofgren, 1980). Le paramètre de surfusion correspond à un état de déséquilibre du système qui est
généralement retranscrit en terme de différence ΔT entre température du liquidus et température
réelle du magma (Baronnet, 1984; Bonin, 1998; Brandeis and Jaupart, 1986; Brandeis et al., 1984;
Dowty, 1980a; Lofgren, 1980). Le passage de l’état de liquide silicaté à celui de solide cristallisé
nécessite deux étapes (Bonin, 1998) : la nucléation puis la croissance cristallines.
Nucléation des cristaux
Deux types de nucléation sont communément distingués (Dowty, 1980a; Lofgren, 1980) :
(i) la nucléation homogène, un phénomène spontané induit par des fluctuations thermiques
aléatoires dans le liquide silicaté ; et (ii) la nucléation hétérogène, qui prend naissance à la surface
de particules "étrangères" préexistantes en contact avec le liquide silicaté. Ces particules
étrangères peuvent prendre la forme de grains hôtes, de bulles, de défauts cristallins, d'impuretés,
de parois, etc.
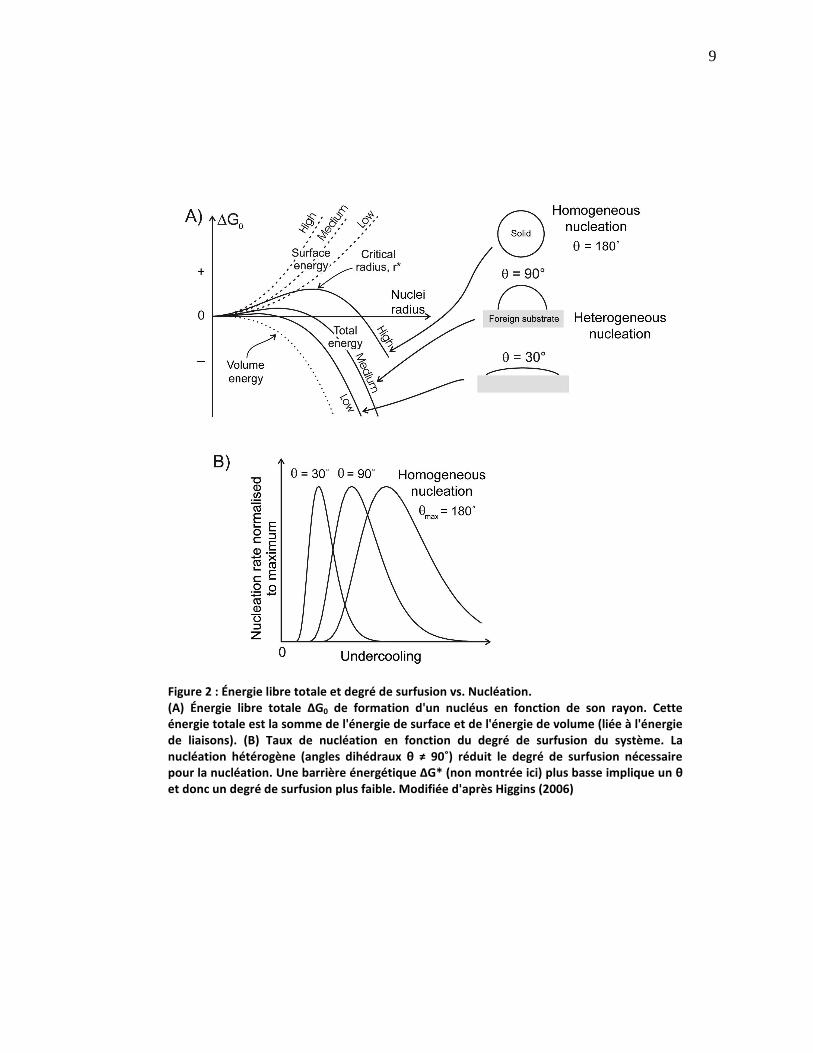
La formation d'un nucléus est directement fonction de l'état énergétique du système
magmatique ; l’état énergétique du système est exprimé par la variation d'énergie libre totale ΔG0
(Fig. 2a). Considérant une particule de rayon r, le maximum est atteint pour ΔG0 = ΔG* et r = r*
7
(Bonin, 1998); ΔG* est appelé l'énergie libre critique (ou énergie d'activation), et r*, le rayon
critique. L'énergie libre totale d'une particule est la somme des énergies de surface et de volume
(elle-même reliée à l'énergie de liaisons), toutes deux ayant un effet énergétique opposé (Tiller,
1991). Dans le cas de la nucléation homogène, il y a formation des nucléi (et début de croissance)
pour ΔG0 ≥ ΔG*, soit pour rnucléi ≥ r* (e.g. Dowty, 1980a). Pour un degré de surfusion trop faible, la
barrière énergétique ΔG* ne peut être franchie. Le rayon critique r* n'est pas atteint. Le taux de
nucléation est alors nul, et aucune nucléation n'est possible. Lorsque le degré de surfusion
augmente, le taux de nucléation augmente également (Fig. 2b).
La nucléation hétérogène est associée à une réduction de l'énergie de surface du nucléus.
Ceci implique une réduction du degré de surfusion nécessaire pour le début de cristallisation, et
donc une diminution du rayon critique et de la barrière énergétique (Dowty, 1980a). Le degré de
surfusion est alors relativement faible, généralement de l'ordre de quelques degrés Celsius (Bonin,
1998). Il est fonction du degré de similarités cristallographiques entre la phase hôte et la nouvelle
phase. Ce degré de similarité est matérialisé par les angles dihédraux θ (Tiller, 1991). Plus les
angles dihédraux sont faibles (θ < 90˚), plus le degré de surfusion nécessaire à la nucléation sera
faible (Fig. 2b). La nucléation hétérogène est donc possible à une température inférieure à la
température de nucléation homogène.
En résumé, la nucléation dépend principalement du taux de refroidissement, de la
surfusion et du temps d'incubation – temps requis pour que la nucléation ait lieu une fois que ΔT >
0 (Lofgren, 1980). Le temps d'incubation influence ainsi le nombre de sites de nucléation produits.
Croissance cristalline et dissolution
8
Il y a croissance des cristaux s'il y a réduction de l'énergie libre totale du système en cours
de cristallisation. De façon similaire, les cristaux peuvent également se dissoudre partiellement ou
totalement si cela induit une réduction de l'énergie totale. Le mécanisme de croissance cristalline
se fait par addition d'atomes ou molécules à la surface du cristal. Le taux d'addition atomique, et
donc le taux de croissance, peut être contrôlé par deux processus de croissance principaux (e.g.
Baronnet, 1984), conduisant à des morphologies différentes (Bonin, 1998) : (i) La croissance
contrôlée par la cinétique d'attachement à l'interface (Dowty, 1980a; Tiller, 1991), ce qui produit
des cristaux idiomorphes ; et (ii) la croissance contrôlée par le transfert de matière et de chaleur
(diffusion et advection), ce qui produit des cristaux aux habitus variés (Lofgren, 1980) et peut par
exemple générer la formation de zonalités.
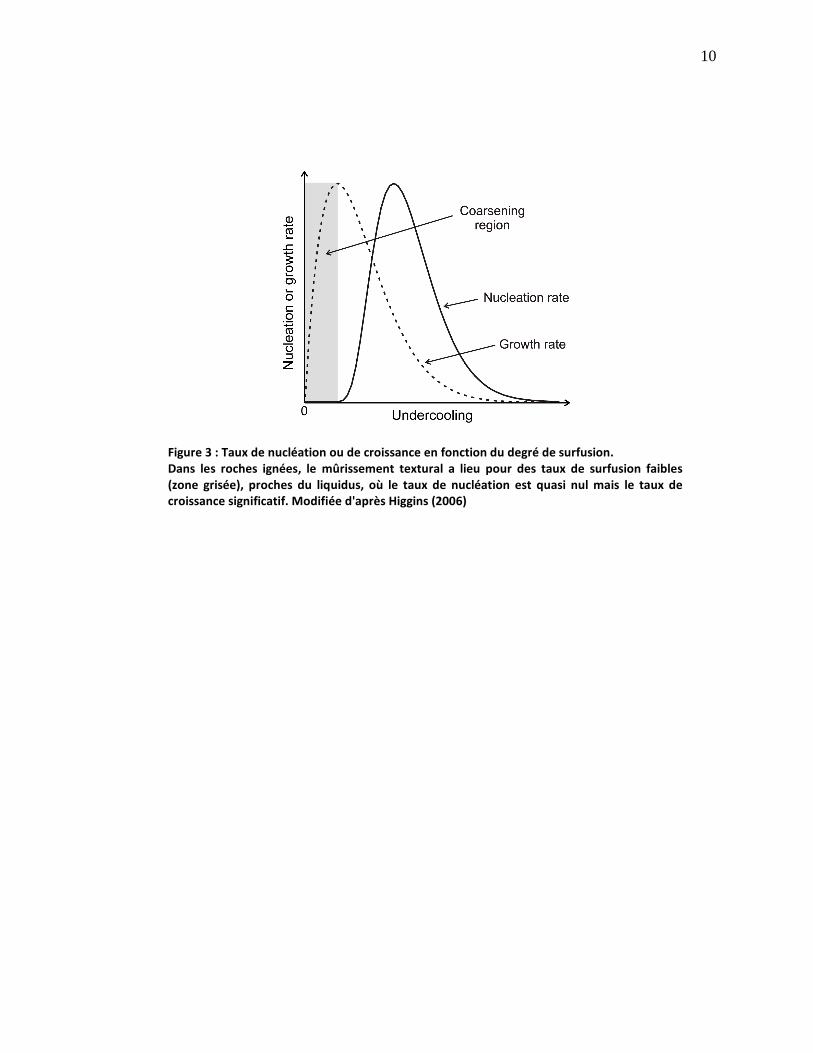
Ces différents types de croissance s'observent pour des surfusions différentes selon la
nature du minéral et sa place dans la séquence de cristallisation (Bonin, 1998). Pour un faible taux
de surfusion, le taux de croissance sera contrôlé par les processus à l'interface. A l'inverse, pour un
degré de surfusion élevé, les processus de transfert de matière et de chaleur deviennent
prépondérants. Le taux de cristallisation, directement relié aux taux de nucléation et de
croissance, est également contrôlé par ce degré de surfusion (Fig. 3 ; zone grisée). Ce taux de
cristallisation est aussi fonction, entre autres, de la composition chimique du magma, donc du
système considéré.
9
Figure 2 : Énergie libre totale et degré de surfusion vs. Nucléation. (A) Énergie libre totale ΔG0 de formation d'un nucléus en fonction de son rayon. Cette énergie totale est la somme de l'énergie de surface et de l'énergie de volume (liée à l'énergie de liaisons). (B) Taux de nucléation en fonction du degré de surfusion du système. La nucléation hétérogène (angles dihédraux θ ≠ 90˚) réduit le degré de surfusion nécessaire pour la nucléation. Une barrière énergétique ΔG* (non montrée ici) plus basse implique un θ et donc un degré de surfusion plus faible. Modifiée d'après Higgins (2006)
10
Figure 3 : Taux de nucléation ou de croissance en fonction du degré de surfusion. Dans les roches ignées, le mûrissement textural a lieu pour des taux de surfusion faibles (zone grisée), proches du liquidus, où le taux de nucléation est quasi nul mais le taux de croissance significatif. Modifiée d'après Higgins (2006)
11
1.1.2 Processus de rééquilibrage : mûrissement textural
Une fois les forces motrices cinétiques réduites, les populations de cristaux entrent en
phase de rééquilibrage (Higgins, 2006). La texture cristalline répond à l'effet du rééquilibrage qui
participe à la minimisation de l'énergie totale du système. Bien que l'équilibre complet ne soit
jamais atteint, il y a homogénéisation de la distribution de la taille des cristaux, phénomène
inexistant lors de processus purement cinétiques.
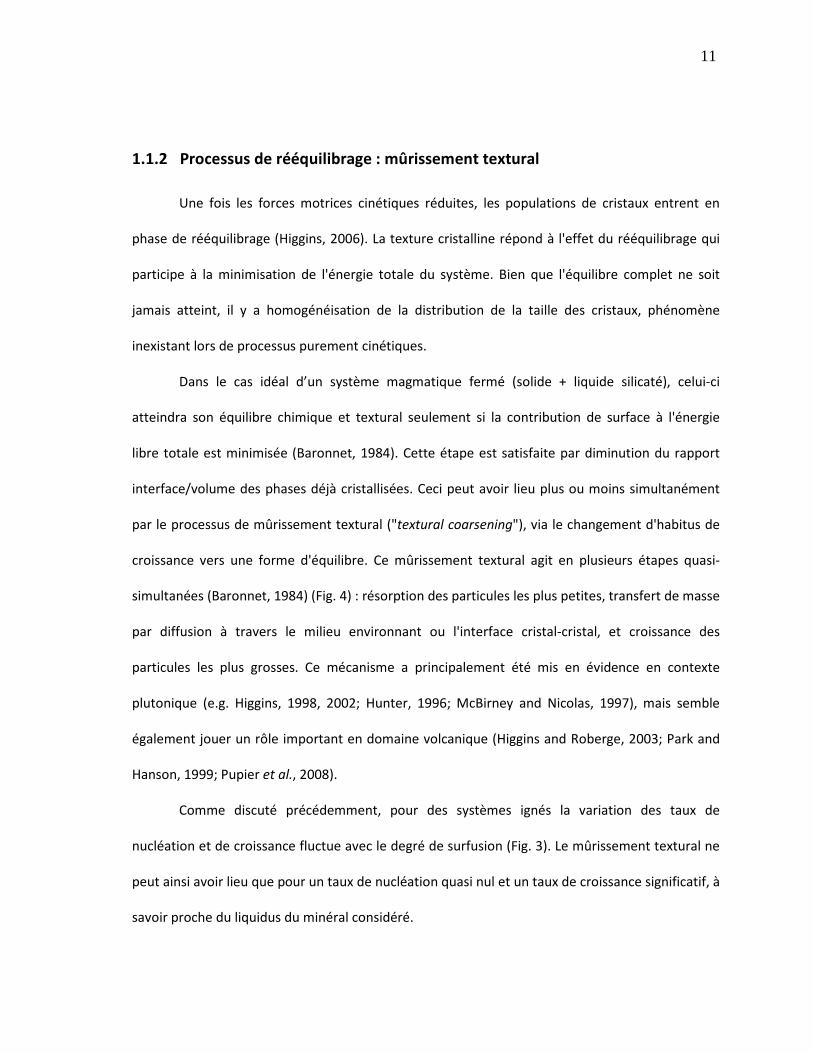
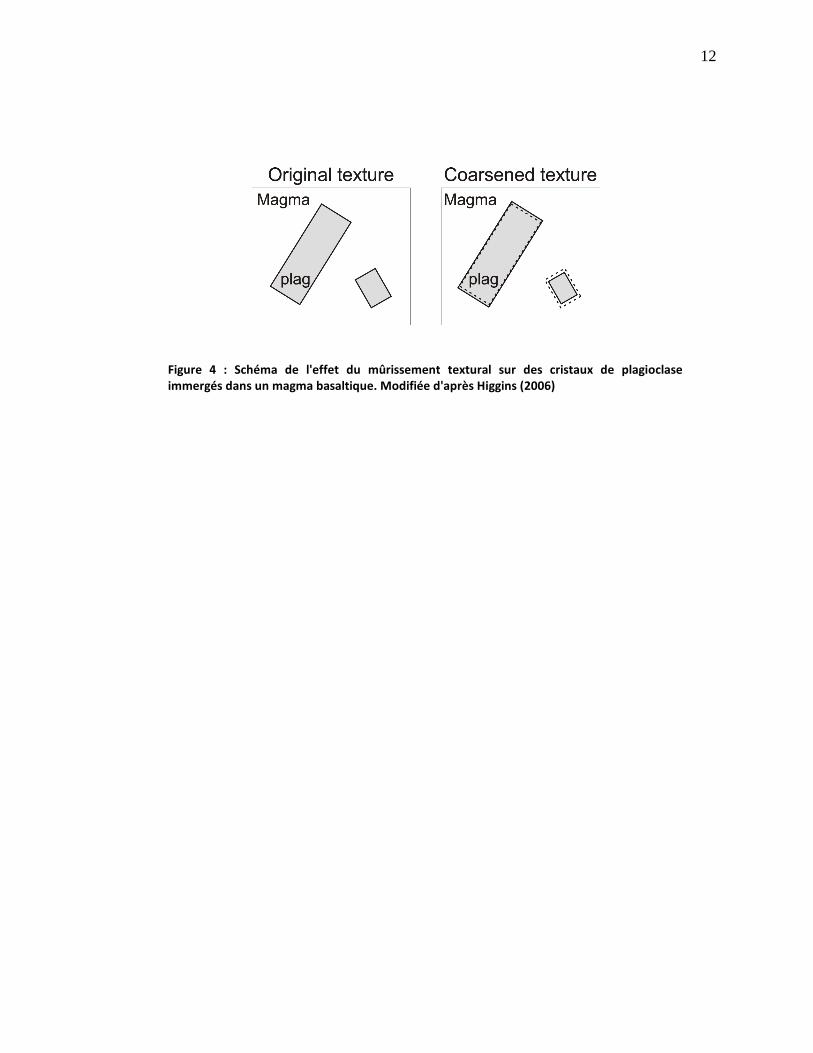
Dans le cas idéal d’un système magmatique fermé (solide + liquide silicaté), celui-ci
atteindra son équilibre chimique et textural seulement si la contribution de surface à l'énergie
libre totale est minimisée (Baronnet, 1984). Cette étape est satisfaite par diminution du rapport
interface/volume des phases déjà cristallisées. Ceci peut avoir lieu plus ou moins simultanément
par le processus de mûrissement textural ("textural coarsening"), via le changement d'habitus de
croissance vers une forme d'équilibre. Ce mûrissement textural agit en plusieurs étapes quasi-
simultanées (Baronnet, 1984) (Fig. 4) : résorption des particules les plus petites, transfert de masse
par diffusion à travers le milieu environnant ou l'interface cristal-cristal, et croissance des
particules les plus grosses. Ce mécanisme a principalement été mis en évidence en contexte
plutonique (e.g. Higgins, 1998, 2002; Hunter, 1996; McBirney and Nicolas, 1997), mais semble
également jouer un rôle important en domaine volcanique (Higgins and Roberge, 2003; Park and
Hanson, 1999; Pupier et al., 2008).
Comme discuté précédemment, pour des systèmes ignés la variation des taux de
nucléation et de croissance fluctue avec le degré de surfusion (Fig. 3). Le mûrissement textural ne
peut ainsi avoir lieu que pour un taux de nucléation quasi nul et un taux de croissance significatif, à
savoir proche du liquidus du minéral considéré.
12
Figure 4 : Schéma de l'effet du mûrissement textural sur des cristaux de plagioclase immergés dans un magma basaltique. Modifiée d'après Higgins (2006)
13
1.1.3 Processus de séparation mécanique entre liquide silicaté et cristaux
Les caractéristiques cristallines comme la taille, la composition, l'orientation, et le nombre
de cristaux, peuvent être modifiées par des processus mécaniques tels que le fractionnement et
l'accumulation de cristaux, la formation de chaînes de cristaux, la compaction, et l'agrégation
(Higgins, 2006). Certains de ces processus interviennent en systèmes fermés dans le sens où la
masse totale du système reste inchangée. D'autres ont lieu en systèmes ouverts lorsqu'il y a
addition/soustraction de cristaux ou de magma.
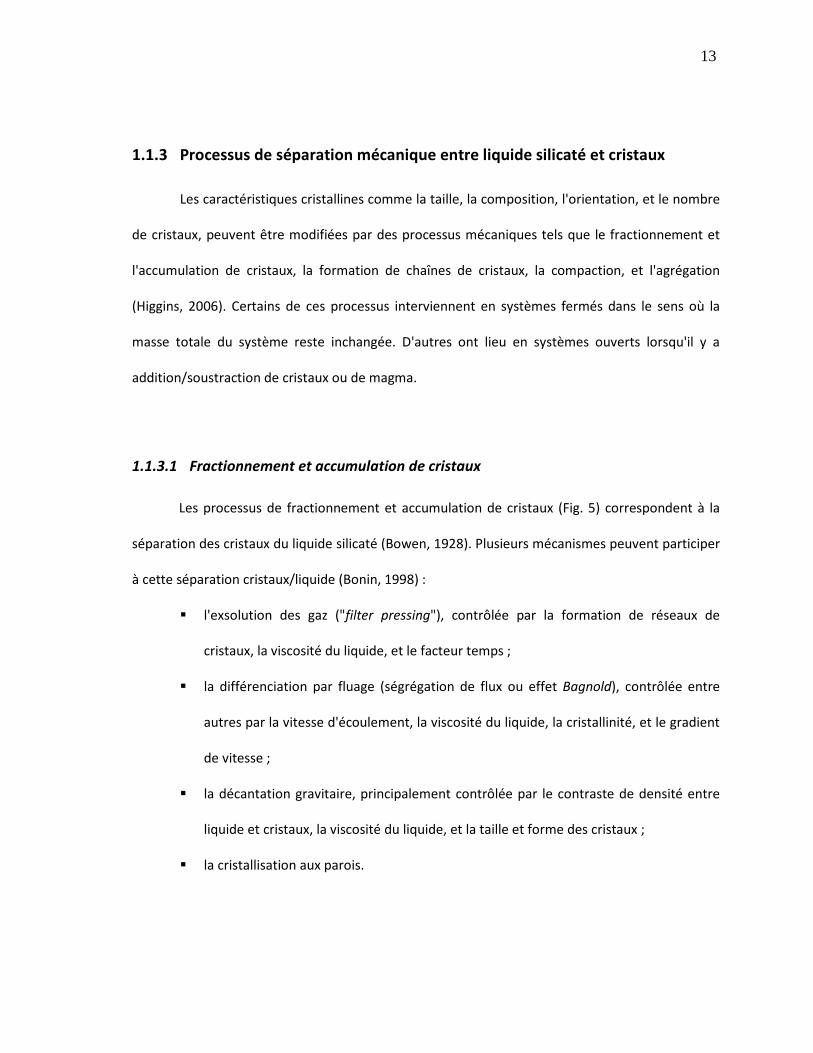
1.1.3.1 Fractionnement et accumulation de cristaux
Les processus de fractionnement et accumulation de cristaux (Fig. 5) correspondent à la
séparation des cristaux du liquide silicaté (Bowen, 1928). Plusieurs mécanismes peuvent participer
à cette séparation cristaux/liquide (Bonin, 1998) :
� l'exsolution des gaz ("filter pressing"), contrôlée par la formation de réseaux de
cristaux, la viscosité du liquide, et le facteur temps ;
� la différenciation par fluage (ségrégation de flux ou effet Bagnold), contrôlée entre
autres par la vitesse d'écoulement, la viscosité du liquide, la cristallinité, et le gradient
de vitesse ;
� la décantation gravitaire, principalement contrôlée par le contraste de densité entre
liquide et cristaux, la viscosité du liquide, et la taille et forme des cristaux ;
� la cristallisation aux parois.
14
Ces mécanismes sont associés à la distribution des phases solides dans le liquide, au niveau des
fronts de solidification supérieur et inférieur du corps magmatique (Marsh, 1996) (Fig. 5). Ils
dépendent aussi de la forme des grains et du comportement rhéologique du liquide silicaté, qui
varie en fonction du degré de solidification (Bonin, 1998).
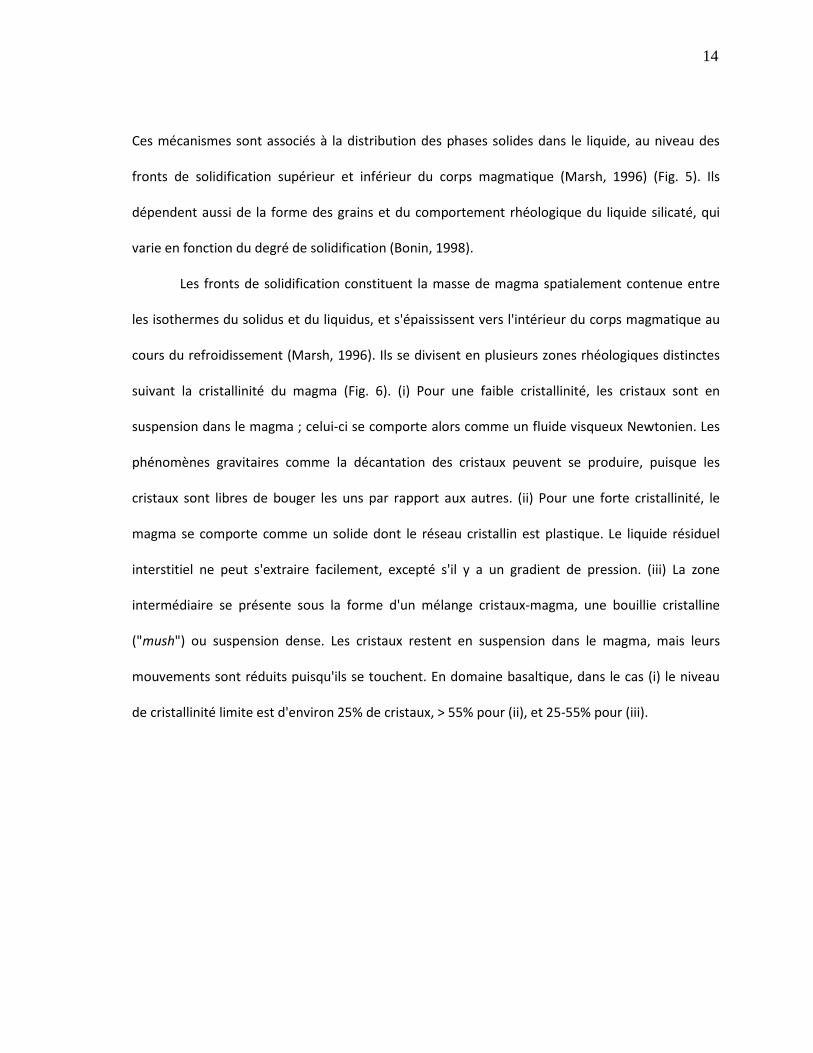
Les fronts de solidification constituent la masse de magma spatialement contenue entre
les isothermes du solidus et du liquidus, et s'épaississent vers l'intérieur du corps magmatique au
cours du refroidissement (Marsh, 1996). Ils se divisent en plusieurs zones rhéologiques distinctes
suivant la cristallinité du magma (Fig. 6). (i) Pour une faible cristallinité, les cristaux sont en
suspension dans le magma ; celui-ci se comporte alors comme un fluide visqueux Newtonien. Les
phénomènes gravitaires comme la décantation des cristaux peuvent se produire, puisque les
cristaux sont libres de bouger les uns par rapport aux autres. (ii) Pour une forte cristallinité, le
magma se comporte comme un solide dont le réseau cristallin est plastique. Le liquide résiduel
interstitiel ne peut s'extraire facilement, excepté s'il y a un gradient de pression. (iii) La zone
intermédiaire se présente sous la forme d'un mélange cristaux-magma, une bouillie cristalline
("mush") ou suspension dense. Les cristaux restent en suspension dans le magma, mais leurs
mouvements sont réduits puisqu'ils se touchent. En domaine basaltique, dans le cas (i) le niveau
de cristallinité limite est d'environ 25% de cristaux, > 55% pour (ii), et 25-55% pour (iii).
15
Figure 5 : Colonne de magma schématique. Ce schéma illustre le fractionnement et l'accumulation de cristaux, ainsi que les fronts de solidification supérieur (front de capture) et inférieur (front d'accumulation). Reproduit de Marsh (1988)
Figure 6 : Accumulation et capture de cristaux au niveau du front de solidification supérieur (front de capture). La limite supérieure du front est définie par le solidus, et la limite inférieure par le liquidus. Reproduit de Marsh (2002)
16
1.1.3.2 Formation de chaînes de cristaux, compaction et agrégation
Compaction et chaînes de cristaux
Le processus de compaction débute par une phase mécanique lors de laquelle un
changement de l'orientation des grains permet un agencement plus dense des grains, par
tassement avec expulsion du fluide interstitiel (Bowen, 1928). Cette compaction mécanique sans
déformation interne des grains est limitée à un maximum (i.e. environ 50%, mais estimation
complexe, fonction de plusieurs paramètres intrinsèques et de l'environnement magmatique
considéré) du fait de la cohésion, ou inertie au changement, du magma (Higgins, 1991; Hunter,
1996; Marsh, 1989). Une compaction plus forte entraînera un changement de forme des grains par
fracturation ou déformation plastique, permettant un tassement plus dense. On parle alors de
compaction par pression-dissolution (Meurer and Boudreau, 1998; Nicolas and Ildefonse, 1996),
un mécanisme de transfert de masse induit par la contrainte. Ce mécanisme est très commun dans
les roches plutoniques et métamorphiques, mais assez marginal en domaine volcanique.
Le passage de l'état de suspension à l'état de bouillie cristalline dans un magma basaltique
a généralement lieu à partir de 25% de cristallisation (Marsh, 1988; Philpotts et al., 1998). La
compaction est alors possible seulement après l'interconnexion des cristaux pour former un
réseau 3-D continu (Philpotts et al., 1998). Un cas typique est celui du plagioclase, initialement de
flottabilité neutre (Scoates, 2000). Cependant, seule l'olivine est communément présente sous
forme de phénocristaux dans les laves du Kilauea, parfois associée à un faible pourcentage de
plagioclase. Par conséquent, une telle compaction par formation de chaînes de cristaux apparaît
comme très peu probable ici, et ne sera pas traitée dans la suite de ce travail.
17
Agrégation et synneusis
Dans la plupart des contextes géologiques, la concentration des grains est suffisamment
forte pour qu'ils interagissent entre eux et s'agglomèrent en amas, particulièrement lors de leur
décantation gravitaire (Schwindinger, 1999). La force contrôlant ce processus est la réduction de
l'énergie totale interfaciale des grains (e.g. Baronnet, 1984; Herring, 1951; Schwindinger and
Anderson, 1989). Ces amas se comportent comme un grain unique plus dense, et sédimentent
donc plus vite que chacun des grains originaux. La vitesse de refroidissement élevée dans les
roches volcaniques permet de préserver les agrégats, ce qui paraît moins commun dans le cas de
roches cumulatives plutoniques (Higgins, 2006). Dans certains agrégats, les cristaux idiomorphes
peuvent s'assembler le long de leurs faces cristallographiques. Ce phénomène, communément
appelé synneusis (Vance, 1969; Vance and Gilreath, 1967), a été en particulier mis en évidence
pour les cristaux d'olivine de l'éruption de 1959 du Kilauea Iki (Schwindinger, 1999; Schwindinger
and Anderson, 1989). L'ensemble de la structure ressemble à un cristal maclé, mais sans en avoir
les propriétés cristallines (Dowty, 1980b).
1.1.4 Autres processus
1.1.4.1 Convection/advection
Il y a convection dans un corps magmatique lorsque la force d’entraînement est
suffisamment élevée pour dépasser la résistance liée à la viscosité et la diffusivité thermique (e.g.
Bartlett, 1969; Jaupart and Parsons, 1985; Shaw, 1965). Le critère de convection est alors donné
par le nombre sans dimension de Rayleigh qui dépend principalement de la viscosité, diffusivité

18
thermique, température du liquide, et de l'épaisseur du corps magmatique (e.g. Brandeis and
Jaupart, 1986; Turner and Campbell, 1986). Il y a convection pour un nombre de Rayleigh
supérieur à la valeur critique (variable suivant les conditions), et simple conduction pour un
nombre de Rayleigh inférieur à cette valeur.
Deux types de convection peuvent intervenir lors de la solidification d'une chambre
magmatique ou d'un lac de lave basaltiques (Brandeis and Jaupart, 1986; Martin et al., 1987) : (1)
la convection compositionnelle, contrôlée par les contrastes de densité dus à la cristallisation
fractionnée et/ou à l'exsolution des gaz (Chen and Turner, 1980; Huppert and Sparks, 1984; Turner
and Campbell, 1986; Wright and Okamura, 1977) ; et (2) la convection thermique, contrôlée par
les contrastes de température. Les mouvements convectifs peuvent se matérialiser sous la forme
de panaches verticaux partiellement cristallisés, constitués de la bouillie cristalline formant les
fronts de solidification (e.g. Bartlett, 1969; Marsh, 1988, 1996; Philpotts and Dickson, 2000). Ces
panaches verticaux sont susceptibles d'entraîner la compaction, ainsi que la migration de liquides
résiduels interstitiels sous la forme de veines de ségrégation par exemple.
1.1.4.2 Mélange de magmas
Le mélange de magmas est un processus très commun ; de nombreuses évidences existent
autant en domaine plutonique que volcanique. Deux types de mélange peuvent être distingués :
(1) le mélange complet ("mixing"), correspondant à l'extrême limite du processus dont le résultat
est un produit chimiquement homogène ; et (2) le mélange "mécanique" ("mingling"),
correspondant à un processus moins extrême où les deux composants peuvent être reconnus par
19
la pétrographie et/ou la chimie. Il s'agit en fait d'un problème d'échelle de mélange, en
considérant tous les intermédiaires possibles entre l'absence de mélange et le mélange parfait.
Les différents processus décrits dans cette section 1.1. sont généralement pris en
considération pour l’élaboration de modèles de solidification des magmas basaltiques que je traite
maintenant.
1.2 Modèles de solidification des magmas basaltiques
De nombreux modèles de solidification magmatique existent, mais la majorité est basée
sur l'expérimentation en laboratoire (e.g. Brandeis and Jaupart, 1986, 1987; Brandeis and Marsh,
1989; Huppert and Worster, 1985; Jaupart and Tait, 1995; Kerr et al., 1989; Worster et al., 1993), à
partir de matériaux de synthèse (systèmes binaires) ou naturels (e.g. basaltes tholéiitiques), et sur
la modélisation numérique (e.g. Hort, 1997; Jaupart and Tait, 1995; Jellinek and Kerr, 2001;
Mangan and Marsh, 1992; Marsh, 1988, 1989, 1996; Rupke and Hort, 2004). Dans ce travail de
doctorat, nous avons distingué : (1) la solidification en système ouvert à relativement faible
profondeur dans une chambre magmatique sommitale ; et (2) la solidification en système fermé
en sub-surface dans un lac de lave.
1.2.1 Solidification en profondeur dans une chambre magmatique
Il est communément admis que le refroidissement d'une chambre magmatique implique
les effets combinés de la convection et de la cristallisation fractionnée (Brandeis and Jaupart,
20
1986). Les travaux expérimentaux de Brandeis and Jaupart (1986) sur les chambres magmatiques
de rapports de forme élevés (effets de bordure négligeables) montrent que, pour une faible
viscosité typique de magmas basaltiques très fluides, la convection intervient avant le début de la
cristallisation. Le temps de croissance des cristaux est trop court pour permettre une décantation
(ou sédimentation) gravitaire significative. Aucun contraste de composition ne peut se développer.
Pour des viscosités plus fortes typiques de magmas moins mafiques, des instabilités thermiques se
développent dans un magma partiellement cristallisé, expliquant la génération de panaches
verticaux chargés en cristaux. Cependant, ce dernier cas ne sera pas traité ici, puisqu’il concerne
des magmas plus évolués.
La plupart des études sur les lacs de lave naturels supposent qu'ils se comportent comme
de petites chambres magmatiques, à partir du moment où une croûte superficielle s'est formée.
Par conséquent, il est possible d'appliquer, dans une certaine limite, les conclusions acquises sur
l'étude des lacs de lave aux chambres magmatiques, pour mieux comprendre leur mode de
solidification. La présente section n'est donc pas développée davantage, au profit de la suivante
sur la solidification dans les lacs de lave.
1.2.2 Solidification en sub-surface dans un lac de lave
L'étude de la solidification des lacs de lave a été l'objet de nombreux travaux, autant basés
sur l'expérimentation que sur des échantillons naturels ; ces deux approches sont souvent
combinées à la modélisation numérique.
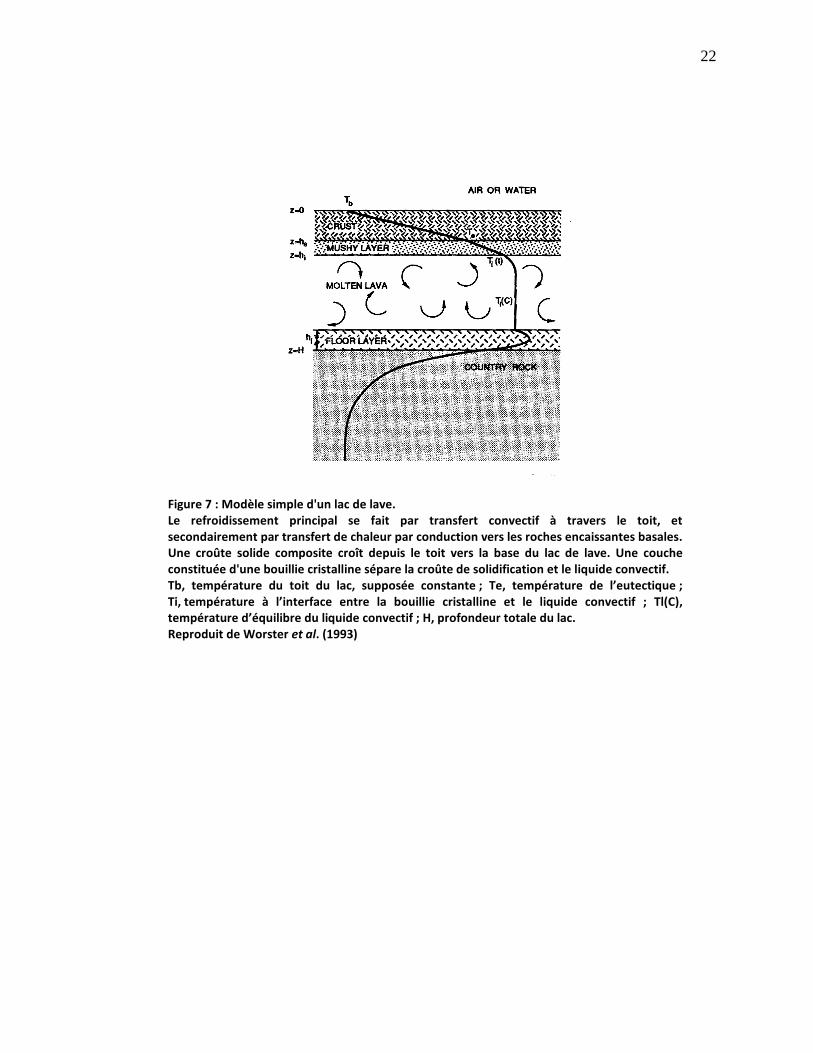
Worster et al. (1993) ont montré expérimentalement que la convection thermique,
uniquement contrôlée par la surfusion de solidification, peut produire des variations
21
compositionnelles et texturales dans un corps lavique initialement uniforme (Fig. 7). Ceci est
principalement valable dans le cas d'un refroidissement par le toit du corps lavique. Les
mouvements convectifs réduisent le temps de solidification complète, et entraînent la
cristallisation secondaire du liquide silicaté dans des régions éloignées des fronts de solidification.
Ces travaux mettent en évidence l'effet de la viscosité et du dégazage (exsolution des gaz) sur
l'histoire de la solidification.
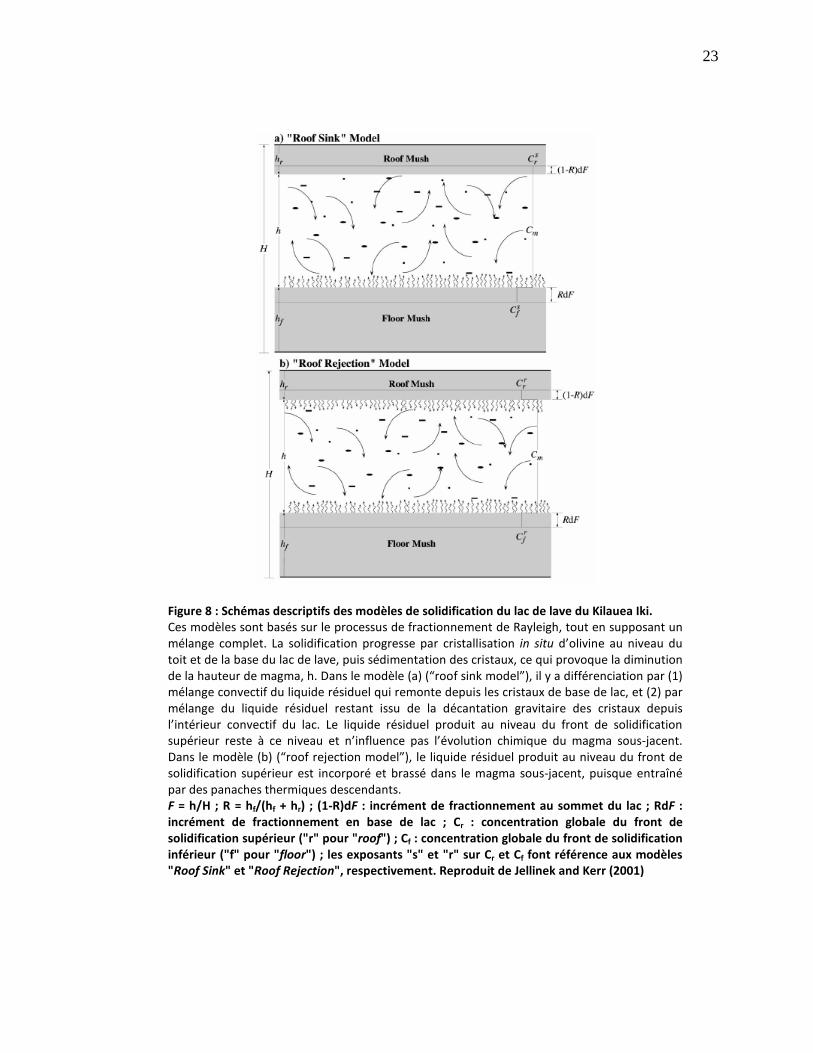
Jellinek and Kerr (2001) suggèrent, via une modélisation numérique basée sur des
échantillons naturels, que les forts taux de refroidissement au toit et à la base du lac de lave
Kilauea Iki aboutissent à des contrastes thermiques et compositionnels, ainsi qu'à des variations
dans la vésicularité et la cristallinité (variation de la quantité d’olivine par exemple). Les auteurs
proposent que tout ceci engendre des mouvements convectifs chaotiques et vigoureux qui agitent
le magma (Fig. 8), produisant un mélange thermique et chimique imparfait mais efficace sur
presque toute l'histoire de solidification du lac de lave. Cet aspect dynamique de la solidification
du Kilauea Iki est en désaccord avec les conclusions de Helz (1989) qui considère que les transferts
diapiriques de matériel du toit vers la base du lac ont lieu sans mélange. À l'inverse, la vision de
Jellinek and Kerr (2001) du mélange induit par la convection est en accord avec le modèle
dynamique de Worster et al. (1993).
De plus, la comparaison entre la modélisation numérique et les données acquises sur les
lacs de lave hawaiiens, montre que le refroidissement par les parois latérales a un impact
significatif sur la solidification des lacs de lave (Rupke and Hort, 2004).
22
Figure 7 : Modèle simple d'un lac de lave. Le refroidissement principal se fait par transfert convectif à travers le toit, et secondairement par transfert de chaleur par conduction vers les roches encaissantes basales. Une croûte solide composite croît depuis le toit vers la base du lac de lave. Une couche constituée d'une bouillie cristalline sépare la croûte de solidification et le liquide convectif. Tb, température du toit du lac, supposée constante ; Te, température de l’eutectique ; Ti, température à l’interface entre la bouillie cristalline et le liquide convectif ; Tl(C), température d’équilibre du liquide convectif ; H, profondeur totale du lac. Reproduit de Worster et al. (1993)
23
Figure 8 : Schémas descriptifs des modèles de solidification du lac de lave du Kilauea Iki. Ces modèles sont basés sur le processus de fractionnement de Rayleigh, tout en supposant un mélange complet. La solidification progresse par cristallisation in situ d’olivine au niveau du toit et de la base du lac de lave, puis sédimentation des cristaux, ce qui provoque la diminution de la hauteur de magma, h. Dans le modèle (a) (“roof sink model”), il y a différenciation par (1) mélange convectif du liquide résiduel qui remonte depuis les cristaux de base de lac, et (2) par mélange du liquide résiduel restant issu de la décantation gravitaire des cristaux depuis l’intérieur convectif du lac. Le liquide résiduel produit au niveau du front de solidification supérieur reste à ce niveau et n’influence pas l’évolution chimique du magma sous-jacent. Dans le modèle (b) (“roof rejection model”), le liquide résiduel produit au niveau du front de solidification supérieur est incorporé et brassé dans le magma sous-jacent, puisque entraîné par des panaches thermiques descendants. F = h/H ; R = hf/(hf + hr) ; (1-R)dF : incrément de fractionnement au sommet du lac ; RdF : incrément de fractionnement en base de lac ; Cr : concentration globale du front de solidification supérieur ("r" pour "roof") ; Cf : concentration globale du front de solidification inférieur ("f" pour "floor") ; les exposants "s" et "r" sur Cr et Cf font référence aux modèles "Roof Sink" et "Roof Rejection", respectivement. Reproduit de Jellinek and Kerr (2001)
24
À partir de la modélisation numérique, certains auteurs ont mis en évidence plusieurs
processus de solidification des lacs de lave hawaiiens (Jellinek and Kerr, 2001; Marsh, 1988;
Moore and Evans, 1967). Par souci de simplification et de clarté, ces processus ne sont pas décrits
en détail mais simplement listés ci-dessous :
� Mouvements de convection par entraînement vertical d’un panache, à la fois vers la
base et le toit du lac de lave ;
� Stratification compositionnelle mineure au toit, et stratification thermique à la base
du lac de lave, toutes deux causées par le mélange incomplet dû à la convection ;
� Nucléation, croissance et sédimentation gravitaire des cristaux d'olivine ;
� Flux ascendant de magma évolué (veines de ségrégation) dû à la convection de
liquides interstitiels dans la bouillie cristalline ;
� Perte de chaleur accentuée par l'infiltration hydrothermale au niveau du toit et de la
base du lac.
A défaut d’être exhaustive, cette liste synthétique apporte quelques informations utiles, parfois
quantitatives, sur les processus de solidification qu’il est bon de prendre en considération en tant
que base de travail dans cette thèse. Cette liste n’est cependant pas directement applicable en
totalité dans le cadre d’une telle étude en milieu naturel que représente cette thèse ; certains de
ces processus ne sont pas quantifiables ni même détectables par le biais de l’analyse texturale ou
géochimique.
D’un intérêt certains pour cette thèse, les études précédentes en milieu naturel apportent
une information complémentaire très utile comme base à ce travail. Ainsi, les études en systèmes
naturels de certains lacs de lave du Kilauea (Kilauea Iki, picritique ; Makaopuhi, basaltique
tholéiitique) ont mis en évidence les processus de solidification suivants :
25
� Redistribution des phénocristaux (d'olivine principalement) par
décantation/sédimentation gravitaire (Cashman and Marsh, 1988; Helz, 1987a; Wright
and Okamura, 1977) ;
� Migration et perte des bulles de gaz (vésicules) par dégazage du magma (Helz, 1987a) ;
� Différenciation du magma par redistribution des olivines, augites et plagioclases lors
de la convection (Cashman and Marsh, 1988; Helz, 1987a) ;
� Formation de veines pauvres en olivine par ségrégation de liquides interstitiels
résiduels (Cashman and Marsh, 1988; Helz, 1987a; Jellinek and Kerr, 2001; Richter and
Moore, 1966; Wright and Okamura, 1977) ;
� Mélange de magmas (Helz, 1987b).
Cette liste n’est pas exhaustive non plus, mais elle recense les principaux processus de
solidification observables et parfois quantifiables par l’étude en milieu naturel des textures et des
compositions chimiques.
L’ensemble des modèles proposés dans la littérature, et synthétisés ici, ne tient pas
compte de la présence de cristaux déformés et leur influence sur le mode de solidification. Dans
cette thèse, l’emphase est portée sur l’olivine puisqu’il s’agit du minéral le plus commun dans les
magmas basaltiques, et le plus précoce dans la séquence de cristallisation.
1.3 Déformation des olivines
La présence d'olivines déformées est commune dans les roches mantelliques et
plutoniques, mais rare en contexte volcanique. Les cas connus d'olivine volcanique déformée se
26
trouvent principalement dans les laves d'Hawaii, pour les volcans Mauna Kea et Kilauea (e.g.
Clague and Denlinger, 1994; Clague et al., 1995; Yang et al., 1994), et dans les laves du Piton de la
Fournaise, à La Réunion (Albarede et al., 1997; Albarede and Tamagnan, 1988; Boivin and
Bachelery, 2009; Famin et al., 2009; Welsch et al., 2009). Ces cristaux déformés proviennent en
très grande majorité (voire en totalité) de cumulats magmatiques formés au sein même de
l’édifice volcanique. Il s'agit donc ici de déformation magmatique.
La déformation magmatique des cristaux d'olivine peut être considérée comme un
processus spécifique de la solidification des magmas basaltiques. De nombreuses études
expérimentales ont été menées dans le but de démontrer l'influence de la déformation plastique
des olivines sur la rhéologie du manteau (e.g. Langdon, 1985; Li et al., 2004; Li et al., 2006;
Mercier, 1985; Raleigh, 1968; Raterron et al., 2004). La raison principale en est qu'une meilleure
compréhension du fluage plastique dans le manteau est essentielle dans la formation et le
raffinement des modèles expliquant les processus géodynamiques et les propriétés géophysiques
ou rhéologiques du manteau terrestre (le manteau supérieur en particulier) (e.g. Mercier, 1985).
La déformation des roches est influencée par de nombreux facteurs intrinsèques et
extrinsèques (Hobbs, 1985) ; certains contrôlent la forme, l'orientation et la distribution des
grains, et donc laissent une empreinte sur les microfabriques. La température est un paramètre
important influençant la déformation. Plusieurs études basées sur l'expérimentation à des
pressions et températures variées, ont proposé des équations constitutives pour décrire les
mécanismes de dislocations intervenant dans les cristaux d'olivine, en tenant compte de toute une
gamme de conditions thermodynamiques, thermochimiques et microstructurales (Bai and
Kohlstedt, 1992; Bai et al., 1991; Demouchy et al., 2009; Durham and Goetze, 1977; Evans and
Goetze, 1979; Kohlsted and Goetze, 1974; Li et al., 2004; Raterron et al., 2004).
27
La déformation des olivines est maintenant connue en contexte volcanique. Cependant, ce
processus demeure mal contraint, bien que la présence d'olivines déformées dans certaines
roches volcaniques soit fréquente et que leur importance dans l'histoire magmatique d'édifices
volcaniques tel le Kilauea soit parfaitement reconnue. Certes encore considérée comme une
curiosité par certains, la déformation des olivines dans un tel contexte volcanique apparaît comme
un point à ne pas négliger pour une bonne compréhension du système magmatique dans son
ensemble, et de la solidification des magmas basaltiques en particulier.
Dans un tel contexte volcanique, la présence, la formation et l’histoire de solidification des
cristaux déformés d’olivine sont des thématiques clés. L’étude de ces cristaux déformés est d’un
grand intérêt pour l’évaluation de l’origine des différentes populations de cristaux présentes dans
le système magmatique. Les cristaux déformés peuvent être de composition chimique similaire à
celle des cristaux non déformés, mais traduisent une histoire de solidification plus complexe
(Albarede et al., 1997; Bureau et al., 1998; Garcia, 1996). Dans la plupart des études antérieures,
l’observation au microscope optique était le seul moyen de distinguer les cristaux déformés des
cristaux non déformés.
En contexte volcanique, il n'y a pas de lien direct, voire aucun lien du tout, avec les
thématiques de fluage du manteau. Les approches, techniques et interprétations classiques
appliquées aux problèmes mantelliques ne sont pas envisageables ici. De plus, très peu de
données existent concernant la déformation magmatique de l'olivine ; ce manque doit être
comblé. La quantification de la déformation de l’olivine par micro-diffraction des rayons X peut
aider à la reconnaissance de l’origine des olivines déformées en contexte volcanique. Idéalement,
cette technique pourrait permettre de contraindre la pression (donc la profondeur), la
température et le type de déformation (i.e. type de mécanisme de dislocation par exemple) de
28
l’olivine. L’étude de la déformation de l’olivine apporte également un moyen supplémentaire de
discriminer les différentes populations d’olivine, tout comme la taille et la forme (i.e. idiomorphe
vs. xénomorphe), et se mesure sur toutes tailles de grains, y compris les petits grains pour lesquels
aucune évidence de déformation ne peut être reconnue optiquement. L’analyse in situ par micro-
diffraction des rayons X est une technique récente, et peu de données quantitatives existent,
limitant la mise en comparaison de nos données. Les études précédentes utilisant cette même
technique ont examiné le quartz (Flemming, 2007), le zircon (Moser et al., 2009), l’orthopyroxène
(Izawa et al., 2009, in review), le diamant (Smith et al., 2010), et l’olivine de météorites
(McCausland et al., 2010) ; aucune étude n’a examiné l’olivine terrestre. Par ailleurs, la
caractérisation in situ basée sur la diffraction a été utilisée pour l’étude d’autres types de roches
ou minéraux : des roches métamorphiques de ultra haute pression et les minéraux de coésite et
quartz associés, par exemple (Ikuta et al., 2007). D’autres techniques existent également pour
l’étude de la microstructure cristalline et caractérisation de la déformation, telle que l’approche
par diffraction Laue qui utilise le synchrotron comme source de rayons X (Ice et al., 2006; Ice et al.,
2005).
Tout ceci a directement motivé l'intégration de la déformation des olivines dans les laves
du Kilauea en tant que Chapitre 3 de ce travail de doctorat.
1.4 Synthèse
L’étude et la quantification de la solidification des magmas basaltiques sont cruciales pour
une meilleure compréhension de notre planète en général, et du fonctionnement des systèmes
29
magmatiques basaltiques en particulier. La multitude et la diversité des travaux ne permettent pas
vraiment de trouver un consensus qui rendrait compte à la fois des données expérimentales et de
modélisation numérique, mais surtout des données correspondant aux systèmes basaltiques
naturels. Le problème majeur de ce type d'études sur la solidification magmatique réside bien
dans la représentativité et la cohérence des résultats appliqués aux milieux naturels.
Peu d'études proposent une réelle quantification, en fonction du type d'environnement
magmatique, de la plupart des processus physiques mis en jeu. On peut donc se demander si les
modèles proposés jusqu'à présent s'appliquent tous en domaine volcanique, et s'ils sont
suffisamment généraux pour être étendus aux différents environnements de solidification des
magmas basaltiques.
L’olivine est certes un minéral très commun et généralement abondant dans les basaltes,
mais il se retrouve ici aussi sous la forme de cristaux déformés, d'origine magmatique. Ce point
constitue clairement un autre aspect crucial de l'étude, la présence d'olivines déformées étant
généralement une particularité des roches mantelliques et plutoniques, mais beaucoup plus rare
en contexte volcanique.
2 Objectifs
L'objectif principal de ce travail de doctorat est de déterminer et quantifier par une
approche double alliant texture et géochimie, les principaux processus de solidification à l'oeuvre
en contexte volcanique, i.e. le volcan Kilauea, Hawaii. L'analyse structurale des cristaux d'olivine
déformés s'insère dans l'optique générale d'une meilleure compréhension de la déformation et du
système magmatique hôte. Cette approche double est appliquée ici à la fois en système ouvert et
30
en système fermé, dans un but comparatif. Différents environnements de solidification sont
représentés par les échantillons suivants : (i) en système ouvert, des échantillons de lave
provenant de différentes coulées issues de l'éruption de 1969-1974 du Mauna Ulu ; et (ii) en
système fermé, des échantillons de lave provenant du lac de lave du Kilauea Iki, né de l'éruption
sommitale de 1959.
Le corollaire de cet objectif est d’analyser en milieu naturel les différents modèles de
solidification magmatique présentés dans la problématique. Il s'agira ensuite d'élaborer de
nouveaux modèles pour les magmas basaltiques, directement appliqués au milieu naturel : un
premier modèle appliqué à des processus crustaux (0-12 km) qui ont lieu en système ouvert dans
tout le système magmatique sous-édifice ; et un second modèle appliqué à des processus de
surface qui ont lieu en système fermé à l'intérieur du lac de lave.
Plus spécifiquement, il s'agit de reconnaître l'influence des processus cités ci-dessous lors
de la solidification magmatique, en analysant leur(s) effet(s) sur la texture et la chimie de l'olivine,
et éventuellement la chimie en roche totale. L’analyse proposée prend la forme d'une
comparaison entre modèles théoriques et réponses réelles en milieux naturels. Ce mode
comparatif est particulièrement utile pour évaluer l'influence des différents processus sur la
texture. Les principaux processus de solidification étudiés ici sont :
o La nucléation et croissance cristallines ;
o L'agrégation de cristaux ;
o Le mûrissement textural ;
o La séparation mécanique entre liquide silicaté et cristaux (e.g. la sédimentation
gravitaire des cristaux) ;
o Le mélange de cristaux ou magmas ;
31
o La convection/advection ;
o La déformation des cristaux.
Un autre objectif est de proposer un modèle de transfert des magmas à travers la
tuyauterie du Kilauea et à l'origine de l'éruption de 1969-1974 du Mauna Ulu. Ce modèle est censé
s'appliquer sur toute l'épaisseur de l'édifice (i.e. 0-12 km de profondeur), et concerne uniquement
le centre et toute la partie Est du Kilauea (East Rift Zone). Il permettra de mieux comprendre
comment fonctionne le système magmatique du Kilauea lors d’éruptions latérales volumineuses.
Finalement, un dernier objectif de ce travail de doctorat est d’évaluer plus en détail le
processus de déformation magmatique des cristaux d'olivine et son influence sur la structure
interne du cristal, par une analyse structurale in situ via la micro-diffraction des rayons X. Il
s'agit de :
(i) Quantifier la déformation de l’olivine en contexte volcanique par l’utilisation du
paramètre FWHM (Full Width at Half Maximum), ce qui revient à mesurer la
déformation dans des cristaux d’olivine orientés aléatoirement en tant
qu’indicateur de la contrainte moyenne (ou maximale) ;
(ii) Valider l’approche analytique par micro-diffraction des rayons X, et donc ;
(iii) Reconnaître clairement la présence de déformation dans les cristaux d’olivine,
même petits ;
(iv) Quantifier la réponse cristalline à la déformation pour différents plans
cristallographiques ;
(v) Reconstruire les conditions de déformation initialement présente avant la
formation de sous-grains.
32
Cette approche est supposée être facile à mettre à œuvre sur une large gamme de roches
comportant de l’olivine. A termes, la communauté scientifique pourra disposer de valeurs
références comme les données FWHM recueillies sur des olivines dont l’origine est bien connue.
Une méthodologie complète est proposée dans la section suivante afin de répondre à ces
différents objectifs.
3 Méthodologie
Ce travail de doctorat est basé sur l'étude de systèmes naturels basaltiques. Des carottes
de forage du lac de lave du Kilauea Iki, Hawaii, et des échantillons de laves collectés sur le terrain,
constituent les matériaux de base.
La variété et la grande quantité des laves émises par le Kilauea font de ce volcan actif un
site d'étude privilégié. De plus, son activité historique, puisque très bien documentée, fournit une
excellente opportunité de contraindre les processus de solidification mis en jeu au niveau du
réservoir magmatique sommital, des lacs de lave, et de certaines coulées de lave. Le Kilauea
bénéficie également d'un archivage important et facile d'accès de carottes de lave provenant des
différents forages de certains lacs de lave en cours de refroidissement, tel que le Kilauea Iki.
L’étude des coulées de lave comme celles produites par l’éruption de 1969-1974 du
Mauna Ulu (Fig. 9a-b), permet de mieux comprendre les processus actifs de solidification dans
tout le système magmatique superficiel (la "tuyauterie") de l’édifice. Pour simplifier, nous pouvons
affirmer que la plupart des processus de solidification pré-éruption ont lieu au niveau du réservoir
magmatique sommital. Le lien entre échantillons de lave et solidification dans cette tuyauterie
33
s’applique principalement dans le cas d’échantillons à matrice vitreuse, témoignant d’un
refroidissement très rapide (trempe). L’information texturale acquise avant l’éruption est donc
préservée. Les échantillons de lave à matrice microlitique, témoignant d’un refroidissement un
peu plus lent, sont aussi considérés en première approximation comme représentatifs des
processus pré-éruption.
Il est aussi question ici de mieux comprendre la solidification en système fermé en sub-
surface à travers l’étude des lacs de lave du Kilauea, tel que le Kilauea Iki (Fig. 9c). Ces lacs de lave
sont formés par le remplissage de pit craters préexistants lors d'éruptions sommitales ou latérales
(Wright and Okamura, 1977). Ils peuvent constituer de bons analogues des chambres
magmatiques basaltiques quant à leur mode de solidification, particulièrement pour les premiers
stades du processus. Le Kilauea Iki est privilégié dans ce travail puisqu’il est très étudié depuis
plusieurs décennies, et qu’il est facilement accessible aujourd’hui. Une brève étude de la
distribution de la taille des cristaux (CSD) sur les téphras de cette éruption de 1959 a été publiée
(Mangan, 1990), mais le lac de lave lui-même n'a pas été étudié en utilisant cette approche
texturale quantitative.
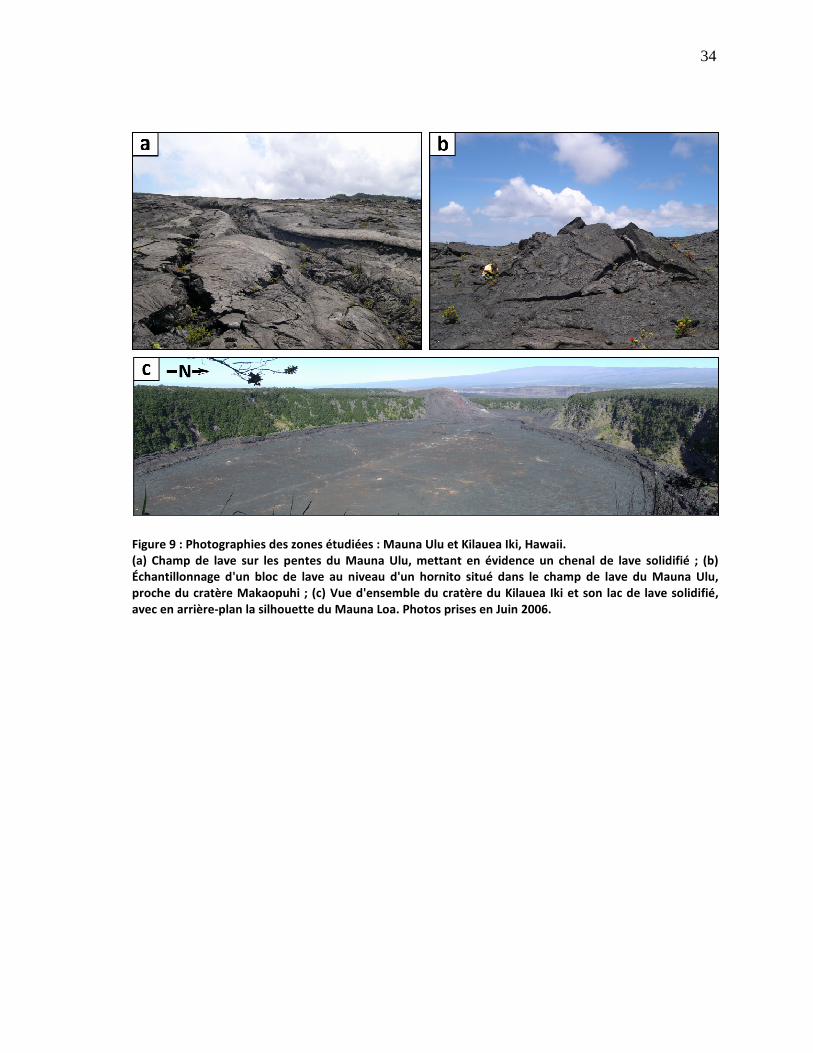
34
Figure 9 : Photographies des zones étudiées : Mauna Ulu et Kilauea Iki, Hawaii. (a) Champ de lave sur les pentes du Mauna Ulu, mettant en évidence un chenal de lave solidifié ; (b) Échantillonnage d'un bloc de lave au niveau d'un hornito situé dans le champ de lave du Mauna Ulu, proche du cratère Makaopuhi ; (c) Vue d'ensemble du cratère du Kilauea Iki et son lac de lave solidifié, avec en arrière-plan la silhouette du Mauna Loa. Photos prises en Juin 2006.
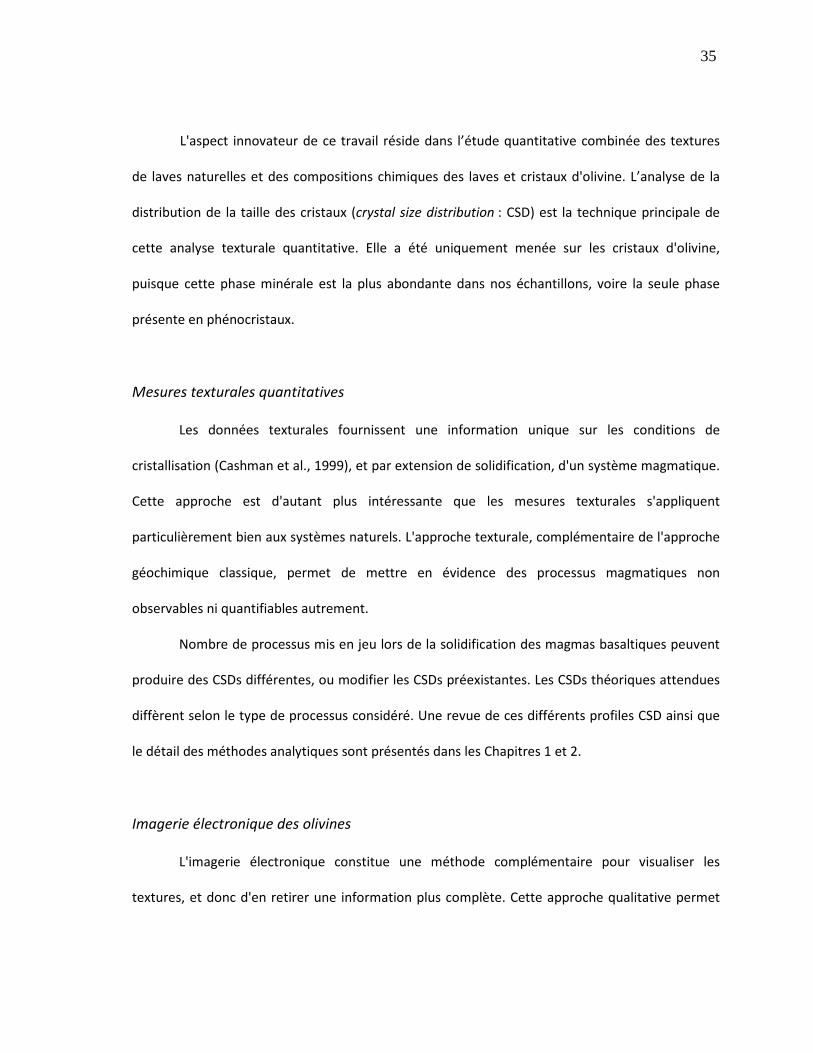
35
L'aspect innovateur de ce travail réside dans l’étude quantitative combinée des textures
de laves naturelles et des compositions chimiques des laves et cristaux d'olivine. L’analyse de la
distribution de la taille des cristaux (crystal size distribution : CSD) est la technique principale de
cette analyse texturale quantitative. Elle a été uniquement menée sur les cristaux d'olivine,
puisque cette phase minérale est la plus abondante dans nos échantillons, voire la seule phase
présente en phénocristaux.
Mesures texturales quantitatives
Les données texturales fournissent une information unique sur les conditions de
cristallisation (Cashman et al., 1999), et par extension de solidification, d'un système magmatique.
Cette approche est d'autant plus intéressante que les mesures texturales s'appliquent
particulièrement bien aux systèmes naturels. L'approche texturale, complémentaire de l'approche
géochimique classique, permet de mettre en évidence des processus magmatiques non
observables ni quantifiables autrement.
Nombre de processus mis en jeu lors de la solidification des magmas basaltiques peuvent
produire des CSDs différentes, ou modifier les CSDs préexistantes. Les CSDs théoriques attendues
diffèrent selon le type de processus considéré. Une revue de ces différents profiles CSD ainsi que
le détail des méthodes analytiques sont présentés dans les Chapitres 1 et 2.
Imagerie électronique des olivines
L'imagerie électronique constitue une méthode complémentaire pour visualiser les
textures, et donc d'en retirer une information plus complète. Cette approche qualitative permet

36
principalement d'identifier les cristaux d'olivine ayant subi un ou des épisodes de rééquilibrage
(recristallisation) et/ou déstabilisation (résorption/dissolution) lors de la solidification
magmatique, et de déterminer s'il existe une ou plusieurs populations de cristaux. Les éventuelles
zonalités à l'intérieur des cristaux pourront ainsi être caractérisées en détail. En pratique,
l'imagerie des olivines se fait par microsonde électronique en mode "électrons rétro-diffusés" (Fig.
10).
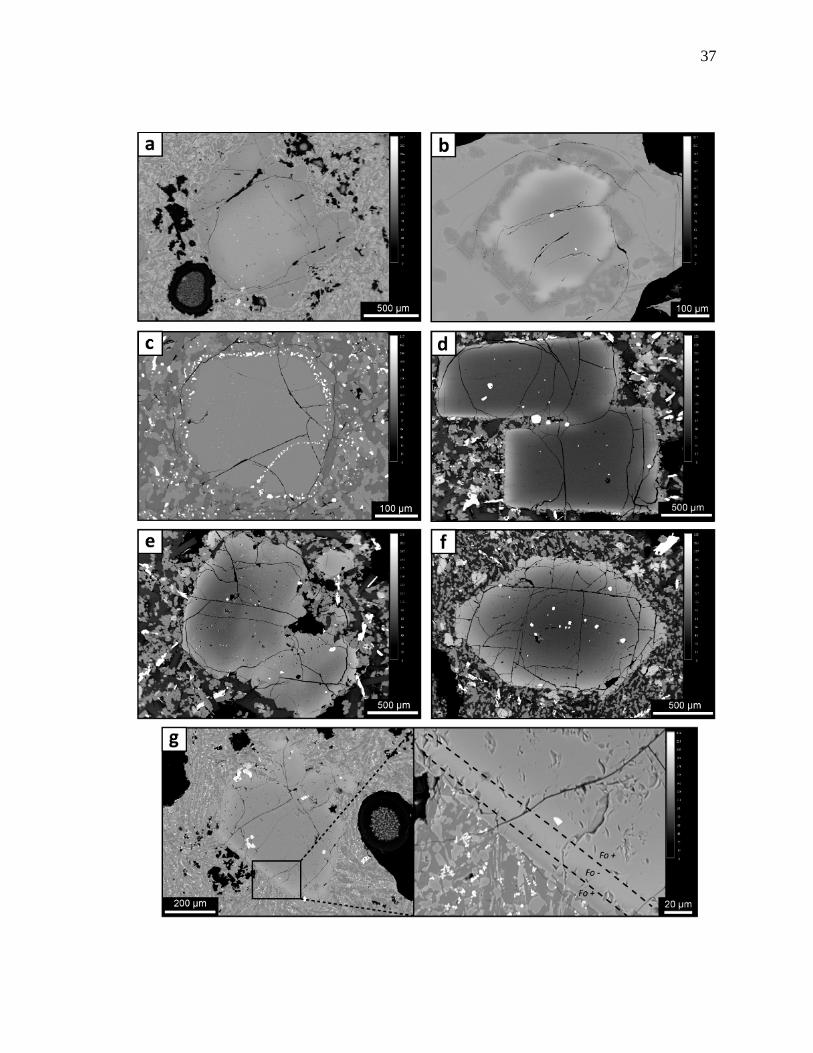
37
38
Figure 10 : Exemples généraux illustrant les différents types de zonalité chimique de l'olivine et autres observations rencontrés dans ce travail. Photographies prises à la microsonde en mode électrons rétrodiffusés (15 kV ; 20 nA). (a) Zonalité inverse ; MU69-1a, grain 9. (b) Zonalité complexe ; MU74-2a, grain V. (c) Bordure de chromites autour de l'olivine et mise en évidence d'un sous-grain ; KI67-1-60, grain m. (d) Zonalité (normale) vs agrégation ; KI75-1-11, grain N. (e) Zonalité normale vs sous-grains ; KI75-1-27, grain F. (f) Zonalité normale ; KI75-3-35, grain D. (g) Zonalité complexe : à gauche, le grain entier ; à droite, une vue détaillée de la bordure (Fo+, riche en forstérite ; Fo-, pauvre en forstérite) ; MU74-5a, grain 11.
39
Chimie des olivines et chimie en roche totale
Tout comme l'imagerie électronique, les analyses chimiques in situ des olivines par
microsonde électronique (éléments majeurs et mineurs ; Annexes 1 et 2), ainsi que les analyses en
roche totale (éléments majeurs, traces et Terres Rares ; Annexe 5), permettent de faciliter
l'interprétation des textures. La chimie des olivines permet également de confirmer l'existence
d'une ou plusieurs populations cristallines et minérales, et de quantifier la proportion de chaque
population par balance de masse. Les analyses chimiques permettent aussi de caractériser les
cristaux qui présentent des évidences chimiques de dissolution ou de recristallisation. De plus,
l'approche géochimique est le seul moyen, ou un moyen complémentaire, de distinguer et
quantifier certains mécanismes de solidification, tel que le mélange de magmas, pour ne citer que
lui. À nouveau ici, le lecteur est invité à se référer aux Chapitres 1 et 2 pour de plus amples détails.
Certaines chromites et la matrice vitreuse de quelques échantillons ont également été
analysées in situ par microsonde électronique (Annexes 3 et 4), mais ces résultats n'ont pas été
utilisés dans les articles qui constituent cette thèse.
Micro-diffraction des rayons X (µXRD) sur olivines
L'analyse structurale de l'olivine par µXRD est une technique récemment mise au point par
Dr. Roberta Flemming, The University of Western Ontario, London, Ontario (Canada). Cette
technique permet, entre autres, la caractérisation in situ et rapide de la déformation au sein du
minéral. Il est ainsi possible de vérifier les observations pétrographiques de déformation faites au
microscope, et de quantifier l'intensité de la déformation par intégration du signal µXRD. La
description de la méthode est fournie au Chapitre 3.
40
4 Format de la thèse
Cette thèse est de type "recueil d'articles scientifiques" qui sont au moment du dépôt
final, soit publiés, soit acceptés, soit soumis aux fins d'évaluation par un comité de lecture dans un
journal international.
Le premier article a été publié dans la revue Journal of Petrology en Juin 2010 sous le titre
: "Magma solidification processes beneath Kilauea Volcano, Hawaii: A quantitative textural and
geochemical study of the 1969-1974 Mauna Ulu lavas". Cet article constitue le Chapitre 1 de cette
thèse. Dans ce manuscrit, les principaux processus de solidification actifs à des profondeurs de 0 à
12 km à l'intérieur du volcan Kilauea, sont examinés et quantifiés via une approche double,
géochimique et texturale, appliquée aux laves de l'éruption de 1969-1974 du Mauna Ulu (East Rift
Zone). L'article met en évidence l'existence de deux populations différentes d'olivines
magmatiques, cogénétiques par ailleurs. Aucune olivine mantellique n'est reconnue ici, malgré la
présence de nombreux cristaux déformés. Les résultats montrent que les magmas à l'origine de
l'éruption du Mauna Ulu ont suivi deux trajets différents : (1) transit du magma transportant la
plupart des olivines déformées le long du décollement majeur sous l'édifice, puis remontée à
travers des conduits verticaux jusqu'à la région sous Mauna Ulu ; et (2) remontée du magma
transportant les olivines non déformées par le conduit magmatique principal jusqu'au réservoir
sommital, puis transfert sous la East Rift Zone et mélange des magmas dans des réservoirs
secondaires.
Le second article a été accepté et est en cours de révision pour la revue Journal of
Volcanology and Geothermal Research, sous le titre : "What can crystal size distributions and
41
olivine compositions tell us about magma solidification processes inside Kilauea Iki lava lake,
Hawaii?". Cet article constitue le Chapitre 2 de cette thèse. Dans ce manuscrit, l'approche
combinée de la chimie in situ et des CSDs de l'olivine est appliquée à la fois à des échantillons
provenant de la surface du lac de lave du Kilauea Iki ainsi qu'à une large gamme d'échantillons
provenant de forages dans le lac, à différentes profondeurs (0-90 m). Trois populations d'olivines
sont mises en évidence à partir de leur teneur en forstérite. Au moins deux populations sont
retrouvées par l'analyse texturale quantitative. Nos résultats suggèrent l'influence majeure du
mélange de magmas ou cristaux et du mûrissement textural lors du refroidissement du lac. La
recroissance a aussi joué un rôle important. Au contraire, la modélisation CSD n'a fournit aucune
évidence de sédimentation gravitaire des cristaux ni de convection. Ce travail met aussi l'accent
sur l'existence dans le lac de lave d'une stratification verticale minéralogique et chimique, dont
l'origine pourrait être attribuée au remplissage basal du lac en cours d'éruption.
Le troisième article a été accepté et re-soumis après révisions en Octobre 2010 dans la
revue American Mineralogist, sous le titre initial : "Crystal structure, mosaicity and strain analysis
of Hawaiian olivines using in situ micro X-ray diffraction (µXRD)". Cet article constitue le Chapitre 3
de la thèse. Il présente l'analyse microstructurale in situ par µXRD d'olivines déformées et non
déformées provenant des laves du Mauna Ulu et Kilauea Iki. Cette courte étude utilise une
technique innovante, non destructive, peu coûteuse et rapide à mettre en œuvre permettant de
recueillir des informations sur la structure interne des cristaux, ainsi que le mode et l'intensité de
déformation. Les résultats ont permis de valider les observations pétrographiques faites à l'aide du
microscope, au sujet des évidences de déformation. Cette analyse µXRD a aussi permis de
confirmer la présence d'olivines déformées pour toutes les tailles de grains, sans corrélation
simple avec leur chimie. Enfin, il a été possible de fixer un seuil quantitatif au-delà duquel toute
42
olivine est déformée de façon significative. J’ai mené ce travail au laboratoire de Microanalyse par
Rayons X de The University of Western Ontario, London, Ontario (Canada), avec la collaboration de
Dr. Roberta Flemming. J’ai recueilli tous les résultats alors que Dr. Flemming m’a aidé à
correctement utiliser l’appareillage et les divers logiciels de traitement de données ; elle a par
ailleurs rédigé la partie « Methods » de l’article.
Les Chapitres 1 et 2 de cette thèse ont également fait l'objet de conférences présentées
lors des congrès internationaux et locaux suivants :
• Vitrine étudiante des Sciences de la Terre, UQAC, Chicoutimi, QC, Canada, Mars 2010 ;
• AGU Fall Meeting, San Francisco, CA, USA, Décembre 2009 ;
• IAVCEI General Assembly, Reykjavik, Islande, Août 2008 ;
• Frontiers in Mineral Sciences, Cambridge, UK, Juin 2007 ;
• Vitrine étudiante des Sciences de la Terre, UQAC, Avril 2007.
43
RÉFÉRENCES
Albarede, F. et al., 1997. The geochemical regimes of Piton de la Fournaise volcano (Reunion) during the last 530,000 years. Journal of Petrology, 38(2): 171-201.
Albarede, F. and Tamagnan, V., 1988. Modeling the recent geochemical evolution of the Piton de la Fournaise Volcano, Reunion Island, 1931-1986. Journal of Petrology, 29(5): 997-1030.
Bai, Q. and Kohlstedt, D.L., 1992. High-temperature creep of olivine single crystals. 2. dislocation structures. Tectonophysics, 206(1-2): 1-29.
Bai, Q., Mackwell, S.J. and Kohlstedt, D.L., 1991. High-temperature creep of olivine single crystals. 1. Mechanical results for buffered samples. Journal of Geophysical Research-Solid Earth and Planets, 96(B2): 2441-2463.
Baronnet, A., 1984. Growth-Kinetics of the Silicates - a Review of Basic Concepts. Fortschritte Der Mineralogie, 62(2): 187-232.
Bartlett, R.W., 1969. Magma convection, temperature distribution, and differentiation. Amercian Journal of Sciences, 267: 1067-1082.
Boivin, P. and Bachelery, P., 2009. Petrology of 1977 to 1998 eruptions of Piton de la Fournaise, La Reunion Island. Journal of Volcanology and Geothermal Research, 184(1-2): 109-125.
Bonin, B., 1998. Pétrologie endogène. Dunod (Ed.), 335 pp.
Bowen, N.L., 1928. The Evolution of the Igneous Rocks. Princeton University Press, Princeton, NJ, 332 pp.
Brandeis, G. and Jaupart, C., 1986. On the Interaction between Convection and Crystallization in Cooling Magma Chambers. Earth and Planetary Science Letters, 77(3-4): 345-361.
Brandeis, G. and Jaupart, C., 1987. The Kinetics of Nucleation and Crystal-Growth and Scaling Laws for Magmatic Crystallization. Contributions to Mineralogy and Petrology, 96(1): 24-34.
Brandeis, G., Jaupart, C. and Allegre, C.J., 1984. Nucleation, Crystal-Growth and the Thermal Regime of Cooling Magmas. Journal of Geophysical Research, 89(NB12): 161-177.
Brandeis, G. and Marsh, B.D., 1989. The Convective Liquidus in a Solidifying Magma Chamber - a Fluid Dynamic Investigation. Nature, 339(6226): 613-616.
Bureau, H., Metrich, N., Pineau, F. and Semet, M.P., 1998. Magma-conduit interaction at Piton de la Fournaise volcano (Reunion Island): a melt and fluid inclusion study. Journal of Volcanology and Geothermal Research, 84(1-2): 39-60.
44
Cabane, H., Laporte, D. and Provost, A., 2005. An experimental study of Ostwald ripening of olivine and plagioclase in silicate melts: implications for the growth and size of crystals in magmas. Contributions to Mineralogy and Petrology, 150(1): 37-53.
Campbell, I.H., 1996. Fluid Dynamic Processes in Basaltic Magma Chambers. In: R.G. Cawthorn (Editor), Layered Intrusions. Developments in Petrology (volume 15). Elsevier, Amsterdam, pp. 45-76.
Cashman, K.V., 1993. Relationship between Plagioclase Crystallization and Cooling Rate in Basaltic Melts. Contributions to Mineralogy and Petrology, 113(1): 126-142.
Cashman, K.V. and Marsh, B.D., 1988. Crystal Size Distribution (Csd) in Rocks and the Kinetics and Dynamics of Crystallization .2. Makaopuhi Lava Lake. Contributions to Mineralogy and Petrology, 99(3): 292-305.
Cashman, K.V., Thornber, C. and Kauahikaua, J.P., 1999. Cooling and crystallization of lava in open channels, and the transition of Pahoehoe Lava to 'A'a. Bulletin of Volcanology, 61(5): 306-323.
Chen, C.F. and Turner, J.S., 1980. Crystallization in a Double-Diffusive System. Journal of Geophysical Research, 85(NB5): 2573-2593.
Clague, D.A. and Denlinger, R.P., 1994. Role of olivine cumulates in destabilizing the flanks of Hawaiian volcanoes. Bulletin of Volcanology, 56(6-7): 425-434.
Clague, D.A., Moore, J.G., Dixon, J.E. and Friesen, W.B., 1995. Petrology of submarine lavas from Kilaueas Puna Ridge, Hawaii. Journal of Petrology, 36(2): 299-349.
Couch, S., Sparks, R.S.J. and Carroll, M.R., 2001. Mineral disequilibrium in lavas explained by convective self-mixing in open magma chambers. Nature, 411(6841): 1037-1039.
Davaille, A. and Jaupart, C., 1993. Thermal-Convection in Lava Lakes. Geophysical Research Letters, 20(17): 1827-1830.
Demouchy, S., Schneider, S.E., Mackwell, S.J., Zimmerman, M.E. and Kohlstedt, D.L., 2009. Experimental deformation of olivine single crystals at lithospheric temperatures. Geophysical Research Letters, 36(L04304): doi:10.1029/2008gl036611.
Dowty, E., 1980a. Crystal growth and nucleation theory and the numerical simulation of igneous crystallization. In: R.B. Hargraves (Editor), Physics of Magmatic Processes. Princeton University Press, pp. 419-485.
Dowty, E., 1980b. Synneusis reconsidered. Contributions to Mineralogy and Petrology, 74(1): 75-84.
45
Durham, W.B. and Goetze, C., 1977. Plastic flow of oriented single crystals of olivine. 1. Mechanical data. Journal of Geophysical Research, 82(36): 5737-5753.
Evans, B. and Goetze, C., 1979. The temperature variation of hardness of olivine and its implication for polycrystalline yield stress. Journal of Geophysical Research, 84(B10): 5505-5524.
Famin, V., Welsch, B., Okumura, S., Bachelery, P. and Nakashima, S., 2009. Three differentiation stages of a single magma at Piton de la Fournaise volcano (Reunion hot spot). Geochemistry Geophysics Geosystems, 10(Q01007): doi:10.1029/2008gc002015.
Flemming, R.L., 2007. Micro X-ray diffraction (µXRD): a versatile technique for characterization of earth and planetary materials. Canadian Journal of Earth Sciences, 44(9): 1333-1346.
Garcia, M.O., 1996. Petrography and olivine and glass chemistry of lavas from the Hawaii Scientific Drilling Project. Journal of Geophysical Research-Solid Earth, 101(B5): 11701-11713.
Gray, N.H., Philpotts, A.R. and Dickson, L.D., 2003. Quantitative measures of textural anisotropy resulting from magmatic compaction illustrated by a sample from the Palisades sill, New Jersey. Journal of Volcanology and Geothermal Research, 121(3-4): 293-312.
Helz, R.T., 1980. Crystallization history of Kilauea Iki lava lake as seen in drill core recovered in 1967-1979. Bulletin Volcanologique, 43(4): 675-701.
Helz, R.T., 1987a. Differenciation behavior of Kilauea Iki lava lake, Kilauea Volcano, Hawaii: An overview of past and current work. In: B.O. Mysen (Editor), Magmatic Processes: Physicochemical Principles. The Geochemical Society, pp. 241-258.
Helz, R.T., 1987b. Diverse olivine types in lava of the 1959 eruption of Kilauea Volcano and their bearing on eruption dynamics. U.S. Geological Survey, Professional Paper, 1350(1): 691-722.
Helz, R.T., Kirschenbaum, H. and Marinenko, J.W., 1989. Diapiric transfer of melt in Kilauea Iki lava lake, Hawaii: a quick, efficient process of igneous differentiation. Geological Society of America Bulletin, v. 101: p. 578-594.
Herring, C., 1951. Some Theorems on the Free Energies of Crystal Surfaces. Physical Review, 82(1): 87-93.
Higgins, M.D., 1991. The Origin of Laminated and Massive Anorthosite, Sept Iles Layered Intrusion, Quebec, Canada. Contributions to Mineralogy and Petrology, 106(3): 340-354.
Higgins, M.D., 1998. Origin of anorthosite by textural coarsening: Quantitative measurements of a natural sequence of textural development. Journal of Petrology, 39(7): 1307-1323.
46
Higgins, M.D., 2002. A crystal size-distribution study of the Kiglapait layered mafic intrusion, Labrador, Canada: evidence for textural coarsening. Contributions to Mineralogy and Petrology, 144(3): 314-330.
Higgins, M.D., 2006. Quantitative Textural Measurements in Igneous and Metamorphic Petrology. Cambridge University Press, Cambridge, UK, 265 pp.
Higgins, M.D. and Roberge, J., 2003. Crystal size distribution of plagioclase and amphibole from Soufriere Hills volcano, Montserrat: Evidence for dynamic crystallization-textural coarsening cycles. Journal of Petrology, 44(8): 1401-1411.
Hobbs, B.E., 1985. The Geological Significances of Microfabric Analysis. In: H.-R. Wenk (Editor), Preferred Orientation in Deformed Metals and Rocks: An Introduction to Modern Texture Analysis. Academic Press, Inc., pp. 463-484.
Holness, M.B., Nielsen, T.F.D. and Tegner, C., 2007. Textural Maturity of Cumulates: a Record of Chamber Filling, Liquidus Assemblage, Cooling Rate and Large-scale Convection in Mafic Layered Intrusions. Journal of Petrology, 48(1): 141-157.
Hort, M., 1997. Cooling and crystallization in sheet-like magma bodies revisited. Journal of Volcanology and Geothermal Research, 76(3-4): 297-317.
Hort, M., Marsh, B.D., Resmini, R.G. and Smith, M.K., 1999. Convection and crystallization in a liquid cooled from above: an experimental and theoretical study. Journal of Petrology, 40(8): 1271-1300.
Hort, M., Marsh, B.D. and Spohn, T., 1993. Igneous Layering through Oscillatory Nucleation and Crystal Settling in Well-Mixed Magmas. Contributions to Mineralogy and Petrology, 114(4): 425-440.
Hoshide, T., Obata, M. and Akatsuka, T., 2006. Crystal settling and crystal growth of olivine in magmatic differentiation - the Murotomisaki Gabbroic Complex, Shikoku, Japan. Journal of Mineralogical and Petrological Sciences, 101(5): 223-239.
Hunter, R.H., 1996. Texture Development in Cumulate Rocks. In: R.G. Cawthorn (Editor), Layered Intrusions. Developments in Petrology (volume 15). Elsevier, Amsterdam, pp. 77-101.
Huppert, H.E. and Sparks, S.J., 1984. Double-Diffusive Convection Due to Crystallization in Magmas. Annual Review of Earth and Planetary Sciences, 12: 11-37.
Huppert, H.E. and Worster, M.G., 1985. Dynamic Solidification of a Binary Melt. Nature, 314(6013): 703-707.
Ice, G.E., Larson, B., Pang, J.W.L., Liu, W. and Barabash, R., 2006. Strain-Resolved Polychromatic X-ray Microdiffraction. Microscopy and Microanalysis, 12(Supp. 2): 920-921.
47
Ice, G.E. et al., 2005. Polychromatic X-ray microdiffraction studies of mesoscale structure and dynamics. Journal of Synchrotron Radiation, 12: 155-162.
Ikuta, D. et al., 2007. First in situ X-ray identification of coesite and retrograde quartz on a glass thin section of an ultrahigh-pressure metamorphic rock and their crystal structure details. American Mineralogist, 92(1): 57-63.
Izawa, M.R.M., Flemming, R.L. and Banerjee, N.R., 2009. Shock stage assessment and petrography of 11 Antarctic enstatite chondrites, 40th Lunar and Planetary Science Conference, Abs. #1322, Houston, Texas.
Izawa, M.R.M., Flemming, R.L. and Banerjee, N.R., in review. Micro X-ray diffraction (μXRD) assessment of shock stage in enstatite chondrites. Meteoritics & Planetary Science.
Jaupart, C. and Parsons, B., 1985. Convective instabilities in a variable viscosity fluid cooled from above. Physics of The Earth and Planetary Interiors, 39(1): 14-32.
Jaupart, C. and Tait, S., 1995. Dynamics of Differentiation in Magma Reservoirs. Journal of Geophysical Research-Solid Earth, 100(B9): 17615-17636.
Jellinek, A.M. and Kerr, R.C., 2001. Magma dynamics, crystallization, and chemical differentiation of the 1959 Kilauea Iki lava lake, Hawaii, revisited. Journal of Volcanology and Geothermal Research, 110(3-4): 235-263.
Jerram, D.A., Cheadle, M.J. and Philpotts, A.R., 2003. Quantifying the building blocks of igneous rocks: Are clustered crystal frameworks the foundation? Journal of Petrology, 44(11): 2033-2051.
Kerr, R.C., Woods, A.W., Worster, M.G. and Huppert, H.E., 1989. Disequilibrium and Macrosegregation During Solidification of a Binary Melt. Nature, 340(6232): 357-362.
Kohlsted, D.L. and Goetze, C., 1974. Low-stress high-temperature creep in olivine single crystals. Journal of Geophysical Research, 79(14): 2045-2051.
Langdon, T.G., 1985. Regimes of Plastic Deformation. In: H.-R. Wenk (Editor), Preferred Orientation in Deformed Metals and Rocks: An Introduction to Modern Texture Analysis. Academic Press, Inc., pp. 219-232.
Li, L., Weidner, D., Raterron, P., Chen, J.H. and Vaughan, M., 2004. Stress measurements of deforming olivine at high pressure. Physics of The Earth and Planetary Interiors, 143: 357-367.
Li, L.L. et al., 2006. Deformation of olivine at mantle pressure using the D-DIA. European Journal of Mineralogy, 18(1): 7-19.
48
Lofgren, G., 1980. Experimental Studies On The Dynamic Crystallization Of Silicate Melts. In: R.B. Hargraves (Editor), Physics of Magmatic Processes. Princeton University Press, Princeton, NJ, pp. 487-551.
Mangan, M.T., 1990. Crystal Size Distribution Systematics and the Determination of Magma Storage Times - The 1959 Eruption of Kilauea Volcano, Hawaii. Journal of Volcanology and Geothermal Research, 44(3-4): 295-302.
Mangan, M.T. and Marsh, B.D., 1992. Solidification Front Fractionation in Phenocryst-Free Sheet-Like Magma Bodies. Journal of Geology, 100(5): 605-620.
Marsh, B.D., 1988. Crystal Capture, Sorting, and Retention in Convecting Magma. Geological Society of America Bulletin, 100(11): 1720-1737.
Marsh, B.D., 1989. Magma Chambers. Annual Review of Earth and Planetary Sciences, 17: 437-474.
Marsh, B.D., 1996. Solidification fronts and magmatic evolution. Mineralogical Magazine, 60(398): 5-40.
Marsh, B.D., 2002. On bimodal differentiation by solidification front instability in basaltic magmas, part 1: Basic mechanics. Geochimica Et Cosmochimica Acta, 66(12): 2211-2229.
Martin, D., Griffiths, R.W. and Campbell, I.H., 1987. Compositional and Thermal-Convection in Magma Chambers. Contributions to Mineralogy and Petrology, 96(4): 465-475.
Martin, D. and Nokes, R., 1988. Crystal Settling in a Vigorously Convecting Magma Chamber. Nature, 332(6164): 534-536.
Martin, D. and Nokes, R., 1989. A Fluid-Dynamic Study of Crystal Settling in Convecting Magmas. Journal of Petrology, 30(6): 1471-1500.
Martin, V.M., Holness, M.B. and Pyle, D.M., 2006. Textural analysis of magmatic enclaves from the Kameni Islands, Santorini, Greece. Journal of Volcanology and Geothermal Research, 154(1-2): 89-102.
McBirney, A.R. and Nicolas, A., 1997. The Skaergaard layered series .2. Magmatic flow and dynamic layering. Journal of Petrology, 38(5): 569-580.
McCausland, P.J.A., Flemming, R.L. and Izawa, M.R.M., 2010. Shock stage measurement in ordinary chondrites and achondrites by in-situ micro-XRD. Meteoritics & Planetary Science, 45: A132-A132 (abstr.).
Mercier, J.-C.C., 1985. Olivine and Pyroxenes. In: H.-R. Wenk (Editor), Preferred Orientation in Deformed Metals and Rocks: An Introduction to Modern Texture Analysis. Academic Press, Inc., pp. 407-430.
49
Meurer, W.P. and Boudreau, A.E., 1998. Compaction of igneous cumulates Part II: Compaction and the development of igneous foliations. Journal of Geology, 106(3): 293-304.
Moore, J.G. and Evans, B.W., 1967. The role of olivine in the crystallization of the prehistoric Makaopuhi tholeiitic lava lake, Hawaii. Contributions to Mineralogy and Petrology, 15: 202-223.
Moser, D.E., Davis, W.J., Reddy, S.M., Flemming, R.L. and Hart, R.J., 2009. Zircon U-Pb strain chronometry reveals deep impact-triggered flow. Earth and Planetary Science Letters, 277(1-2): 73-79.
Neri, A., 1998. A local heat transfer analysis of lava cooling in the atmosphere: application to thermal diffusion-dominated lava flows. Journal of Volcanology and Geothermal Research, 81(3-4): 215-243.
Nicolas, A. and Ildefonse, B., 1996. Flow mechanism and viscosity in basaltic magma chambers. Geophysical Research Letters, 23(16): 2013-2016.
Park, Y. and Hanson, B., 1999. Experimental investigation of Ostwald-ripening rates of forsterite in the haplobasaltic system. Journal of Volcanology and Geothermal Research, 90(1-2): 103-113.
Philpotts, A.R., Brustman, C.M., Shi, J.Y., Carlson, W.D. and Denison, C., 1999. Plagioclase-chain networks in slowly cooled basaltic magma. American Mineralogist, 84(11-12): 1819-1829.
Philpotts, A.R. and Dickson, L.D., 2000. The formation of plagioclase chains during convective transfer in basaltic magma. Nature, 406(6791): 59-61.
Philpotts, A.R. and Philpotts, D.E., 2005. Crystal-mush compaction in the Cohassett flood-basalt flow, Hanford, Washington. Journal of Volcanology and Geothermal Research, 145(3-4): 192-206.
Philpotts, A.R., Shi, J.Y. and Brustman, C., 1998. Role of plagioclase crystal chains in the differentiation of partly crystallized basaltic magma. Nature, 395(6700): 343-346.
Pupier, E., Duchene, S. and Toplis, M.J., 2008. Experimental quantification of plagioclase crystal size distribution during cooling of a basaltic liquid. Contributions to Mineralogy and Petrology, 155(5): 555-570.
Raleigh, C.B., 1968. Mechanims of plastic deformation of olivine. Journal of Geophysical Research, 73(16): 5391-5406.
Raterron, P., Wu, Y.J., Weidner, D.J. and Chen, J.H., 2004. Low-temperature olivine rheology at high pressure. Physics of The Earth and Planetary Interiors, 145(1-4): 149-159.
50
Rhodes, J.M., Dungan, M.A., Blanchard, D.P. and Long, P.E., 1979. Magma mixing at mid-ocean ridges: Evidence from basalts drilled near 22-degrees-N on the Mid-Atlantic Ridge. Tectonophysics, 55(1-2): 35-61.
Richter, D.H. and Moore, J.G., 1966. Petrology of the Kilauea Iki lava lake, Hawaii. U.S. Geological Survey, Professional Paper, 537-B: B1-B26.
Rudman, M., 1992. Two-phase natural convection: implications for crystal settling in magma chambers. Physics of The Earth and Planetary Interiors, 72(3-4): 153-172.
Rupke, L.H. and Hort, M., 2004. The impact of side wall cooling on the thermal history of lava lakes. Journal of Volcanology and Geothermal Research, 131(1-2): 165-178.
Schwindinger, K.R., 1999. Particle dynamics and aggregation of crystals in a magma chamber with application to Kilauea Iki olivines. Journal of Volcanology and Geothermal Research, 88(4): 209-238.
Schwindinger, K.R. and Anderson, A.T., 1989. Synneusis of Kilauea Iki Olivines. Contributions to Mineralogy and Petrology, 103(2): 187-198.
Scoates, J.S., 2000. The plagioclase-magma density paradox re-examined and the crystallization of proterozoic anorthosites. Journal of Petrology, 41(5): 627-649.
Shamberger, P.J. and Garcia, M.O., 2007. Geochemical modeling of magma mixing and magma reservoir volumes during early episodes of Kilauea Volcano's Pu'u '(O)over-bar'(o)over-bar eruption. Bulletin of Volcanology, 69(4): 345-352.
Shaw, H.R., 1965. Comments on viscosity, crystal settling, and convection in granitic magmas. American Journal of Science, 263(2): 120-153.
Smith, E., Helmstaedt, H.H. and Flemming, R.L., 2010. Survival of the Brown Colour in Diamond During Storage in the Subcontinental Lithospheric Mantle. Canadian Mineralogist, 48(3): 571-582.
Thornber, C.R., 2003. Magma-reservoir processes revealed by geochemistry of the Pu'u 'O'o-Kupaianaha eruption. U.S. Geological Survey, Professional Paper, 1676: 121-136.
Tiller, W.A., 1991. The science of crystallization: microscopic interfacial phenomena. Cambridge University Press, 391 pp.
Turner, J.S. and Campbell, I.H., 1986. Convection and Mixing in Magma Chambers. Earth-Science Reviews, 23(4): 255-352.
Vance, J.A., 1969. On synneusis. Contributions to Mineralogy and Petrology, 24(1): 7-29.
51
Vance, J.A. and Gilreath, J.P., 1967. Effect of synneusis on phenocryst distribution patterns in some porphyritic igneous rocks. American Mineralogist, 52(3-4): 529-536.
Voorhees, P.W., 1992. Ostwald ripening of 2-phase mixtures. Annual Review of Materials Science, 22: 197-215.
Welsch, B., Faure, F., Bachelery, P. and Famin, V., 2009. Microcrysts Record Transient Convection at Piton de la Fournaise Volcano (La Reunion Hotspot). Journal of Petrology, 50(12): 2287-2305.
Worster, M.G., Huppert, H.E. and Sparks, R.S.J., 1993. The Crystallization of Lava Lakes. Journal of Geophysical Research-Solid Earth, 98(B9): 15891-15901.
Wright, T.L., 1973. Magma mixing as illustrated by 1959 eruption, Kilauea Volcano, Hawaii. Geological Society of America Bulletin, 84(3): 849-858.
Wright, T.L. and Okamura, R.T., 1977. Cooling and crystallization of tholeiitic basalt, 1965 Makaopuhi lava lake, Hawaii. U.S. Geological Survey, Professional Paper, 1004: 78 p.
Wright, T.L., Swanson, D.A. and Duffield, W.A., 1975. Chemical compositions of Kilauea east-rift lava, 1968-1971. Journal of Petrology, 16(1): 110-133.
Yang, H.J., Frey, F.A., Garcia, M.O. and Clague, D.A., 1994. Submarine lavas from Mauna-Kea Volcano, Hawaii - Implications for Hawaiian shield stage processes. Journal of Geophysical Research - Solid Earth, 99(B8): 15577-15594.
52
CHAPITRE 1
MAGMA SOLIDIFICATION PROCESSES BENEATH KILAUEA VOLCANO, HAWAII:
A QUANTITATIVE TEXTURAL AND GEOCHEMICAL STUDY OF THE 1969-1974
MAUNA ULU LAVAS
NICOLAS VINET & MICHAEL D. HIGGINS
SCIENCES DE LA TERRE, UNIVERSITÉ DU QUÉBEC À CHICOUTIMI, CHICOUTIMI, G7H 2B1 CANADA
Journal of Petrology DOI:10.1093/petrology/egq020
53
1.1 ABSTRACT
Kilauea Volcano is a very intensively studied, active basaltic magmatic system and thus,
represents an ideal location to study magma solidification processes in a natural environment.
Understanding solidification is important in refining models of magma chamber dynamics, and its
detailed study can improve our knowledge of magma system evolution. In this study, magma
solidification processes are examined and quantified using samples from the 1969-1974 Mauna
Ulu (MU) rift eruption. We have collected major and trace element whole-rock data plus in situ
olivine compositions, along with crystal size distribution data on eleven lava samples. The
observed whole-rock chemical variation was partly produced by olivine addition within the Kilauea
edifice. At least two distinct olivine populations are inferred from quantitative textural analysis: (1)
a 3-40 year old population characterized by a low crystal density, greater crystal length and flatter
slopes of the crystal size distributions (CSDs); and (2) a 1.5-15 year old population marked by a
high density of smaller crystals and steep CSD slopes. The range in olivine composition suggests
that all these crystals grew from a range of different magmas, probably closely related by crystal
fractionation. The ubiquitous presence of deformed olivine crystals shows that population 1
reflects a component that must have mostly originated by disruption of a deformed cumulate. This
antecrystic olivine population represents an earlier-coarsened and aggregated, cumulate-forming
magma component. In contrast, the phenocrystic population 2 represents a late magma
component formed in the summit magma storage region. Our results are consistent with the
hypothesis that the components of the MU magmas followed two different routes. The deformed-
olivine bearing magma moved along the deep basal decollement then rose through vertical pipe-
like conduits under MU rift. The undeformed-olivine-bearing magma rose via the main conduit to
54
the summit reservoir and then moved out along the rift zone, where the magmas mixed in small
chambers. The presence of narrow, reversely-zoned rims suggests that the mixing occurred just
prior to eruption.
KEY WORDS: Kilauea (Hawaii); Mauna Ulu; crystal size distributions; olivine cumulates;
solidification processes
1.2 INTRODUCTION
A fundamental issue in igneous petrology is the understanding of magma solidification.
Solidification is the result of a complex interplay between crystallisation and solution. Magma in a
chamber can be reheated by the addition of a new hotter magma or by convective self-mixing. The
partial reduction of pressure during magma ascent can result in an increase or a decrease in the
rate of undercooling. Since direct examination of active basaltic magma chambers is impossible,
we use samples from lava lakes or other volcanic products to study solidification processes and
time scales. These volcanic products are commonly studied by quantitative chemical and isotopic
analysis and by qualitative petrological observations of texture. However, it is also possible to
approach the problem by quantitative analysis of rock textures. One of the most commonly
employed techniques is the study of crystal size distribution (CSD).
CSD measurements can provide a complementary approach to chemical and experimental
methods, of looking at solidification processes in magma chambers, lava flows and lava lakes
(Cashman & Marsh, 1988; Marsh, 1988, 1998). Furthermore, the CSD approach offers the
possibility of investigating solidification in natural dynamic systems and providing clues to the
physical and chemical processes that have taken place. The CSD method yields valuable kinetic
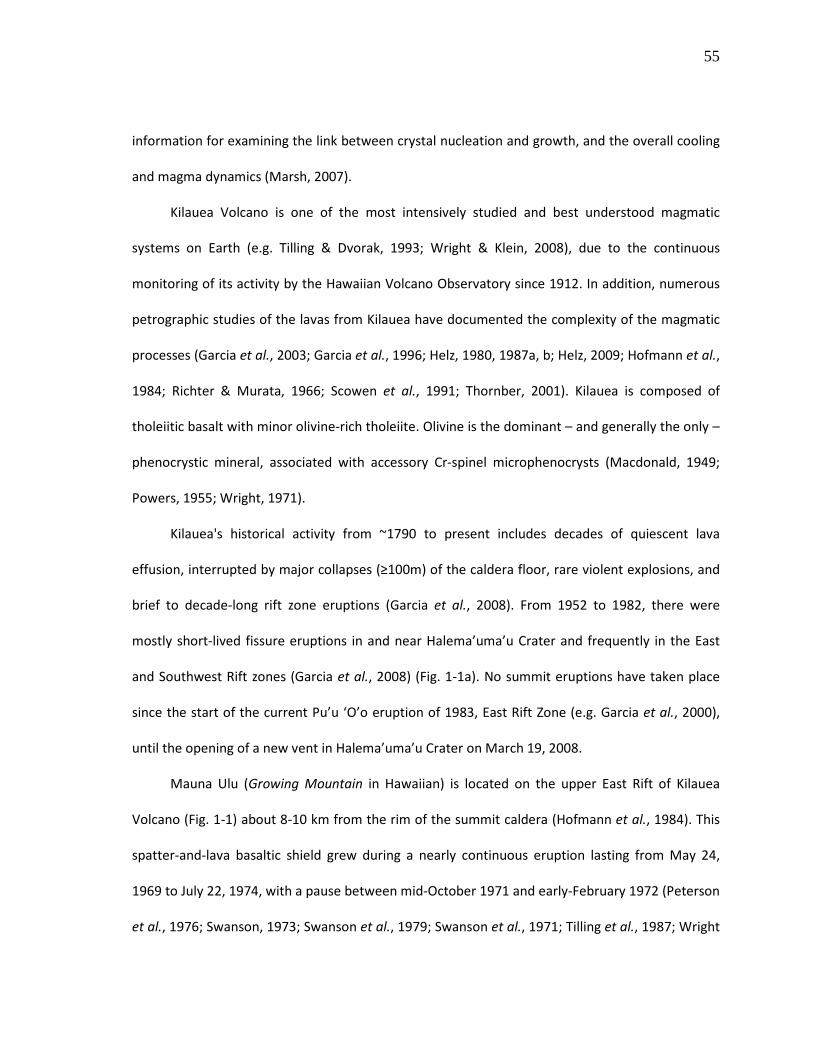
55
information for examining the link between crystal nucleation and growth, and the overall cooling
and magma dynamics (Marsh, 2007).
Kilauea Volcano is one of the most intensively studied and best understood magmatic
systems on Earth (e.g. Tilling & Dvorak, 1993; Wright & Klein, 2008), due to the continuous
monitoring of its activity by the Hawaiian Volcano Observatory since 1912. In addition, numerous
petrographic studies of the lavas from Kilauea have documented the complexity of the magmatic
processes (Garcia et al., 2003; Garcia et al., 1996; Helz, 1980, 1987a, b; Helz, 2009; Hofmann et al.,
1984; Richter & Murata, 1966; Scowen et al., 1991; Thornber, 2001). Kilauea is composed of
tholeiitic basalt with minor olivine-rich tholeiite. Olivine is the dominant – and generally the only –
phenocrystic mineral, associated with accessory Cr-spinel microphenocrysts (Macdonald, 1949;
Powers, 1955; Wright, 1971).
Kilauea's historical activity from ~1790 to present includes decades of quiescent lava
effusion, interrupted by major collapses (≥100m) of the caldera floor, rare violent explosions, and
brief to decade-long rift zone eruptions (Garcia et al., 2008). From 1952 to 1982, there were
mostly short-lived fissure eruptions in and near Halema’uma’u Crater and frequently in the East
and Southwest Rift zones (Garcia et al., 2008) (Fig. 1-1a). No summit eruptions have taken place
since the start of the current Pu’u ‘O’o eruption of 1983, East Rift Zone (e.g. Garcia et al., 2000),
until the opening of a new vent in Halema’uma’u Crater on March 19, 2008.
Mauna Ulu (Growing Mountain in Hawaiian) is located on the upper East Rift of Kilauea
Volcano (Fig. 1-1) about 8-10 km from the rim of the summit caldera (Hofmann et al., 1984). This
spatter-and-lava basaltic shield grew during a nearly continuous eruption lasting from May 24,
1969 to July 22, 1974, with a pause between mid-October 1971 and early-February 1972 (Peterson
et al., 1976; Swanson, 1973; Swanson et al., 1979; Swanson et al., 1971; Tilling et al., 1987; Wright
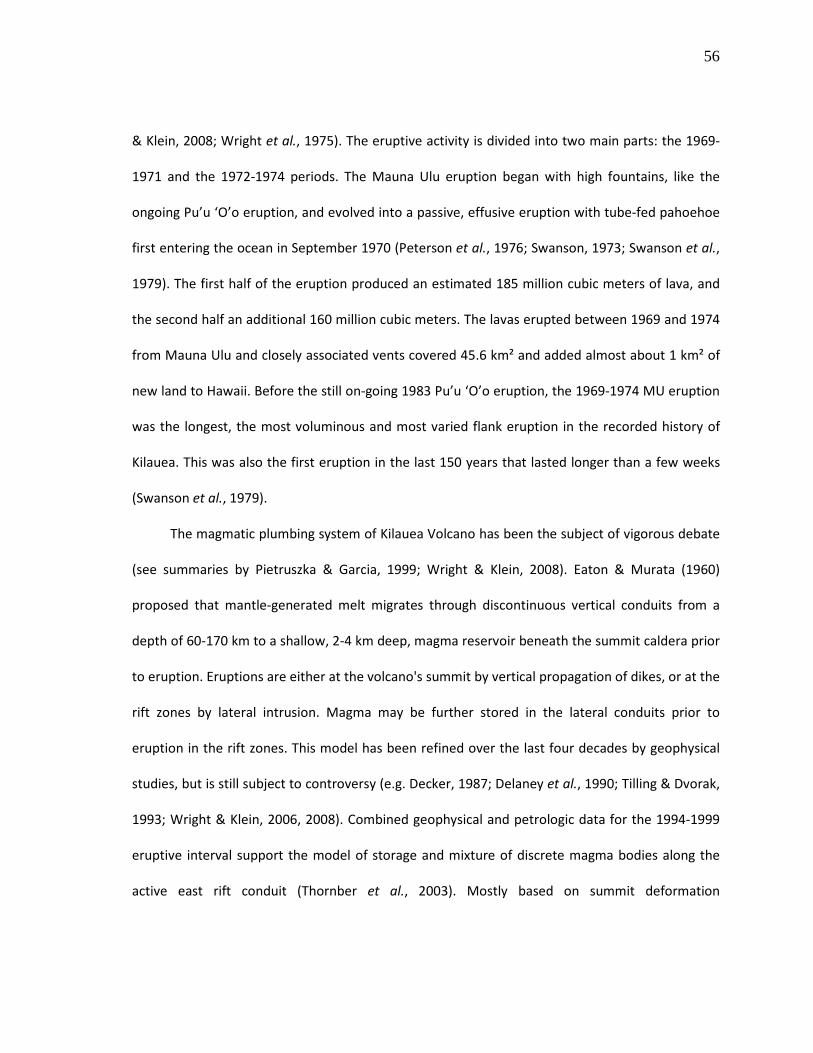
56
& Klein, 2008; Wright et al., 1975). The eruptive activity is divided into two main parts: the 1969-
1971 and the 1972-1974 periods. The Mauna Ulu eruption began with high fountains, like the
ongoing Pu’u ‘O’o eruption, and evolved into a passive, effusive eruption with tube-fed pahoehoe
first entering the ocean in September 1970 (Peterson et al., 1976; Swanson, 1973; Swanson et al.,
1979). The first half of the eruption produced an estimated 185 million cubic meters of lava, and
the second half an additional 160 million cubic meters. The lavas erupted between 1969 and 1974
from Mauna Ulu and closely associated vents covered 45.6 km² and added almost about 1 km² of
new land to Hawaii. Before the still on-going 1983 Pu’u ‘O’o eruption, the 1969-1974 MU eruption
was the longest, the most voluminous and most varied flank eruption in the recorded history of
Kilauea. This was also the first eruption in the last 150 years that lasted longer than a few weeks
(Swanson et al., 1979).
The magmatic plumbing system of Kilauea Volcano has been the subject of vigorous debate
(see summaries by Pietruszka & Garcia, 1999; Wright & Klein, 2008). Eaton & Murata (1960)
proposed that mantle-generated melt migrates through discontinuous vertical conduits from a
depth of 60-170 km to a shallow, 2-4 km deep, magma reservoir beneath the summit caldera prior
to eruption. Eruptions are either at the volcano's summit by vertical propagation of dikes, or at the
rift zones by lateral intrusion. Magma may be further stored in the lateral conduits prior to
eruption in the rift zones. This model has been refined over the last four decades by geophysical
studies, but is still subject to controversy (e.g. Decker, 1987; Delaney et al., 1990; Tilling & Dvorak,
1993; Wright & Klein, 2006, 2008). Combined geophysical and petrologic data for the 1994-1999
eruptive interval support the model of storage and mixture of discrete magma bodies along the
active east rift conduit (Thornber et al., 2003). Mostly based on summit deformation
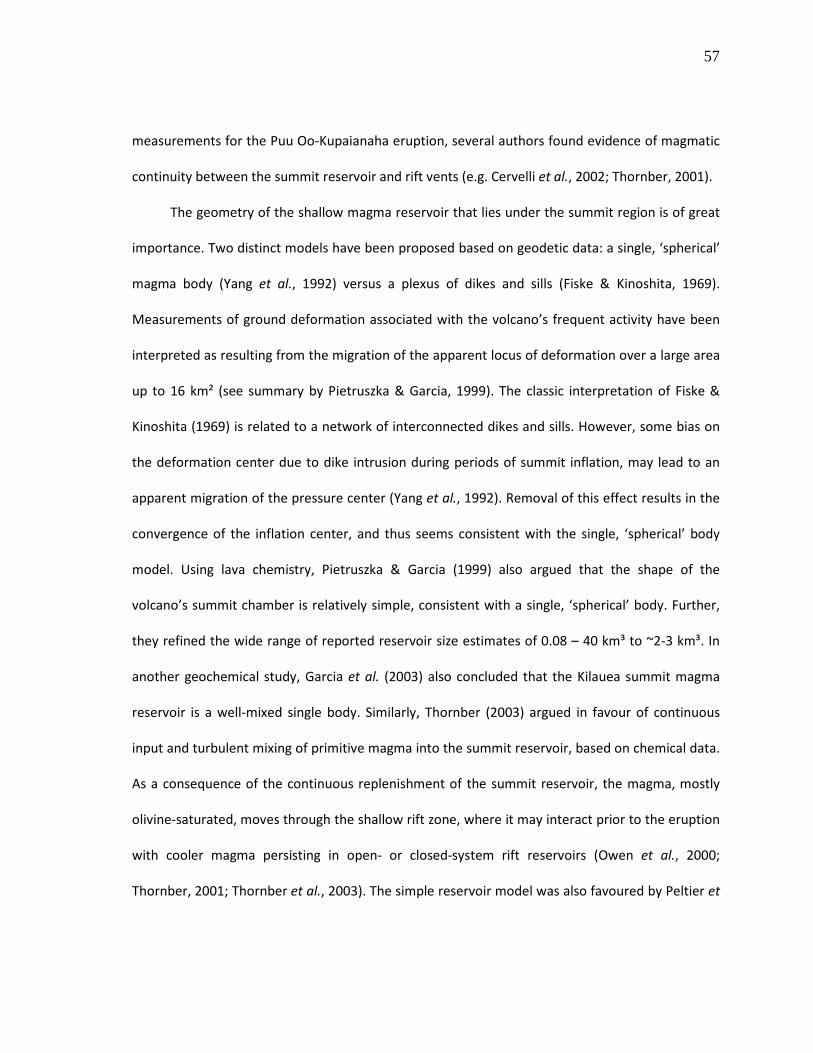
57
measurements for the Puu Oo-Kupaianaha eruption, several authors found evidence of magmatic
continuity between the summit reservoir and rift vents (e.g. Cervelli et al., 2002; Thornber, 2001).
The geometry of the shallow magma reservoir that lies under the summit region is of great
importance. Two distinct models have been proposed based on geodetic data: a single, ‘spherical’
magma body (Yang et al., 1992) versus a plexus of dikes and sills (Fiske & Kinoshita, 1969).
Measurements of ground deformation associated with the volcano’s frequent activity have been
interpreted as resulting from the migration of the apparent locus of deformation over a large area
up to 16 km² (see summary by Pietruszka & Garcia, 1999). The classic interpretation of Fiske &
Kinoshita (1969) is related to a network of interconnected dikes and sills. However, some bias on
the deformation center due to dike intrusion during periods of summit inflation, may lead to an
apparent migration of the pressure center (Yang et al., 1992). Removal of this effect results in the
convergence of the inflation center, and thus seems consistent with the single, ‘spherical’ body
model. Using lava chemistry, Pietruszka & Garcia (1999) also argued that the shape of the
volcano’s summit chamber is relatively simple, consistent with a single, ‘spherical’ body. Further,
they refined the wide range of reported reservoir size estimates of 0.08 – 40 km³ to ~2-3 km³. In
another geochemical study, Garcia et al. (2003) also concluded that the Kilauea summit magma
reservoir is a well-mixed single body. Similarly, Thornber (2003) argued in favour of continuous
input and turbulent mixing of primitive magma into the summit reservoir, based on chemical data.
As a consequence of the continuous replenishment of the summit reservoir, the magma, mostly
olivine-saturated, moves through the shallow rift zone, where it may interact prior to the eruption
with cooler magma persisting in open- or closed-system rift reservoirs (Owen et al., 2000;
Thornber, 2001; Thornber et al., 2003). The simple reservoir model was also favoured by Peltier et
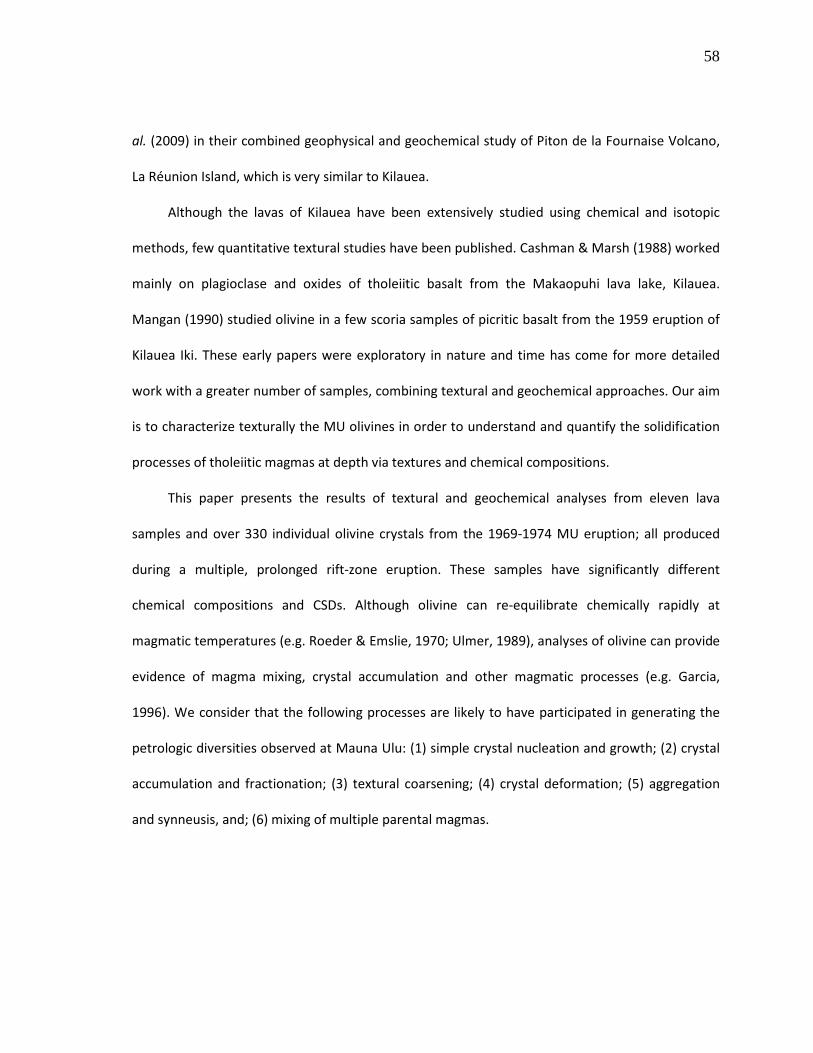
58
al. (2009) in their combined geophysical and geochemical study of Piton de la Fournaise Volcano,
La Réunion Island, which is very similar to Kilauea.
Although the lavas of Kilauea have been extensively studied using chemical and isotopic
methods, few quantitative textural studies have been published. Cashman & Marsh (1988) worked
mainly on plagioclase and oxides of tholeiitic basalt from the Makaopuhi lava lake, Kilauea.
Mangan (1990) studied olivine in a few scoria samples of picritic basalt from the 1959 eruption of
Kilauea Iki. These early papers were exploratory in nature and time has come for more detailed
work with a greater number of samples, combining textural and geochemical approaches. Our aim
is to characterize texturally the MU olivines in order to understand and quantify the solidification
processes of tholeiitic magmas at depth via textures and chemical compositions.
This paper presents the results of textural and geochemical analyses from eleven lava
samples and over 330 individual olivine crystals from the 1969-1974 MU eruption; all produced
during a multiple, prolonged rift-zone eruption. These samples have significantly different
chemical compositions and CSDs. Although olivine can re-equilibrate chemically rapidly at
magmatic temperatures (e.g. Roeder & Emslie, 1970; Ulmer, 1989), analyses of olivine can provide
evidence of magma mixing, crystal accumulation and other magmatic processes (e.g. Garcia,
1996). We consider that the following processes are likely to have participated in generating the
petrologic diversities observed at Mauna Ulu: (1) simple crystal nucleation and growth; (2) crystal
accumulation and fractionation; (3) textural coarsening; (4) crystal deformation; (5) aggregation
and synneusis, and; (6) mixing of multiple parental magmas.
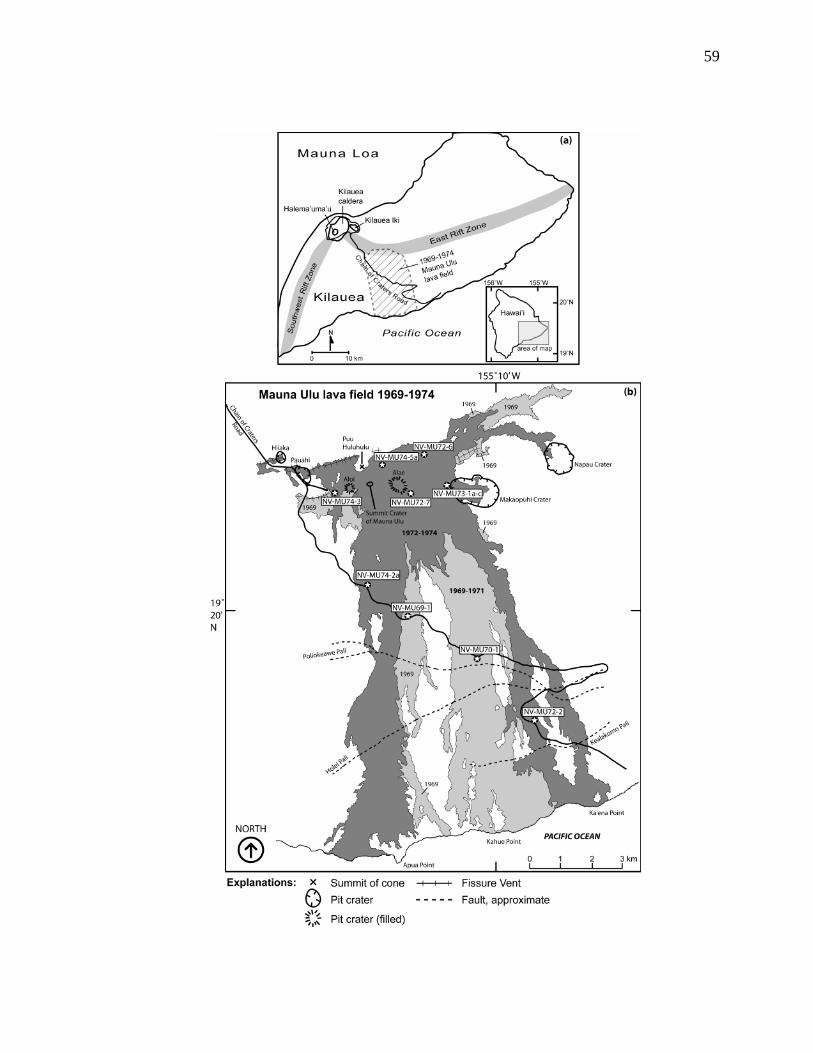
59

60
Figure 1-1. (a) Sketch map of Kilauea Volcano, showing the summit region, the two rift-zones and the
Mauna Ulu lava field 1969-74. Location map of the island of Hawaii with the study area in inset; (b)
Mauna Ulu lava sampling map, modified after the maps of Wolfe & Morris (1996) and Tilling et al. (1987).
Pali means cliff in Hawaiian.
61
1.3 MINERALOGY AND PETROGRAPHY
1.3.1 Sampling
We sampled at least one lava flow per eruption year from the 1969-1974 MU eruption (Fig.
1-1; Table 1-1). Where possible, we collected a temporal suite from each lava flow, typically from
the fissure to the end of the flow. We sampled either the flow terminations (mostly lava lobes) or
the middle of the flow. This sampling method allowed us to study the chemical and textural
evolution of individual eruptive episodes. Unfortunately only one sample in the middle of the flow
was sampled for the 1969 and 1970 lava flows.
To minimize the effects of crystal growth during post-emplacement cooling, we collected
scoria and/or spatter material from the fissure vent, lava blocks from the flow surface, or
quenched blocks where possible from the flow tops (the ‘glassy crust’). When neither quenched
crust nor loose blocks were available, we collected lava samples from beneath the surface of the
flow. In some cases, we sampled deeper ‘slabs’ seen in flow or tumulus cracks, or lava tree moulds
that often constituted partly glassy, or finely crystallized matrix-bearing, material. The glassy
material was also preferred as the subsequent creation of texture maps from the thin section
images in the lab is more effective and contains less uncertainty (i.e. no microlites to increase the
complexity of the image).
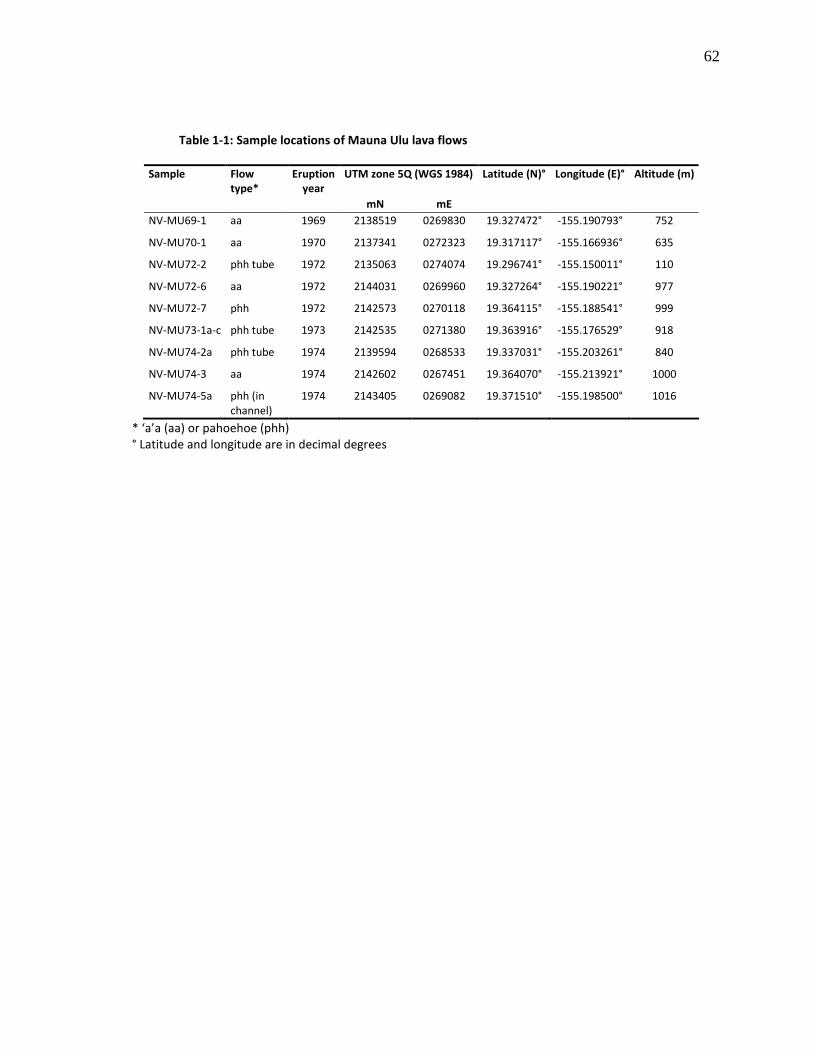
62
Table 1-1: Sample locations of Mauna Ulu lava flows
Sample Flow
type*
Eruption
year
UTM zone 5Q (WGS 1984) Latitude (N)° Longitude (E)° Altitude (m)
mN mE
NV-MU69-1 aa 1969 2138519 0269830 19.327472° -155.190793° 752
NV-MU70-1 aa 1970 2137341 0272323 19.317117° -155.166936° 635
NV-MU72-2 phh tube 1972 2135063 0274074 19.296741° -155.150011° 110
NV-MU72-6 aa 1972 2144031 0269960 19.327264° -155.190221° 977
NV-MU72-7 phh 1972 2142573 0270118 19.364115° -155.188541° 999
NV-MU73-1a-c phh tube 1973 2142535 0271380 19.363916° -155.176529° 918
NV-MU74-2a phh tube 1974 2139594 0268533 19.337031° -155.203261° 840
NV-MU74-3 aa 1974 2142602 0267451 19.364070° -155.213921° 1000
NV-MU74-5a phh (in channel)
1974 2143405 0269082 19.371510° -155.198500° 1016
* ‘a’a (aa) or pahoehoe (phh) ° Latitude and longitude are in decimal degrees
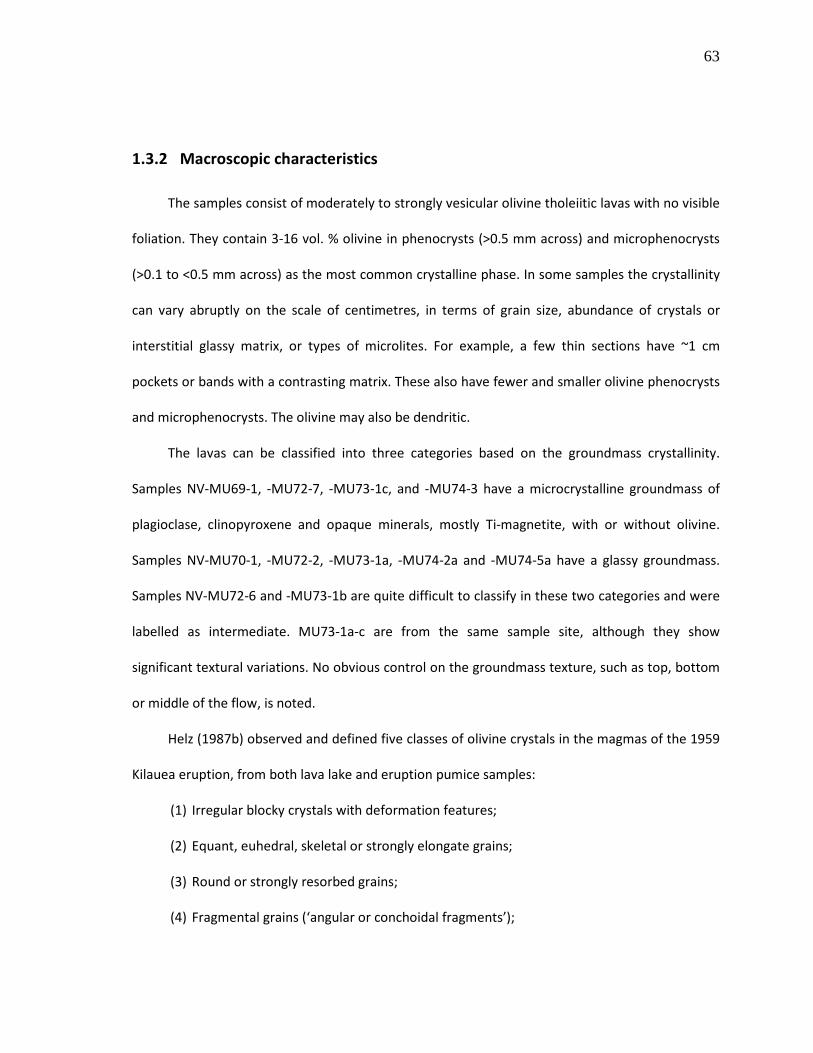
63
1.3.2 Macroscopic characteristics
The samples consist of moderately to strongly vesicular olivine tholeiitic lavas with no visible
foliation. They contain 3-16 vol. % olivine in phenocrysts (>0.5 mm across) and microphenocrysts
(>0.1 to <0.5 mm across) as the most common crystalline phase. In some samples the crystallinity
can vary abruptly on the scale of centimetres, in terms of grain size, abundance of crystals or
interstitial glassy matrix, or types of microlites. For example, a few thin sections have ~1 cm
pockets or bands with a contrasting matrix. These also have fewer and smaller olivine phenocrysts
and microphenocrysts. The olivine may also be dendritic.
The lavas can be classified into three categories based on the groundmass crystallinity.
Samples NV-MU69-1, -MU72-7, -MU73-1c, and -MU74-3 have a microcrystalline groundmass of
plagioclase, clinopyroxene and opaque minerals, mostly Ti-magnetite, with or without olivine.
Samples NV-MU70-1, -MU72-2, -MU73-1a, -MU74-2a and -MU74-5a have a glassy groundmass.
Samples NV-MU72-6 and -MU73-1b are quite difficult to classify in these two categories and were
labelled as intermediate. MU73-1a-c are from the same sample site, although they show
significant textural variations. No obvious control on the groundmass texture, such as top, bottom
or middle of the flow, is noted.
Helz (1987b) observed and defined five classes of olivine crystals in the magmas of the 1959
Kilauea eruption, from both lava lake and eruption pumice samples:
(1) Irregular blocky crystals with deformation features;
(2) Equant, euhedral, skeletal or strongly elongate grains;
(3) Round or strongly resorbed grains;
(4) Fragmental grains (‘angular or conchoidal fragments’);
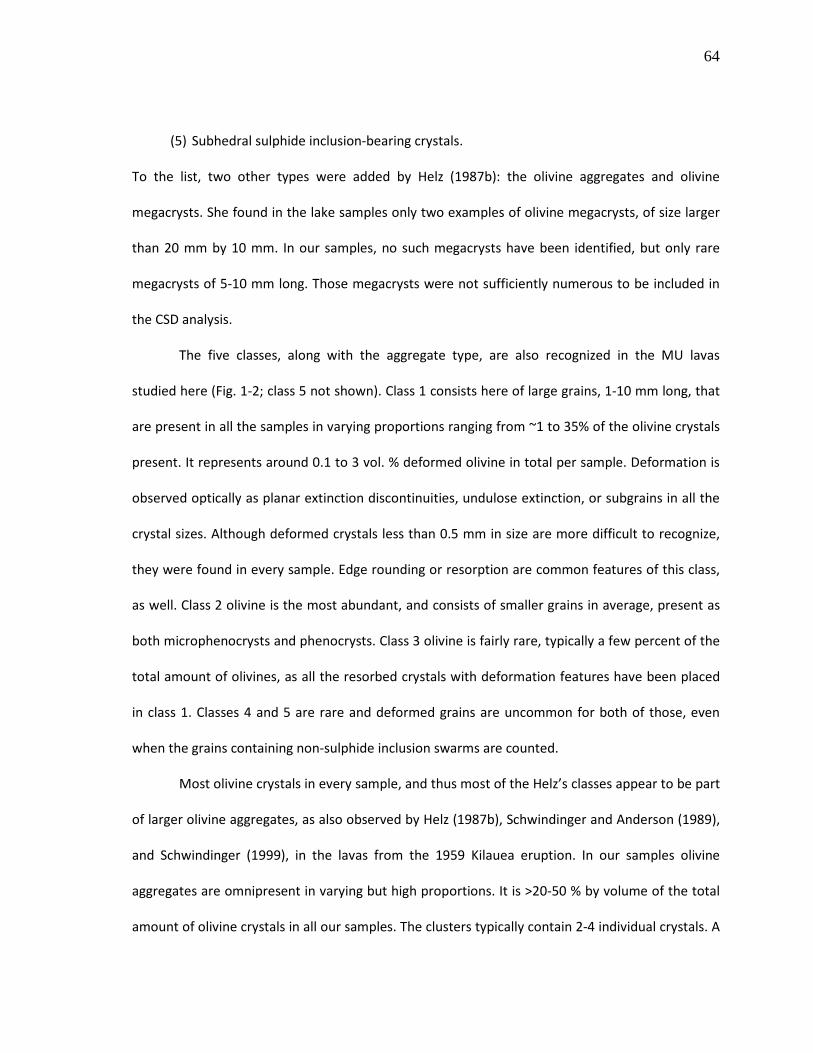
64
(5) Subhedral sulphide inclusion-bearing crystals.
To the list, two other types were added by Helz (1987b): the olivine aggregates and olivine
megacrysts. She found in the lake samples only two examples of olivine megacrysts, of size larger
than 20 mm by 10 mm. In our samples, no such megacrysts have been identified, but only rare
megacrysts of 5-10 mm long. Those megacrysts were not sufficiently numerous to be included in
the CSD analysis.
The five classes, along with the aggregate type, are also recognized in the MU lavas
studied here (Fig. 1-2; class 5 not shown). Class 1 consists here of large grains, 1-10 mm long, that
are present in all the samples in varying proportions ranging from ~1 to 35% of the olivine crystals
present. It represents around 0.1 to 3 vol. % deformed olivine in total per sample. Deformation is
observed optically as planar extinction discontinuities, undulose extinction, or subgrains in all the
crystal sizes. Although deformed crystals less than 0.5 mm in size are more difficult to recognize,
they were found in every sample. Edge rounding or resorption are common features of this class,
as well. Class 2 olivine is the most abundant, and consists of smaller grains in average, present as
both microphenocrysts and phenocrysts. Class 3 olivine is fairly rare, typically a few percent of the
total amount of olivines, as all the resorbed crystals with deformation features have been placed
in class 1. Classes 4 and 5 are rare and deformed grains are uncommon for both of those, even
when the grains containing non-sulphide inclusion swarms are counted.
Most olivine crystals in every sample, and thus most of the Helz’s classes appear to be part
of larger olivine aggregates, as also observed by Helz (1987b), Schwindinger and Anderson (1989),
and Schwindinger (1999), in the lavas from the 1959 Kilauea eruption. In our samples olivine
aggregates are omnipresent in varying but high proportions. It is >20-50 % by volume of the total
amount of olivine crystals in all our samples. The clusters typically contain 2-4 individual crystals. A
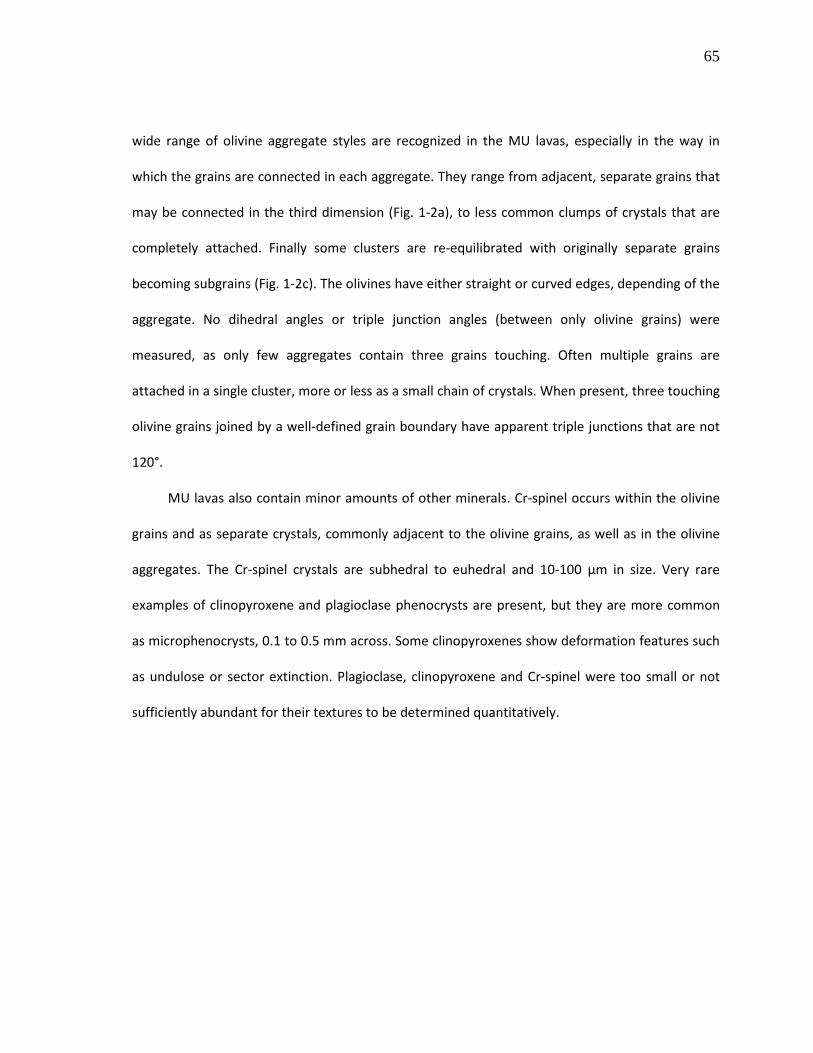
65
wide range of olivine aggregate styles are recognized in the MU lavas, especially in the way in
which the grains are connected in each aggregate. They range from adjacent, separate grains that
may be connected in the third dimension (Fig. 1-2a), to less common clumps of crystals that are
completely attached. Finally some clusters are re-equilibrated with originally separate grains
becoming subgrains (Fig. 1-2c). The olivines have either straight or curved edges, depending of the
aggregate. No dihedral angles or triple junction angles (between only olivine grains) were
measured, as only few aggregates contain three grains touching. Often multiple grains are
attached in a single cluster, more or less as a small chain of crystals. When present, three touching
olivine grains joined by a well-defined grain boundary have apparent triple junctions that are not
120°.
MU lavas also contain minor amounts of other minerals. Cr-spinel occurs within the olivine
grains and as separate crystals, commonly adjacent to the olivine grains, as well as in the olivine
aggregates. The Cr-spinel crystals are subhedral to euhedral and 10-100 µm in size. Very rare
examples of clinopyroxene and plagioclase phenocrysts are present, but they are more common
as microphenocrysts, 0.1 to 0.5 mm across. Some clinopyroxenes show deformation features such
as undulose or sector extinction. Plagioclase, clinopyroxene and Cr-spinel were too small or not
sufficiently abundant for their textures to be determined quantitatively.
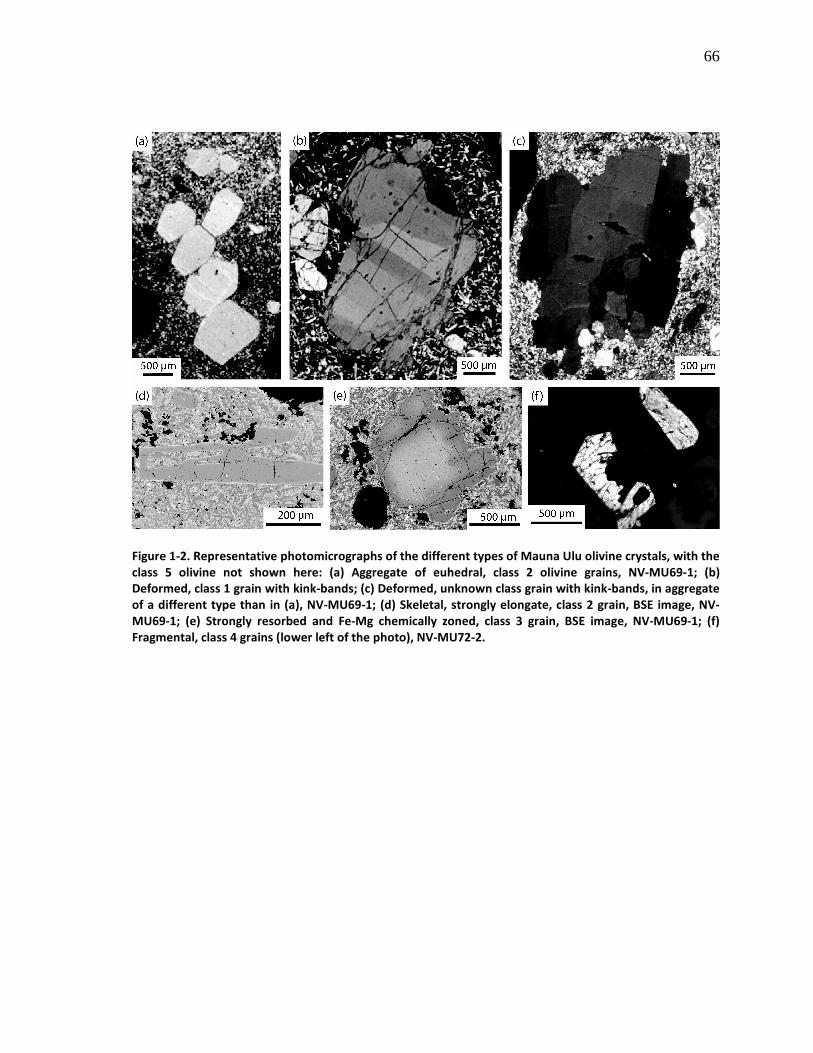
66
Figure 1-2. Representative photomicrographs of the different types of Mauna Ulu olivine crystals, with the
class 5 olivine not shown here: (a) Aggregate of euhedral, class 2 olivine grains, NV-MU69-1; (b)
Deformed, class 1 grain with kink-bands; (c) Deformed, unknown class grain with kink-bands, in aggregate
of a different type than in (a), NV-MU69-1; (d) Skeletal, strongly elongate, class 2 grain, BSE image, NV-
MU69-1; (e) Strongly resorbed and Fe-Mg chemically zoned, class 3 grain, BSE image, NV-MU69-1; (f)
Fragmental, class 4 grains (lower left of the photo), NV-MU72-2.
67
1.4 CHEMICAL STUDIES
1.4.1 Analytical methods
Olivine and glass major element compositions were measured in thin sections using the
five-spectrometer, Cameca SX-100 electron-microprobe at the Université Laval Microanalysis
Laboratory, Québec city, Canada. Both olivine and glass analyses were done at 15 kV and 20 nA
beam current, with a 5 µm spot size and using a wavelength dispersive spectra (WDS) mode. At
least one spot both in the core and the rim of each olivine was analyzed to check for compositional
zoning. Where the back-scattered electron (BSE) imagery showed the presence of complex zoning,
more points on the rim of the selected grain were analyzed. Whole-rock major and minor element
compositions were determined by X-ray fluorescence (XRF) spectrometry at the TEAL /
Geochemical Laboratories of McGill University, Montréal, Canada. The precision for element
analyses was better than 1% with the exception of SiO2, ≤0.5%.
1.4.2 Whole-rock geochemistry
1.4.2.1 Major elements
MgO contents of the MU samples range from 9.4 to 12.0% with a single sample at 16.2 wt %
(Table 1-2). With the exception of Fe2O3, all MU oxides display a negative linear trend when
plotted against MgO, with little scatter for Na2O, K2O and P2O5 (Fig. 1-3). A positive trend with
more scatter is observed for Fe2O3*.
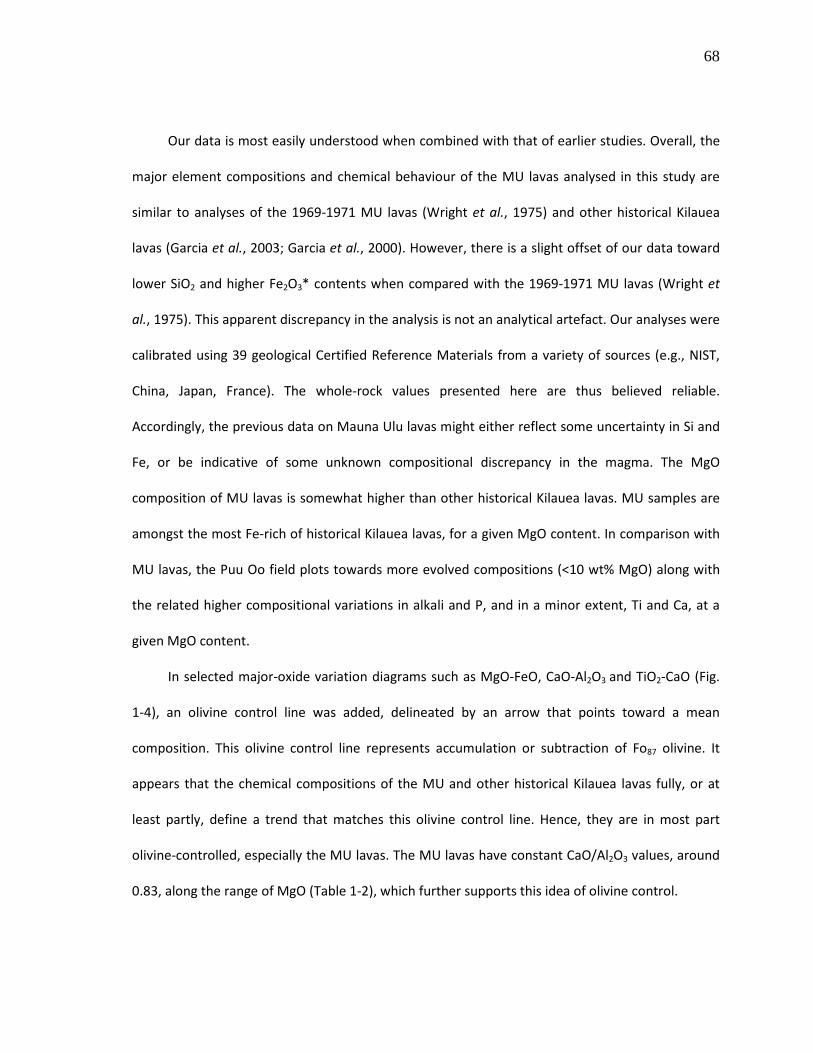
68
Our data is most easily understood when combined with that of earlier studies. Overall, the
major element compositions and chemical behaviour of the ΜU lavas analysed in this study are
similar to analyses of the 1969-1971 MU lavas (Wright et al., 1975) and other historical Kilauea
lavas (Garcia et al., 2003; Garcia et al., 2000). However, there is a slight offset of our data toward
lower SiO2 and higher Fe2O3* contents when compared with the 1969-1971 MU lavas (Wright et
al., 1975). This apparent discrepancy in the analysis is not an analytical artefact. Our analyses were
calibrated using 39 geological Certified Reference Materials from a variety of sources (e.g., NIST,
China, Japan, France). The whole-rock values presented here are thus believed reliable.
Accordingly, the previous data on Mauna Ulu lavas might either reflect some uncertainty in Si and
Fe, or be indicative of some unknown compositional discrepancy in the magma. The MgO
composition of MU lavas is somewhat higher than other historical Kilauea lavas. MU samples are
amongst the most Fe-rich of historical Kilauea lavas, for a given MgO content. In comparison with
MU lavas, the Puu Oo field plots towards more evolved compositions (<10 wt% MgO) along with
the related higher compositional variations in alkali and P, and in a minor extent, Ti and Ca, at a
given MgO content.
In selected major-oxide variation diagrams such as MgO-FeO, CaO-Al2O3 and TiO2-CaO (Fig.
1-4), an olivine control line was added, delineated by an arrow that points toward a mean
composition. This olivine control line represents accumulation or subtraction of Fo87 olivine. It
appears that the chemical compositions of the MU and other historical Kilauea lavas fully, or at
least partly, define a trend that matches this olivine control line. Hence, they are in most part
olivine-controlled, especially the MU lavas. The MU lavas have constant CaO/Al2O3 values, around
0.83, along the range of MgO (Table 1-2), which further supports this idea of olivine control.
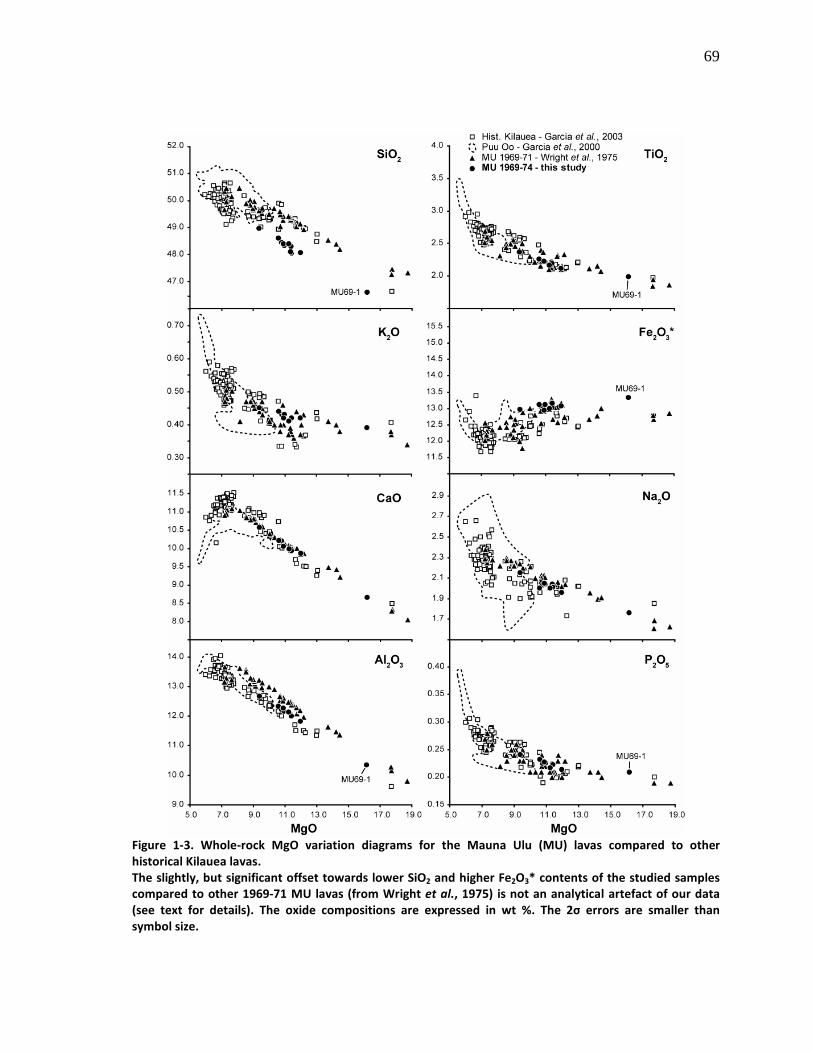
69
Figure 1-3. Whole-rock MgO variation diagrams for the Mauna Ulu (MU) lavas compared to other
historical Kilauea lavas.
The slightly, but significant offset towards lower SiO2 and higher Fe2O3* contents of the studied samples
compared to other 1969-71 MU lavas (from Wright et al., 1975) is not an analytical artefact of our data
(see text for details). The oxide compositions are expressed in wt %. The 2σ errors are smaller than
symbol size.
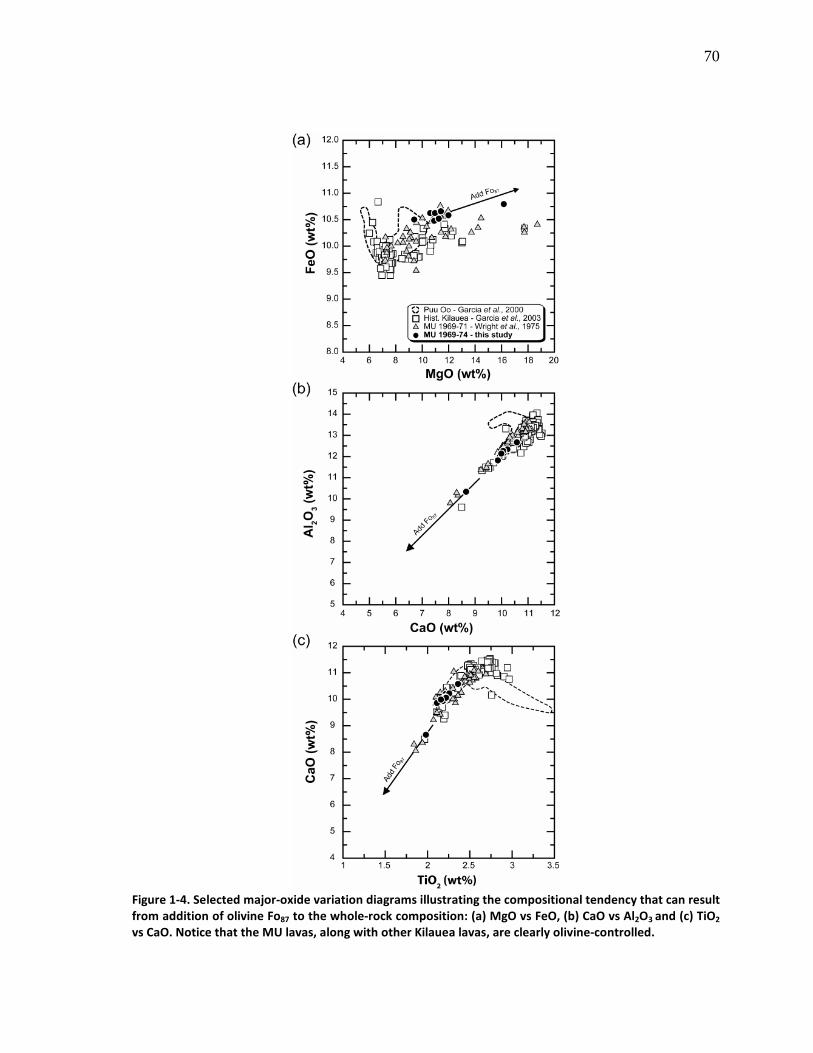
70
Figure 1-4. Selected major-oxide variation diagrams illustrating the compositional tendency that can result
from addition of olivine Fo87 to the whole-rock composition: (a) MgO vs FeO, (b) CaO vs Al2O3 and (c) TiO2
vs CaO. Notice that the MU lavas, along with other Kilauea lavas, are clearly olivine-controlled.
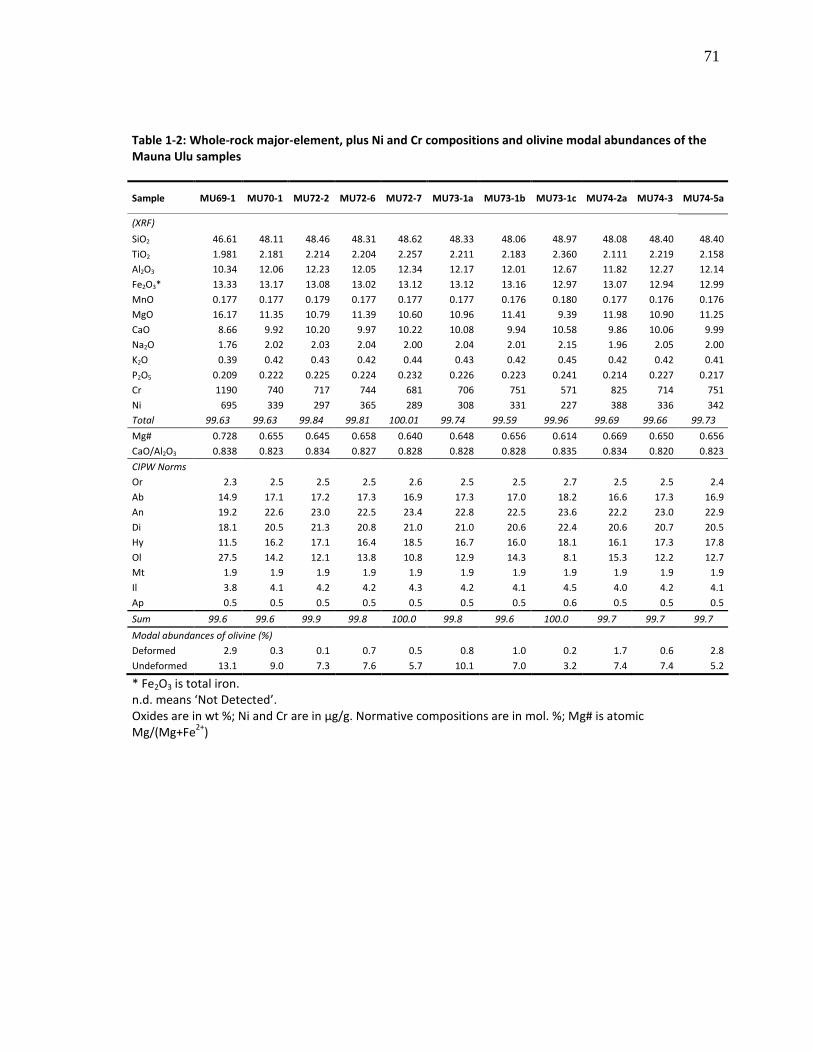
71
Table 1-2: Whole-rock major-element, plus Ni and Cr compositions and olivine modal abundances of the
Mauna Ulu samples
* Fe2O3 is total iron. n.d. means ‘Not Detected’. Oxides are in wt %; Ni and Cr are in µg/g. Normative compositions are in mol. %; Mg# is atomic Mg/(Mg+Fe
2+)
Sample MU69-1 MU70-1 MU72-2 MU72-6 MU72-7 MU73-1a MU73-1b MU73-1c MU74-2a MU74-3 MU74-5a
(XRF)
SiO2 46.61 48.11 48.46 48.31 48.62 48.33 48.06 48.97 48.08 48.40 48.40
TiO2 1.981 2.181 2.214 2.204 2.257 2.211 2.183 2.360 2.111 2.219 2.158
Al2O3 10.34 12.06 12.23 12.05 12.34 12.17 12.01 12.67 11.82 12.27 12.14
Fe2O3* 13.33 13.17 13.08 13.02 13.12 13.12 13.16 12.97 13.07 12.94 12.99
MnO 0.177 0.177 0.179 0.177 0.177 0.177 0.176 0.180 0.177 0.176 0.176
MgO 16.17 11.35 10.79 11.39 10.60 10.96 11.41 9.39 11.98 10.90 11.25
CaO 8.66 9.92 10.20 9.97 10.22 10.08 9.94 10.58 9.86 10.06 9.99
Na2O 1.76 2.02 2.03 2.04 2.00 2.04 2.01 2.15 1.96 2.05 2.00
K2O 0.39 0.42 0.43 0.42 0.44 0.43 0.42 0.45 0.42 0.42 0.41
P2O5 0.209 0.222 0.225 0.224 0.232 0.226 0.223 0.241 0.214 0.227 0.217
Cr 1190 740 717 744 681 706 751 571 825 714 751
Ni 695 339 297 365 289 308 331 227 388 336 342
Total 99.63 99.63 99.84 99.81 100.01 99.74 99.59 99.96 99.69 99.66 99.73
Mg# 0.728 0.655 0.645 0.658 0.640 0.648 0.656 0.614 0.669 0.650 0.656
CaO/Al2O3 0.838 0.823 0.834 0.827 0.828 0.828 0.828 0.835 0.834 0.820 0.823
CIPW Norms
Or 2.3 2.5 2.5 2.5 2.6 2.5 2.5 2.7 2.5 2.5 2.4
Ab 14.9 17.1 17.2 17.3 16.9 17.3 17.0 18.2 16.6 17.3 16.9
An 19.2 22.6 23.0 22.5 23.4 22.8 22.5 23.6 22.2 23.0 22.9
Di 18.1 20.5 21.3 20.8 21.0 21.0 20.6 22.4 20.6 20.7 20.5
Hy 11.5 16.2 17.1 16.4 18.5 16.7 16.0 18.1 16.1 17.3 17.8
Ol 27.5 14.2 12.1 13.8 10.8 12.9 14.3 8.1 15.3 12.2 12.7
Mt 1.9 1.9 1.9 1.9 1.9 1.9 1.9 1.9 1.9 1.9 1.9
Il 3.8 4.1 4.2 4.2 4.3 4.2 4.1 4.5 4.0 4.2 4.1
Ap 0.5 0.5 0.5 0.5 0.5 0.5 0.5 0.6 0.5 0.5 0.5
Sum 99.6 99.6 99.9 99.8 100.0 99.8 99.6 100.0 99.7 99.7 99.7
Modal abundances of olivine (%)
Deformed 2.9 0.3 0.1 0.7 0.5 0.8 1.0 0.2 1.7 0.6 2.8
Undeformed 13.1 9.0 7.3 7.6 5.7 10.1 7.0 3.2 7.4 7.4 5.2
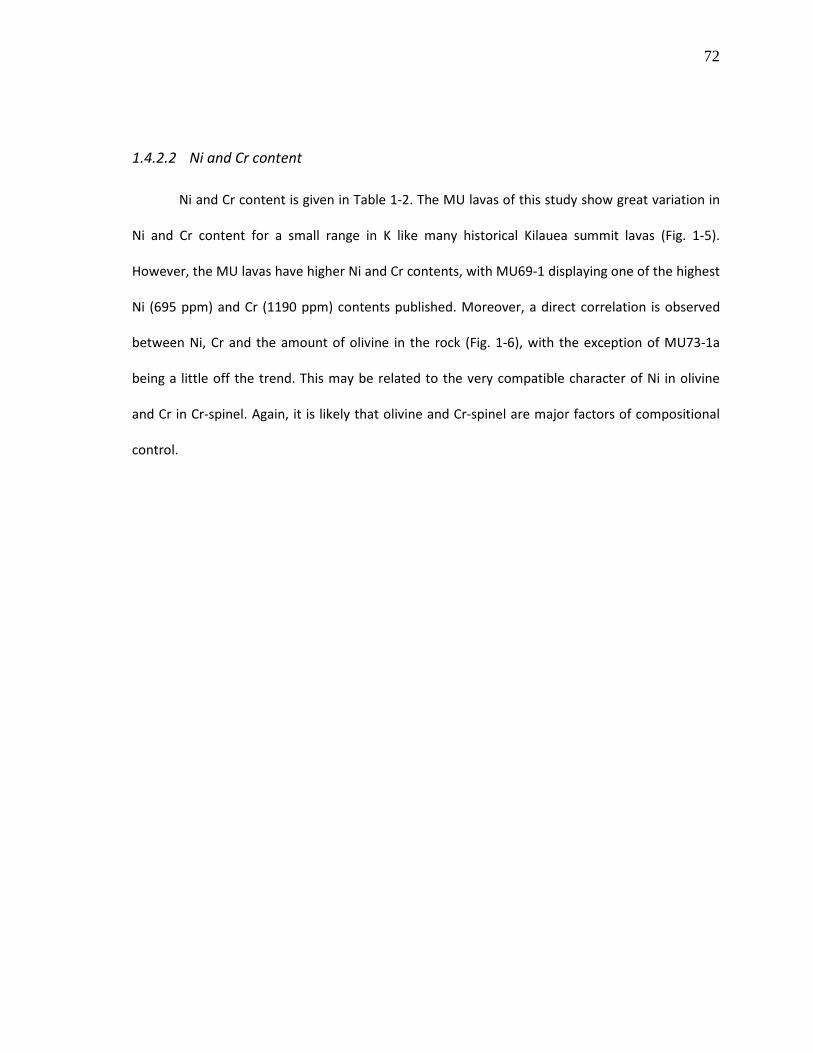
72
1.4.2.2 Ni and Cr content
Ni and Cr content is given in Table 1-2. The MU lavas of this study show great variation in
Ni and Cr content for a small range in K like many historical Kilauea summit lavas (Fig. 1-5).
However, the MU lavas have higher Ni and Cr contents, with MU69-1 displaying one of the highest
Ni (695 ppm) and Cr (1190 ppm) contents published. Moreover, a direct correlation is observed
between Ni, Cr and the amount of olivine in the rock (Fig. 1-6), with the exception of MU73-1a
being a little off the trend. This may be related to the very compatible character of Ni in olivine
and Cr in Cr-spinel. Again, it is likely that olivine and Cr-spinel are major factors of compositional
control.
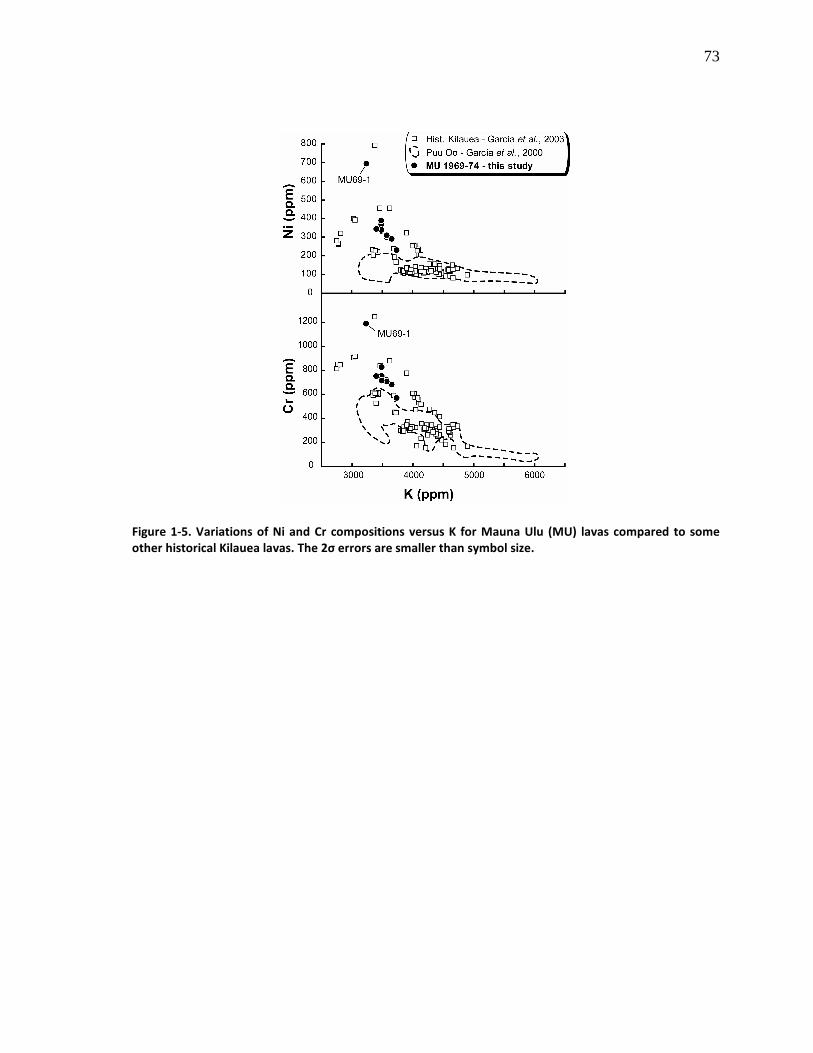
73
Figure 1-5. Variations of Ni and Cr compositions versus K for Mauna Ulu (MU) lavas compared to some
other historical Kilauea lavas. The 2σ errors are smaller than symbol size.
74
Figure 1-6. Ni and Cr whole-rock content versus olivine abundance for the Mauna Ulu lavas.
75
1.4.3 Olivine chemistry
Over 330 olivine phenocrysts and microphenocrysts were analysed from eleven MU
samples. All analyses were spot analyses; no line traverses were done. Olivines were analysed to
determine whether they were in equilibrium with their host magma and whether there was
compositional zoning. Although olivine can re-equilibrate rapidly at magmatic temperatures (e.g.
Roeder & Emslie, 1970; Ulmer, 1989), analyses of olivine can provide evidence of magma mixing,
crystal accumulation and other magmatic processes (e.g. Garcia, 1996).
The forsterite (Fo) content of the olivine cores in MU lavas ranges from 78.2 to 90.2 mol %
(Table 1-3). It seems that the highest Fo values generally increase with the whole-rock Mg-number
(Fig. 1-7), whereas the lower Fo values show no systematic relationship to Mg-number. The CaO
content of olivine is high to moderate and mildly increases from 0.20 to 0.35 wt % with a decrease
in Fo content. These CaO contents are typical of magmatic values and consistent with low pressure
crystallisation in the crust (Jurewicz & Watson, 1988; Kamenetsky et al., 2006; Simkin & Smith,
1970; Stormer, 1973; Thompson & Gibson, 2000). Mantle values are significantly lower (Fig. 1-8).
The NiO content ranges widely and shows a generally increasing trend from 0.16 to 0.51 wt % with
increasing Fo content.
Most of the olivine crystals show moderate to strong normal zoning from core to rim (Table
1-3; Fig. 1-9), the range of Fo variation is fairly wide. The typical Fo variation of normal zoning in all
the MU lavas is around 1-5% with a maximum of ~22% in MU69-1. Some crystals are unzoned,
while others are reversely zoned with a typical Fo difference of 2%, with a maximum variation of
up to ~9% in MU69-1. The reversed zone is only 10-50 µm wide. The core forsterite content of the
reversely zoned olivines ranges from ~78 to 86%. Many of these reversely zoned olivines are
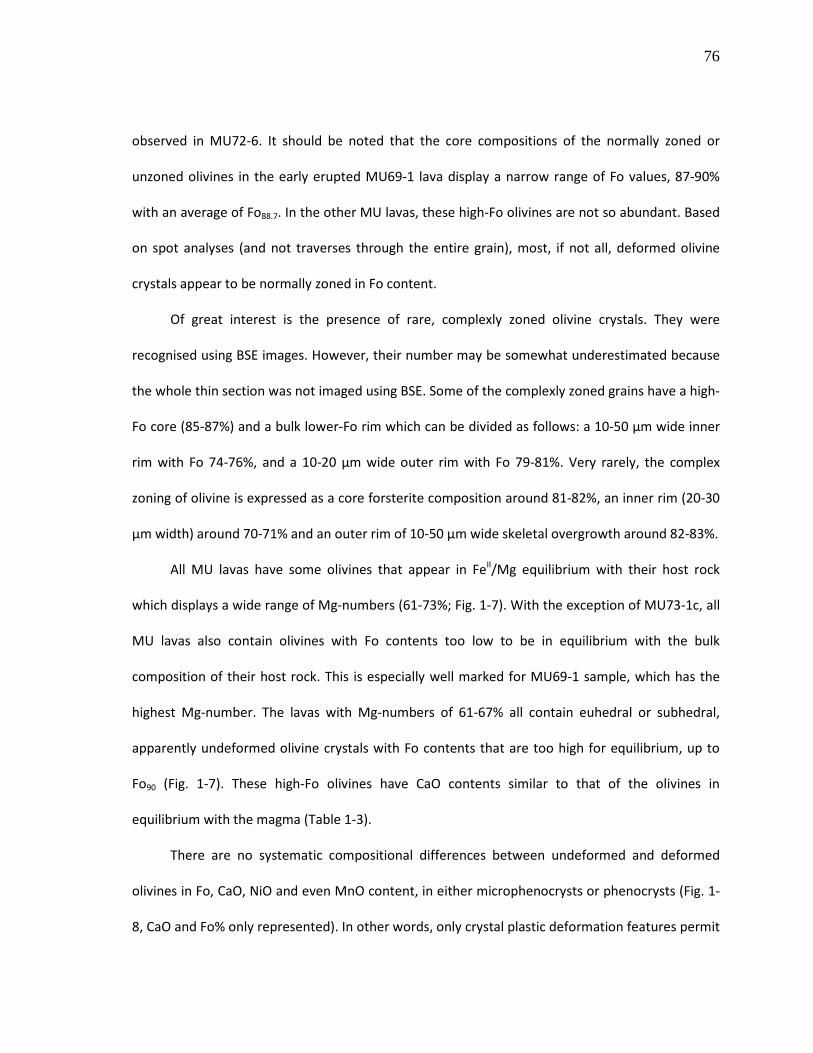
76
observed in MU72-6. It should be noted that the core compositions of the normally zoned or
unzoned olivines in the early erupted MU69-1 lava display a narrow range of Fo values, 87-90%
with an average of Fo88.7. In the other MU lavas, these high-Fo olivines are not so abundant. Based
on spot analyses (and not traverses through the entire grain), most, if not all, deformed olivine
crystals appear to be normally zoned in Fo content.
Of great interest is the presence of rare, complexly zoned olivine crystals. They were
recognised using BSE images. However, their number may be somewhat underestimated because
the whole thin section was not imaged using BSE. Some of the complexly zoned grains have a high-
Fo core (85-87%) and a bulk lower-Fo rim which can be divided as follows: a 10-50 µm wide inner
rim with Fo 74-76%, and a 10-20 µm wide outer rim with Fo 79-81%. Very rarely, the complex
zoning of olivine is expressed as a core forsterite composition around 81-82%, an inner rim (20-30
µm width) around 70-71% and an outer rim of 10-50 µm wide skeletal overgrowth around 82-83%.
All MU lavas have some olivines that appear in FeII/Mg equilibrium with their host rock
which displays a wide range of Mg-numbers (61-73%; Fig. 1-7). With the exception of MU73-1c, all
MU lavas also contain olivines with Fo contents too low to be in equilibrium with the bulk
composition of their host rock. This is especially well marked for MU69-1 sample, which has the
highest Mg-number. The lavas with Mg-numbers of 61-67% all contain euhedral or subhedral,
apparently undeformed olivine crystals with Fo contents that are too high for equilibrium, up to
Fo90 (Fig. 1-7). These high-Fo olivines have CaO contents similar to that of the olivines in
equilibrium with the magma (Table 1-3).
There are no systematic compositional differences between undeformed and deformed
olivines in Fo, CaO, NiO and even MnO content, in either microphenocrysts or phenocrysts (Fig. 1-
8, CaO and Fo% only represented). In other words, only crystal plastic deformation features permit

77
us to distinguish the deformed crystals from the undeformed ones. This is in agreement with
previous findings from lavas from the Hawaii Scientific Drilling Project (Garcia, 1996) and from
other olivine-rich lavas (Norman & Garcia, 1999; Wilkinson & Hensel, 1988).
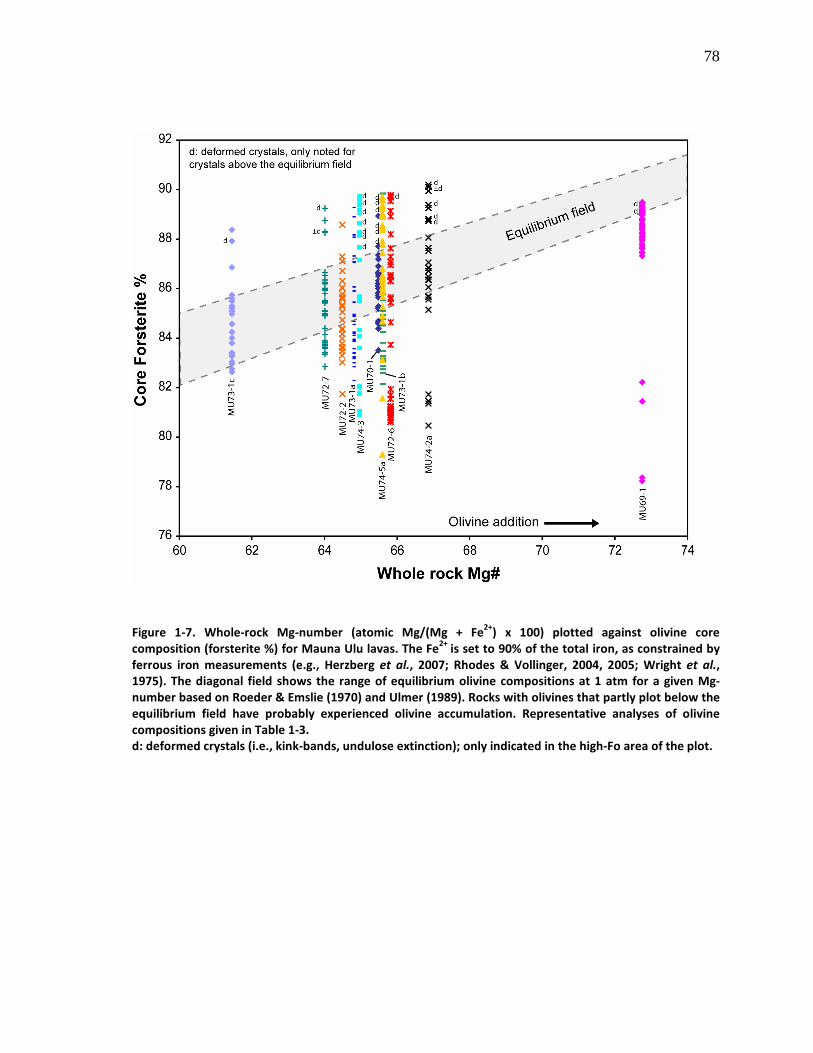
78
Figure 1-7. Whole-rock Mg-number (atomic Mg/(Mg + Fe
2+) x 100) plotted against olivine core
composition (forsterite %) for Mauna Ulu lavas. The Fe2+
is set to 90% of the total iron, as constrained by
ferrous iron measurements (e.g., Herzberg et al., 2007; Rhodes & Vollinger, 2004, 2005; Wright et al.,
1975). The diagonal field shows the range of equilibrium olivine compositions at 1 atm for a given Mg-
number based on Roeder & Emslie (1970) and Ulmer (1989). Rocks with olivines that partly plot below the
equilibrium field have probably experienced olivine accumulation. Representative analyses of olivine
compositions given in Table 1-3.
d: deformed crystals (i.e., kink-bands, undulose extinction); only indicated in the high-Fo area of the plot.
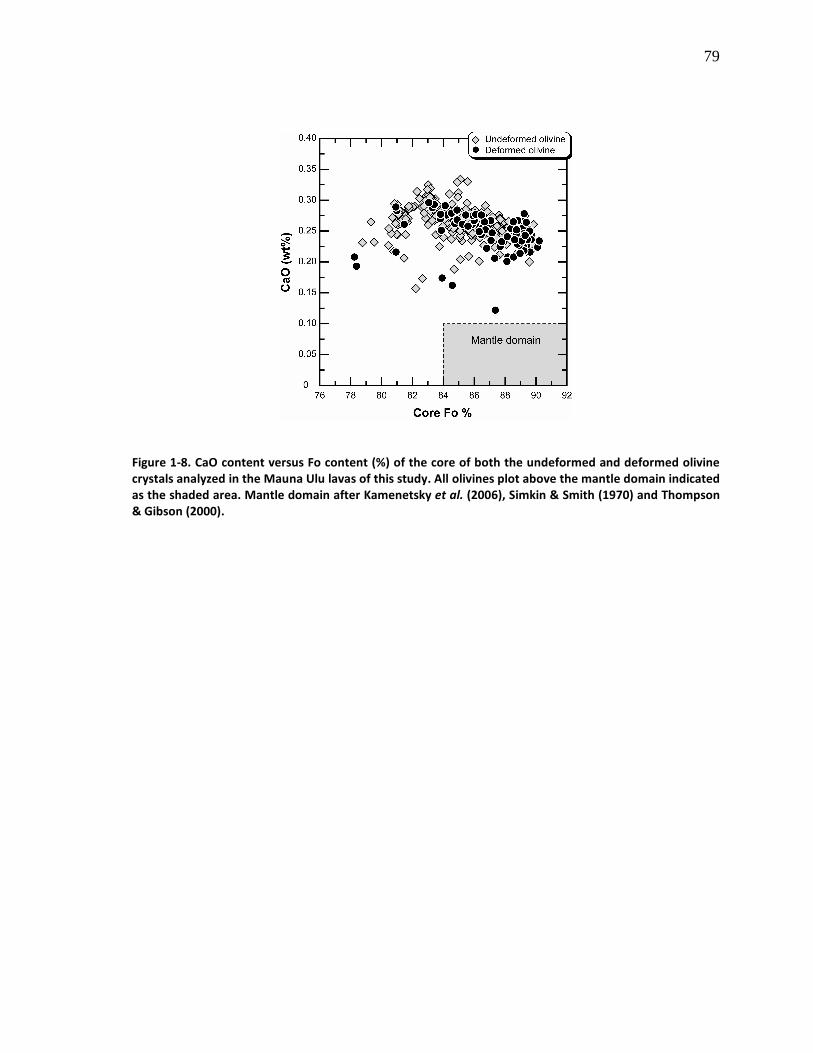
79
Figure 1-8. CaO content versus Fo content (%) of the core of both the undeformed and deformed olivine
crystals analyzed in the Mauna Ulu lavas of this study. All olivines plot above the mantle domain indicated
as the shaded area. Mantle domain after Kamenetsky et al. (2006), Simkin & Smith (1970) and Thompson
& Gibson (2000).
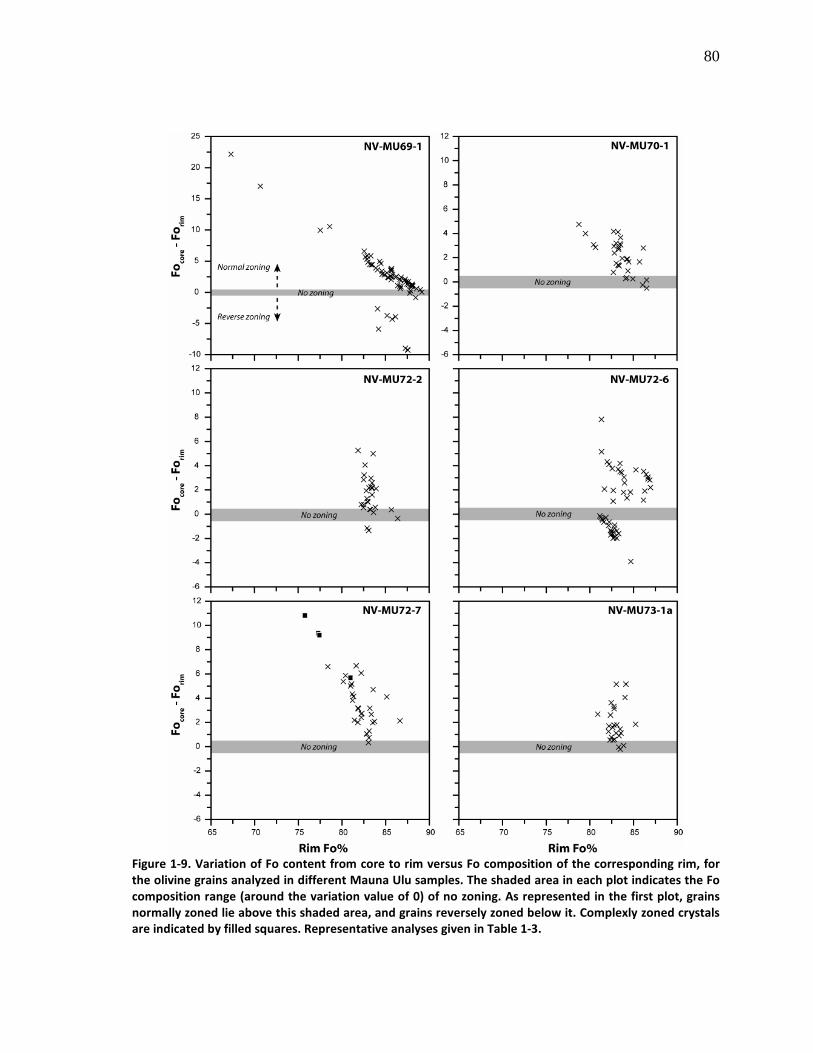
80
Figure 1-9. Variation of Fo content from core to rim versus Fo composition of the corresponding rim, for
the olivine grains analyzed in different Mauna Ulu samples. The shaded area in each plot indicates the Fo
composition range (around the variation value of 0) of no zoning. As represented in the first plot, grains
normally zoned lie above this shaded area, and grains reversely zoned below it. Complexly zoned crystals
are indicated by filled squares. Representative analyses given in Table 1-3.
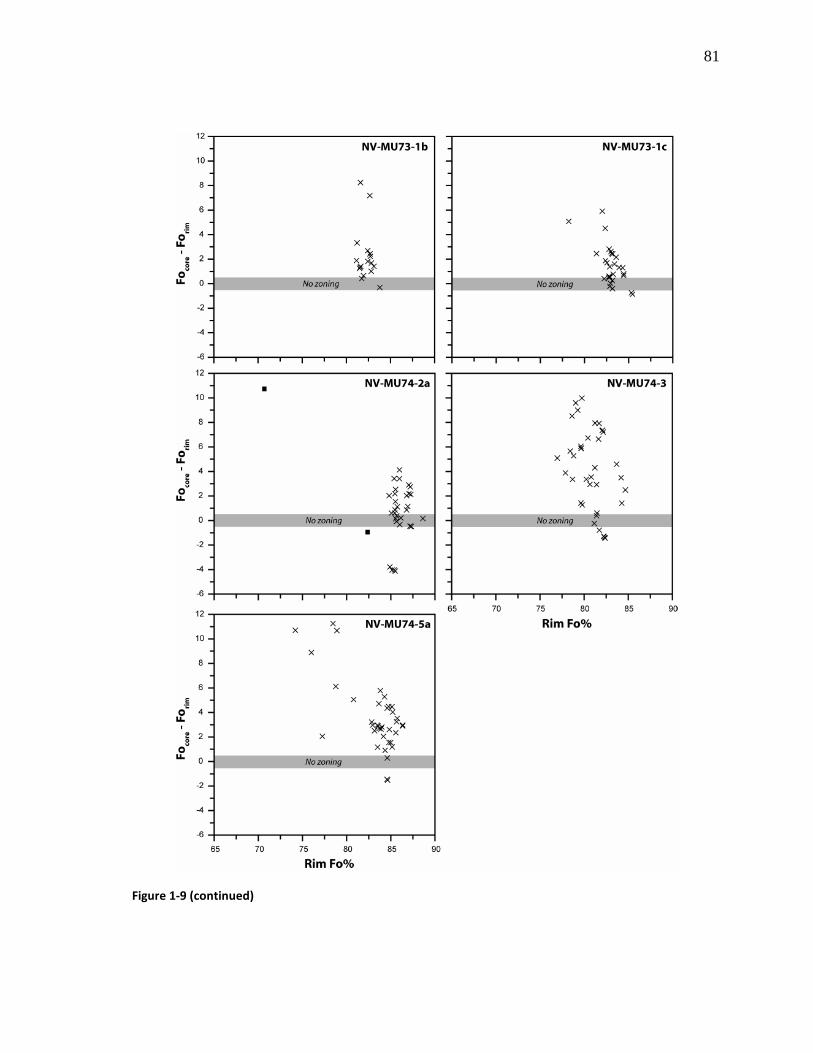
81
Figure 1-9 (continued)
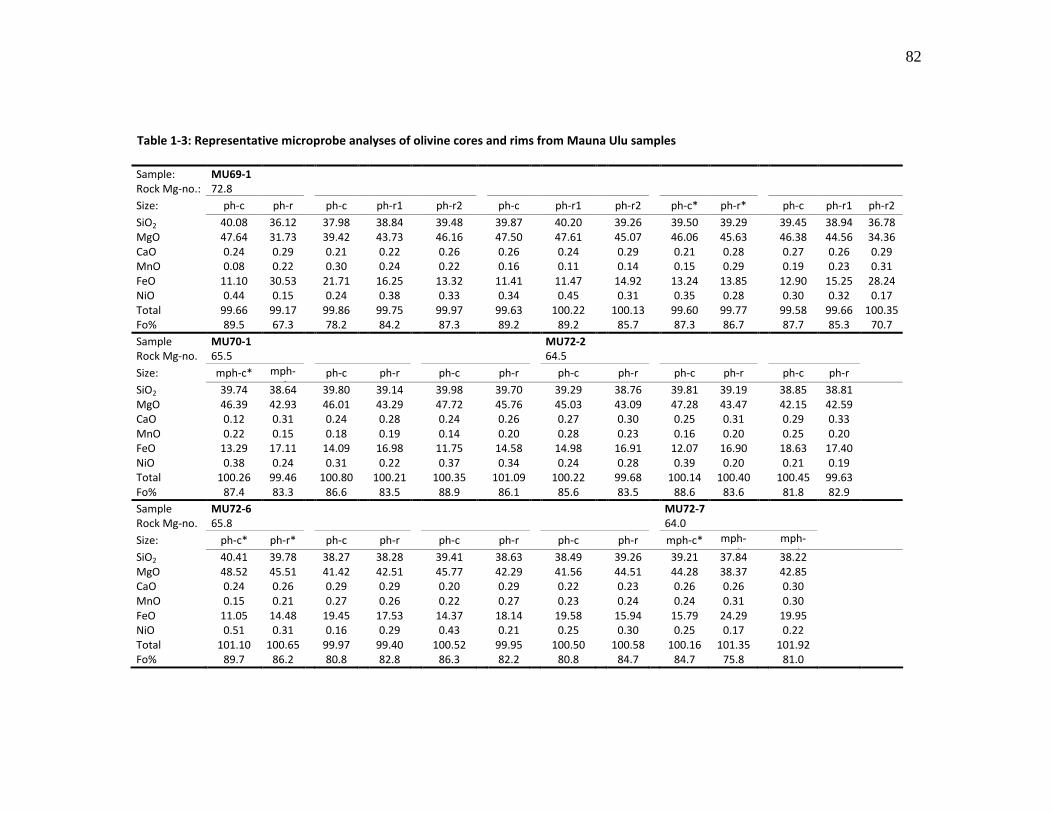
82
Table 1-3: Representative microprobe analyses of olivine cores and rims from Mauna Ulu samples
Sample: MU69-1 Rock Mg-no.: 72.8
Size: ph-c ph-r ph-c ph-r1 ph-r2 ph-c ph-r1 ph-r2 ph-c* ph-r* ph-c ph-r1 ph-r2
SiO2 40.08 36.12 37.98 38.84 39.48 39.87 40.20 39.26 39.50 39.29 39.45 38.94 36.78 MgO 47.64 31.73 39.42 43.73 46.16 47.50 47.61 45.07 46.06 45.63 46.38 44.56 34.36 CaO 0.24 0.29 0.21 0.22 0.26 0.26 0.24 0.29 0.21 0.28 0.27 0.26 0.29 MnO 0.08 0.22 0.30 0.24 0.22 0.16 0.11 0.14 0.15 0.29 0.19 0.23 0.31 FeO 11.10 30.53 21.71 16.25 13.32 11.41 11.47 14.92 13.24 13.85 12.90 15.25 28.24 NiO 0.44 0.15 0.24 0.38 0.33 0.34 0.45 0.31 0.35 0.28 0.30 0.32 0.17 Total 99.66 99.17 99.86 99.75 99.97 99.63 100.22 100.13 99.60 99.77 99.58 99.66 100.35 Fo% 89.5 67.3 78.2 84.2 87.3 89.2 89.2 85.7 87.3 86.7 87.7 85.3 70.7
Sample MU70-1 MU72-2 Rock Mg-no. 65.5 64.5
Size: mph-c* mph-r*
ph-c ph-r ph-c ph-r ph-c ph-r ph-c ph-r ph-c ph-r
SiO2 39.74 38.64 39.80 39.14 39.98 39.70 39.29 38.76 39.81 39.19 38.85 38.81 MgO 46.39 42.93 46.01 43.29 47.72 45.76 45.03 43.09 47.28 43.47 42.15 42.59 CaO 0.12 0.31 0.24 0.28 0.24 0.26 0.27 0.30 0.25 0.31 0.29 0.33 MnO 0.22 0.15 0.18 0.19 0.14 0.20 0.28 0.23 0.16 0.20 0.25 0.20 FeO 13.29 17.11 14.09 16.98 11.75 14.58 14.98 16.91 12.07 16.90 18.63 17.40 NiO 0.38 0.24 0.31 0.22 0.37 0.34 0.24 0.28 0.39 0.20 0.21 0.19 Total 100.26 99.46 100.80 100.21 100.35 101.09 100.22 99.68 100.14 100.40 100.45 99.63 Fo% 87.4 83.3 86.6 83.5 88.9 86.1 85.6 83.5 88.6 83.6 81.8 82.9
Sample MU72-6 MU72-7 Rock Mg-no. 65.8 64.0
Size: ph-c* ph-r* ph-c ph-r ph-c ph-r ph-c ph-r mph-c* mph-r1*
mph-r2*
SiO2 40.41 39.78 38.27 38.28 39.41 38.63 38.49 39.26 39.21 37.84 38.22 MgO 48.52 45.51 41.42 42.51 45.77 42.29 41.56 44.51 44.28 38.37 42.85 CaO 0.24 0.26 0.29 0.29 0.20 0.29 0.22 0.23 0.26 0.26 0.30 MnO 0.15 0.21 0.27 0.26 0.22 0.27 0.23 0.24 0.24 0.31 0.30 FeO 11.05 14.48 19.45 17.53 14.37 18.14 19.58 15.94 15.79 24.29 19.95 NiO 0.51 0.31 0.16 0.29 0.43 0.21 0.25 0.30 0.25 0.17 0.22 Total 101.10 100.65 99.97 99.40 100.52 99.95 100.50 100.58 100.16 101.35 101.92 Fo% 89.7 86.2 80.8 82.8 86.3 82.2 80.8 84.7 84.7 75.8 81.0
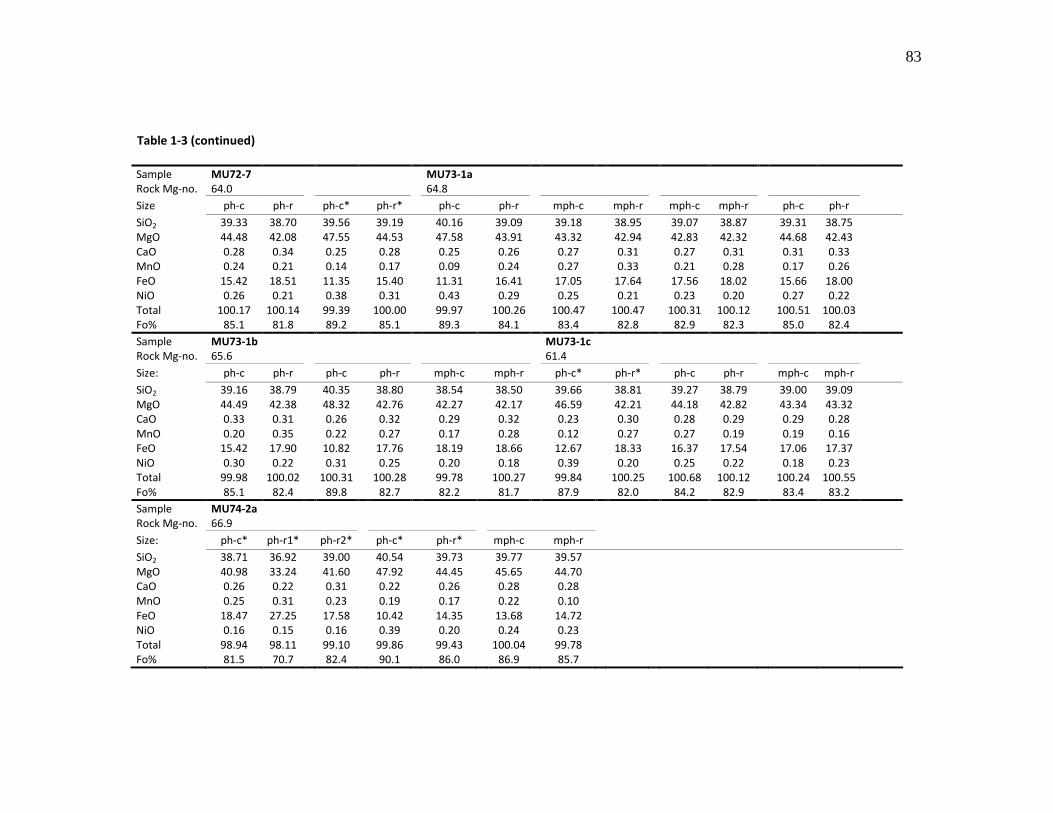
83
Table 1-3 (continued)
Sample MU72-7 MU73-1a Rock Mg-no. 64.0 64.8
Size ph-c ph-r ph-c* ph-r* ph-c ph-r mph-c mph-r mph-c mph-r ph-c ph-r
SiO2 39.33 38.70 39.56 39.19 40.16 39.09 39.18 38.95 39.07 38.87 39.31 38.75 MgO 44.48 42.08 47.55 44.53 47.58 43.91 43.32 42.94 42.83 42.32 44.68 42.43 CaO 0.28 0.34 0.25 0.28 0.25 0.26 0.27 0.31 0.27 0.31 0.31 0.33 MnO 0.24 0.21 0.14 0.17 0.09 0.24 0.27 0.33 0.21 0.28 0.17 0.26 FeO 15.42 18.51 11.35 15.40 11.31 16.41 17.05 17.64 17.56 18.02 15.66 18.00 NiO 0.26 0.21 0.38 0.31 0.43 0.29 0.25 0.21 0.23 0.20 0.27 0.22 Total 100.17 100.14 99.39 100.00 99.97 100.26 100.47 100.47 100.31 100.12 100.51 100.03 Fo% 85.1 81.8 89.2 85.1 89.3 84.1 83.4 82.8 82.9 82.3 85.0 82.4
Sample MU73-1b MU73-1c Rock Mg-no. 65.6 61.4
Size: ph-c ph-r ph-c ph-r mph-c mph-r ph-c* ph-r* ph-c ph-r mph-c mph-r
SiO2 39.16 38.79 40.35 38.80 38.54 38.50 39.66 38.81 39.27 38.79 39.00 39.09 MgO 44.49 42.38 48.32 42.76 42.27 42.17 46.59 42.21 44.18 42.82 43.34 43.32 CaO 0.33 0.31 0.26 0.32 0.29 0.32 0.23 0.30 0.28 0.29 0.29 0.28 MnO 0.20 0.35 0.22 0.27 0.17 0.28 0.12 0.27 0.27 0.19 0.19 0.16 FeO 15.42 17.90 10.82 17.76 18.19 18.66 12.67 18.33 16.37 17.54 17.06 17.37 NiO 0.30 0.22 0.31 0.25 0.20 0.18 0.39 0.20 0.25 0.22 0.18 0.23 Total 99.98 100.02 100.31 100.28 99.78 100.27 99.84 100.25 100.68 100.12 100.24 100.55 Fo% 85.1 82.4 89.8 82.7 82.2 81.7 87.9 82.0 84.2 82.9 83.4 83.2
Sample MU74-2a Rock Mg-no. 66.9
Size: ph-c* ph-r1* ph-r2* ph-c* ph-r* mph-c mph-r
SiO2 38.71 36.92 39.00 40.54 39.73 39.77 39.57 MgO 40.98 33.24 41.60 47.92 44.45 45.65 44.70 CaO 0.26 0.22 0.31 0.22 0.26 0.28 0.28 MnO 0.25 0.31 0.23 0.19 0.17 0.22 0.10 FeO 18.47 27.25 17.58 10.42 14.35 13.68 14.72 NiO 0.16 0.15 0.16 0.39 0.20 0.24 0.23 Total 98.94 98.11 99.10 99.86 99.43 100.04 99.78 Fo% 81.5 70.7 82.4 90.1 86.0 86.9 85.7
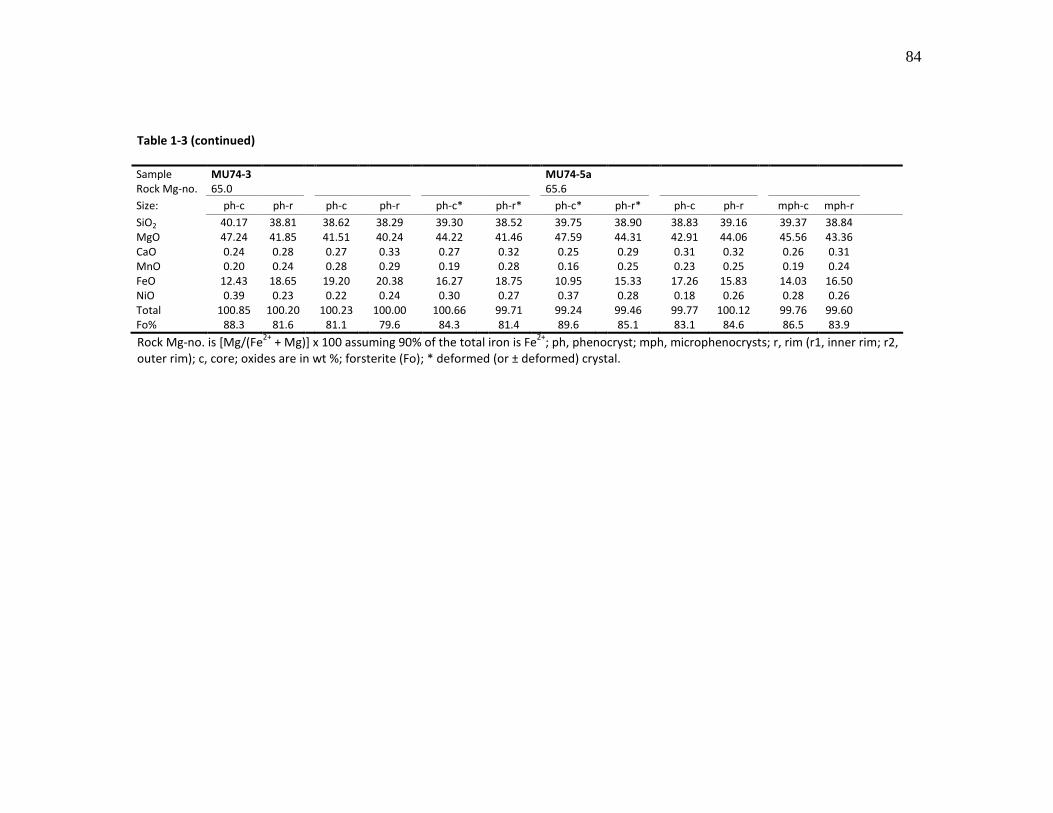
84
Table 1-3 (continued)
Sample MU74-3 MU74-5a Rock Mg-no. 65.0 65.6
Size: ph-c ph-r ph-c ph-r ph-c* ph-r* ph-c* ph-r* ph-c ph-r mph-c mph-r
SiO2 40.17 38.81 38.62 38.29 39.30 38.52 39.75 38.90 38.83 39.16 39.37 38.84 MgO 47.24 41.85 41.51 40.24 44.22 41.46 47.59 44.31 42.91 44.06 45.56 43.36 CaO 0.24 0.28 0.27 0.33 0.27 0.32 0.25 0.29 0.31 0.32 0.26 0.31 MnO 0.20 0.24 0.28 0.29 0.19 0.28 0.16 0.25 0.23 0.25 0.19 0.24 FeO 12.43 18.65 19.20 20.38 16.27 18.75 10.95 15.33 17.26 15.83 14.03 16.50 NiO 0.39 0.23 0.22 0.24 0.30 0.27 0.37 0.28 0.18 0.26 0.28 0.26 Total 100.85 100.20 100.23 100.00 100.66 99.71 99.24 99.46 99.77 100.12 99.76 99.60 Fo% 88.3 81.6 81.1 79.6 84.3 81.4 89.6 85.1 83.1 84.6 86.5 83.9
Rock Mg-no. is [Mg/(Fe2+
+ Mg)] x 100 assuming 90% of the total iron is Fe2+
; ph, phenocryst; mph, microphenocrysts; r, rim (r1, inner rim; r2, outer rim); c, core; oxides are in wt %; forsterite (Fo); * deformed (or ± deformed) crystal.
85
1.5 QUANTITATIVE TEXTURAL MEASUREMENTS: CRYSTAL SIZE DISTRIBUTION
(CSD)
1.5.1 CSD theory
The CSD analysis of a rock is a quantitative measure of the number of crystals of a mineral
phase per unit volume in intervals of fixed size (Higgins, 2006a). CSD theory was initially developed
in chemical engineering by Randolph & Larson (1971), among others, for understanding industrial
crystallisation processes, and then applied to magmatic systems by Marsh (1988). Since then a
number of studies have focused on the quantification of crystal populations in rocks using
advanced textural analysis techniques (Jerram & Kent, 2006).
Marsh (1988, 1998) proposed two distinct CSD end-member models for igneous systems: (1)
an open-system, steady-state model, and (2) a closed-system, batch model. The Marsh steady-
state model describes an open system where there is balance between the number of crystals that
nucleated and grew in the magma and the loss or gain of grains due to further mechanisms of
transport (e.g., fractionation, mixing). Such an ideal system may be represented by a continuously
tapped and refilled magma chamber, tapping and refilling occurring at the same rate. The
continuous crystallisation typically results in a straight, or log-linear, CSD plot with a negative slope
on a graph of ln(population density) versus size, as described by the equation
−°=τG
Lnn exp.
Where n is the population density (mm-4), n° is the nucleation density and represents the intercept
on the y-axis, G is the mean crystal growth rate (mm/s), τ is the mean crystal growth time or
86
crystal residence time, and L is the crystal size (maximum length; mm). G and the nucleation rate
are assumed to be constant. G is independent of L. One unique CSD exists in constant conditions.
Log-linear or near log-linear CSDs are common in igneous rocks (Marsh, 1998).
In a closed-system batch model (Marsh, 1998), there is no input or output of crystals, and
therefore the volume proportion of crystallizing magma decreases with time. With exponentially
increasing nucleation rates and a constant growth rate, closed systems can also produce straight
CSDs. The Makaopuhi lava lake, Kilauea, is an example of this in a volcanic system (Cashman &
Marsh, 1988).
Marsh (1998) noted that CSDs from a wide range of igneous settings do not show typical
steady-state or batch behaviour, but reflect hybrid aspects of the two end-member models. He
also argued that CSDs in comagmatic sequences do not closely resemble CSDs expected in either
batch or open systems, but seem to reflect the dynamic regime of the system. Hence, the steady-
state model should be applied to near-surface crystallisation, and the batch model to
crystallisation within a deep-seated cumulate body. The steady-state model is employed in this
study as an overall proxy for quantifying most magma processes, since it yields effective values of
crystal growth times and nucleation rates (J) from this commonly used CSD model (Marsh, 1988,
1998). These quantitative parameters may be extracted from the slope and intercept of a log-
linear CSD plot:
τGSlope
1−= and G
JIntercept = .
In an open-system end-member model, a straight or log-linear CSD might be the result of
simple crystal nucleation and growth processes, and referred to as a kinetic texture (e.g. Higgins,
2006a). Nucleation and growth rates are controlled by the magnitude of the crystallisation driving
87
force. Variations in temperature and pressure will change the driving force of crystallisation. A
decrease in temperature causes the appearance of a family of straight lines with the same slope
but different intercepts (i.e. different nucleation densities) on a classic CSD diagram (Fig. 1-10a).
An increase in residence time and a constant growth rate will favour an increase in larger crystals
and hence a change in the CSD slope, but no change in the intercept (Fig. 1-10b).
Kinking or curvature in the CSD plot profile (Fig. 1-10c-e) has been attributed to processes
such as crystal accumulation and fractionation (Marsh, 1998), compaction and compaction-driven
recrystallisation (e.g. Boorman et al., 2004), mixing of crystal populations or magmas (e.g. Higgins,
1996; Higgins & Roberge, 2007; Jerram et al., 2003), textural coarsening (= Ostwald ripening) (e.g.
Higgins, 2002b; Higgins & Roberge, 2003), and variation of cooling rate during ascent and
emplacement of magma (e.g. Armienti et al., 1994).

88
Figure 1-10. Schematic examples of processes that can influence the shape of the CSD (after Higgins,
2006a): (a) Increase in undercooling (or saturation); (b) Increase in residence time or growth rate; (c)
Accumulation and fractionation of crystals; (d) Coarsening; (e) Magma mixing (or mixing of two crystal
populations).
89
1.5.2 Analytical methods
To determine olivine CSDs, we stitched together high-resolution photomicrographs of each
thin section to make a single image of each thin section (Fig. 1-11). Subsequently, individual
crystals were identified and outlined by using a polarizing microscope and a vector graphics editor.
Effort was made to outline and measure separately each individual crystal in a cluster. In addition,
all optically discernible deformed grains were outlined in a separate layer in order to compare the
CSDs of undeformed versus total olivine populations (Fig. 1-11b). The digitized olivine texture
images were then edited into simple greyscale compressed tiff format before importing into the
software ImageJ (Image Processing and Analysis in Java). Area, orientation and length of major
and minor axes of a best fitted ellipse to crystal outlines were measured.
We measured 360 to >1000 olivine crystals in each thin section. Crystal size ranges are
presented in Table 1-4. Intersection data based on the major axis of the fitted ellipse determined
with ImageJ were converted to 3-D CSDs using the program CSDCorrections 1.37 (Higgins, 2000,
2002a; Higgins, 2006a). Logarithmic length intervals were used, with each bin 100.2 times the size
of the previous bin. There were no gaps in the CSDs; all bins contained crystals. Bins with less than
three crystals were removed from the CSD analysis as not significant. The lower limit of the CSD
was 0.05 mm, the smallest crystal that could be measured consistently and not the smallest crystal
in the rock.
To calculate CSDs from 2-D intersection measurements using CSDCorrections 1.37, we
needed to specify the mean crystal shape as expressed by the crystal aspect ratio S:I:L
(short:intermediate:long dimensions). These aspect ratios were objectively estimated for each thin
section, following Morgan & Jerram’s (2006) method and their extensive database CSDSlice. A bulk
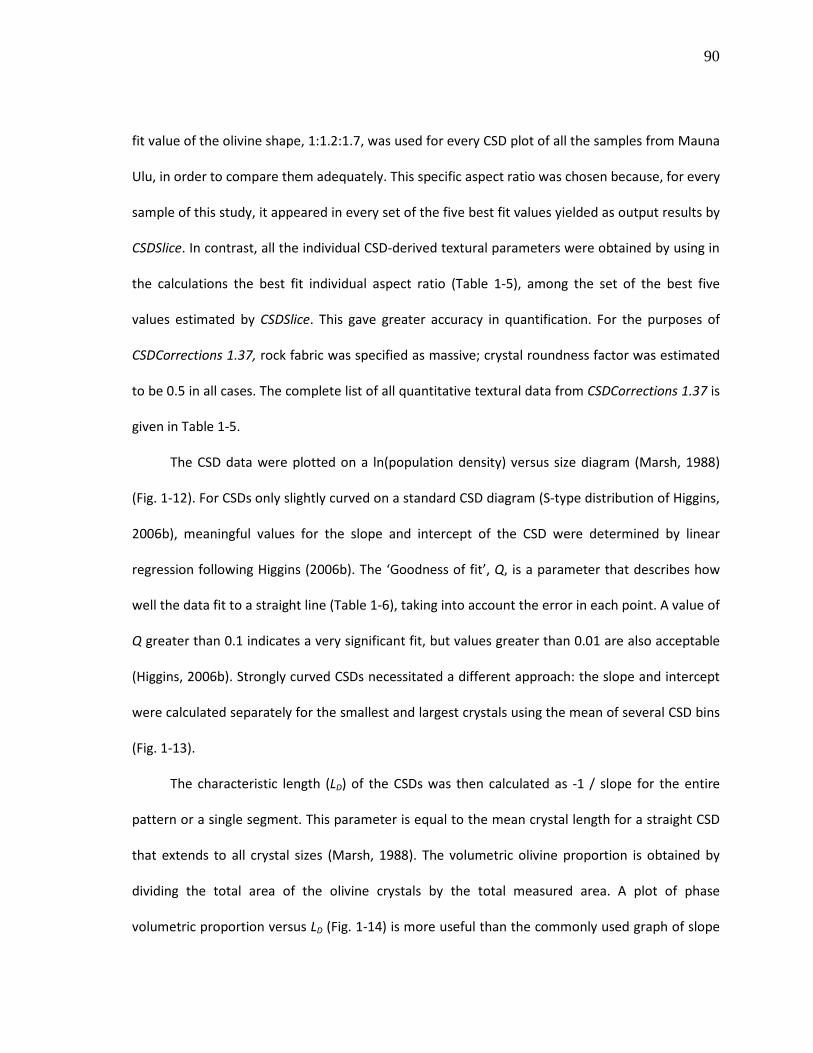
90
fit value of the olivine shape, 1:1.2:1.7, was used for every CSD plot of all the samples from Mauna
Ulu, in order to compare them adequately. This specific aspect ratio was chosen because, for every
sample of this study, it appeared in every set of the five best fit values yielded as output results by
CSDSlice. In contrast, all the individual CSD-derived textural parameters were obtained by using in
the calculations the best fit individual aspect ratio (Table 1-5), among the set of the best five
values estimated by CSDSlice. This gave greater accuracy in quantification. For the purposes of
CSDCorrections 1.37, rock fabric was specified as massive; crystal roundness factor was estimated
to be 0.5 in all cases. The complete list of all quantitative textural data from CSDCorrections 1.37 is
given in Table 1-5.
The CSD data were plotted on a ln(population density) versus size diagram (Marsh, 1988)
(Fig. 1-12). For CSDs only slightly curved on a standard CSD diagram (S-type distribution of Higgins,
2006b), meaningful values for the slope and intercept of the CSD were determined by linear
regression following Higgins (2006b). The ‘Goodness of fit’, Q, is a parameter that describes how
well the data fit to a straight line (Table 1-6), taking into account the error in each point. A value of
Q greater than 0.1 indicates a very significant fit, but values greater than 0.01 are also acceptable
(Higgins, 2006b). Strongly curved CSDs necessitated a different approach: the slope and intercept
were calculated separately for the smallest and largest crystals using the mean of several CSD bins
(Fig. 1-13).
The characteristic length (LD) of the CSDs was then calculated as -1 / slope for the entire
pattern or a single segment. This parameter is equal to the mean crystal length for a straight CSD
that extends to all crystal sizes (Marsh, 1988). The volumetric olivine proportion is obtained by
dividing the total area of the olivine crystals by the total measured area. A plot of phase
volumetric proportion versus LD (Fig. 1-14) is more useful than the commonly used graph of slope
91
versus intercept, because of the correlation between these parameters produced by closure
(pp71-74 in Higgins, 2006a).
The maximum 3-D crystal size is also an important parameter of the CSD, but no rigorous
assessment is possible using two-dimensional data. An estimate of this characteristic is the
maximum intersection size (Lmax; Table 1-5). This is not a very reliable measure because of the
small number of large crystals present, which are not necessarily in the correct orientation. Here,
we used the average of the intersection length of the three or four largest crystals for each sample
as suggested by Marsh (1998) and O'Driscoll et al. (2007).
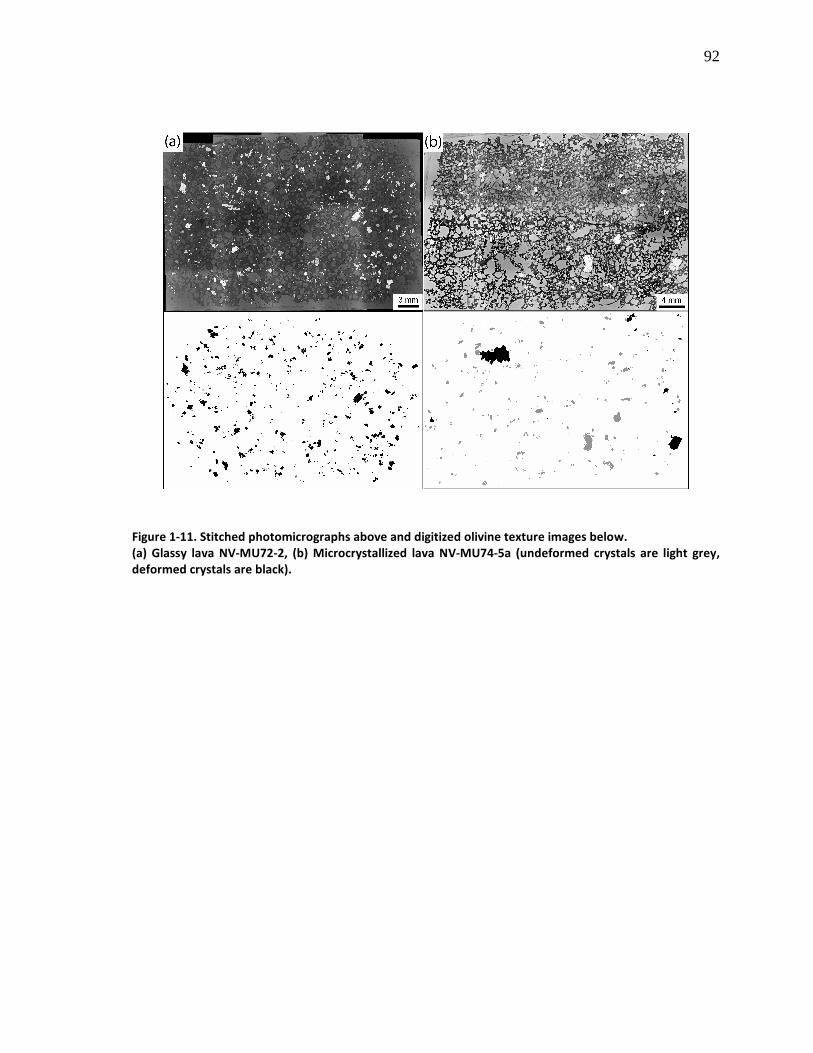
92
Figure 1-11. Stitched photomicrographs above and digitized olivine texture images below.
(a) Glassy lava NV-MU72-2, (b) Microcrystallized lava NV-MU74-5a (undeformed crystals are light grey,
deformed crystals are black).
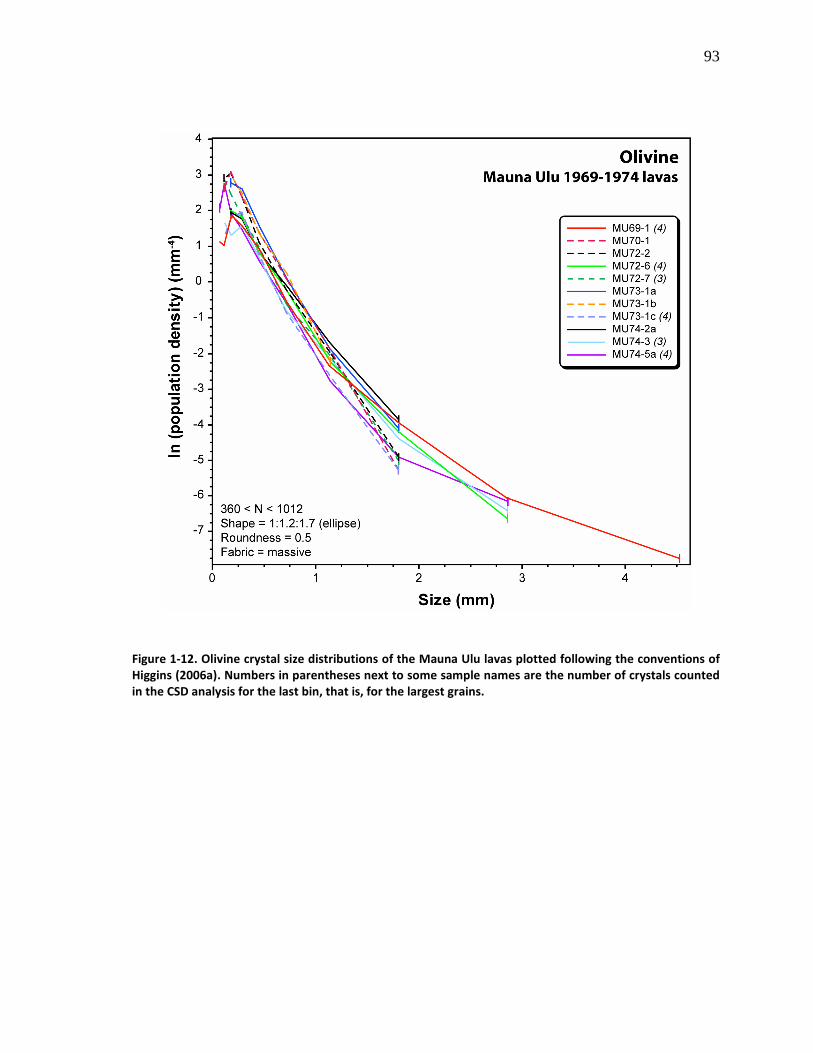
93
Figure 1-12. Olivine crystal size distributions of the Mauna Ulu lavas plotted following the conventions of
Higgins (2006a). Numbers in parentheses next to some sample names are the number of crystals counted
in the CSD analysis for the last bin, that is, for the largest grains.
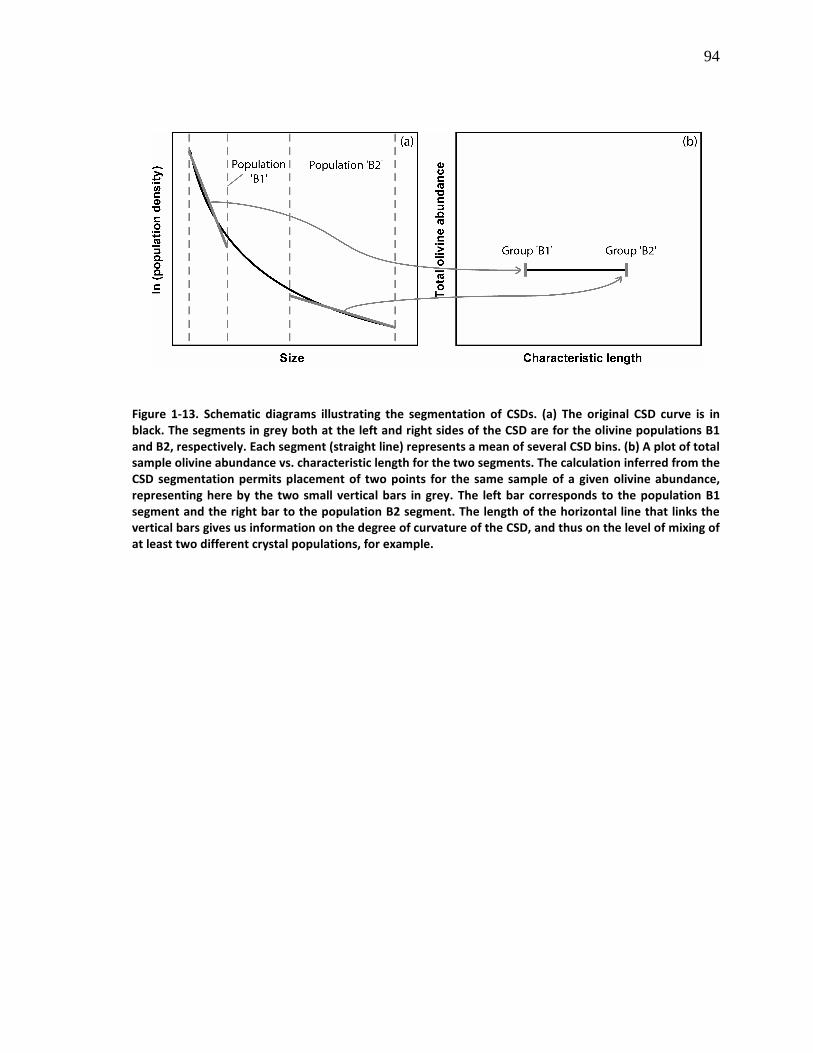
94
Figure 1-13. Schematic diagrams illustrating the segmentation of CSDs. (a) The original CSD curve is in
black. The segments in grey both at the left and right sides of the CSD are for the olivine populations B1
and B2, respectively. Each segment (straight line) represents a mean of several CSD bins. (b) A plot of total
sample olivine abundance vs. characteristic length for the two segments. The calculation inferred from the
CSD segmentation permits placement of two points for the same sample of a given olivine abundance,
representing here by the two small vertical bars in grey. The left bar corresponds to the population B1
segment and the right bar to the population B2 segment. The length of the horizontal line that links the
vertical bars gives us information on the degree of curvature of the CSD, and thus on the level of mixing of
at least two different crystal populations, for example.
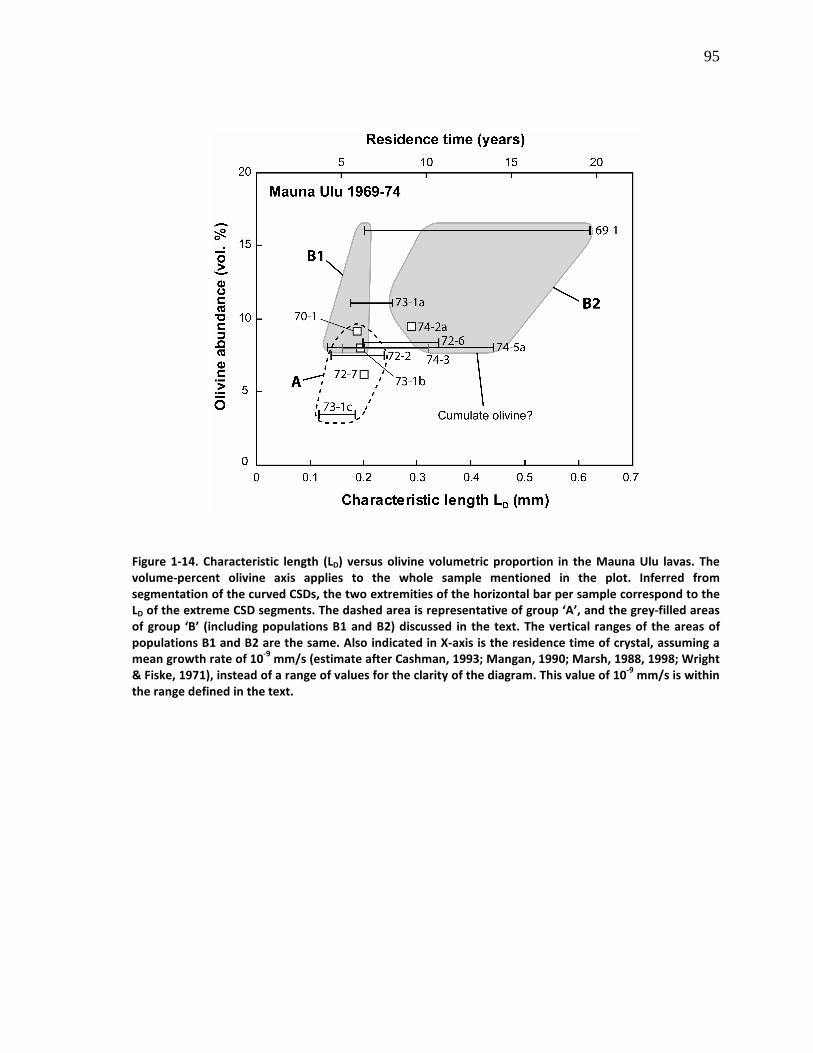
95
Figure 1-14. Characteristic length (LD) versus olivine volumetric proportion in the Mauna Ulu lavas. The
volume-percent olivine axis applies to the whole sample mentioned in the plot. Inferred from
segmentation of the curved CSDs, the two extremities of the horizontal bar per sample correspond to the
LD of the extreme CSD segments. The dashed area is representative of group ‘A’, and the grey-filled areas
of group ‘B’ (including populations B1 and B2) discussed in the text. The vertical ranges of the areas of
populations B1 and B2 are the same. Also indicated in X-axis is the residence time of crystal, assuming a
mean growth rate of 10-9
mm/s (estimate after Cashman, 1993; Mangan, 1990; Marsh, 1988, 1998; Wright
& Fiske, 1971), instead of a range of values for the clarity of the diagram. This value of 10-9
mm/s is within
the range defined in the text.
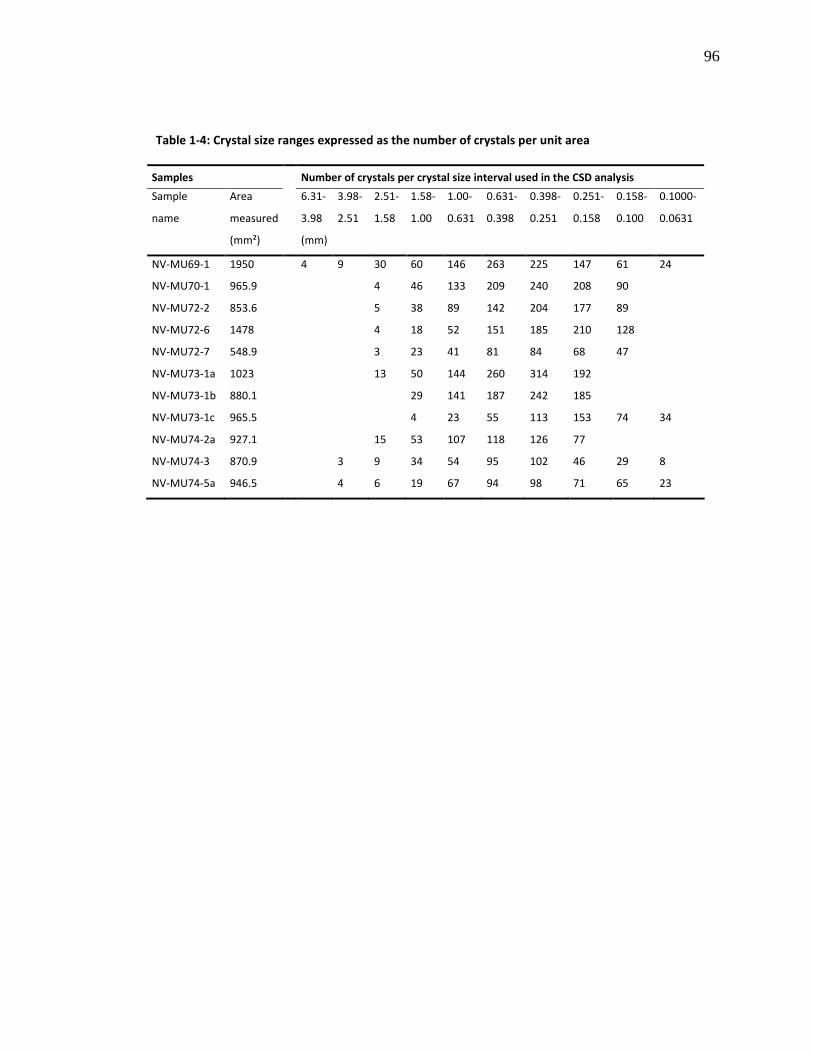
96
Table 1-4: Crystal size ranges expressed as the number of crystals per unit area
Samples Number of crystals per crystal size interval used in the CSD analysis
Sample Area 6.31- 3.98- 2.51- 1.58- 1.00- 0.631- 0.398- 0.251- 0.158- 0.1000-
name measured 3.98 2.51 1.58 1.00 0.631 0.398 0.251 0.158 0.100 0.0631
(mm²) (mm)
NV-MU69-1 1950 4 9 30 60 146 263 225 147 61 24
NV-MU70-1 965.9 4 46 133 209 240 208 90
NV-MU72-2 853.6 5 38 89 142 204 177 89
NV-MU72-6 1478 4 18 52 151 185 210 128
NV-MU72-7 548.9 3 23 41 81 84 68 47
NV-MU73-1a 1023 13 50 144 260 314 192
NV-MU73-1b 880.1 29 141 187 242 185
NV-MU73-1c 965.5 4 23 55 113 153 74 34
NV-MU74-2a 927.1 15 53 107 118 126 77
NV-MU74-3 870.9 3 9 34 54 95 102 46 29 8
NV-MU74-5a 946.5 4 6 19 67 94 98 71 65 23
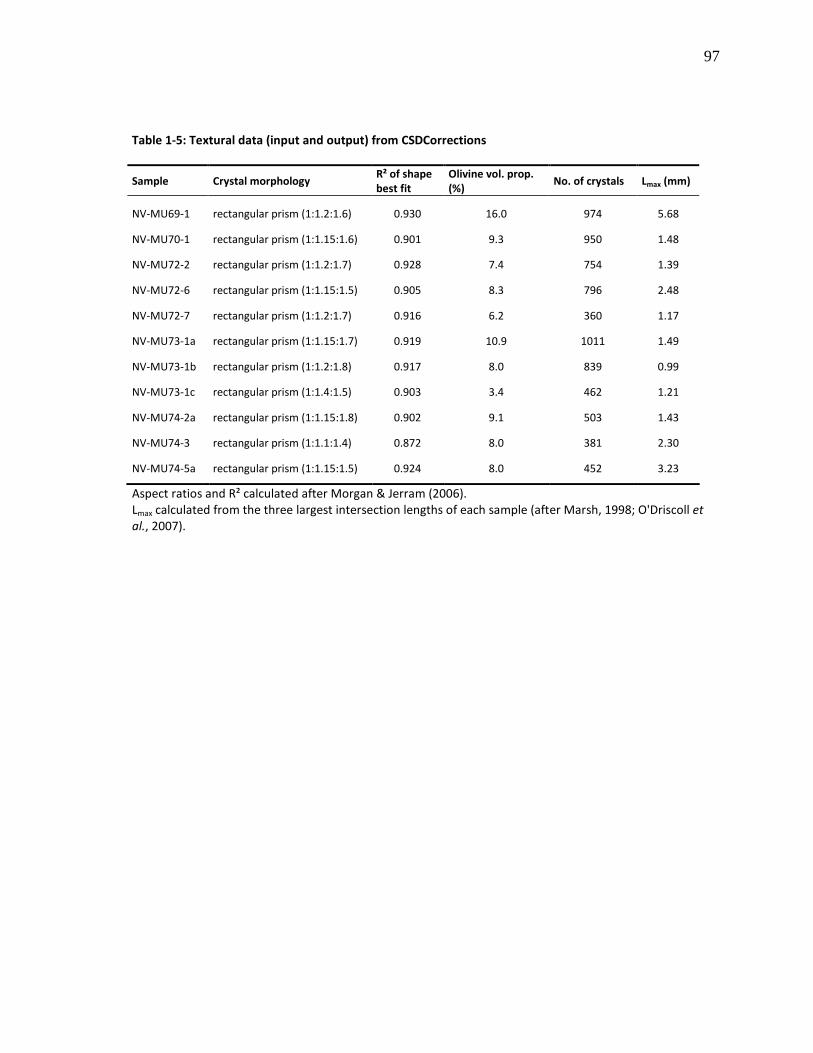
97
Table 1-5: Textural data (input and output) from CSDCorrections
Sample Crystal morphology R² of shape
best fit
Olivine vol. prop.
(%) No. of crystals Lmax (mm)
NV-MU69-1 rectangular prism (1:1.2:1.6) 0.930 16.0 974 5.68
NV-MU70-1 rectangular prism (1:1.15:1.6) 0.901 9.3 950 1.48 NV-MU72-2 rectangular prism (1:1.2:1.7) 0.928 7.4 754 1.39 NV-MU72-6 rectangular prism (1:1.15:1.5) 0.905 8.3 796 2.48 NV-MU72-7 rectangular prism (1:1.2:1.7) 0.916 6.2 360 1.17 NV-MU73-1a rectangular prism (1:1.15:1.7) 0.919 10.9 1011 1.49 NV-MU73-1b rectangular prism (1:1.2:1.8) 0.917 8.0 839 0.99 NV-MU73-1c rectangular prism (1:1.4:1.5) 0.903 3.4 462 1.21 NV-MU74-2a rectangular prism (1:1.15:1.8) 0.902 9.1 503 1.43 NV-MU74-3 rectangular prism (1:1.1:1.4) 0.872 8.0 381 2.30 NV-MU74-5a rectangular prism (1:1.15:1.5) 0.924 8.0 452 3.23 Aspect ratios and R² calculated after Morgan & Jerram (2006). Lmax calculated from the three largest intersection lengths of each sample (after Marsh, 1998; O'Driscoll et
al., 2007).

98
Table 1-6: CSD results including slope and intercept data calculated by CSDCorrections for each sample
Sample Matrix Eruption
year
Slope error Intercept
ln(n0)
error Crystal growth time
(years)
Nucleation rate
(x10-9
mm-3
/s)
Characteristic
length
Goodness of
fit
(1 σ) (1 σ) G1 G2 G1 G2 (mm) (Q)
NV-MU69-1 microlitic 1969 -4.95 0.17 2.88 0.09 2.6 12.8 7.2 1.44 0.20 0.05 -1.61 0.22 -1.60 0.48 7.9 39.4 4.0 0.80 0.62 0.14 NV-MU70-1 glassy 1970 -5.30 0.15 3.82 0.08 2.4 12.0 9.6 1.91 0.19 0.14 NV-MU72-2 glassy 1972 -7.13 0.50 4.33 0.16 1.8 8.9 10.8 2.17 0.14 0.45 -4.20 0.35 2.40 0.33 3.0 15.1 6.0 1.20 0.24 0.77 NV-MU72-6 intermediate 1972 -5.02 0.20 3.03 0.11 2.5 12.6 7.6 1,52 0.20 0.12 -2.92 0.31 0.82 0.42 4.3 21.7 2.1 0.41 0.34 0.46 NV-MU72-7 microlitic 1972 -4.87 0.21 3.23 0.11 2.6 13.0 8.1 1.62 0.21 0.18 NV-MU73-1a glassy 1973 -5.62 0.24 4.19 0.12 2.3 11.3 10.5 2.10 0.18 0.40 -3.93 0.23 2.91 0.22 3.2 16.1 7.3 1.46 0.25 0.08 NV-MU73-1b intermediate 1973 -5.08 0.16 3.89 0.09 2.5 12.5 9.7 1.95 0.20 0.06 NV-MU73-1c microlitic 1973 -8.57 0.53 3.92 0.18 1.5 7.4 9.8 1.96 0.12 0.52 -5.43 0.56 2.26 0.40 2.3 11.7 5.7 1.13 0.18 0.88 NV-MU74-2a glassy 1974 -3.42 0.13 2.52 0.10 3.7 18.5 6.3 1.26 0.29 0.20 NV-MU74-3 microlitic 1974 -6.16 0.51 3.20 0.22 2.1 10.3 8.0 1.60 0.16 0.88 -3.08 0.41 0.76 0.52 4.1 20.6 1.9 0.38 0.32 0.21 NV-MU74-5a glassy 1974 -7.46 1.32 3.38 0.28 1.7 8.5 8.5 1.69 0.13 0.10 -2.26 0.38 -0.52 0.55 5.6 28.1 1.3 0.26 0.44 0.14 Nucleation rates and crystal growth times (residence times) are calculated for olivine growth rates G1 = 2.5 x 10
-9 mm/s and G2 = 5 x 10
-10 mm/s (estimate after
Cashman, 1993; Mangan, 1990; Marsh, 1988, 1998; Wright & Fiske, 1971). The "Goodness of fit", Q, is a parameter that describes the quality of fit of the linear regression (see text for details).
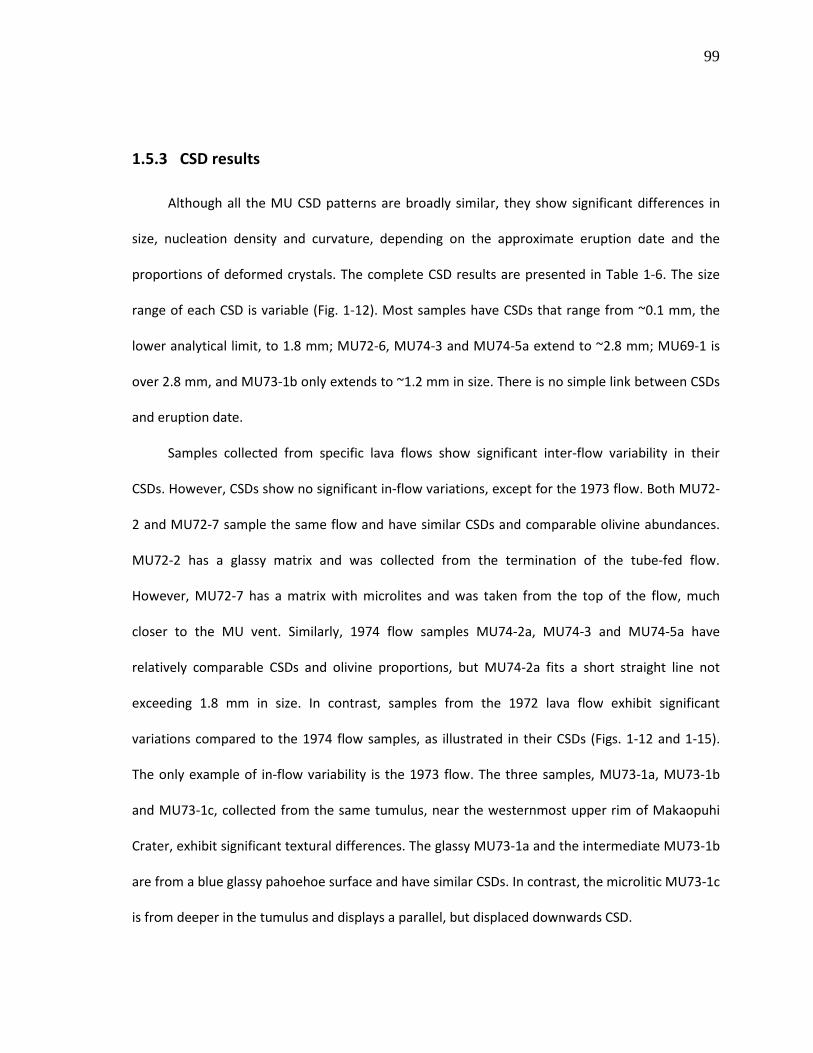
99
1.5.3 CSD results
Although all the MU CSD patterns are broadly similar, they show significant differences in
size, nucleation density and curvature, depending on the approximate eruption date and the
proportions of deformed crystals. The complete CSD results are presented in Table 1-6. The size
range of each CSD is variable (Fig. 1-12). Most samples have CSDs that range from ~0.1 mm, the
lower analytical limit, to 1.8 mm; MU72-6, MU74-3 and MU74-5a extend to ~2.8 mm; MU69-1 is
over 2.8 mm, and MU73-1b only extends to ~1.2 mm in size. There is no simple link between CSDs
and eruption date.
Samples collected from specific lava flows show significant inter-flow variability in their
CSDs. However, CSDs show no significant in-flow variations, except for the 1973 flow. Both MU72-
2 and MU72-7 sample the same flow and have similar CSDs and comparable olivine abundances.
MU72-2 has a glassy matrix and was collected from the termination of the tube-fed flow.
However, MU72-7 has a matrix with microlites and was taken from the top of the flow, much
closer to the MU vent. Similarly, 1974 flow samples MU74-2a, MU74-3 and MU74-5a have
relatively comparable CSDs and olivine proportions, but MU74-2a fits a short straight line not
exceeding 1.8 mm in size. In contrast, samples from the 1972 lava flow exhibit significant
variations compared to the 1974 flow samples, as illustrated in their CSDs (Figs. 1-12 and 1-15).
The only example of in-flow variability is the 1973 flow. The three samples, MU73-1a, MU73-1b
and MU73-1c, collected from the same tumulus, near the westernmost upper rim of Makaopuhi
Crater, exhibit significant textural differences. The glassy MU73-1a and the intermediate MU73-1b
are from a blue glassy pahoehoe surface and have similar CSDs. In contrast, the microlitic MU73-1c
is from deeper in the tumulus and displays a parallel, but displaced downwards CSD.

100
The majority of the samples show a turndown of the CSD curves at smallest crystal sizes and
it is important to determine if this is a measurement artefact. When the samples are plotted
separately, all glassy samples show a turndown (Fig. 1-15a). Thus the turndown at the left side of
the CSD is clearly not an artefact for all crystals are measured in glassy samples. The same holds
true for some of the samples with a crystallized matrix that also have a turndown at smallest sizes
(Fig. 1-15b) where only crystals >0.1 mm were measured. Therefore, the turndown is unlikely to
be an artefact of measurement for the microlite MU lavas either and hence must reflect
solidification processes.
Two groups of samples can be defined on the basis of their CSDs (Fig. 15). Group ‘A’ (Fig. 1-
15c) consists mostly of samples with straight CSDs (MU70-1, MU72-7 and MU73-1b) and two with
slightly curved CSDs (MU72-2, MU73-1c). All samples have steep negative slopes from -4.2 to -8.6
and corrected maximum crystal sizes no larger than 1.8 mm. CSD group ‘A’ has higher intercepts
(2.3-4.3) and moderate characteristic lengths (0.12-0.24 mm). It should be noted that, although
MU73-1c is thought to belong to group ‘A’ based on the textural parameters inferred from the CSD
analysis, this sample has a significantly lower olivine volumetric proportion (~3.4 %) than all the
samples studied here (Fig. 1-14). Thus, to a certain extent, MU73-1c is texturally unique.
Group ‘B’ (Fig. 1-15d) mostly consists of samples with highly curved CSDs (MU69-1, MU72-6,
MU73-1a, MU74-3 and MU74-5a) except for MU74-2a which has a straight and short CSD. These
curved CSDs were segmented so that they could be better understood: one segment for the
smallest sizes, and the other for the largest sizes. The two olivine populations are referred to as
‘B1’ for the smallest crystals and ‘B2’ for the largest crystals. Two different grey-filled areas
enclosing each of those two populations are represented in Figure 1-14. Population ‘B1’ shows
higher intercepts of 2.5 to 4.2 and lower LD (0.13-0.20 mm). This population has CSD similarities
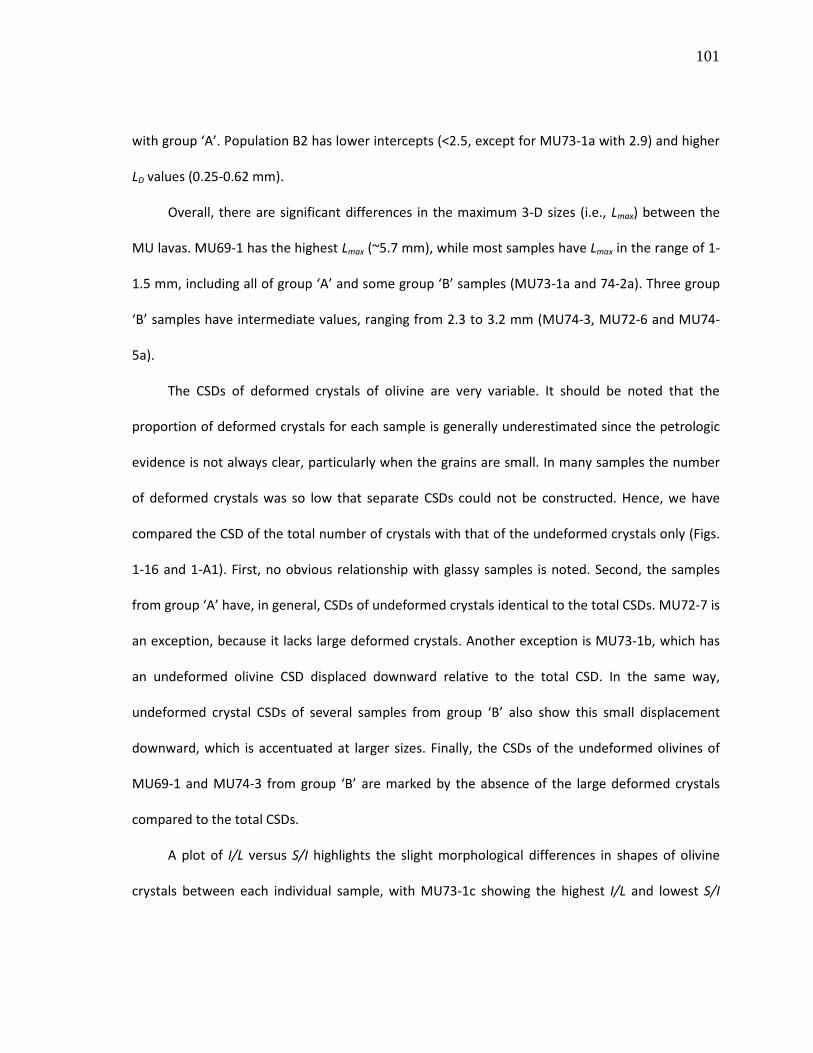
101
with group ‘A’. Population B2 has lower intercepts (<2.5, except for MU73-1a with 2.9) and higher
LD values (0.25-0.62 mm).
Overall, there are significant differences in the maximum 3-D sizes (i.e., Lmax) between the
MU lavas. MU69-1 has the highest Lmax (~5.7 mm), while most samples have Lmax in the range of 1-
1.5 mm, including all of group ‘A’ and some group ‘B’ samples (MU73-1a and 74-2a). Three group
‘B’ samples have intermediate values, ranging from 2.3 to 3.2 mm (MU74-3, MU72-6 and MU74-
5a).
The CSDs of deformed crystals of olivine are very variable. It should be noted that the
proportion of deformed crystals for each sample is generally underestimated since the petrologic
evidence is not always clear, particularly when the grains are small. In many samples the number
of deformed crystals was so low that separate CSDs could not be constructed. Hence, we have
compared the CSD of the total number of crystals with that of the undeformed crystals only (Figs.
1-16 and 1-A1). First, no obvious relationship with glassy samples is noted. Second, the samples
from group ‘A’ have, in general, CSDs of undeformed crystals identical to the total CSDs. MU72-7 is
an exception, because it lacks large deformed crystals. Another exception is MU73-1b, which has
an undeformed olivine CSD displaced downward relative to the total CSD. In the same way,
undeformed crystal CSDs of several samples from group ‘B’ also show this small displacement
downward, which is accentuated at larger sizes. Finally, the CSDs of the undeformed olivines of
MU69-1 and MU74-3 from group ‘B’ are marked by the absence of the large deformed crystals
compared to the total CSDs.
A plot of I/L versus S/I highlights the slight morphological differences in shapes of olivine
crystals between each individual sample, with MU73-1c showing the highest I/L and lowest S/I

102
ratios (Fig. 1-17). This latter sample is thus characterized by a mean crystal shape clearly different
compared to the other samples.
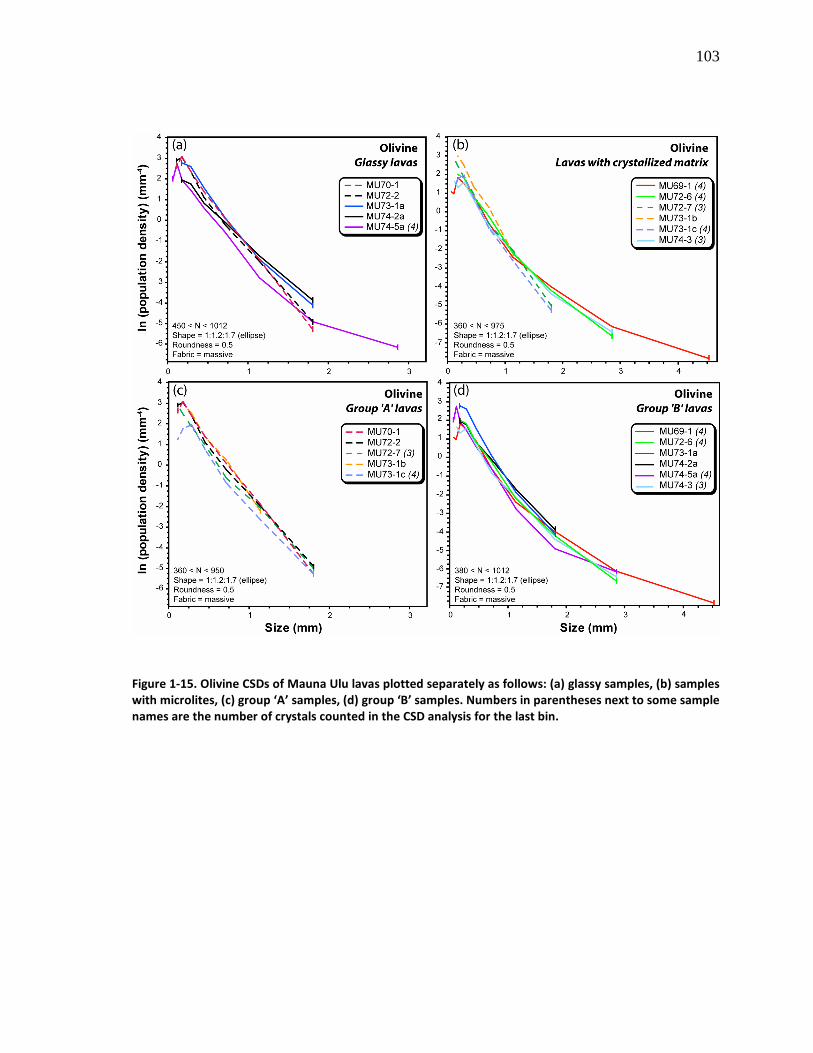
103
Figure 1-15. Olivine CSDs of Mauna Ulu lavas plotted separately as follows: (a) glassy samples, (b) samples
with microlites, (c) group ‘A’ samples, (d) group ‘B’ samples. Numbers in parentheses next to some sample
names are the number of crystals counted in the CSD analysis for the last bin.
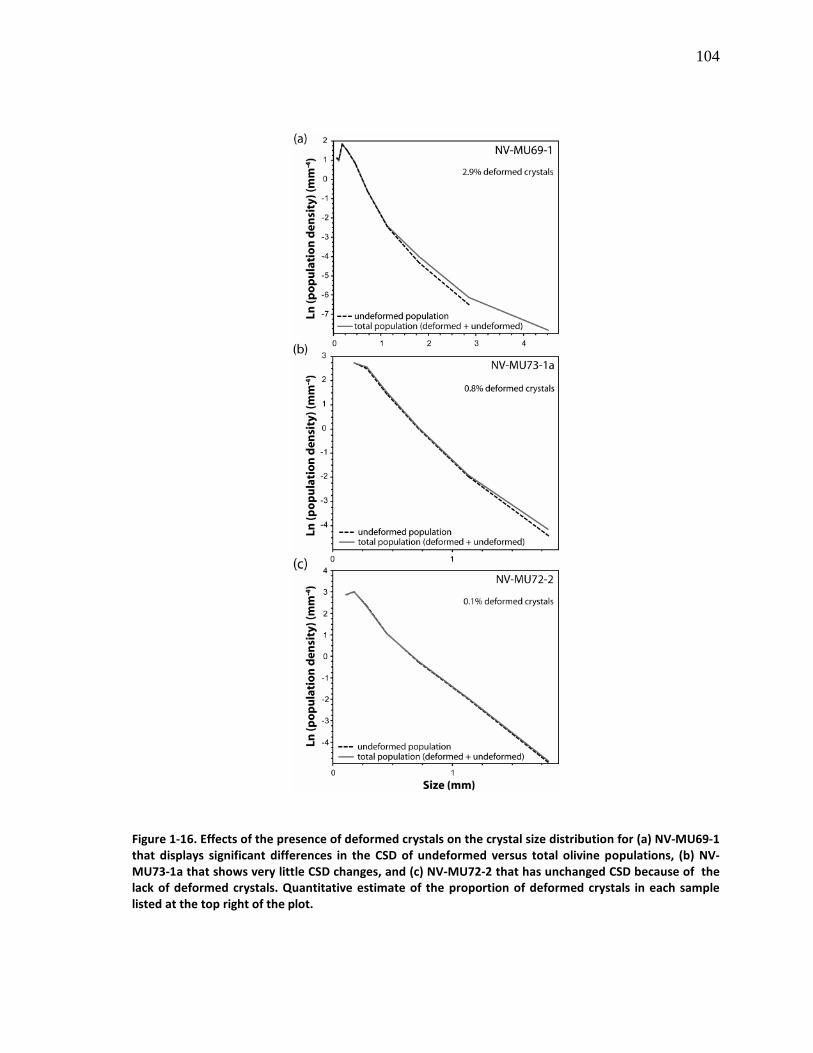
104
Figure 1-16. Effects of the presence of deformed crystals on the crystal size distribution for (a) NV-MU69-1
that displays significant differences in the CSD of undeformed versus total olivine populations, (b) NV-
MU73-1a that shows very little CSD changes, and (c) NV-MU72-2 that has unchanged CSD because of the
lack of deformed crystals. Quantitative estimate of the proportion of deformed crystals in each sample
listed at the top right of the plot.
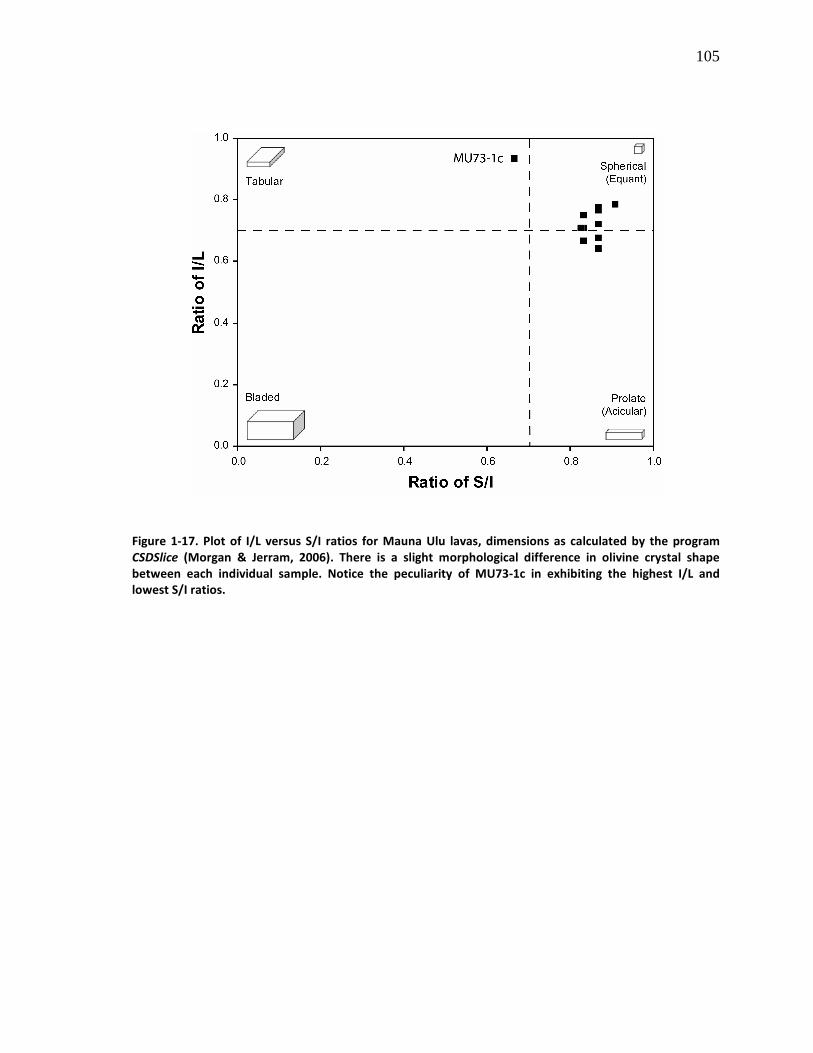
105
Figure 1-17. Plot of I/L versus S/I ratios for Mauna Ulu lavas, dimensions as calculated by the program
CSDSlice (Morgan & Jerram, 2006). There is a slight morphological difference in olivine crystal shape
between each individual sample. Notice the peculiarity of MU73-1c in exhibiting the highest I/L and
lowest S/I ratios.
106
1.6 DISCUSSION
The MU samples produced during this multiple, prolonged rift-zone eruption, have
significantly different chemical compositions and CSDs. These differences have been investigated
in terms of the magmatic processes and plumbing, mostly from depth to the surface. The
combined chemical and CSD characteristics are considered to document the origin, fractionation,
accumulation and deformation of the different MU olivine populations. Our data also lead us to
discuss textural coarsening, crystal-liquid and liquid-liquid mixing during magma storage or
movement through the plumbing system.
1.6.1 Origin of Mauna Ulu olivine: mantle, crust or both?
To build a coherent story through the plumbing of Kilauea Volcano, the question of the mantle
or crustal origin of the MU olivine populations must be addressed. The deformed olivine crystals
observed in all MU lavas clearly have a different history from the undeformed crystals, even
though they may have the same origin. It is commonly thought that the deformed crystals in
Hawaii are unlikely to represent mantle xenocrysts or unrelated cumulates from different
volcanoes (Baker et al., 1996; Garcia, 1996; Norman & Garcia, 1999; Wilkinson & Hensel, 1988).
This idea is consistent with:
(1) the magmatic origin deciphered from the fairly high CaO values, mostly 0.20-0.35 wt. %,
of all our olivines that may have formed in the crust (e.g., Norman & Garcia, 1999; Simkin
& Smith, 1970; Thompson & Gibson, 2000);
107
(2) the persistence of melt and Cr-spinel inclusions in both deformed and undeformed
crystals;
(3) the absence of compositional differences between deformed and undeformed olivines,
even in minor components such as CaO, NiO and MnO, that suggests that the deformed
olivines have a cognate origin with the undeformed ones, and are unrelated to xenocrysts;
(4) the presence of numerous zoned grains, which is also indicative of a magmatic origin,
since mantle xenocrysts would be expected to have homogeneous compositions, resulting
from long equilibration times;
(5) the large range of Fo, even in the lower-Ca olivines, which is uncommon for mantle
xenocrysts and would require sampling from very different peridotite lithologies;
(6) the occurrence of deformed olivines with Fo content less than 84%, thus lying outside the
compositional range of mantle olivine (Kamenetsky et al., 2001; Thompson & Gibson,
2000).
Sakyi et al. (2008) studied the dislocation microstructures in olivine grains from Kilauea.
They found high densities of dislocations (>106 cm-2) and suggest that the olivines have
experienced high-temperature plastic deformation. This interpretation is in agreement with the
kink-banded olivines observed in our samples, given that kink-bands normally form upon
migration of dislocations during thermal restoration at high temperature. The appearance of those
kink-bands attests to a strong deformation regime (Nicolas & Poirier, 1976), in the solid state (e.g.,
Green II & Radcliffe, 1972).
The deformed olivine crystals from MU lavas can be considered as ‘antecrysts’, in the sense
recently proposed by Jerram & Martin (2008): the term ‘antecryst’ is “becoming the accepted term
used to define crystals that have been ‘reincorporated’ into the final magma”, and are “directly
108
associated with the active magmatic system”. These antecrysts are interpreted here to have
started as cumulates from earlier Kilauea magmas, which were subsequently disrupted and
incorporated into the later magmas. Thus, all the MU olivine crystals must have crystallized from
magma within the Kilauea plumbing system. Undeformed and deformed olivines may have the
same chemical provenance, coming from the same region of the plumbing system. However, our
chemical and CSD data are not sufficient here to prove this shared origin.
Similarly, we propose that the total olivine population of the MU lavas is composed of an
early cumulate component represented by the deformed grains, and a later phenocrystic
component that crystallized directly from the latest magma(s) of the system. Both of those
components are derived from the whole Kilauea magma system, and no mantle component is
involved.
The composition of the undeformed olivines indicates that they have several different
origins, based on major and minor element analyses. In terms of Fe-Mg systematics, many crystals
appear to have been in equilibrium with their current host magma, whereas others are clearly out
of equilibrium. We propose that the undeformed, high-Fo olivines (Fo88-90) from MU lavas are relics
from a less evolved, earlier magma. The high NiO content of the olivines (0.3-0.5 wt. %) at Fo88-90 is
reliable evidence here, being strongly compatible, thus strongly resistant to later or even solid
state changes, unlike Fe and Mg. The positive correlation between Ni and the amount of olivine in
the rocks is in agreement with the compatible character of Ni in olivine. These olivine
compositions suggest a parental magma with Mg-numbers >69 ±1 which is equivalent to >16 wt %
MgO (Clague et al., 1995; Garcia et al., 2003; Garcia et al., 2000; Maaloe et al., 1988). This magma
could have been similar in composition to MU69-1. Olivines that have compositions that fall below
the equilibrium band must have crystallized from more evolved magmas. We will discuss later the
109
possibility that such magma was mixed with the main MU magma. It is now time to discuss the
occurrence and influence of magma processes during solidification within the Kilauea plumbing
system under Mauna Ulu.
1.6.2 Where and when did the crystallisation occur?
Understanding the location and the timing of crystallisation that produced the MU lavas is
of great importance in the refining of a general plumbing model for Kilauea. Crystallisation of the
ΜU lavas appears to occur at different times and locations or depths in Kilauea’s magma system,
as indicated by a significant proportion of deformed olivine crystals and their wide compositional
range.
No accurate estimation of pressure, and hence depth of crystallisation, can be inferred from
crystal and glass geochemistry. However, it is commonly accepted that most olivine fractionation
and accumulation occurs within shallow magma reservoirs and conduits beneath the summit and
upper parts of the East Rift Zone (e.g. Clague & Denlinger, 1994; Garcia et al., 2003; Pietruszka &
Garcia, 1999; Wright & Klein, 2006, 2008). Thus, as proposed in the literature and repeated here,
the olivine crystallisation and growth are assumed to have mostly occurred within Kilauea’s main
conduit and summit reservoir at 3-12 km depth, and subsequently en-route to and within
secondary shallow rift chambers as under MU region at a depth of about 3-4 km (see reviews by
Wright & Klein, 2006, 2008).
The chemical and CSD characteristics of the ΜU lavas studied here suggest that the
currently deformed olivine could have crystallized at different locations and then settled within
the Kilauea edifice, forming a cumulate body deep in the edifice (depth of ca. 9-12 km), which was
110
subsequently tapped by ascending magma. Macroscopic (i.e. thin section) evidence of mingling
within the matrix of some samples that have significantly curved CSDs (MU72-6, MU74-3 and
MU74-5a), is consistent with the presence of several olivine populations of distinct origins or
magma histories, and hence some sort of mixing. Mixing is also supported by the presence of
resorbed and reversely zoned olivine crystals. In contrast, the presence of small euhedral, unzoned
and undeformed crystals in equilibrium with their host melt (Table 1-3) is consistent with later
crystallisation in the upper parts of the volcano, either in the summit magma chamber or in the
conduits and/or adjacent magma pockets under the upper East Rift Zone, 3-4 km deep. Hence,
crystallisation may have occurred at least at two different time periods and maybe at different
levels too within the Kilauea edifice. The first took place early and participated in the formation of
a cumulate body that was partially incorporated into later magma; the second was late and
shallow in summit and/or rift storage regions. A mixing of the two distinct olivine populations took
place before the eruption.
Magma residence times can be estimated from CSDs if a CSD model is chosen, such as that
of Marsh (1988), and a growth rate defined. Here we used a growth rate range of 2.5 x 10⁻⁹ mm/s
(G1) to 5 x 10⁻¹⁰ mm/s (G2) based on a survey of studies on similar rocks (Cashman, 1993, Mangan,
1990, Marsh, 1988, Marsh, 1998, Wright & Fiske, 1971). These two end-member values give an
idea of uncertainty on the growth rate, and thus on timescale. The samples from group ‘A’ have
mean crystal residence time ranging from 1.5 to 3.0 years when using G1, and from 7.4 to 15.1
years when using G2 (Table 1-6). Calculated residence times for B1 samples show narrower
variations and lie in the same range as the ‘A’ sample values (τ1 = 1.7-2.6 years with G1; τ2 = 8.5-
12.8 years with G2). B2 samples have magma residence times that are significantly longer with
values ranging from 3.2 to 7.9 years using G1 in the calculations, and from 16.1 to 39.4 years using
111
G2. Given that the population B2 is thought to have undergone postcumulus textural and chemical
equilibration processes in the crystal mush, the calculated residence times for B2 are considered
here as minimum residence times. In summary, the shorter times of 1.5-15 years estimated from
‘A’ and B1, are thought to represent the residence times of the populations of olivines crystallized
within the shallow plumbing system of Kilauea, while B2 sample ages of 3-40 years reflect
minimum residence times of olivine in the deep-seated cumulate body at the base of the edifice,
9-12 km deep. These residence times accord with that determined by Mangan (1990) from olivine
CSDs. She found an average olivine residence time of ~11 ± 4 years for the 1959 Kilauea Iki
eruption, with a growth rate of 10-9 mm/s. However, we would like to compare our results with
independent methods.
There are few published residence times for magmas erupted from Kilauea's rift zones. Pu’u
‘O’o lavas were estimated to be 7-14 years old based on temporal changes in geochemistry (Garcia
et al., 1996). 226Ra/230Th disequilibria applied to the early stage of the 1955 Kilauea east rift
eruption gave a mean crystal residence time of ~550 years (Cooper et al., 2001). In contrast,
Pietruszka & Garcia (1999) proposed an estimate of ~30-40 years of storage in the summit
reservoir for Kilauea's late 20th century summit lavas, based on the volcano’s magma supply rates
and the temporal geochemical fluctuations of the Nb/Y ratios. Furthermore, based on the
coherence of the geochemical variation for Kilauea summit lavas, Garcia et al. (2003) proposed a
relatively rapid, <10 years, period of mixing of new magma batches with the summit magma in the
Kilauea reservoir. Based on geodetic data, Wright (1984) estimated ~100-120 years for the same
lavas. Average residence times of ~100-3000 years have also been proposed for the entire magma
reservoir system beneath Kilauea, based on geophysical estimates of reservoir size and magma
112
supply rate (Decker, 1987; Denlinger, 1997). The latter values may not be strictly relevant here, as
they refer to magma transfer and not crystallisation.
In summary, the magma residence times of ΜU lavas determined here broadly accord with
previous values estimated from Kilauea lavas, although they range widely between the authors
and the approaches employed. This is especially true for the minimum residence times calculated
for B2 samples. ‘A’ and B1 samples are significantly lower. This conclusion supports our results,
even for the shortest residence time.
1.6.3 Addition and deformation of olivine
The occurrence of multiple populations of olivine is demonstrated by the common presence
of deformed olivine crystals in our MU lavas. The whole-rock and olivine chemistry is indicative of
olivine that was originally in equilibrium with different liquids, which also supports the idea of
multiple populations. Here, the addition of olivine to host magma was treated as equivalent, as a
first approximation, to accumulation.
Accumulation (and fractionation) influences overall CSD shapes. Both analytical and
stochastic approaches have demonstrated that during crystal accumulation larger crystals sink
faster than smaller crystals (Higgins, 2002b; Higgins, 2006a; Marsh, 1998). The resulting CSD slopes
are gentler for the magma with accumulated crystals and steeper for the complementary
fractionated magma, which retains proportionately more of the small crystals (Fig. 1-10c). At
greater sizes, CSDs of population B2 has much gentler CSD slopes than either population B1 at
smaller sizes or all lavas of group ‘A’. This is interpreted as evidence of olivine accumulation, or
more generally, addition, for population B2. The presence of steeper CSDs for MU73-1b and
113
MU73-1c compared to the flatter one of MU73-1a also suggests accumulation, or addition. But to
discount other possible explanations like textural coarsening or mixing, we need to examine the
chemical data for evidence of olivine addition.
We have observed chemical evidence for olivine addition in the MU samples: there is a
slightly scattered, positive linear trend of whole-rock MgO content with respect to olivine
abundance (Fig. 1-18) and the Fo content in a large number of olivines is low for the bulk MgO
composition of the host (Fig. 1-7) (Garcia et al., 2003; Marske et al., 2008). Olivine addition is also
characterized by a linear array of the whole-rock data on plot of Ni versus MgO (Fig. 1-18b) (Clague
et al., 1995; Hart & Davis, 1978). We estimated the composition of the added olivines to be Fo87,
the mean value from the MU deformed olivine data of this study. It also corresponds to the mean
composition determined from the intersection of the regression lines through the whole-rock and
deformed olivine compositions in a Ni-MgO plot (Fig. 1-19). This value is consistent with those
presented in previous studies on Kilauea lavas (Clague et al., 1995; 1959 Kilauea Iki olivines,
Murata & Richter, 1966; summit lava olivines, Wright, 1971). Nevertheless, we cannot determine
on chemical grounds the amount of olivine in disequilibrium with the host, and the amount of
added olivine. To do so, we would have to have had prior knowledge of the exact parental magma
composition and thus the amount of phenocrysts that fractionated from it. In the present case, we
lack the necessary data.
The population of deformed olivine is undoubtedly derived from cumulates originated
within Kilauea edifice. But, where and when did cumulate formation and subsequent deformation
take place? Was it within the deep crustal cumulate region only, in the narrow conduits during
transport to the surface, in the summit magma chamber, or in shallow reservoirs along the rift
zone? One may also reasonably invoke a combination of all or part of these possibilities. Helz
114
(1987b) proposed that the deformed olivines of the 1959 Kilauea Iki eruption were derived
originally from conduit walls, lined by deep crustal cumulates from earlier Kilauea tholeiites.
Wilkinson & Hensel (1988) proposed that the deformed olivines may be cognate with their hosts
and only reflect phenocryst deformation during magma flow through narrow feeders and
conduits, at elevated (but unknown) pressures. Others argued in favour of a dunitic cumulate body
formed at the base of, and partly under the shallow reservoirs, at a depth of 4-10 km within the
edifice (Clague & Denlinger, 1994; Okubo et al., 1997; Wright & Klein, 2006; Wyss et al., 2001). The
deformation of the olivine antecrysts may be a response to inelastic strain (Clague & Denlinger,
1994) caused by the seaward plastic flow of the hot and ductile dunite body beneath the south
flank of Kilauea. This possibility is also mentioned by Peltier et al. (2009) to explain the formation
of the dislocation lamellae in olivine crystals of Piton de la Fournaise volcano, La Réunion island.
They proposed that the lamellae could be generated by “solid-state gravitational creep and
slumping towards the unsupported eastern flank of the volcano edifice”. They argued in favour of
dunitic complexes that may underlie the edifice, as well. In their model, deformed olivine
antecrysts were derived from the walls of the summit magma chamber or from an olivine-
enriched layer stored at the base of the reservoir. We propose that the deformed olivine found in
the MU lavas formed in a similar way by volcano spreading.
Deformation affects all crystal sizes and more or less all final crystal shapes. In addition,
crystals of clinopyroxene offer evidence of deformation. However, we lack the necessary data to
constrain the strength and the P-T conditions of deformation. Consequently, deformation may
have occurred at several places within the edifice, both in the various cumulates, shallow or
deeper, and in conduits, with the cumulate-phase of deformation being more important. But what
happened during and after the formation of cumulates, in terms of magma processes?
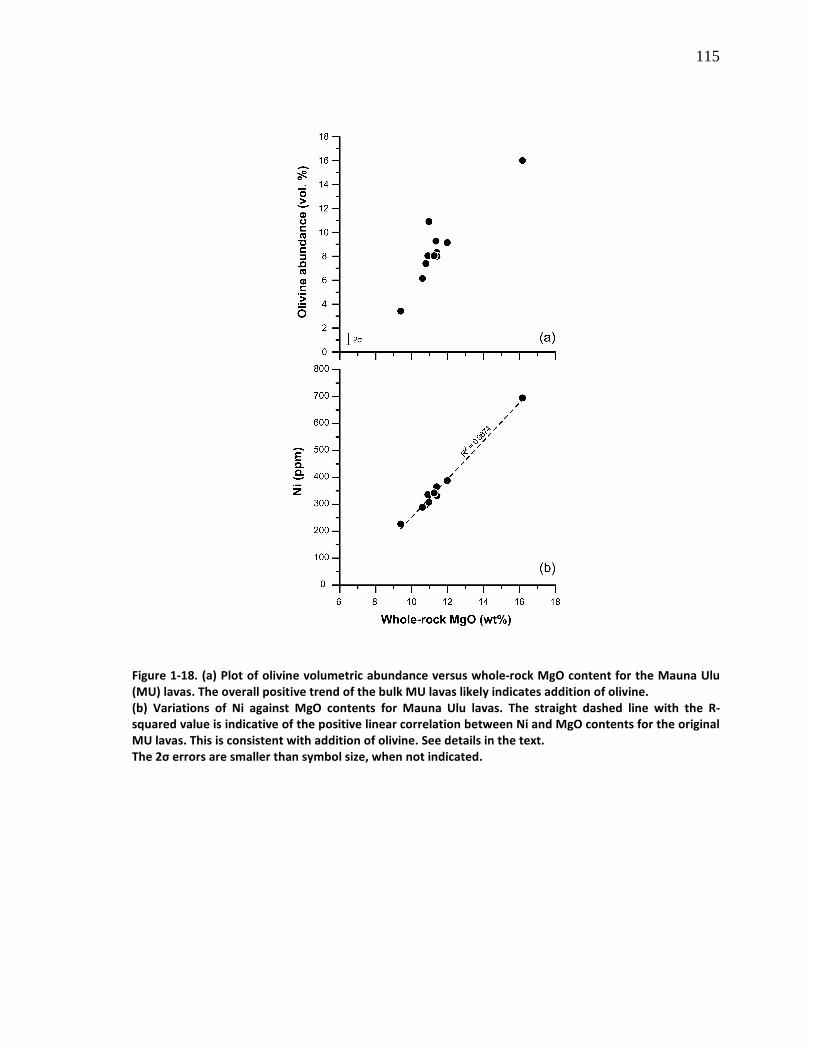
115
Figure 1-18. (a) Plot of olivine volumetric abundance versus whole-rock MgO content for the Mauna Ulu
(MU) lavas. The overall positive trend of the bulk MU lavas likely indicates addition of olivine.
(b) Variations of Ni against MgO contents for Mauna Ulu lavas. The straight dashed line with the R-
squared value is indicative of the positive linear correlation between Ni and MgO contents for the original
MU lavas. This is consistent with addition of olivine. See details in the text.
The 2σ errors are smaller than symbol size, when not indicated.
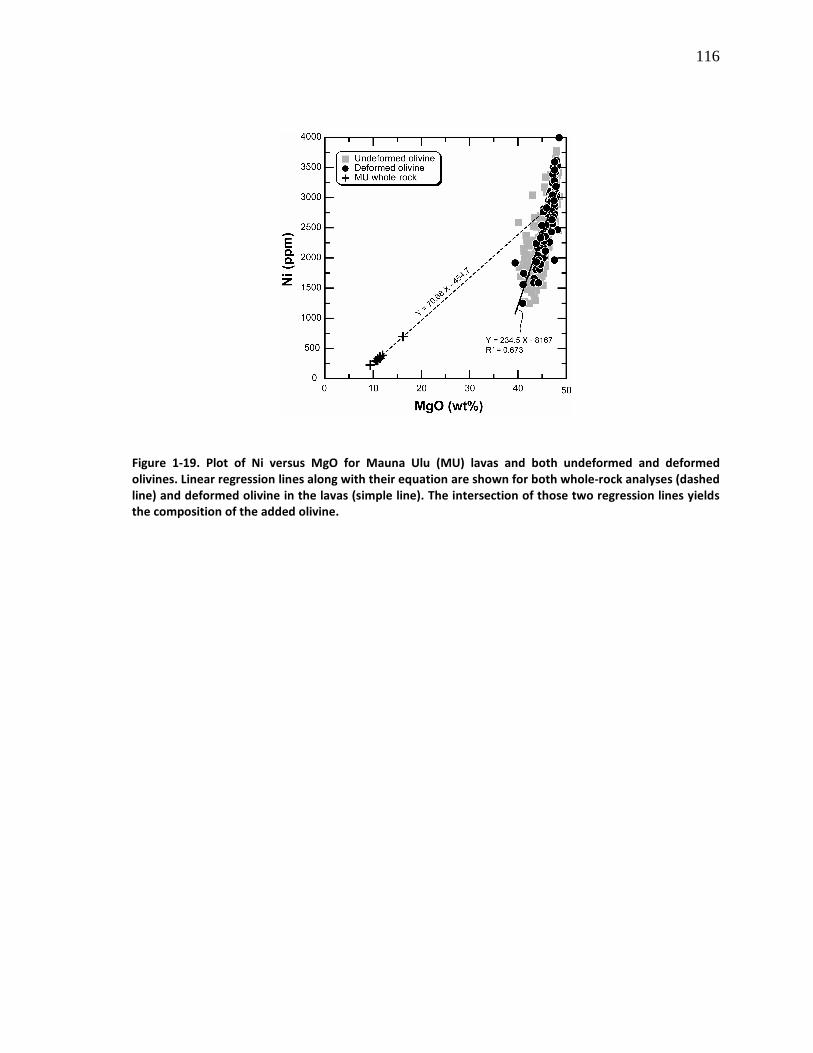
116
Figure 1-19. Plot of Ni versus MgO for Mauna Ulu (MU) lavas and both undeformed and deformed
olivines. Linear regression lines along with their equation are shown for both whole-rock analyses (dashed
line) and deformed olivine in the lavas (simple line). The intersection of those two regression lines yields
the composition of the added olivine.
117
1.6.4 Aggregation and textural coarsening
Both aggregation and coarsening are closely related processes of importance in the
formation of cumulates. Aggregation is a general term describing the clustering of grains in a melt.
The concept of clusters of crystals (glomeroporphyritic texture) that originate in magmas by
aggregation and attachment of individual grains has been introduced by many authors in different
contexts (Vance, 1969). In some cases crystals appear to be attached along crystallographically
similar faces, which assures that structural mismatch and interfacial energy are minimized. The
term synneusis – the swimming together of crystals (Vogt, 1921) – is often used both for this
texture and the associated mechanism. In contrast, it has also been proposed that growth is
enhanced by annexation of small grains by larger crystals, followed by grain boundary migration
(Marsh, 1998). This process can produce optically continuous minerals, and is considered by Marsh
(1998) as a type of rapid coarsening process.
Textural coarsening (also known as Ostwald ripening, textural equilibration or maturation) is
proposed as an important process in plutonic (e.g. Higgins, 1998, 2002b; Higgins, 2006a) and some
volcanic rocks (e.g. Higgins & Roberge, 2003). In an igneous context, coarsening is the resorption
of small crystals and the simultaneous growth of larger ones as a process of total surface (free)
energy minimization (see review by Voorhees, 1992). This process is most important at
temperature close to the mineral liquidus. Although no consensus exists about the exact process
of textural coarsening, we used the Communicating Neighbours (CN) theory (Dehoff, 1991) instead
of the more commonly used Lifshitz-Slyozov-Wagner (LSW) theory (Lifshitz & Slyozov, 1961;
Voorhees, 1992), because it appears to be a better fit for igneous rocks (e.g. Higgins, 1998; Higgins

118
& Roberge, 2003, 2007). Recently, Simakin & Bindeman (2008) showed that coarsening can be
driven more effectively by thermal oscillations in the magma.
Aggregation and textural coarsening are magma processes that can be recognized and
quantified only by textural approaches, such as CSD analysis. Figure 1-10d shows the theoretical
CSD evolution of magmas undergoing CN type coarsening. The turndown of the CSD curve at
smallest sizes represents the disappearance of the small crystals, whereas the CSD flattening at
largest sizes is indicative of the increase in growth rate to a maximum with grain size (Higgins,
1998). Thus, both the slope and intercept decrease during this process. In a closed system
containing minerals of uniform composition, the total chemical composition is unaffected by
coarsening.
Both coarsening and aggregation can lead to the loss of smaller crystals and gain of larger
crystals. This occurs during coarsening by solution of smaller crystals and during aggregation by
annexation and equilibration. Hence, the effects of aggregation on CSDs are extremely similar to
textural coarsening, with maybe a lesser influence on smaller grains, and hence a smaller, or no
turndown at smallest sizes. The similarity of effects on CSDs of these two magma processes is the
reason why they are treated together. In both cases the slope of the CSDs becomes shallower.
However, coarsening also produces a turndown for the smallest crystals, as is observed in many
samples.
Group ‘A’ samples have steep CSDs, with a low maximum crystal size (Lmax<1.5 mm) and
mostly with turndowns for the smallest crystals. Such CSDs preserve the initial CSDs produced by
nucleation and growth slightly modified by coarsening, which has removed the smallest crystals.
The CSDs do not record evidence for aggregation.
119
Group ‘B’ samples have strongly curved CSDs and extend out to greater maximum crystal
size (Lmax>2.3 mm, except for MU73-1a and MU74-2a), again mostly with turndowns for the
smallest crystals. The most extreme behaviour is that of sample MU69-1, which has amongst the
lowest number of small crystals and extends out to the greatest maximum size. The gentler slopes
at larger size fractions and turndowns are probably the result of coarsening, which is most
developed in MU69-1. In these samples the curvature and rotation of the CSDs are signs of
aggregation, as well. However, the additional effects of aggregation on the CSD are difficult to
distinguish from the coarsening effects, since they are superimposed.
In other volcanoes, the early magmas in an eruption sequence are also the most coarsened
(Tseax volcano, Canada, Higgins, 2009; Eldfell volcano, Iceland, Higgins & Roberge, 2007). This may
occur during storage just before the eruption.
In all MU samples studied here aggregation textures (Fig. 1-2) are observed in varying but
high proportions of crystals (~20-50%), with the glomerocrysts being composed of both deformed
and undeformed crystals. We interpret some of these as formed by synneusis (Fig. 1-2a). The bulk
driving force for aggregation, including synneusis, is the minimization of the surface energy of the
crystal aggregate (Ikeda et al., 2002). The synneusis aggregation mechanism typically occurs during
crystal settling and accumulation in liquid-rich magma rather than a mush (Schwindinger &
Anderson, 1989). Aggregation can also take place during cumulate formation via crystal settling.
Unfortunately, it is unclear which process dominates.
120
1.6.5 Disruption of the cumulate and incorporation into the magma
The occurrence of deformed olivine crystals in all the MU lavas is consistent with a deep-
seated cumulate origin, but how did this body become disrupted and how did parts of it enter the
MU magmas? The cumulate olivines are mostly observed as individual crystals or small clusters of
2-4 grains on average. Even very small single crystals may be deformed, suggesting wholesale
complete incorporation. Only one large dunitic xenolith has been recognized. Further, the CSDs of
the bulk populations very often closely match those from the undeformed population (Figs. 1-16
and A1). Real divisions between both only appear at larger sizes, suggesting that though there may
be small deformed crystals, the larger ones have a greater effect in the CSD plot shape. However,
in the CSDs shown in Appendix A, even when there is a difference in the CSDs for a given sample,
they still have approximately the same shape. NV-MU74-2a and NV-MU74-5a are good examples
of that. This shape similarity could be seen as good evidence for early disruption and incorporation
of cumulate (i.e., deformed olivines), which then underwent other subsequent magma processes
that affected effectively a single population.
How did the cumulate body become so efficiently disrupted, that the deformed crystals
became incorporated more or less individually into the magma? Clague & Denlinger (1994) argued
that the production of large volumes of Hawaiian tholeiitic basalt coincides with the formation of
olivine cumulates at magmatic temperatures (>1100°C) containing a small amount of intercumulus
liquid. This would prevent adjacent olivine crystals from adhering to one another. In turn it would
also explain the efficiency of the disintegration of the cumulate when entrained by the magma.
However, no precise estimate of the amount of liquid trapped in Kilauea cumulates is available in
the literature, and no data in the present study can help to resolve this issue.
121
The incorporation of the disrupted cumulate olivines into new magma, which already must
have contained olivine phenocrysts, is a case of crystal-magma mixing. This bulk magma process
can be easily recognized using CSD analysis. The process could be chemically comparable to
accumulation, because early, coarsened olivine crystals were added to late, less or not-coarsened
magmas en-route to the surface. As a first approximation we can estimate this mixing to be in the
minimum range of 0.1 to 3%, based on the volume fraction of deformed crystals measured in the
rocks (Table 1-2).
The curvature of CSDs can be used as evidence for mixing: the mixing of two magmas with
non-collinear straight CSDs produces a curved concave-up CSD (Higgins, 1996) (Fig. 1-10e). This is
due to the logarithmic vertical scale on a classic CSD diagram. The global CSD consists of straight
segments both at small and great sizes parallel to the original, individual CSDs and linked by a
curved concave-up segment at intermediate sizes. The degree of curvature is dependent on the
difference in original CSD slopes between the two magmas. On simple, linear, bivariate
geochemical diagrams mixing will produce a compositional variation fitting a straight line, whereas
fractionation will be indicated by a curved line. However, it is sometimes difficult to distinguish
mixing from the curved patterns produced by fractional crystallisation, especially if there is little
compositional variation.
Texturally, group ‘A’ samples mostly have straight CSDs and hence show no evidence of
mixing. Most samples from group ‘B’ have moderately to strongly curved concave-up CSDs
reflecting a multistage CSD history compatible with mixing. Furthermore, the CSDs of population
B1 are parallel to the CSDs of group ‘A’, with slight displacement downwards. Thus, the magma
inferred from group ‘A’ and population B1 is likely one of the magmatic components, that is, the
late, less coarsened phenocrystic component. The straight CSDs have steep slopes and high
122
intercepts probably produced during the early stages of nucleation and growth of this
phenocrystic population. The flatter CSDs of population B2 are thought to represent another
mixing component, that is, the early, more coarsened cumulate component. This is confirmed by
macroscopic evidence of mingling – that is abrupt crystallinity changes on the scale of centimetres
– within the matrix of most lavas with curved CSDs from group ‘B’.
In summary, at least two distinct olivine populations are inferred from the textural and
chemical analyses: (1) an antecrystic olivine population from a dunitic cumulate formed at greater
depth (mostly at ~9-12 km deep, within the volcanic pile of the edifice) and then remobilized by
the ascent of a juvenile magma, and (2) a phenocrystic olivine population that crystallized from the
juvenile magma at shallower depth either in the summit reservoir or in the magma chamber(s)
under Mauna Ulu area, or even both, and in the conduits. This type of solid-liquid mixing is mainly
related to entrainment of cumulate olivine crystals by an ascending magma.
1.6.6 Movement to the summit and rift zones – Multiple magma mixing events?
Multiple parental magmas are common in many igneous systems. Therefore mixing is an
important crustal process that modifies the bulk composition of lavas; as is the case for the Kilauea
lavas (e.g. Garcia et al., 2003). The term mixing is employed when the product is homogeneous.
When the product still contains heterogeneities, as that described earlier, it is called mingling. We
use the expression ‘multiple magmas’ if the magma components share a conduit.
Movement of the magma(s) through the crust to the surface appears to be complex, but
several key points can be highlighted here, in relation to the prolonged MU 1969-1974 eruption.
We propose that components of the MU magmas followed two different routes: one rose via the
123
main conduit to the summit reservoir and then moved out along the rift zone. The other moved
along a deep low-angle decollement that lies underneath the volcanic shield, then rose under MU
ridge, where the magmas mixed. Evidence for this decollement is provided by both the spatial
distribution of hypocenters and high-resolution seismic imaging (Thurber et al., 1989). The
decollement plane has long been inferred to be of major importance in the bulk deformation of
the edifice, i.e. seaward spreading of Kilauea’s south flank (Borgia, 1994; Crosson & Endo, 1981;
Delaney et al., 1998; Delaney et al., 1990; Dieterich, 1988; Lipman et al., 1985; Okubo et al., 1997;
Owen et al., 1995; Ryan, 1988; Wright & Klein, 2006; Wyss et al., 2001), but never considered as a
possible pathway for magma transfer, as we propose here. Yang et al. (1999) suggested that the
oceanic crust-mantle boundary at ~15 km depth beneath the rift zones, was a possible transfer
zone for magma to the rift zone, based on crystallisation pressures of 4-5 kbar inferred from augite
and glass rind compositions. However, they did not mention the decollement and provide no
further arguments for their idea. Details to support our suggested route along the decollement will
follow.
The summit component is now mostly represented by the undeformed olivine phenocrysts,
but some of the cumulates may also have formed here, on the conduit or chamber walls, and thus
some antecrysts belong to this summit component, as well. The range in olivine composition
suggests that these crystals grew from a range of different magmas, probably related by crystal
fractionation. Such a process could occur principally in the main conduit and summit reservoir, but
also in reservoirs in the upper rift system (e.g., Garcia et al., 2003; Thornber, 2001). Here injections
of new, undifferentiated magma could yield the Fo-rich crystals whereas Fo-poor crystals would
have crystallized from more differentiated magmas. The ubiquitous presence of deformed crystals
shows that a component must have originated by disruption of a deformed cumulate. It is
124
proposed that most antecryst-bearing magma transfer was along the basal decollement and then
rose into the rift zone through near-vertical conduits. Transport through near-vertically dykes in
the deep rift system to MU shallow region was hypothesized by several authors (e.g. Clague &
Denlinger, 1994; Clague et al., 1995; Delaney et al., 1990; Dieterich, 1988; Ryan, 1988; Ryan et al.,
1981; Wright & Klein, 2006). In contrast to the seismically active shallow part of the rift zone (2-4
km), the deep part of the rift system is aseismic, maybe in part due to its partially molten nature
(e.g. Clague & Denlinger, 1994; Ryan, 1988). Possibly partly made of a mush of picritic melt and
olivine crystals (Ryan, 1988), it corresponds to a deforming, or dilating, zone of either a series of
magmatic cumulates, an interconnected magmatic plumbing system, or a combination of both,
extending down to the decollement, at ~9-12 km (e.g. Owen et al., 1995).
The ratio of antecrysts to phenocrysts in a lava can be used to determine as a first
approximation the proportion of the two components. The lava from the first year of eruption
(MU69-1) contained 18% antecrysts among the total olivine population; in terms of bulk
abundance relative to the whole section, it corresponds to 3% antecrysts in the sample. However,
this ratio of antecrysts to phenocrysts dropped down to 3% for the 1970 lava, and then rose to 6%,
8% and finally 20% during the period 1970-1974. This suggests that the eruption started in 1969
with a large component of magma that had passed through the decollement and bypassed the
summit reservoir. This source then diminished and was replaced by magma that flowed via the
summit to the rift. With time the first magma source again became important.
The locations of the seismic hypocenters associated with the different phases of the
eruption (Klein et al., 1987, Fig. 43.98) are consistent with our model. During the period 1970-
1972, the eruption initiation hypocenters were concentrated near summit of Kilauea, and
propagated to Mauna Ulu (Klein et al., 1987). This correlates well with our observation of low
125
ratios of antecrysts to phenocrysts for the same eruption time period. This correlation is indicative
of magma movement through the rift zone from the summit to MU in 1970-1972; the main
conduit and the summit reservoir are thus involved. In contrast, in 1969 and 1973-1974 the
initiation points of swarms (hypocenters) were located in the vicinity of Pauahi or MU (Klein et al.,
1987), aside from the rift zone main pathway passing through the summit. This correlates with our
observation of higher ratios of antecrysts to phenocrysts in the 1969 and 1973-1974 lavas. This
correlation strongly suggests the importance of an alternative magma transport path from the
primary conduit to the MU. Another route must be invoked, which bypassed the summit reservoir.
Transport of magma in pipe-like conduits from the base of the shield, that is the
decollement, to the MU ridge has been suggested by some geophysical and numerical studies
(Ryan, 1988; Ryan et al., 1981). The pipe-like conduit was “formed in an area of weakness
produced by the high-angle intersection of the rift zone with the Koae fracture system” (Ryan,
1988). Ryan (1988) considered that such pipe-like conduits transported magma vertically during
the period April 1971 to December 1973. Wyss et al. (2001) found a strong b-value seismic
anomaly in a structurally significant part of the rift zone, which they interpreted as the Hiiaka-
Pauahi magma reservoir, located at the junction of the Koae Fault Zone and the rift eastward
bend. The work of Klein et al. (1987) revealed that this reservoir was an aseismic zone within the
rift, which is compatible with its intrinsic molten nature. Earthquake swarms showed that it was a
starting point of intrusions that propagated both up- and down-rift.
It is proposed that the decollement is an ideal existing zone of weakness easily used for
transport of magma, especially when dilation occurred in the deep rift system just above it, in
response to spreading (on the decollement plane) of the south flank away from the rift zone.
126
Magma then moved up through pipe-like conduits en-route to MU, as they are thought to be
relatively open, low-stress dilating pathways.
Unfortunately, there is no geophysical evidence from the MU eruption to suggest magma
movement along the decollement. However, the zone from ~4-5 km deep to the decollement
under the rift zone is mostly aseismic (Aki & Koyanagi, 1981; Koyanagi et al., 1987; Wright & Klein,
2006). Here, magma can maintain a state of quasi-steady flow that does not generate measurable
seismic signals. The decollement itself is not completely aseismic, as shown by location of the 1975
M7.2 Kalapana (e.g. Crosson & Endo, 1981) and other earthquakes.
1.7 MODEL OF MAUNA ULU MAGMA DYNAMICS IN THE CONTEXT OF
KILAUEA DYNAMICS
To better understand and schematize how the plumbing of Kilauea Volcano works, in
particular at crustal depths under the East Rift Zone, and to decipher what are the possible magma
pathways and interconnections, we propose here a model of magma dynamics that focuses on the
origin and history of the 1969-1974 MU magmas. Our model builds on earlier work, but is
grounded in the textural and chemical data presented in this study that allow several magma
solidification processes to be deciphered. Here we present the model as a semi-chronological
series of events as illustrated in figure 1-20.
(1) Olivine crystallized from primitive and fractionated magmas at various depths and
locations in Kilauea. The crystals settled, aggregated and formed an olivine cumulate
body mostly near the base of the summit reservoir and around the main crustal conduit
from 4-5 to 10-12 km depth, and near the base of the volcanic pile beneath the East Rift
127
Zone at 9-12 km depth (e.g. Clague & Denlinger, 1994; Delaney et al., 1990; Okubo et al.,
1997; Ryan, 1988; Wyss et al., 2001). Crystallisation and accumulation ages based on
CSD data range from 3 to 40 years. The cumulate never solidified completely and parts
contained some intercumulus liquid.
(2) The cumulate olivine crystals produced in event (1) underwent high-temperature plastic
deformation induced by seaward flowing down of the hot (>1100°C), ductile dunite body
(e.g. Clague & Denlinger, 1994; Clague et al., 1995; Ryan, 1988; Wright & Klein, 2008).
(3) Later olivine crystallized in the crustal summit magma reservoir and main conduit under
Halema'uma'u Crater during the cooling of magnesian magmas (Wright & Klein, 2008).
Crystallisation also occurred beneath the rift zone, at 4-5 km depth (e.g. Clague &
Denlinger, 1994). The varying magma compositions were partly a result of crystal
fractionation and olivine addition. Crystallisation ages based on CSD data range from 1
to 15 years. Olivine settled rapidly in the low viscosity primitive liquids and underwent
synneusis-driven aggregation processes (Clague et al., 1995).
(4) A decollement fault at the base of the volcanic pile acted as a sub-horizontal conduit for
magmas flowing from the base of the main conduit. The host rock comprised deformed
olivine crystals, possibly with a small amount of interstitial liquid. The magma partly
disrupted the host rock and entrained the deformed olivines, forming the antecrysts
(e.g. Clague et al., 1995; Yang et al., 1994). The great variability of magma composition
observed in the whole-rock data and olivine mineral chemistry of the MU lavas is mostly
a result of this crystal-magma mixing. The magma migrated toward the surface
underneath the upper East Rift Zone near Mauna Ulu vertically through secondary deep
128
pipe-like conduits (Ryan, 1988; Ryan et al., 1981). Hence, one component of the MU
magmas bypassed the summit reservoir.
(5) Magma produced in event (3) was transported horizontally along the rift where it mixed
with magma (4) rising vertically from the decollement. This may have occurred in small
magma chambers under the Mauna Ulu area prior to eruption. At the start of the
eruption in 1969 the deep magma source was important. However, this was almost
completely replaced by the summit magma in 1970. During the next four years the
amount of magma contributed by the deep source gradually returned to the initial
value.
Here, we have proposed a model of magma dynamics under Mauna Ulu that can be applied
at a larger scale to Kilauea Volcano, and possibly for other Hawaiian volcanoes. In particular, the
conclusions of this study can help to reconstruct the magma dynamics and pathways of other long-
lived rift eruptions, such as the on-going Pu’u ‘O’o-Kupaianaha eruption.
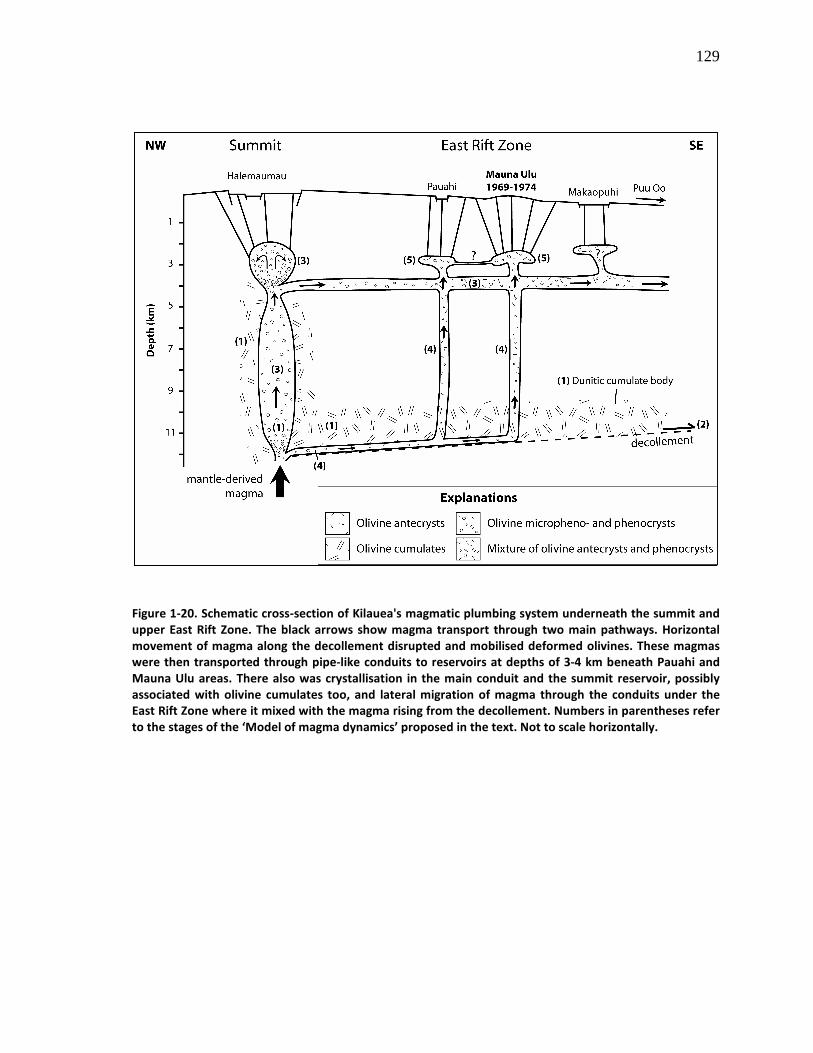
129
Figure 1-20. Schematic cross-section of Kilauea's magmatic plumbing system underneath the summit and
upper East Rift Zone. The black arrows show magma transport through two main pathways. Horizontal
movement of magma along the decollement disrupted and mobilised deformed olivines. These magmas
were then transported through pipe-like conduits to reservoirs at depths of 3-4 km beneath Pauahi and
Mauna Ulu areas. There also was crystallisation in the main conduit and the summit reservoir, possibly
associated with olivine cumulates too, and lateral migration of magma through the conduits under the
East Rift Zone where it mixed with the magma rising from the decollement. Numbers in parentheses refer
to the stages of the ‘Model of magma dynamics’ proposed in the text. Not to scale horizontally.
130
1.8 ACKNOWLEDGEMENTS
We would like to thank Rhonda Loh, Acting Chief, Natural Resources Division, Hawaii
Volcanoes National Park, for her help in obtaining our NPS research permit; Don Swanson from the
Hawaiian Volcano Observatory (HVO) for his advice before, during and after the fieldwork; Michael
O. Garcia for not only providing a spreadsheet for geochemistry-related calculations, but also
sharing chemical data from the Kilauea lavas, as did Jared P. Marske; Ed Sawyer for the loan of his
optical microscope at UQAC; and Claude Dallaire, UQAC, for the map editing. Judit Ozoray made
helpful editorial comments on earlier versions of manuscript. We are also grateful to Marc
Choquette of Laval University, Québec city, for assistance with electron microprobe analyses on
olivine crystals. We finally want to thank Émilie Roulleau for moral support. Constructive and
thorough reviews by Dan Morgan, Brian O’Driscoll and executive editor Wendy Bohrson greatly
improved the quality of the manuscript. This research was funded by grants from the Natural
Science and Engineering Research Council of Canada to M.D.H., along with scholarships from the
University of Quebec at Chicoutimi (Lucien Bouchard and PAIR scholarships) to N.V.
1.9 REFERENCES
Aki, K. & Koyanagi, R. (1981). Deep volcanic tremor and magma ascent mechanism under Kilauea, Hawaii. Journal of Geophysical Research 86, 7095-7109.
Armienti, P., Pareschi, M. T., Innocenti, F. & Pompilio, M. (1994). Effects of Magma Storage and Ascent on the Kinetics of Crystal-Growth - the Case of the 1991-93 Mt Etna Eruption. Contributions to Mineralogy and Petrology 115, 402-414.
Baker, M. B., Alves, S. & Stolper, E. M. (1996). Petrography and petrology of the Hawaii Scientific Drilling Project lavas: Inferences from olivine phenocryst abundances and compositions. Journal of Geophysical Research-Solid Earth 101, 11715-11727.
131
Boorman, S., Boudreau, A. & Kruger, F. J. (2004). The Lower Zone-Critical Zone transition of the Bushveld Complex: A quantitative textural study. Journal of Petrology 45, 1209-1235.
Borgia, A. (1994). Dynamic basis of volcanic spreading. Journal of Geophysical Research-Solid Earth
99, 17791-17804.
Cashman, K. V. (1993). Relationship between Plagioclase Crystallization and Cooling Rate in Basaltic Melts. Contributions to Mineralogy and Petrology 113, 126-142.
Cashman, K. V. & Marsh, B. D. (1988). Crystal Size Distribution (Csd) in Rocks and the Kinetics and Dynamics of Crystallization .2. Makaopuhi Lava Lake. Contributions to Mineralogy and
Petrology 99, 292-305.
Cervelli, P., Segall, P., Amelung, F., Garbeil, H., Meertens, C., Owen, S., Miklius, A. & Lisowski, M. (2002). The 12 September 1999 Upper East Rift Zone dike intrusion at Kilauea Volcano, Hawaii. Journal of Geophysical Research 107, ECV 3-1 - 3-13.
Clague, D. A. & Denlinger, R. P. (1994). Role of olivine cumulates in destabilizing the flanks of Hawaiian volcanoes. Bulletin of Volcanology 56, 425-434.
Clague, D. A., Moore, J. G., Dixon, J. E. & Friesen, W. B. (1995). Petrology of submarine lavas from Kilaueas Puna Ridge, Hawaii. Journal of Petrology 36, 299-349.
Cooper, K. M., Reid, M. R., Murrell, M. T. & Clague, D. A. (2001). Crystal and magma residence at Kilauea Volcano, Hawaii: Th-230-Ra-226 dating of the 1955 east rift eruption. Earth and
Planetary Science Letters 184, 703-718.
Crosson, R. S. & Endo, E. T. (1981). Focal mechanisms of earthquakes related to the 29 November 1975 Kalapana, Hawaii, earthquake: the effect of structure models. Bulletin of the
Seismological Society of America 71, 713-729.
Decker, R. W. (1987). Dynamics of Hawaiian volcanoes; an overview. U.S. Geological Survey,
Professional Paper 1350, 997-1018.
Dehoff, R. T. (1991). A geometrically general theory of diffusion controlled coarsening. Acta
Metallurgica Et Materialia 39, 2349-2360.
Delaney, P. T., Denlinger, R. P., Lisowski, M., Miklius, A., Okubo, P. G., Okamura, A. T. & Sako, M. K. (1998). Volcanic spreading at Kilauea, 1976-1996. Journal of Geophysical Research-Solid
Earth 103, 18003-18023.
Delaney, P. T., Fiske, R. S., Miklius, A., Okamura, A. T. & Sako, M. K. (1990). Deep magma body beneath the summit and rift zones of Kilauea Volcano, Hawaii. Science 247, 1311-1316.
Denlinger, R. P. (1997). A dynamic balance between magma supply and eruption rate at Kilauea volcano, Hawaii. Journal of Geophysical Research-Solid Earth 102, 18091-18100.
132
Dieterich, J. H. (1988). Growth and persistence of Hawaiian volcanic rift zones. Journal of
Geophysical Research-Solid Earth and Planets 93, 4258-4270.
Eaton, J. P. & Murata, K. J. (1960). How volcanoes grow. Science 132, 925-938.
Fiske, R. S. & Kinoshita, W. T. (1969). Inflation of Kilauea Volcano prior to its 1967-1968 eruption. Science 165, 341-349.
Garcia, M. O. (1996). Petrography and olivine and glass chemistry of lavas from the Hawaii Scientific Drilling Project. Journal of Geophysical Research-Solid Earth 101, 11701-11713.
Garcia, M. O., Ito, E. & Eiler, J. M. (2008). Oxygen Isotope Evidence for Chemical Interaction of Kilauea Historical Magmas with Basement Rocks. Journal of Petrology 49, 757-769.
Garcia, M. O., Pietruszka, A. & Rhodes, J. M. (2003). A petrologic perspective of Kilauea volcano's summit magma reservoir. Journal of Petrology 44, 2313-2339.
Garcia, M. O., Pietruszka, A. J., Rhodes, J. M. & Swanson, K. (2000). Magmatic processes during the prolonged Pu'u 'O'o eruption of Kilauea Volcano, Hawaii. Journal of Petrology 41, 967-990.
Garcia, M. O., Rhodes, J. M., Trusdell, F. A. & Pietruszka, A. J. (1996). Petrology of lavas from the Puu Oo eruption of Kilauea Volcano .3. The Kupaianaha episode (1986-1992). Bulletin of
Volcanology 58, 359-379.
Green II, H. W. & Radcliffe, S. V. (1972). Dislocation mechanisms in olivine and flow in the upper mantle. Earth and Planetary Science Letters 15, 239-247.
Hart, S. R. & Davis, K. E. (1978). Nickel partitioning between olivine and silicate melt. Earth and
Planetary Science Letters 40, 203-219.
Helz, R. T. (1980). Crystallization history of Kilauea Iki lava lake as seen in drill core recovered in 1967-1979. Bulletin Volcanologique 43, 675-701.
Helz, R. T. (1987a). Differenciation behavior of Kilauea Iki lava lake, Kilauea Volcano, Hawaii: An overview of past and current work. In: Mysen, B. O. (ed.) Magmatic Processes:
Physicochemical Principles. The Geochemical Society Special Publication No. 1, 241-258.
Helz, R. T. (1987b). Diverse olivine types in lava of the 1959 eruption of Kilauea Volcano and their bearing on eruption dynamics. U.S. Geological Survey, Professional Paper 1350, 691-722.
Helz, R. T. (2009). Processes active in mafic magma chambers: The example of Kilauea Iki Lava Lake, Hawaii. Lithos 111, 37-46.
Herzberg, C., Asimow, P. D., Arndt, N., Niu, Y., Lesher, C. M., Fitton, J. G., Cheadle, M. J. & Saunders, A. D. (2007). Temperatures in ambient mantle and plumes: Constraints from basalts, picrites, and komatiites. Geochemistry Geophysics Geosystems 8, Q02006.
133
Higgins, M. D. (1996). Magma dynamics beneath Kameni volcano, Thera, Greece, as revealed by crystal size and shape measurements. Journal of Volcanology and Geothermal Research 70, 37-48.
Higgins, M. D. (1998). Origin of anorthosite by textural coarsening: Quantitative measurements of a natural sequence of textural development. Journal of Petrology 39, 1307-1323.
Higgins, M. D. (2000). Measurement of crystal size distributions. American Mineralogist 85, 1105-1116.
Higgins, M. D. (2002a). Closure in crystal size distributions (CSD), verification of CSD calculations, and the significance of CSD fans. American Mineralogist 87, 171-175.
Higgins, M. D. (2002b). A crystal size-distribution study of the Kiglapait layered mafic intrusion, Labrador, Canada: evidence for textural coarsening. Contributions to Mineralogy and
Petrology 144, 314-330.
Higgins, M. D. (2006a). Quantitative Textural Measurements in Igneous and Metamorphic
Petrology. Cambridge, UK: Cambridge University Press.
Higgins, M. D. (2006b). Verification of ideal semi-logarithmic, lognormal or fractal crystal size distributions from 2D datasets. Journal of Volcanology and Geothermal Research 154, 8-16.
Higgins, M. D. (2009). The Cascadia megathrust earthquake of 1700 may have rejuvenated an isolated basalt volcano in western Canada: Age and petrographic evidence. Journal of
Volcanology and Geothermal Research 179, 149-156.
Higgins, M. D. & Roberge, J. (2003). Crystal size distribution of plagioclase and amphibole from Soufriere Hills volcano, Montserrat: Evidence for dynamic crystallization-textural coarsening cycles. Journal of Petrology 44, 1401-1411.
Higgins, M. D. & Roberge, J. (2007). Three magmatic components in the 1973 eruption of Eldfell volcano, Iceland: Evidence from plagioclase crystal size distribution (CSD) and geochemistry. Journal of Volcanology and Geothermal Research 161, 247-260.
Hofmann, A. W., Feigenson, M. D. & Raczek, I. (1984). Case studies on the origin of basalt .3. Petrogenesis of the Mauna Ulu eruption, Kilauea, 1969-1971. Contributions to Mineralogy
and Petrology 88, 24-35.
Ikeda, S., Toriumi, M., Yoshida, H. & Shimizu, I. (2002). Experimental study of the textural development of igneous rocks in the late stage of crystallization: the importance of interfacial energies under non-equilibrium conditions. Contributions to Mineralogy and
Petrology 142, 397-415.
Jerram, D. A., Cheadle, M. J. & Philpotts, A. R. (2003). Quantifying the building blocks of igneous rocks: Are clustered crystal frameworks the foundation? Journal of Petrology 44, 2033-2051.
134
Jerram, D. A. & Kent, A. J. R. (2006). An overview of modern trends in petrography: Textural and microanalysis of igneous rocks. Journal of Volcanology and Geothermal Research 154, VII-IX.
Jerram, D. A. & Martin, V. M. (2008). Understanding crystal populations and their significance through the magma plumbing system. In: Annen, C. & Zellmer, G. F. (eds.) Dynamics of
Crustal Magma Transfer, Storage and Differentiation. London, UK: Geological Society, Special Publications 304 304, 133-148.
Jurewicz, A. J. G. & Watson, E. B. (1988). Cations in olivine .1. Calcium partitioning and calcium-magnesium distribution between olivines and coexisting melts, with petrologic applications. Contributions to Mineralogy and Petrology 99, 176-185.
Kamenetsky, V. S., Crawford, A. J. & Meffre, S. (2001). Factors controlling chemistry of magmatic spinel: An empirical study of associated olivine, Cr-spinel and melt inclusions from primitive rocks. Journal of Petrology 42, 655-671.
Kamenetsky, V. S., Elburg, M., Arculus, R. & Thomas, R. (2006). Magmatic origin of low-Ca olivine in subduction-related magmas: Co-existence of contrasting magmas. Chemical Geology 233, 346-357.
Klein, F. W., Koyanagi, R. Y., Nakata, J. S. & Tanigawa, W. R. (1987). The seismicity of Kilauea's magma system. U.S. Geological Survey, Professional Paper 1350, 1019-1185.
Koyanagi, R. Y., Chouet, B. & Aki, K. (1987). Origin of volcanic tremor in Hawaii, part I. Data from the Hawaiian Volcano Observatory, 1969-1985. U.S. Geological Survey Professional Paper
1350 2, 1221-1257.
Lifshitz, I. M. & Slyozov, V. V. (1961). The kinetics of precipitation from supersaturated solid solutions. Journal of Physics and Chemistry of Solids 19, 35-50.
Lipman, P. W., Lockwood, J. P., Okamura, R. T., Swanson, D. A. & Yamashita, K. M. (1985). Ground deformation associated with the 1975 magnitude-7.2 earthquake and resulting changes in activity of Kilauea Volcano, Hawaii. U.S. Geological Survey Professional Paper 1276, 45 p.
Maaloe, S., Pedersen, R. B. & James, D. (1988). Delayed Fractionation of Basaltic Lavas. Contributions to Mineralogy and Petrology 98, 401-407.
Macdonald, G. A. (1949). Petrography of the island of Hawaii. U.S. Geological Survey, Professional
Paper 214-D, 51-96.
Mangan, M. T. (1990). Crystal Size Distribution Systematics and the Determination of Magma Storage Times - The 1959 Eruption of Kilauea Volcano, Hawaii. Journal of Volcanology and
Geothermal Research 44, 295-302.
Marsh, B. D. (1988). Crystal Size Distribution (Csd) in Rocks and the Kinetics and Dynamics of Crystallization .1. Theory. Contributions to Mineralogy and Petrology 99, 277-291.
135
Marsh, B. D. (1998). On the interpretation of crystal size distributions in magmatic systems. Journal of Petrology 39, 553-599.
Marsh, B. D. (2007). Crystallization of silicate magmas deciphered using crystal size distributions. Journal of the American Ceramic Society 90, 746-757.
Marske, J. P., Garcia, M. O., Pietruszka, A. J., Rhodes, J. M. & Norman, M. D. (2008). Geochemical variations during Kilaueas Pu'u eruption reveal a fine-scale mixture of mantle heterogeneities within the Hawaiian plume. Journal of Petrology 49, 1297-1318.
Morgan, D. J. & Jerram, D. A. (2006). On estimating crystal shape for crystal size distribution analysis. Journal of Volcanology and Geothermal Research 154, 1-7.
Murata, K. J. & Richter, D. H. (1966). Settling of olivine in Kilauean magma as shown by lavas of 1959 eruption. American Journal of Science 264, 194-203.
Nicolas, A. & Poirier, J. P. (1976). Crystalline plasticity and solid state flow in metamorphic rocks: John Wiley & Sons, London, UK.
Norman, M. D. & Garcia, M. O. (1999). Primitive magmas and source characteristics of the Hawaiian plume: petrology and geochemistry of shield picrites. Earth and Planetary Science
Letters 168, 27-44.
O'Driscoll, B., Donaldson, C. H., Troll, V. R., Jerram, D. A. & Emeleus, C. H. (2007). An origin for harrisitic and granular olivine in the Rum Layered Suite, NW Scotland: a crystal size distribution study. Journal of Petrology 48, 253-270.
Okubo, P. G., Benz, H. M. & Chouet, B. A. (1997). Imaging the crustal magma sources beneath Mauna Loa and Kilauea volcanoes, Hawaii. Geology 25, 867-870.
Owen, S., Segall, P., Freymueller, J., Miklius, A., Denlinger, R., Arnadottir, T., Sako, M. & Burgmann, R. (1995). Rapid deformation of the south flank of Kilauea Volcano, Hawaii. Science 267, 1328-1332.
Owen, S., Segall, P., Lisowski, M., Miklius, A., Murray, M., Bevis, M. & Foster, J. (2000). January 30, 1997 eruptive event on Kilauea Volcano, Hawaii, as monitored by continuous GPS. Geophysical Research Letters 27, 2757-2760.
Peltier, A., Bachèlery, P. & Staudacher, T. (2009). Magma transport and storage at Piton de La Fournaise (La Réunion) between 1972 and 2007: A review of geophysical and geochemical data. Journal of Volcanology and Geothermal Research 184, 93-108.
Peterson, D. W., Christiansen, R. L., Duffield, W. A., Holcomb, R. T. & Tilling, R. I. (1976). Recent activity of Kilauea Volcano, Hawaii. In: Gonzalez Ferran, O. (ed.) Proceedings of the
symposium on Andean and Antarctic volcanology problems; Santiago, Chile, September,
1974. Rome, Italy: Int. Assoc. Volcanol. and Chem. Earth's Int. 646-656.
136
Pietruszka, A. J. & Garcia, M. O. (1999). The size and shape of Kilauea Volcano's summit magma storage reservoir: a geochemical probe. Earth and Planetary Science Letters 167, 311-320.
Powers, H. A. (1955). Composition and origin of basaltic magma of the Hawaiian Islands. Geochimica Et Cosmochimica Acta 7, 77-107.
Randolph, A. D. & Larson, M. A. (1971). Theory of Particulate Processes. New-York, US: Academic Press.
Rhodes, J. M. & Vollinger, M. J. (2004). Composition of basaltic lavas sampled by phase-2 of the Hawaii Scientific Drilling Project: Geochemical stratigraphy and magma types. Geochemistry
Geophysics Geosystems 5.
Rhodes, J. M. & Vollinger, M. J. (2005). Ferric/ferrous ratios in 1984 Mauna Loa lavas: a contribution to understanding the oxidation state of Hawaiian magmas. Contributions to
Mineralogy and Petrology 149, 666-674.
Richter, D. H. & Murata, K. J. (1966). Petrography of the lavas of the 1959-60 eruption of Kilauea Volcano, Hawaii. U.S. Geological Survey Professional Paper 537-D, D1-D12.
Roeder, P. L. & Emslie, R. F. (1970). Olivine-liquid equilibrium. Contributions to Mineralogy and
Petrology 29, 275-289.
Ryan, M. P. (1988). The Mechanics and Three-Dimensional Internal Structure of Active Magmatic Systems - Kilauea Volcano, Hawaii. Journal of Geophysical Research - Solid Earth 93, 4213-4248.
Ryan, M. P., Koyanagi, R. Y. & Fiske, R. S. (1981). Modeling the 3-dimensional structure of macroscopic magma transport systems - Application to Kilauea Volcano, Hawaii. Journal of
Geophysical Research 86, 7111-7129.
Sakyi, P. A., Tanaka, R. & Nakamura, E. (2008). Dislocation microstructures in naturally deformed olivine crystals from Hawaiian lavas. Geochimica Et Cosmochimica Acta 72, A819-A819 (abstr.).
Schwindinger, K. R. (1999). Particle dynamics and aggregation of crystals in a magma chamber with application to Kilauea Iki olivines. Journal of Volcanology and Geothermal Research 88, 209-238.
Schwindinger, K. R. & Anderson, A. T. (1989). Synneusis of Kilauea Iki Olivines. Contributions to
Mineralogy and Petrology 103, 187-198.
Scowen, P. A. H., Roeder, P. L. & Helz, R. T. (1991). Reequilibration of chromite within Kilauea Iki lava lake, Hawaii. Contributions to Mineralogy and Petrology 107, 8-20.
137
Simakin, A. G. & Bindeman, I. N. (2008). Evolution of crystal sizes in the series of dissolution and precipitation events in open magma systems. Journal of Volcanology and Geothermal
Research 177, 997-1010.
Simkin, T. & Smith, J. V. (1970). Minor-element distribution in olivine. Journal of Geology 78, 304-325.
Stormer, J. C. (1973). Calcium zoning in olivine and its relationship to silica activity and pressure. Geochimica Et Cosmochimica Acta 37, 1815-1821.
Swanson, D. A. (1973). Pahoehoe Flows from the 1969-1971 Mauna Ulu Eruption, Kilauea Volcano, Hawaii. Geological Society of America Bulletin 84, 615-626.
Swanson, D. A., Duffield, W. A., Jackson, D. B. & Peterson, D. W. (1979). Chronological narrative of the 1969-71 Mauna Ulu eruption of Kilauea Volcano, Hawaii. U. S. Geological Survey,
Professional Paper 1056, 55 p.
Swanson, D. A., Jackson, D. B., Duffield, W. A. & Peterson, D. W. (1971). Mauna Ulu eruption, Kilauea volcano. Geotimes 16, 12-16.
Thompson, R. N. & Gibson, S. A. (2000). Transient high temperatures in mantle plume heads inferred from magnesian olivines in Phanerozoic picrites. Nature 407, 502-506.
Thornber, C. R. (2001). Olivine-liquid relations of lava erupted by Kilauea volcano from 1994 to 1998: Implications for shallow magmatic processes associated with the ongoing east-rift-zone eruption. Canadian Mineralogist 39, 239-266.
Thornber, C. R. (2003). Magma-reservoir processes revealed by geochemistry of the Pu'u 'O'o-Kupaianaha eruption. U.S. Geological Survey, Professional Paper 1676, 121-136.
Thornber, C. R., Heliker, C., Sherrod, D. R., Kauahikaua, J. P., Miklius, A., Okubo, P. G., Trusdell, F. A., Budahn, J. R., Ridley, W. I. & Meeker, G. P. (2003). Kilauea east rift zone magmatism: an episode 54 perspective. Journal of Petrology 44, 1525-1559.
Thurber, C. H., Li, Y. P. & Johnson, C. (1989). Seismic detection of a low-velocity layer beneath the southeast flank of Mauna Loa, Hawaii. Geophysical Research Letters 16, 649-652.
Tilling, R. I., Christiansen, R. L., Duffield, W. A., Endo, E. T., Holcomb, R. T., Koyanagi, R. Y., Peterson, D. W. & Unger, J. D. (1987). The 1972-1974 Mauna Ulu eruption, Kilauea Volcano; an example of quasi-steady-state magma transfer. U. S. Geological Survey, Professional
Paper 1350, 405-469.
Tilling, R. I. & Dvorak, J. J. (1993). Anatomy of a Basaltic Volcano. Nature 363, 125-133.
138
Ulmer, P. (1989). The dependence of the Fe2+-Mg cation-partitioning between olivine and basaltic liquid on pressure, temperature and composition - An experimental study to 30 kbars. Contributions to Mineralogy and Petrology 101, 261-273.
Vance, J. A. (1969). On synneusis. Contributions to Mineralogy and Petrology 24, 7-29.
Vogt, J. H. L. (1921). The physical chemistry of the crystallization and magmatic differentiation of igneous rocks. Journal of Geology 29, 318-350.
Voorhees, P. W. (1992). Ostwald ripening of 2-phase mixtures. Annual Review of Materials Science
22, 197-215.
Wilkinson, J. F. G. & Hensel, H. D. (1988). The petrology of some picrites from Mauna Loa and Kilauea volcanoes, Hawaii. Contributions to Mineralogy and Petrology 98, 326-345.
Wolfe, E. W. & Morris, J. (1996). Geologic map of the Island of Hawaii. In: Series, M. I. (ed.): U.S. Geological Survey.
Wright, T. L. (1971). Chemistry of Kilauea and Mauna Loa lava in space and time. U.S. Geological
Survey, Professional Paper 735, 40 p.
Wright, T. L. (1984). Origin of Hawaiian tholeiite: a metasomatic model. Journal of Geophysical
Research - Solid Earth 89, 3233-3252.
Wright, T. L. & Fiske, R. S. (1971). Origin of differentiated and hybrid lavas of Kilauea Volcano, Hawaii. Journal of Petrology 12, 1-65.
Wright, T. L. & Klein, F. W. (2006). Deep magma transport at Kilauea volcano, Hawaii. Lithos 87, 50-79.
Wright, T. L. & Klein, F. W. (2008). Dynamics of magma supply to Kilauea volcano, Hawai'iL integrating seismic, geodetic and eruption data. In: Annen, C. & Zellmer, G. F. (eds.) Dynamics of Crustal Magma Transfer, Storage and Differentiation. London, UK: Geological Society, Special Publications 304 304, 83-116.
Wright, T. L., Swanson, D. A. & Duffield, W. A. (1975). Chemical compositions of Kilauea east-rift lava, 1968-1971. Journal of Petrology 16, 110-133.
Wyss, M., Klein, F., Nagamine, K. & Wiemer, S. (2001). Anomalously high b-values in the South Flank of Kilauea volcano, Hawaii: evidence for the distribution of magma below Kilauea's East rift zone. Journal of Volcanology and Geothermal Research 106, 23-37.
Yang, H. J., Frey, F. A., Clague, D. A. & Garcia, M. O. (1999). Mineral chemistry of submarine lavas from Hilo Ridge, Hawaii: implications for magmatic processes within Hawaiian rift zones. Contributions to Mineralogy and Petrology 135, 355-372.
139
Yang, H. J., Frey, F. A., Garcia, M. O. & Clague, D. A. (1994). Submarine lavas from Mauna-Kea Volcano, Hawaii - Implications for Hawaiian shield stage processes. Journal of Geophysical
Research - Solid Earth 99, 15577-15594.
Yang, X. M., Davis, P. M., Delaney, P. T. & Okamura, A. T. (1992). Geodetic Analysis of Dike Intrusion and Motion of the Magma Reservoir beneath the Summit of Kilauea Volcano, Hawaii - 1970-1985. Journal of Geophysical Research-Solid Earth 97, 3305-3324.
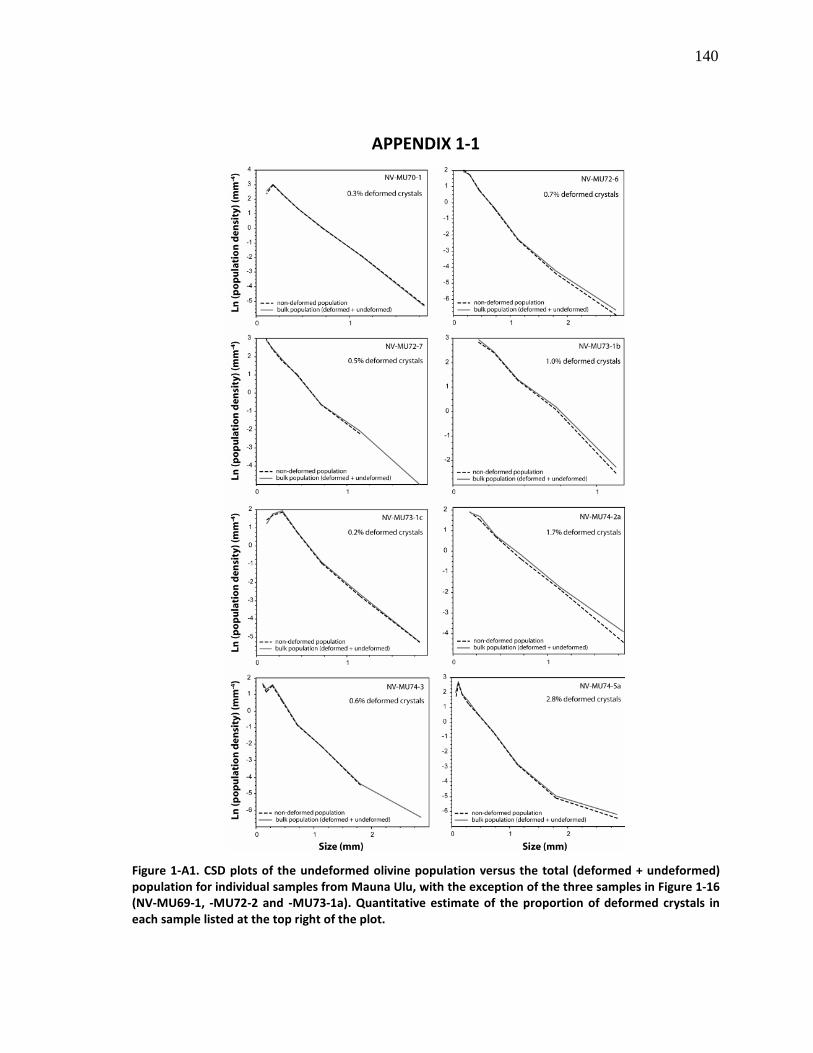
140
APPENDIX 1-1
Figure 1-A1. CSD plots of the undeformed olivine population versus the total (deformed + undeformed)
population for individual samples from Mauna Ulu, with the exception of the three samples in Figure 1-16
(NV-MU69-1, -MU72-2 and -MU73-1a). Quantitative estimate of the proportion of deformed crystals in
each sample listed at the top right of the plot.
141
CHAPITRE 2
WHAT CAN CRYSTAL SIZE DISTRIBUTIONS AND OLIVINE COMPOSITIONS TELL
US ABOUT MAGMA SOLIDIFICATION PROCESSES INSIDE KILAUEA IKI LAVA
LAKE, HAWAII?
NICOLAS VINET & MICHAEL D. HIGGINS
SCIENCES DE LA TERRE, UNIVERSITÉ DU QUÉBEC À CHICOUTIMI, CHICOUTIMI, G7H 2B1 CANADA
Journal of Volcanology and Geothermal Research In revision
142
2.1 ABSTRACT
Lava lakes offer the opportunity to investigate magma solidification and can be considered
as a proxy for small magma chambers. Here we present olivine compositions and crystal size
distributions (CSDs) from scoria and drill core samples from Kilauea Iki Lava Lake, which formed
during the 1959 eruption of Kilauea Volcano, Hawaii. Three chemically distinct olivine populations
were distinguished, on the basis of their forsterite (Fo) content: (1) a high-Fo population (Fo85-88);
(2) an intermediate-Fo population (Fo77-81); and (3) a minor low-Fo population (Fo72-76). Populations
1 and 2 both have deformed and undeformed crystals. The third population may be the result of
rejuvenation. Olivine in the lower 60 m of lake has a less Fo-rich composition and more crystals are
deformed. The CSD analysis yields estimates of the olivine residence time: 1-60 years. The shape
of the olivine CSDs is fairly uniform with respect to depth. Curved CSDs are considered to be
evidence of crystal or magma mixing. The turndown at smallest sizes of most lake CSDs may be the
result of coarsening. Our CSD modeling does not support significant crystal settling and overall
convection in the lava lake, although small advective currents are known to have occurred. The
olivine vertical stratification could be an original feature. However, this is not consistent with
supposed strong stirring of the lake magma due to intense activity over the 17 eruptive phases.
Independent basal feeding of the lake during the eruption is another possibility, and may be seen
as a likely mechanism to explain the stratification of the lake.
KEY WORDS: Hawaii; Kilauea Iki; lava lake; olivine; crystal size distribution; solidification processes
143
2.2 INTRODUCTION
A fundamental issue in igneous petrology is the understanding of magma solidification, with
emphasis on processes at work in magma chambers. Since direct examination of mafic magma
chambers is impossible, numerous experimental and numerical modelling studies have been
conducted to gain insights into those processes, revealing that convection and crystal settling
could play an important role, although it is much debated (e.g. Bowen, 1928; Brandeis and
Jaupart, 1986; Davaille and Jaupart, 1993; Gibb and Henderson, 1992; Jarvis and Woods, 1994;
Jaupart and Tait, 1995; Marsh, 1988a, 1989, 1996; Martin and Nokes, 1988, 1989; Rudman, 1992;
Sparks et al., 1993; Weinstein et al., 1988). Although these studies have enabled valuable progress
in the recognition and constraint of igneous mechanisms during solidification, the great complexity
of natural environments necessitates the use of natural samples in conjunction with geological
data acquired in the field. In this way, since they could be considered as “natural laboratories”,
lava lakes offer the opportunity to investigate magma solidification via in-situ analyses and can be
studied as a proxy for small magma chambers.
Volcanic products and lava lake samples are commonly studied by quantitative chemical and
isotopic analysis. However, it is helpful to complement this approach by the quantitative analysis
of rock textures. The texture of igneous rocks is one of the most direct means to investigate the
physical and chemical conditions of solidification. Crystal size distributions (CSDs) are the most
commonly studied aspect of textures. The CSD method provides valuable kinetic information for
examining the link between crystal nucleation and growth, and the overall cooling and magma
dynamics (Marsh, 2007). Mafic magmas have been the subject of many laboratory experiments
and numerical models, but the understanding of solidification under natural conditions is of great
144
importance. The CSD approach offers this possibility of investigating solidification in natural
dynamic systems, providing clues to both physical and chemical processes that have occurred.
Few CSD studies on natural basaltic (sensu lato) samples from lava lakes and sills have been
published. The only published study of olivine CSDs in natural basaltic samples is that of Mangan
(1990). She worked on scoria samples from the eruptive phases 1, 2, 4, 5, 7, 8, 9 and 16 of the
same 1959 eruption of Kilauea Iki studied here. She measured few crystals in each sample, so her
data has been amalgamated here into a single CSD. Cashman and Marsh (1988) worked mainly on
plagioclase and oxides in tholeiitic basalt from the Makaopuhi lava lake, Kilauea. These early
papers were exploratory in nature and time has come for more detailed work with a greater
number of samples, combining textural and geochemical approaches. In this paper, our primary
aim is to characterize texturally and geochemically the Kilauea Iki olivines in order to understand
and quantify the main solidification processes of tholeiitic magmas at work within the lava lake.
Our second purpose, closely related to the first one, is to clarify the active magma processes and
possible pathways through the plumbing at depth underneath Kilauea Iki, by comparison with the
dynamics of Mauna Ulu system.
This paper presents the results of textural and geochemical analyses from 3 eruption scoria
samples, 34 drill core samples taken from 1967 to 1988 and spot analyses of over 430 individual
olivine crystals. Here we consider the relationships among several early and late processes that are
thought to have occurred within Kilauea Iki lava lake. We present new quantitative textural and in-
situ geochemical information on the dynamics of these intra-lake processes and propose a model
along with temporal constraints that explain the crustal magmatic origin of the distinct olivine
populations.
145
2.3 THE 1959 KILAUEA IKI ERUPTION
Kilauea Iki lava lake formed during the 1959 eruption of Kilauea Volcano, an extensively
studied near-summit eruption of picritic lava that lasted from November 14 to December 20 (Helz,
1987a, b; Helz, 2009; Macdonald and Katsura, 1961; Murata and Richter, 1966a; Richter and
Eaton, 1960; Richter et al., 1970; Wright, 1973). It consisted of a sequence of 17 distinct eruptive
phases, separated by periods of drainback of lava from the lake down the vent. The lava ponded in
the pre-existing pit crater just next to the vent, and formed a small, undisturbed, self-roofed,
picritic magma chamber (Richter et al., 1970) with a volume of ~38 x 106 m³ and an estimated
mean MgO content of 15.4 wt %, corresponding to about 20 wt % olivine (Wright, 1973). Cycles of
overturns of the surface of the lake also occurred during this period. With the exceptions of the
first two days and the last eruptive phase, no significant changes in the overall mineralogy of the
lavas during the entire eruption were noted (Richter and Murata, 1966). The erupted, tholeiitic
olivine basalt lavas contained 4-30 vol. % of phenocryst olivine in a glassy or fine grained
groundmass with abundant microlites of clinopyroxene, plagioclase and opaque minerals (Richter
and Moore, 1966; Richter and Murata, 1966). Olivine occurred as varying sized crystals of up to 4
mm in diameter. Phenocrysts and microphenocrysts of clinopyroxene and plagioclase were only
present in the early and extremely late lavas; hypersthene was absent or very minor.
Since the end of December 1959, when the crustal foundering ceased and the upper crust
stabilised, the lava lake has been drilled repeatedly as it cooled and crystallised (Fig. 2-1a). 1960-
62 drilling results are presented in detail in Richter and Moore (1966), a review of the results for
the 1967-1981 drilling in Helz (1987a), and Helz (1993) for the final 1988 drilling. In 1981, it was
possible to drill through the partially molten core and into the lower crust. Consequently, Helz and
146
Wright (1983) reported that the processes of large-scale internal differentiation occurring in the
lake had stopped sometime between the 1979 drilling and 1981. Based on isotherm extrapolation,
the lake is thought to have completely solidified in the mid-1990s, representing 35 years of cooling
to reach the solidus throughout its maximum total thickness of 120-130 m (Barth et al., 1994; Helz,
2009, and references therein).
In a recent review, Helz (2009, her Table 1) summarised the major differentiation processes
within Kilauea Iki lava lake, and distinguished two different groups regarding the temperature
range: a group of higher-temperature processes that occurred within the partially molten core,
and a group of lower-temperature processes that were involved within the coherent crystal mush
zones surrounding the molten core. Some of these processes have been described and discussed
in earlier papers (Helz, 1980, 1987a; Helz, 1993; Helz et al., 1989; Jellinek and Kerr, 2001). She also
proposed the occurrence of double-layered lateral convection within the most olivine-poor part of
the lake, between late 1962 and mid-1964. The variety and extent of all these processes document
the complexity of the entire solidification of the lava body.
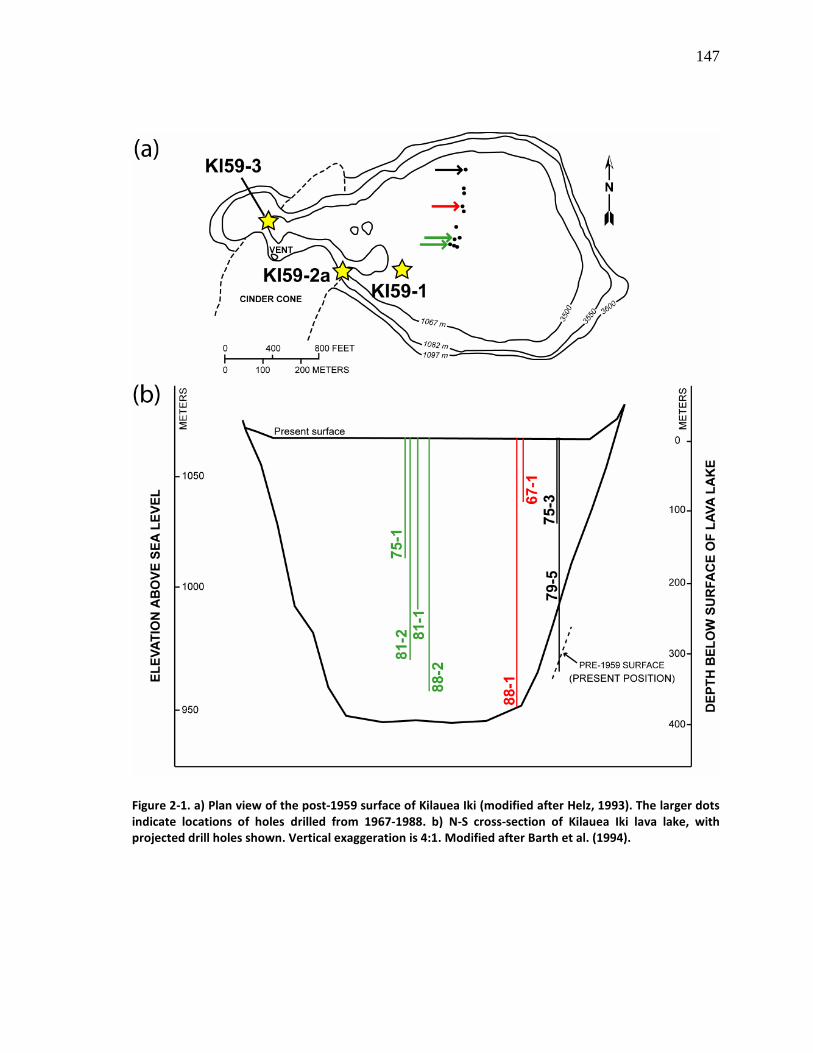
147
Figure 2-1. a) Plan view of the post-1959 surface of Kilauea Iki (modified after Helz, 1993). The larger dots
indicate locations of holes drilled from 1967-1988. b) N-S cross-section of Kilauea Iki lava lake, with
projected drill holes shown. Vertical exaggeration is 4:1. Modified after Barth et al. (1994).
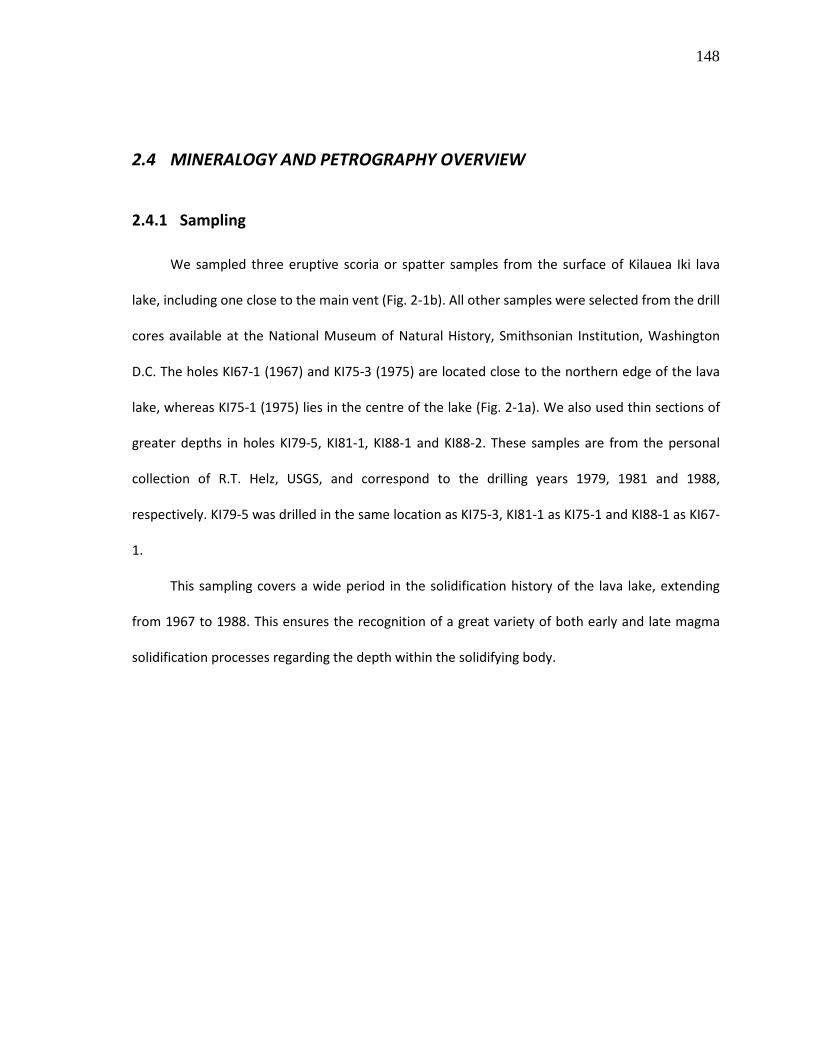
148
2.4 MINERALOGY AND PETROGRAPHY OVERVIEW
2.4.1 Sampling
We sampled three eruptive scoria or spatter samples from the surface of Kilauea Iki lava
lake, including one close to the main vent (Fig. 2-1b). All other samples were selected from the drill
cores available at the National Museum of Natural History, Smithsonian Institution, Washington
D.C. The holes KI67-1 (1967) and KI75-3 (1975) are located close to the northern edge of the lava
lake, whereas KI75-1 (1975) lies in the centre of the lake (Fig. 2-1a). We also used thin sections of
greater depths in holes KI79-5, KI81-1, KI88-1 and KI88-2. These samples are from the personal
collection of R.T. Helz, USGS, and correspond to the drilling years 1979, 1981 and 1988,
respectively. KI79-5 was drilled in the same location as KI75-3, KI81-1 as KI75-1 and KI88-1 as KI67-
1.
This sampling covers a wide period in the solidification history of the lava lake, extending
from 1967 to 1988. This ensures the recognition of a great variety of both early and late magma
solidification processes regarding the depth within the solidifying body.
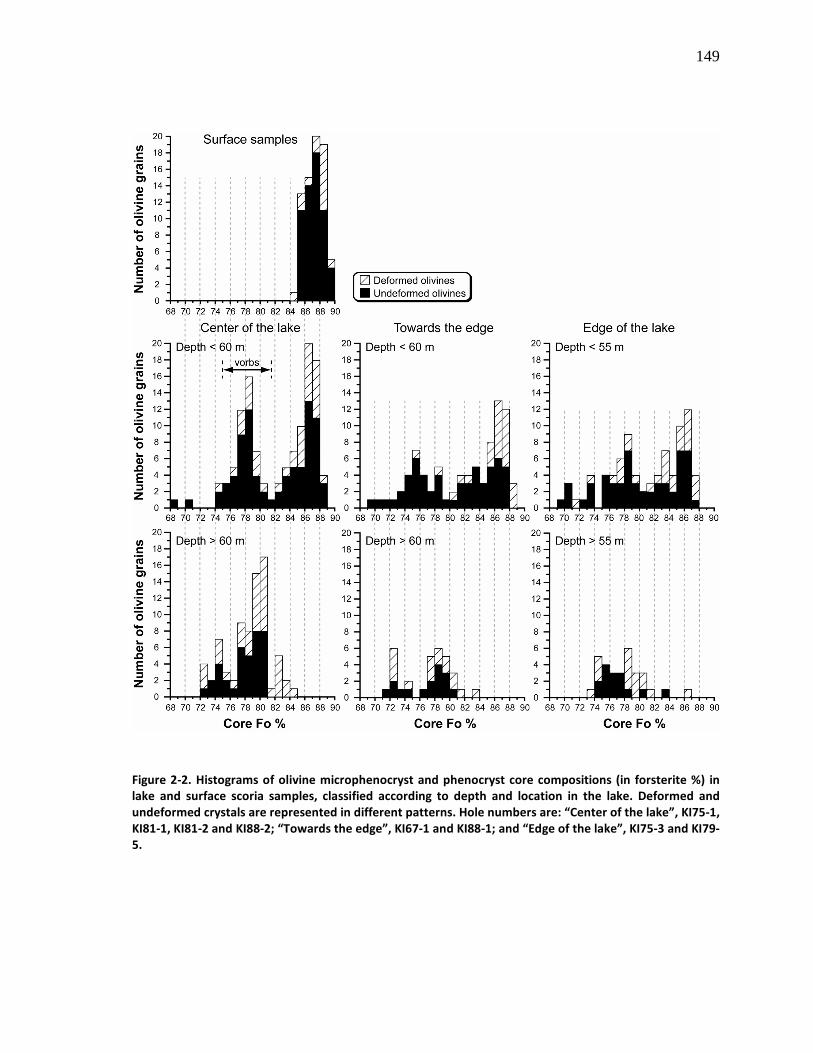
149
Figure 2-2. Histograms of olivine microphenocryst and phenocryst core compositions (in forsterite %) in
lake and surface scoria samples, classified according to depth and location in the lake. Deformed and
undeformed crystals are represented in different patterns. Hole numbers are: “Center of the lake”, KI75-1,
KI81-1, KI81-2 and KI88-2; “Towards the edge”, KI67-1 and KI88-1; and “Edge of the lake”, KI75-3 and KI79-
5.
150
2.4.2 Macroscopic characteristics
2.4.2.1 General remarks
The samples consist of strongly to almost non-vesicular olivine tholeiites to picrites with no
visible foliation. They contain 7-39 vol. % olivine in phenocrysts (>0.5 mm across) and
microphenocrysts (>0.1 to <0.5 mm across) as the most common crystalline phase, with about 15-
18 vol. % olivine in the surface samples. These volumes are vesicle-corrected. Detailed
petrographic descriptions of Kilauea Iki lake samples, both eruptive pumice and drill core from the
lake, are available in Richter and Eaton (1960), Murata and Richter (1966a), Richter and Moore
(1966), Richter and Murata (1966), Helz (1980) and Helz (1987b).
2.4.2.2 Olivines
Helz (1987b) observed and defined five classes of olivine crystals in the magmas of the 1959
Kilauea eruption, from both lava lake and eruption pumice samples:
(1) Irregular blocky crystals with deformation features;
(2) Equant, euhedral, skeletal or strongly elongate grains;
(3) Round or strongly resorbed grains;
(4) Fragmental grains (‘angular or conchoidal fragments’);
(5) Subhedral sulphide inclusion-bearing crystals.
As expected, all of these classes are also recognized in our samples, both in surface and drill core
products. Class 1 consists here of large grains, 1-10 mm long, that are present in all the samples in
varying proportions ranging from ~2 to 31% of the total crystal amount. Deformation is observed
151
optically as planar extinction discontinuities, undulose extinction, or subgrains in all the crystal
sizes. Edge rounding or resorption are common features of this class, as well. Class 2 olivine is the
most abundant. The grains commonly contain inclusions. We also noted rare evidence of
deformation for this class, which is in slight contradiction with Helz (1987b). Class 3 olivine is fairly
rare, typically a few percent of the total amount of olivines, as all the resorbed crystals with
deformation features have been placed in class 1. Classes 4 and 5 are very rare and deformed
grains are uncommon for both of those, even when the grains containing non-sulphide inclusion
swarms are counted. The megacrysts noted by Helz (1987b) were not found in our samples.
Although deformed crystals less than 0.5 mm in size are more difficult to recognize than larger
ones, they were found in every sample. All deformed olivine crystals appear to be normally zoned.
2.4.2.3 Olivine aggregates
Most olivine crystals in every sample, and thus most of the Helz’s classes appear to be part
of larger olivine aggregates, as previously mentioned by Helz (1987b), Schwindinger and Anderson
(1989), and Schwindinger (1999). Among the largest olivine aggregates, Helz (1987b) distinguished
two groups: (1) open, glomerocrystic clusters of class 2 grains, and (2) dunitic or dense olivine
aggregates. Group 2 is then subdivided into three subcategories: (1) dense aggregates of
dominantly class 1 grains; (2) dense clusters of class 5 grains with sulphide-bearing inclusions; and
(3) dunitic aggregates containing polygonal mosaics of unstrained olivine. In our samples olivine
aggregates are omnipresent in varying but high proportions, with the glomerocrystic aggregates
and the dense clusters of class 1 grains dominating. It is clearly the great majority of olivine
crystals in all our samples. The clusters typically contain 2-6 individual crystals. This was also
152
observed in the 1969-74 Mauna Ulu lavas (Vinet and Higgins, 2010), but with overall smaller
crystals and smaller aggregates. It is especially conspicuous in the Mauna Ulu lavas, and we note it
as well here, that there is a great variability in the way in which the grains are connected in each
aggregate. They range from adjacent, separate grains that may be connected in the third
dimension, to clumps of crystals that are completely attached. Finally, some aggregates are re-
equilibrated with originally separate grains becoming subgrains. In addition, we identified in KI67-
1-05 one large dunitic aggregate of 230 grains containing rare deformed crystals. It is thought to
resemble the last subcategory of dense aggregates of Helz (1987b), partly consisting in polygonal
mosaics of undeformed olivines. It is the only example of this type of dense aggregate in our
samples.
2.4.2.4 Other minerals
Kilauea Iki lavas also contain significant amounts of other minerals. Cr-spinel occurs within
the olivine grains but mostly as separate crystals, commonly adjacent to the olivine grains.
However, a few samples contain a lower amount of Cr-spinel that appears mostly included in
olivine, as in the core KI81-1, for example. The Cr-spinel crystals are anhedral to euhedral and 10-
100 µm in size. Clinopyroxene and plagioclase are rare as phenocrysts, but very common as
microphenocrysts, 0.1 to 0.5 mm across, or microlites in the matrix. They may have grown during
the eruption of their host lava and during the solidification period of the lava lake. Some
microphenocrysts and phenocrysts of clinopyroxene show deformation features such as undulose
or sector extinctions. Plagioclase, clinopyroxene and Cr-spinel were too small or not sufficiently
abundant for their textures to be determined quantitatively.
153
2.4.2.5 Vertical olivine-rich bodies
Helz (1980, 1987a) described irregular, meter-scaled, pipe-like bodies that are mostly found
at a depth range of 40-58 m within the lake, which she named vertical olivine-rich bodies (vorbs).
Three lava lake samples in this study, KI75-1-141, KI75-1-145 and KI81-2-185.7, contain clear
evidence of the presence of such vorbs. They are enriched in iron-rich olivine (Fo77-79) and
differentiated liquid, and have greater vesicle concentrations, relative to the adjacent host rock.
Typically, the groundmass assemblage of olivine + augite + plagioclase in the vorb mostly formed
adjacent to olivine, resulting in a related melt free of crystals. This textural observation is the key
point in the recognition of such vorbs relative to their normal olivine-phyric matrix hosts. Helz et
al. (1989, caption of Fig. 2b) further described the vorbs as containing “coarser, more abundant
olivine, and more glass, in larger pools, than does the normal matrix rock”. They also noted that
“the irregular distribution and grain size of groundmass phases [augite and plagioclase mostly] in
the vorb contrast strongly with the uniform distribution and grain size of these phases in the
normal matrix rock”. Helz (1987a) argued that the vorbs might be related, to a certain extent, to
segregation veins. She also mentioned that their formation started by 1966, and ended in 1979.
2.4.2.6 Olivine-depleted zone
An olivine-depleted, low-MgO zone was identified to lie between ~18 to 40 m deep in the
lake (Helz, 1980, 1987b; Helz, 2009; Helz et al., 1984; Helz and Wright, 1983). It contains 4.6 vol. %
in average for the entire zone, of small, euhedral or rounded olivine phenocrysts (class 2) for the
154
great majority (Helz, 2009). Contrary to Helz (1980, 1987b) who noted the absence of class 1
olivines in this zone, here we observed some of those both in our samples and in other samples
from National Rock and Ore Collections, National Museum of Natural History, Smithsonian
Institution, Washington D.C. (not presented in this study). Helz (2009) also observed an olivine-
rich, MgO-rich cumulate zone below ~55 m deep. She argued that the broadly S-shaped profile of
MgO vs depth is consistent with redistribution of olivine phenocrysts within the lake in response to
gravity, from the olivine-poor zone down to the olivine-rich zone. In this study, only a few samples
from this olivine-depleted zone have been selected, near the upper and lower limits, because very
most have insufficient olivine content to be included in the CSD analysis with reasonable
uncertainties.
2.4.3 Chemical studies
2.4.3.1 Analytical methods
Olivine and glass major element compositions were measured in thin sections using the five-
spectrometer, Cameca SX-100 electron-microprobe at the Université Laval Microanalysis
Laboratory, Québec City, Canada. Both olivine and glass were analysed at 15 kV and 20 nA beam
current, with a 5 µm spot size and using a wavelength dispersive spectra (WDS) mode. At least two
spots, one in the core and one in the rim of each olivine, were analyzed to check for compositional
zoning.
155
2.4.3.2 Olivine core and rim composition distribution
The cores and rims of over 430 olivine phenocrysts and microphenocrysts were analysed
from 3 eruption scoria and 34 drill core samples. The forsterite (Fo) content of the olivine cores in
all the Kilauea Iki lavas analysed here ranges from 68 to 90% (Fig. 2-2; Table 2-1). Within this wide
range of compositions, olivine in the surface samples is distinguished by high core Fo (Fo85-90) and
limited zoning. This range contrasts with the generally lower Fo values of lava lake olivines,
although there is a partial overlap. Amongst the lava lake samples, two distinct populations of
olivines can be distinguished using their core Fo content: a high-Fo group (Fo85-88) and a low-Fo
group (Fo77-81). This distribution seems to be mainly controlled by the olivines present at depths
down to 60 m, and particularly in the centre of the lava lake. At depths of 60-90 m, the distribution
of olivine composition changes. It consists of Fo72-84 contents, with the range of the low-Fo group,
Fo77-81, dominating. This low-Fo group is clearly visible in the centre and toward the edge of the
lake, whereas it is less evident at the edge of the lake. The high-Fo group is absent at these depths.
Furthermore, at depths of 60-90 m some olivine grains are slightly Fo-depleted compared to the
low-Fo group, with a bulk composition of Fo72-76. Although minor in amount, those olivines may be
a third population present within the lava lake. Finally, the composition of the olivine in the vorbs
is in agreement with the Fo77-79 range established by Helz (1987a).
In contrast to the Fo variation of the olivine cores, the overall composition of the olivine
rims is much less variable and approximates a Gaussian distribution (Fig. 2-3). The major peak of
composition is around Fo72-76, which corresponds to the Fo range of the third olivine population
defined by the crystal core composition. Also to be noted is the wider range of rim composition,
Fo57-88, as compared to the core compositions.
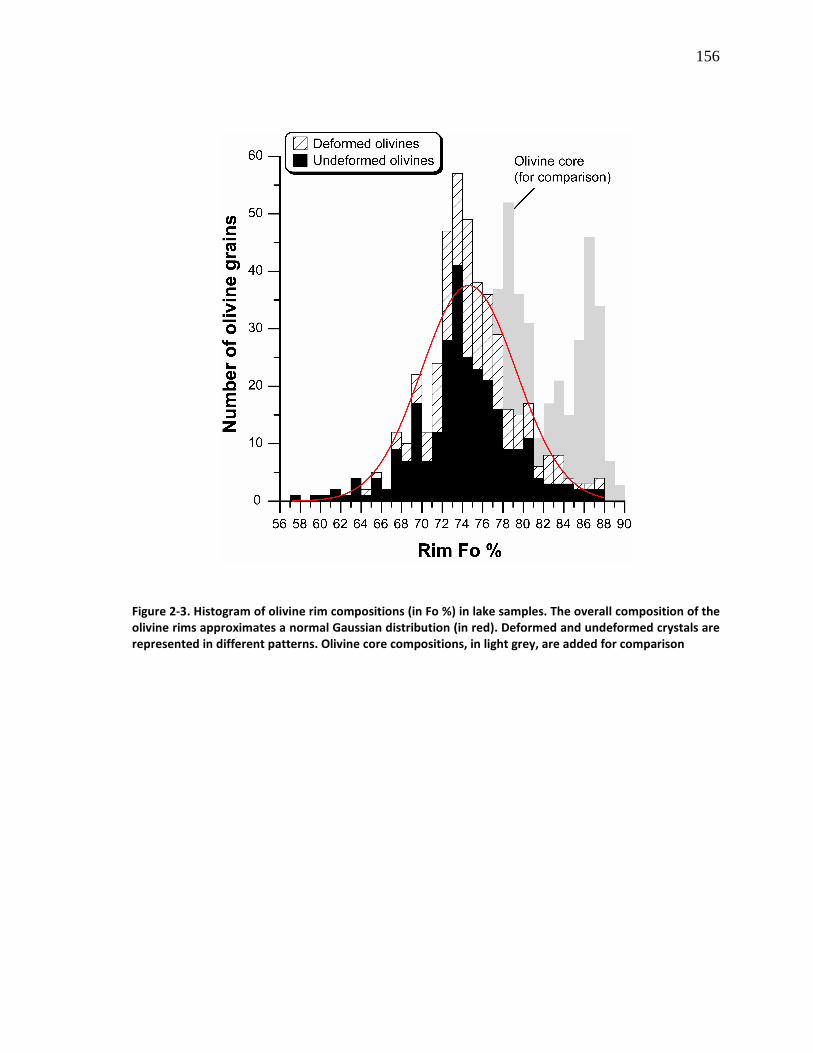
156
Figure 2-3. Histogram of olivine rim compositions (in Fo %) in lake samples. The overall composition of the
olivine rims approximates a normal Gaussian distribution (in red). Deformed and undeformed crystals are
represented in different patterns. Olivine core compositions, in light grey, are added for comparison
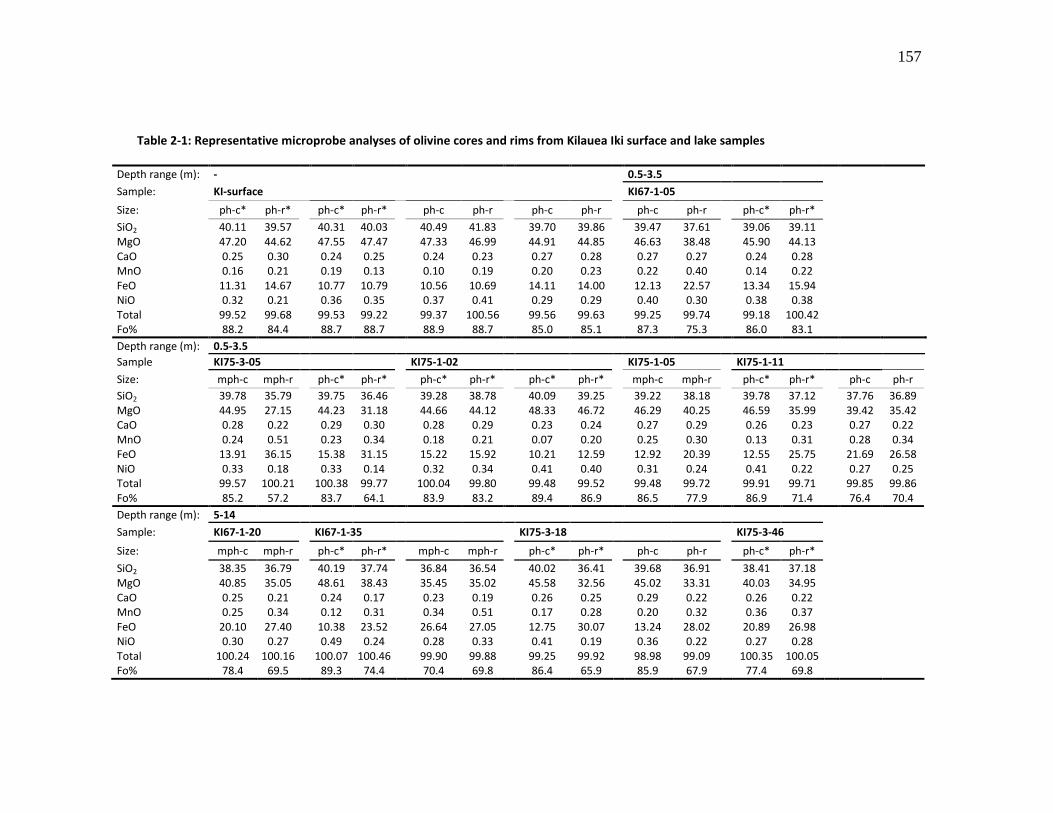
157
Table 2-1: Representative microprobe analyses of olivine cores and rims from Kilauea Iki surface and lake samples
Depth range (m): - 0.5-3.5
Sample: KI-surface KI67-1-05
Size: ph-c* ph-r* ph-c* ph-r* ph-c ph-r ph-c ph-r ph-c ph-r ph-c* ph-r*
SiO2 40.11 39.57 40.31 40.03 40.49 41.83 39.70 39.86 39.47 37.61 39.06 39.11 MgO 47.20 44.62 47.55 47.47 47.33 46.99 44.91 44.85 46.63 38.48 45.90 44.13 CaO 0.25 0.30 0.24 0.25 0.24 0.23 0.27 0.28 0.27 0.27 0.24 0.28 MnO 0.16 0.21 0.19 0.13 0.10 0.19 0.20 0.23 0.22 0.40 0.14 0.22 FeO 11.31 14.67 10.77 10.79 10.56 10.69 14.11 14.00 12.13 22.57 13.34 15.94 NiO 0.32 0.21 0.36 0.35 0.37 0.41 0.29 0.29 0.40 0.30 0.38 0.38 Total 99.52 99.68 99.53 99.22 99.37 100.56 99.56 99.63 99.25 99.74 99.18 100.42 Fo% 88.2 84.4 88.7 88.7 88.9 88.7 85.0 85.1 87.3 75.3 86.0 83.1
Depth range (m): 0.5-3.5
Sample KI75-3-05 KI75-1-02 KI75-1-05 KI75-1-11
Size: mph-c mph-r ph-c* ph-r* ph-c* ph-r* ph-c* ph-r* mph-c mph-r ph-c* ph-r* ph-c ph-r
SiO2 39.78 35.79 39.75 36.46 39.28 38.78 40.09 39.25 39.22 38.18 39.78 37.12 37.76 36.89 MgO 44.95 27.15 44.23 31.18 44.66 44.12 48.33 46.72 46.29 40.25 46.59 35.99 39.42 35.42 CaO 0.28 0.22 0.29 0.30 0.28 0.29 0.23 0.24 0.27 0.29 0.26 0.23 0.27 0.22 MnO 0.24 0.51 0.23 0.34 0.18 0.21 0.07 0.20 0.25 0.30 0.13 0.31 0.28 0.34 FeO 13.91 36.15 15.38 31.15 15.22 15.92 10.21 12.59 12.92 20.39 12.55 25.75 21.69 26.58 NiO 0.33 0.18 0.33 0.14 0.32 0.34 0.41 0.40 0.31 0.24 0.41 0.22 0.27 0.25 Total 99.57 100.21 100.38 99.77 100.04 99.80 99.48 99.52 99.48 99.72 99.91 99.71 99.85 99.86 Fo% 85.2 57.2 83.7 64.1 83.9 83.2 89.4 86.9 86.5 77.9 86.9 71.4 76.4 70.4
Depth range (m): 5-14
Sample: KI67-1-20 KI67-1-35 KI75-3-18 KI75-3-46
Size: mph-c mph-r ph-c* ph-r* mph-c mph-r ph-c* ph-r* ph-c ph-r ph-c* ph-r*
SiO2 38.35 36.79 40.19 37.74 36.84 36.54 40.02 36.41 39.68 36.91 38.41 37.18 MgO 40.85 35.05 48.61 38.43 35.45 35.02 45.58 32.56 45.02 33.31 40.03 34.95 CaO 0.25 0.21 0.24 0.17 0.23 0.19 0.26 0.25 0.29 0.22 0.26 0.22 MnO 0.25 0.34 0.12 0.31 0.34 0.51 0.17 0.28 0.20 0.32 0.36 0.37 FeO 20.10 27.40 10.38 23.52 26.64 27.05 12.75 30.07 13.24 28.02 20.89 26.98 NiO 0.30 0.27 0.49 0.24 0.28 0.33 0.41 0.19 0.36 0.22 0.27 0.28 Total 100.24 100.16 100.07 100.46 99.90 99.88 99.25 99.92 98.98 99.09 100.35 100.05 Fo% 78.4 69.5 89.3 74.4 70.4 69.8 86.4 65.9 85.9 67.9 77.4 69.8
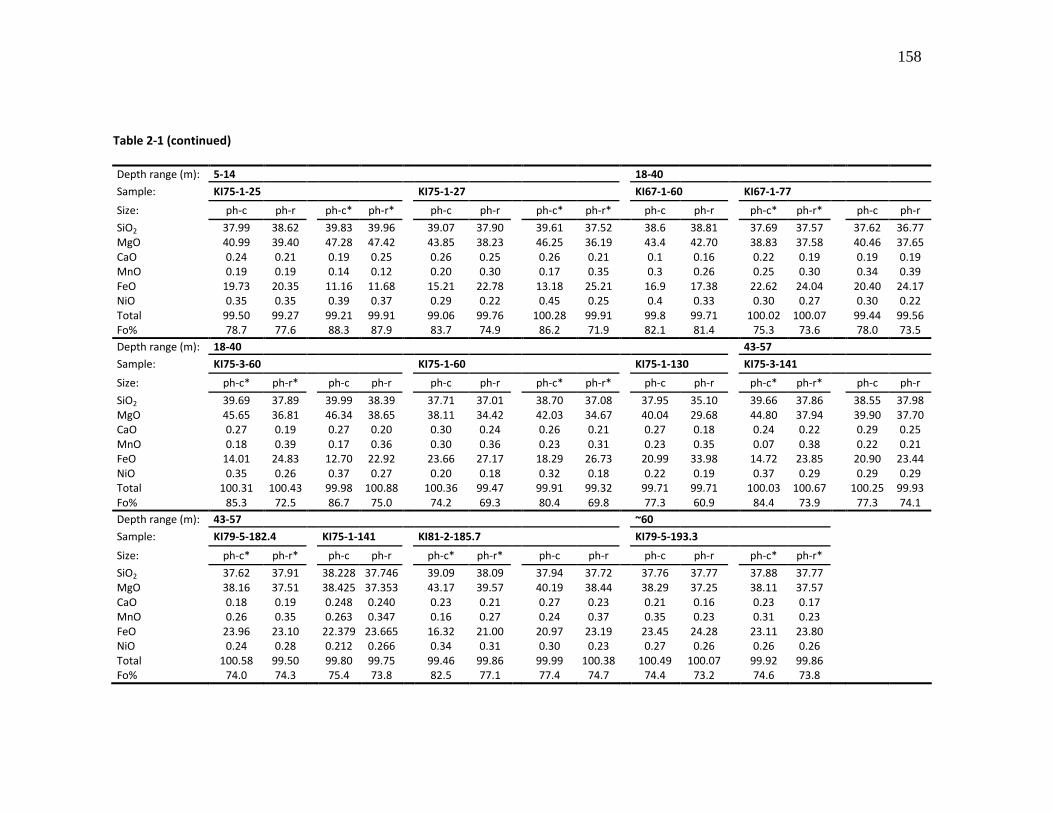
158
Table 2-1 (continued)
Depth range (m): 5-14 18-40
Sample: KI75-1-25 KI75-1-27 KI67-1-60 KI67-1-77
Size: ph-c ph-r ph-c* ph-r* ph-c ph-r ph-c* ph-r* ph-c ph-r ph-c* ph-r* ph-c ph-r
SiO2 37.99 38.62 39.83 39.96 39.07 37.90 39.61 37.52 38.6 38.81 37.69 37.57 37.62 36.77 MgO 40.99 39.40 47.28 47.42 43.85 38.23 46.25 36.19 43.4 42.70 38.83 37.58 40.46 37.65 CaO 0.24 0.21 0.19 0.25 0.26 0.25 0.26 0.21 0.1 0.16 0.22 0.19 0.19 0.19 MnO 0.19 0.19 0.14 0.12 0.20 0.30 0.17 0.35 0.3 0.26 0.25 0.30 0.34 0.39 FeO 19.73 20.35 11.16 11.68 15.21 22.78 13.18 25.21 16.9 17.38 22.62 24.04 20.40 24.17 NiO 0.35 0.35 0.39 0.37 0.29 0.22 0.45 0.25 0.4 0.33 0.30 0.27 0.30 0.22 Total 99.50 99.27 99.21 99.91 99.06 99.76 100.28 99.91 99.8 99.71 100.02 100.07 99.44 99.56 Fo% 78.7 77.6 88.3 87.9 83.7 74.9 86.2 71.9 82.1 81.4 75.3 73.6 78.0 73.5
Depth range (m): 18-40 43-57
Sample: KI75-3-60 KI75-1-60 KI75-1-130 KI75-3-141
Size: ph-c* ph-r* ph-c ph-r ph-c ph-r ph-c* ph-r* ph-c ph-r ph-c* ph-r* ph-c ph-r
SiO2 39.69 37.89 39.99 38.39 37.71 37.01 38.70 37.08 37.95 35.10 39.66 37.86 38.55 37.98 MgO 45.65 36.81 46.34 38.65 38.11 34.42 42.03 34.67 40.04 29.68 44.80 37.94 39.90 37.70 CaO 0.27 0.19 0.27 0.20 0.30 0.24 0.26 0.21 0.27 0.18 0.24 0.22 0.29 0.25 MnO 0.18 0.39 0.17 0.36 0.30 0.36 0.23 0.31 0.23 0.35 0.07 0.38 0.22 0.21 FeO 14.01 24.83 12.70 22.92 23.66 27.17 18.29 26.73 20.99 33.98 14.72 23.85 20.90 23.44 NiO 0.35 0.26 0.37 0.27 0.20 0.18 0.32 0.18 0.22 0.19 0.37 0.29 0.29 0.29 Total 100.31 100.43 99.98 100.88 100.36 99.47 99.91 99.32 99.71 99.71 100.03 100.67 100.25 99.93 Fo% 85.3 72.5 86.7 75.0 74.2 69.3 80.4 69.8 77.3 60.9 84.4 73.9 77.3 74.1
Depth range (m): 43-57 ~60
Sample: KI79-5-182.4 KI75-1-141 KI81-2-185.7 KI79-5-193.3
Size: ph-c* ph-r* ph-c ph-r ph-c* ph-r* ph-c ph-r ph-c ph-r ph-c* ph-r*
SiO2 37.62 37.91 38.228 37.746 39.09 38.09 37.94 37.72 37.76 37.77 37.88 37.77 MgO 38.16 37.51 38.425 37.353 43.17 39.57 40.19 38.44 38.29 37.25 38.11 37.57 CaO 0.18 0.19 0.248 0.240 0.23 0.21 0.27 0.23 0.21 0.16 0.23 0.17 MnO 0.26 0.35 0.263 0.347 0.16 0.27 0.24 0.37 0.35 0.23 0.31 0.23 FeO 23.96 23.10 22.379 23.665 16.32 21.00 20.97 23.19 23.45 24.28 23.11 23.80 NiO 0.24 0.28 0.212 0.266 0.34 0.31 0.30 0.23 0.27 0.26 0.26 0.26 Total 100.58 99.50 99.80 99.75 99.46 99.86 99.99 100.38 100.49 100.07 99.92 99.86 Fo% 74.0 74.3 75.4 73.8 82.5 77.1 77.4 74.7 74.4 73.2 74.6 73.8
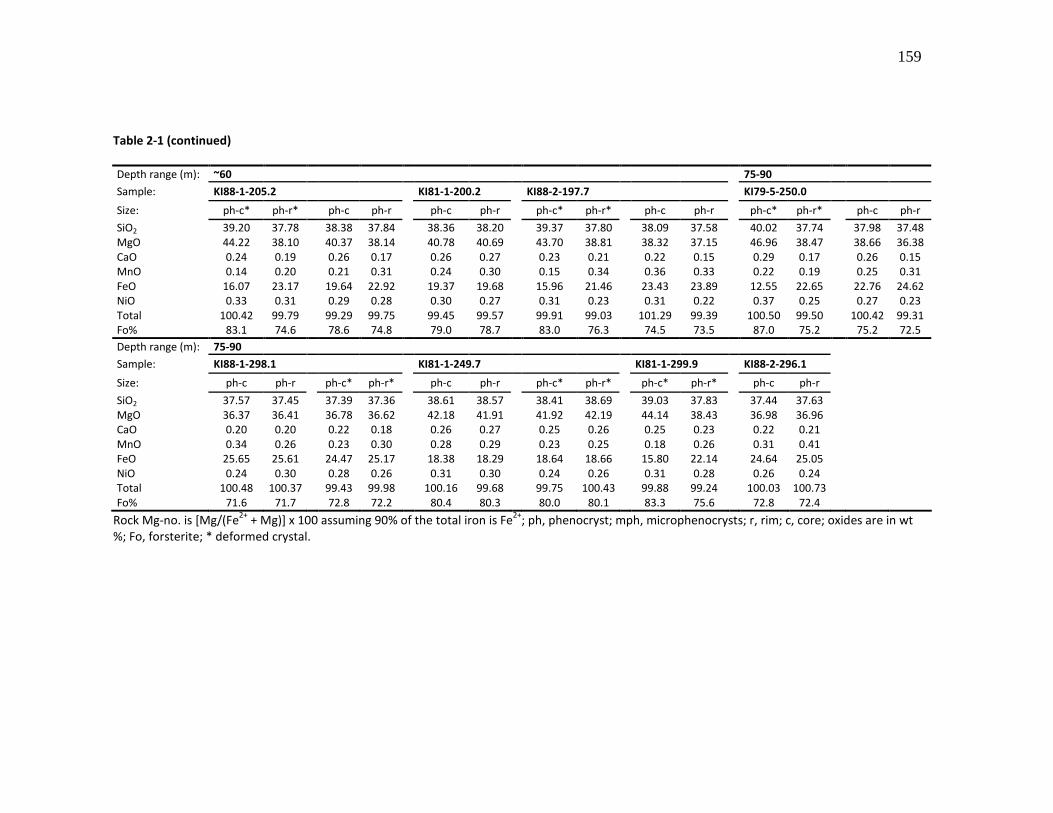
159
Table 2-1 (continued)
Depth range (m): ~60 75-90
Sample: KI88-1-205.2 KI81-1-200.2 KI88-2-197.7 KI79-5-250.0
Size: ph-c* ph-r* ph-c ph-r ph-c ph-r ph-c* ph-r* ph-c ph-r ph-c* ph-r* ph-c ph-r
SiO2 39.20 37.78 38.38 37.84 38.36 38.20 39.37 37.80 38.09 37.58 40.02 37.74 37.98 37.48 MgO 44.22 38.10 40.37 38.14 40.78 40.69 43.70 38.81 38.32 37.15 46.96 38.47 38.66 36.38 CaO 0.24 0.19 0.26 0.17 0.26 0.27 0.23 0.21 0.22 0.15 0.29 0.17 0.26 0.15 MnO 0.14 0.20 0.21 0.31 0.24 0.30 0.15 0.34 0.36 0.33 0.22 0.19 0.25 0.31 FeO 16.07 23.17 19.64 22.92 19.37 19.68 15.96 21.46 23.43 23.89 12.55 22.65 22.76 24.62 NiO 0.33 0.31 0.29 0.28 0.30 0.27 0.31 0.23 0.31 0.22 0.37 0.25 0.27 0.23 Total 100.42 99.79 99.29 99.75 99.45 99.57 99.91 99.03 101.29 99.39 100.50 99.50 100.42 99.31 Fo% 83.1 74.6 78.6 74.8 79.0 78.7 83.0 76.3 74.5 73.5 87.0 75.2 75.2 72.5
Depth range (m): 75-90
Sample: KI88-1-298.1 KI81-1-249.7 KI81-1-299.9 KI88-2-296.1
Size: ph-c ph-r ph-c* ph-r* ph-c ph-r ph-c* ph-r* ph-c* ph-r* ph-c ph-r
SiO2 37.57 37.45 37.39 37.36 38.61 38.57 38.41 38.69 39.03 37.83 37.44 37.63 MgO 36.37 36.41 36.78 36.62 42.18 41.91 41.92 42.19 44.14 38.43 36.98 36.96 CaO 0.20 0.20 0.22 0.18 0.26 0.27 0.25 0.26 0.25 0.23 0.22 0.21 MnO 0.34 0.26 0.23 0.30 0.28 0.29 0.23 0.25 0.18 0.26 0.31 0.41 FeO 25.65 25.61 24.47 25.17 18.38 18.29 18.64 18.66 15.80 22.14 24.64 25.05 NiO 0.24 0.30 0.28 0.26 0.31 0.30 0.24 0.26 0.31 0.28 0.26 0.24 Total 100.48 100.37 99.43 99.98 100.16 99.68 99.75 100.43 99.88 99.24 100.03 100.73 Fo% 71.6 71.7 72.8 72.2 80.4 80.3 80.0 80.1 83.3 75.6 72.8 72.4
Rock Mg-no. is [Mg/(Fe2+
+ Mg)] x 100 assuming 90% of the total iron is Fe2+
; ph, phenocryst; mph, microphenocrysts; r, rim; c, core; oxides are in wt %; Fo, forsterite; * deformed crystal.
160
2.4.3.3 Fe-Mg zoning
The great majority of the lava lake olivine crystals show moderate to strong normal zoning
from core to rim, whereas olivines in surface samples are mostly unzoned or only marked by slight
normal zoning, with a maximum Fo variation of ~4% (Table 2-1; Fig. 2-4). Almost no reverse zoning
and no complex zoning are observed in any crystals. The Fo variation of normal zoning in the lava
lake olivines is very variable, with a bulk maximum of 28% in KI75-3-05, at the edge of the lake.
Overall, zoning increases with the increase of core Fo content, at every depth except 0.5-3.5 m,
and for all of the drilling locations. It is somewhat more complex for samples from the centre of
the lake; hence the centre and margin will be discussed separately.
Normal zoning in olivines from the centre of the lake (holes KI75-1, KI81-1, KI81-2 and KI88-
2) varies markedly and extends from slightly negative values to ~17% Fo variation (Fig. 2-4).
Normal zoning is strong in the upper 40 m and much weaker in the lower 50 m. Some unzoned
olivines are present at very shallow depths (0.5 to 3.5 m), but they are much more abundant
between 60 and 90 m.
Normal zoning in olivines from the margin of the lake (holes KI67-1, KI75-3, KI79-5 and KI88-
1) varies from zero to ~28% Fo and decreases in magnitude downward. At shallow depths, 0.5-14
m, strong Fo variations are observed, which is expressed as a reduced range of higher core Fo
content, Fo83-90, (0.5-3.5 m), or for the entire range of core Fo contents, Fo70-90, (5-14 m). Overall,
the distribution of normal zoning is quite comparable for depths of 43-90 m. At the margin of the
lake, it is thus at shallow levels that greatest zoning is developed in olivine. This is the region most
strongly modified by foundering of crust.
161
Vorbs behave differently from other samples, in terms of Fo zoning. The vorb parts of KI75-
1-141 and KI75-1-145 show a narrower range of zoning, with core and rim Fo content lying around
Fo75-79 and Fo77-80 respectively. This tendency is less obvious for the third vorb-bearing (KI81-2-
185.7).
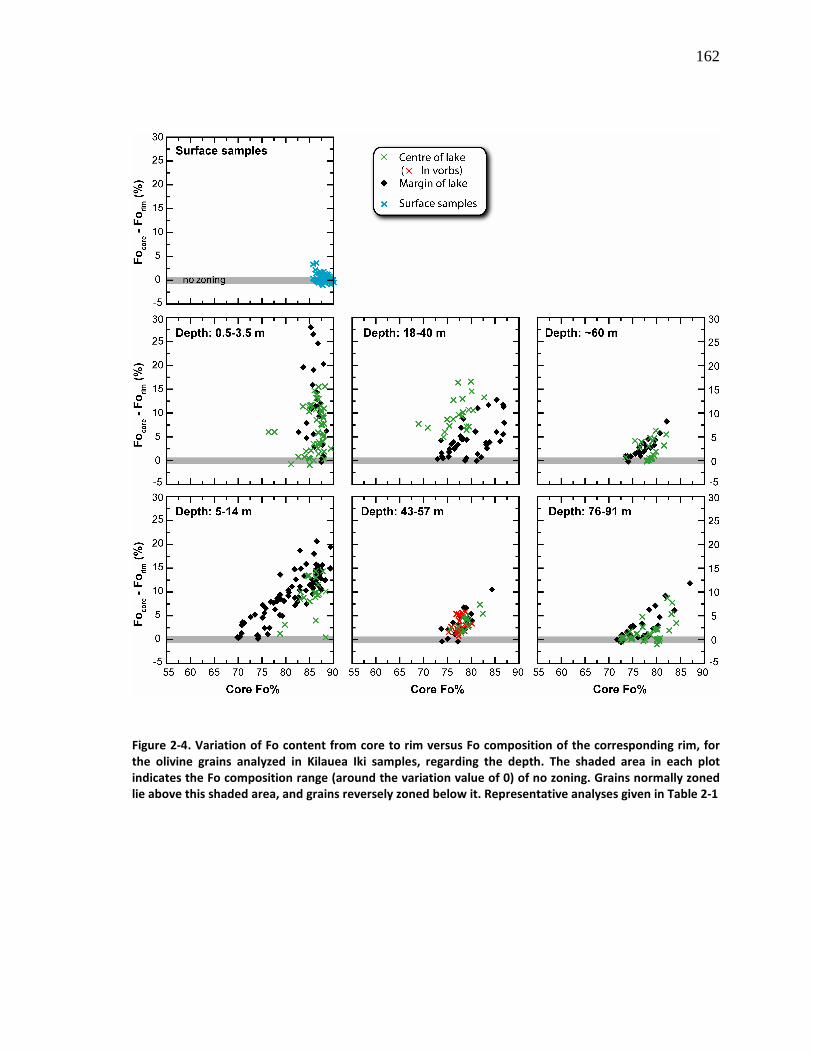
162
Figure 2-4. Variation of Fo content from core to rim versus Fo composition of the corresponding rim, for
the olivine grains analyzed in Kilauea Iki samples, regarding the depth. The shaded area in each plot
indicates the Fo composition range (around the variation value of 0) of no zoning. Grains normally zoned
lie above this shaded area, and grains reversely zoned below it. Representative analyses given in Table 2-1
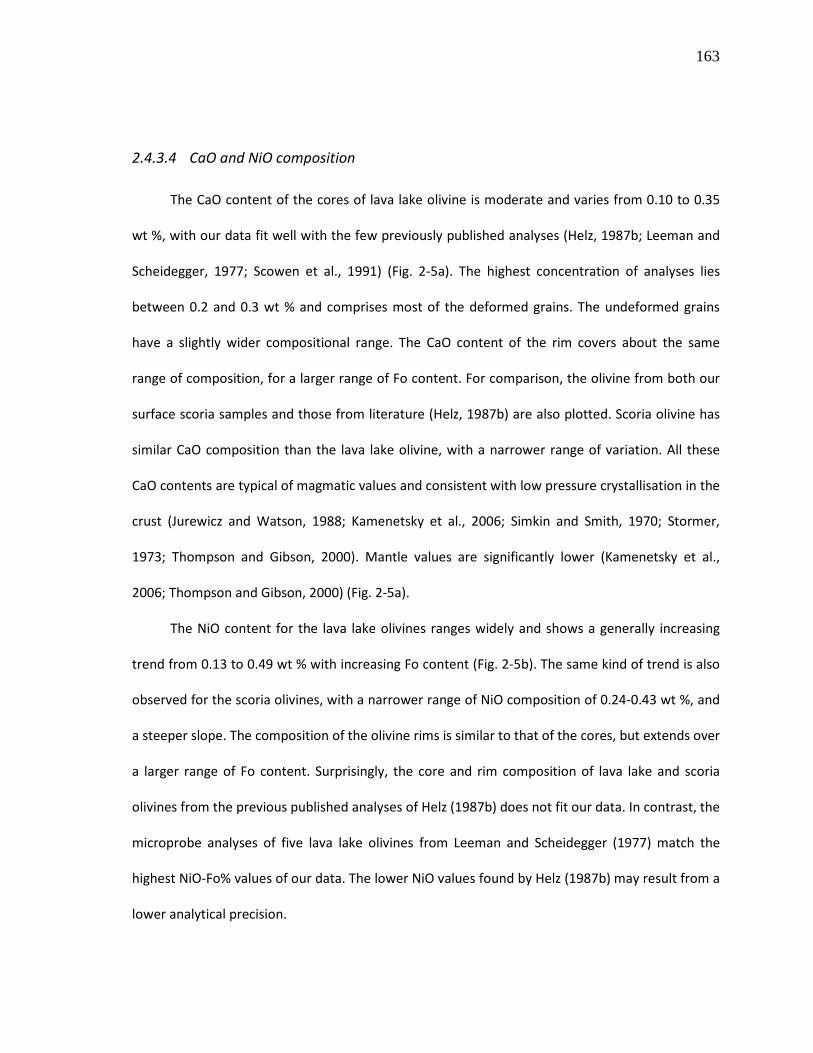
163
2.4.3.4 CaO and NiO composition
The CaO content of the cores of lava lake olivine is moderate and varies from 0.10 to 0.35
wt %, with our data fit well with the few previously published analyses (Helz, 1987b; Leeman and
Scheidegger, 1977; Scowen et al., 1991) (Fig. 2-5a). The highest concentration of analyses lies
between 0.2 and 0.3 wt % and comprises most of the deformed grains. The undeformed grains
have a slightly wider compositional range. The CaO content of the rim covers about the same
range of composition, for a larger range of Fo content. For comparison, the olivine from both our
surface scoria samples and those from literature (Helz, 1987b) are also plotted. Scoria olivine has
similar CaO composition than the lava lake olivine, with a narrower range of variation. All these
CaO contents are typical of magmatic values and consistent with low pressure crystallisation in the
crust (Jurewicz and Watson, 1988; Kamenetsky et al., 2006; Simkin and Smith, 1970; Stormer,
1973; Thompson and Gibson, 2000). Mantle values are significantly lower (Kamenetsky et al.,
2006; Thompson and Gibson, 2000) (Fig. 2-5a).
The NiO content for the lava lake olivines ranges widely and shows a generally increasing
trend from 0.13 to 0.49 wt % with increasing Fo content (Fig. 2-5b). The same kind of trend is also
observed for the scoria olivines, with a narrower range of NiO composition of 0.24-0.43 wt %, and
a steeper slope. The composition of the olivine rims is similar to that of the cores, but extends over
a larger range of Fo content. Surprisingly, the core and rim composition of lava lake and scoria
olivines from the previous published analyses of Helz (1987b) does not fit our data. In contrast, the
microprobe analyses of five lava lake olivines from Leeman and Scheidegger (1977) match the
highest NiO-Fo% values of our data. The lower NiO values found by Helz (1987b) may result from a
lower analytical precision.
164
Figure 2-5. CaO (a) and NiO (b) content versus Fo content (%) of the core of both the undeformed and
deformed olivine crystals analyzed in the lake samples. Also plotted are the rim compositions for the lake
olivine, along with core compositions for the surface scoria olivine. Previous published analyses of
eruption-pumice and lake olivines have been added for comparison. All olivines plot away up from the
mantle domain indicated as the shaded area. Hence, no mantle xenocrysts are present here.
Lava lake olivine: Helz (1987b), CaO and NiO; Leeman and Scheideigger (1977), CaO and NiO; Scowen et al.
(1991), CaO. Mantle domain after Kamenetsky et al. (2006); Thompson and Gibson (2000)
165
2.4.4 Deformed olivine crystals
There are no systematic compositional differences between deformed and undeformed
olivines in either microphenocrysts or phenocrysts (Fo content, Fig. 2-2; CaO and NiO contents,
Fig. 2-5), and no differences in zoning amounts and distributions. In other words, only optical
deformation features permit us to distinguish under the microscope the deformed crystals from
the undeformed ones. This is in agreement with previous findings from lavas from the Hawaii
Scientific Drilling Project (Garcia, 1996) and from some olivine-rich lavas taken amongst other
Hawaiian picrites (Norman and Garcia, 1999; Wilkinson and Hensel, 1988).
The olivine crystals with deformation features are ubiquitous both in the scoria and lake
samples. Deformed crystals have the same range of sizes of undeformed crystals. They are present
as a variable proportion of total olivine crystals, ranging from 1.8-26.6 %, and up to 31.4 % in the
vorb-only part of KI81-2-185.7 (Table 2-2). In terms of total volumetric abundance for each whole
sample, it corresponds to 0.2-10.3 vol. % and up to 12.1 vol. % in the vorb-only part of KI81-2-
185.7. In a plot of (ratio of deformed grains / total olivine number) versus depth (Fig. 2-6), one can
observe that for depths <20 m up to three times more deformed grains occur at the centre (holes
KI75-1, KI81-1, KI81-2 and KI88-2) and toward the edge (holes KI67-1 and KI88-1) of the lake
relative to the edge (holes KI75-3 and KI79-5). In the olivine poor zone (20-40 m), there is a
pronounced decrease in the proportion of deformed grains for samples at the centre of the lake.
The same is noted as well for samples toward the edge of the lake, but it is less pronounced. At
depths greater than 40 m deformed grains are again more abundant. This is observed for all the
different drilling locations, but the proportion is more variable for the edge holes.

166
The vorbs of the hole KI75-1 have a similar proportion of deformed grains to the whole
olivine population of the sample, at that depth. In contrast, the vorb part of KI81-2-185.7 has 31%
deformed crystals, which is clearly much more abundant than that in any other samples.
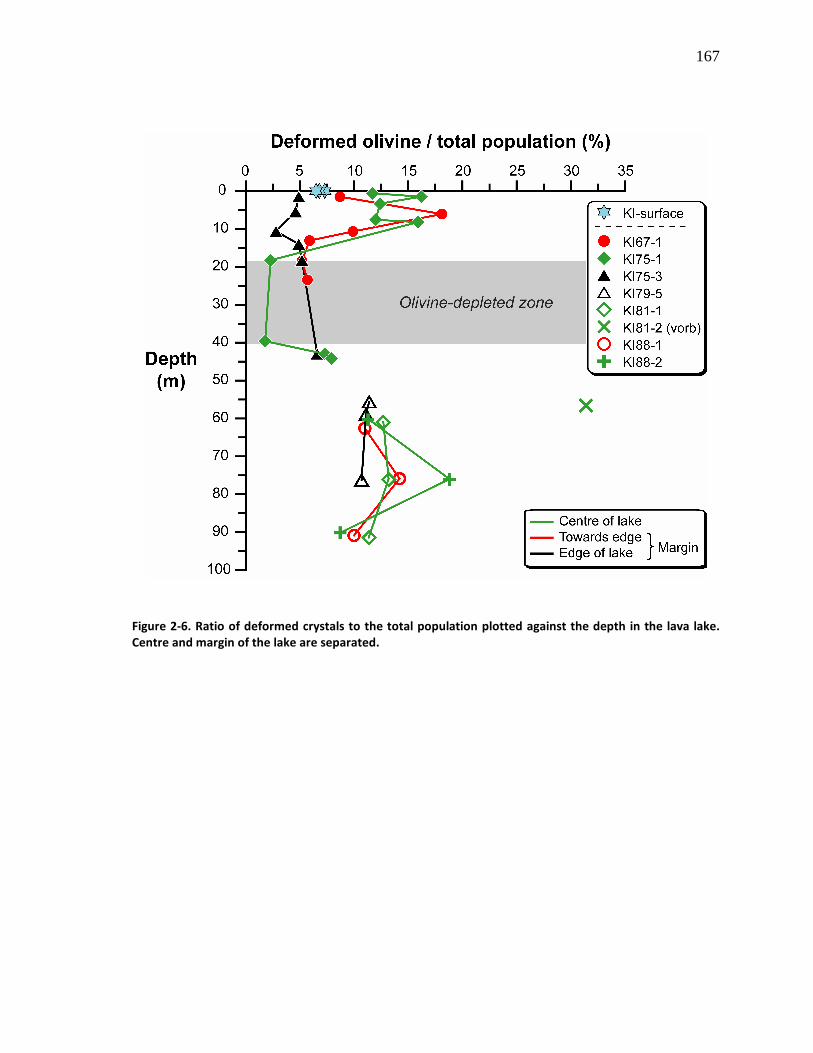
167
Figure 2-6. Ratio of deformed crystals to the total population plotted against the depth in the lava lake.
Centre and margin of the lake are separated.
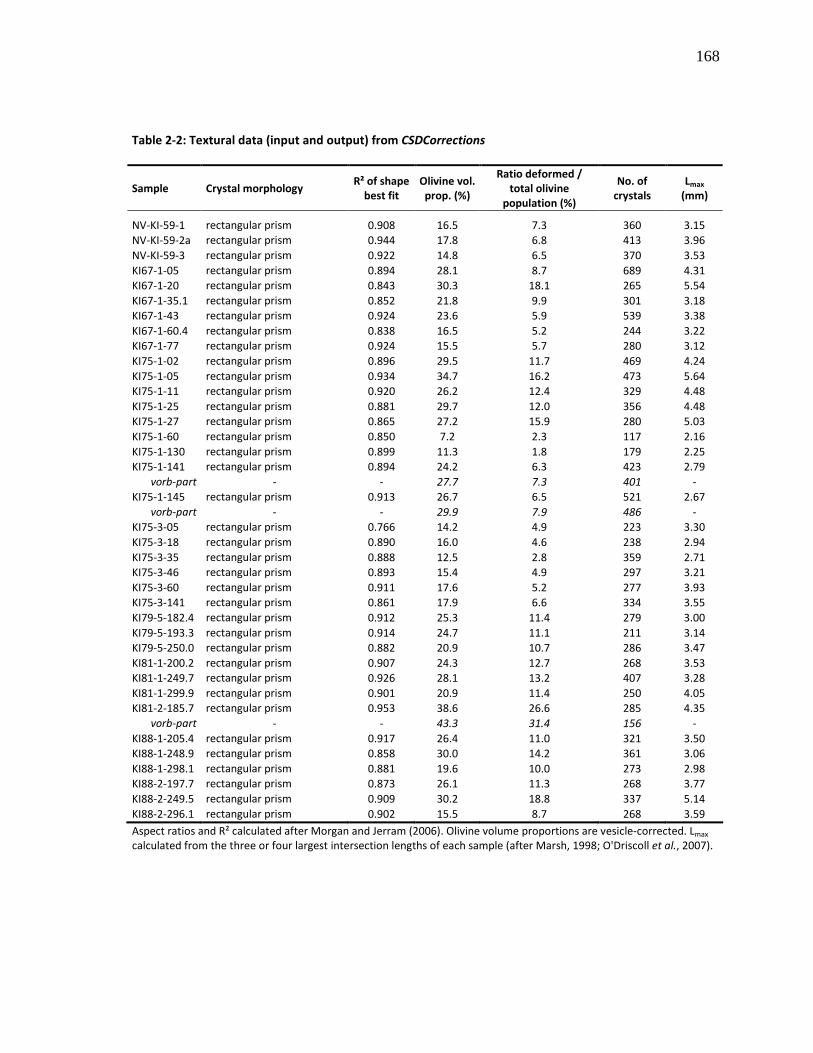
168
Table 2-2: Textural data (input and output) from CSDCorrections
Sample Crystal morphology R² of shape
best fit
Olivine vol.
prop. (%)
Ratio deformed /
total olivine
population (%)
No. of
crystals
Lmax
(mm)
NV-KI-59-1 rectangular prism
(1:1.2:1.4) 0.908 16.5 7.3 360 3.15
NV-KI-59-2a rectangular prism (1:1.15:1.6)
0.944 17.8 6.8 413 3.96
NV-KI-59-3 rectangular prism (1:1.15:1.5)
0.922 14.8 6.5 370 3.53
KI67-1-05 rectangular prism (1:1.25:1.4)
0.894 28.1 8.7 689 4.31
KI67-1-20 rectangular prism (1:1.15:1.5)
0.843 30.3 18.1 265 5.54
KI67-1-35.1 rectangular prism (1:1.2:1.7)
0.852 21.8 9.9 301 3.18
KI67-1-43 rectangular prism (1:1.15:1.5)
0.924 23.6 5.9 539 3.38
KI67-1-60.4 rectangular prism (1:1.2:1.6)
0.838 16.5 5.2 244 3.22
KI67-1-77 rectangular prism (1:1.1:1.5)
0.924 15.5 5.7 280 3.12
KI75-1-02 rectangular prism (1:1.2:1.7)
0.896 29.5 11.7 469 4.24
KI75-1-05 rectangular prism (1:1.15:1.5)
0.934 34.7 16.2 473 5.64
KI75-1-11 rectangular prism (1:1.15:1.5)
0.920 26.2 12.4 329 4.48
KI75-1-25 rectangular prism (1:1.3:1.4)
0.881 29.7 12.0 356 4.48
KI75-1-27 rectangular prism (1:1.15:1.5)
0.865 27.2 15.9 280 5.03
KI75-1-60 rectangular prism (1:1.25:1.5)
0.850 7.2 2.3 117 2.16
KI75-1-130 rectangular prism (1:1.2:1.5)
0.899 11.3 1.8 179 2.25
KI75-1-141 rectangular prism (1:1.2:1.6)
0.894 24.2 6.3 423 2.79
vorb-part
only - - 27.7 7.3 401 -
KI75-1-145 rectangular prism (1:1.25:1.4)
0.913 26.7 6.5 521 2.67
vorb-part
only - - 29.9 7.9 486 -
KI75-3-05 rectangular prism (1:1.15:1.5)
0.766 14.2 4.9 223 3.30
KI75-3-18 rectangular prism (1:1.25:1.5)
0.890 16.0 4.6 238 2.94
KI75-3-35 rectangular prism (1:1.15:1.5)
0.888 12.5 2.8 359 2.71
KI75-3-46 rectangular prism (1:1.2:1.6)
0.893 15.4 4.9 297 3.21
KI75-3-60 rectangular prism (1:1.2:1.6)
0.911 17.6 5.2 277 3.93
KI75-3-141 rectangular prism (1:1.15:1.5)
0.861 17.9 6.6 334 3.55
KI79-5-182.4 rectangular prism (1:1.2:1.6)
0.912 25.3 11.4 279 3.00
KI79-5-193.3 rectangular prism (1:1.1:1.5)
0.914 24.7 11.1 211 3.14
KI79-5-250.0 rectangular prism (1:1.3:1.4)
0.882 20.9 10.7 286 3.47
KI81-1-200.2 rectangular prism (1:1.3:1.5)
0.907 24.3 12.7 268 3.53
KI81-1-249.7 rectangular prism (1:1.3:1.5)
0.926 28.1 13.2 407 3.28
KI81-1-299.9 rectangular prism (1:1.3:1.5)
0.901 20.9 11.4 250 4.05
KI81-2-185.7 rectangular prism (1:1.3:1.4)
0.953 38.6 26.6 285 4.35
vorb-part
only - - 43.3 31.4 156 -
KI88-1-205.4 rectangular prism (1:1.2:1.6)
0.917 26.4 11.0 321 3.50
KI88-1-248.9 rectangular prism (1:1.15:1.6)
0.858 30.0 14.2 361 3.06
KI88-1-298.1 rectangular prism (1:1.25:1.6)
0.881 19.6 10.0 273 2.98
KI88-2-197.7 rectangular prism (1:1.25:1.4)
0.873 26.1 11.3 268 3.77
KI88-2-249.5 rectangular prism (1:1.3:1.4)
0.909 30.2 18.8 337 5.14
KI88-2-296.1 rectangular prism (1:1.3:1.5)
0.902 15.5 8.7 268 3.59
Aspect ratios and R² calculated after Morgan and Jerram (2006). Olivine volume proportions are vesicle-corrected. Lmax calculated from the three or four largest intersection lengths of each sample (after Marsh, 1998; O'Driscoll et al., 2007).
169
2.5 QUANTITATIVE TEXTURAL MEASUREMENTS: CRYSTAL SIZE DISTRIBUTION
(CSD)
2.5.1 Methods
To determine olivine CSDs, we stitched together high-resolution photomicrographs of each
thin section to make one single image of each thin section. Subsequently, individual crystals were
identified and outlined by using a polarizing microscope and a vector graphics editor. Effort was
made to outline and measure separately each individual crystal in a cluster. In addition, all
optically discernible deformed grains were outlined in a separate layer in order to compare the
CSDs of undeformed versus total olivine populations. The digitized olivine texture images were
then edited into simple greyscale compressed tiff format before importing into the software
ImageJ (Image Processing and Analysis in Java). Area, orientation, and length of long and short
axes of a best-fitted ellipse were determined.
We measured 120 to 940 olivine crystals in each thin section. Intersection data based on the
major axis of the fitting ellipsoid are presented in Table 2-3. Intersection lengths were converted
to 3-D CSDs using the program CSDCorrections 1.3 (Higgins, 2000, 2002a; Higgins, 2006a).
Logarithmic length intervals were used, with each bin 100.2 times the size of the previous bin.
There were no gaps in the CSDs; all bins contained crystals. Bins with less than three crystals were
removed from the CSD analysis as not significant. The lower limit of the CSD was 0.1 mm, the
smallest crystal that could be measured consistently and not necessarily the smallest crystal in the
rock. However, for the glassy samples, we were able to measure all crystals.
170
To calculate CSDs from 2-D intersection measurements using CSDCorrections 1.3, we
needed to specify the mean crystal shape as expressed by the crystal aspect ratio S:I:L
(short:intermediate:long dimensions). These aspect ratios were objectively estimated for each thin
section, following Morgan & Jerram’s (2006) CSDSlice method. A bulk fit value of the olivine shape,
1:1.15:1.6, was used for all the samples from Kilauea Iki, in order to plot and compare them
adequately. This specific aspect ratio was chosen because, for every sample of this study, it
appeared in every set of the five best fit values yielded as output results by CSDSlice. In contrast,
all the individual CSD-derived textural parameters were obtained by using in the calculations the
best fit individual aspect ratio (Table 2-2), among the set of the best five values estimated by
CSDSlice. This gave greater accuracy in quantification. For the purposes of CSDCorrections 1.3, rock
fabric was specified as massive; crystal roundness factor was estimated to be 0.5 in all cases. The
complete list of all quantitative textural data from CSDCorrections 1.3 is given in Table 2-2. In
addition, vesicularity corrections were applied by estimating the proportion of vesicles in the
sample, and then recalculating the area set in CSDCorrections 1.3 by subtraction of the area of
vesicles.
The CSD data were plotted on a ln(population density) versus size diagram (Marsh, 1988b)
(Fig. 2-7). For CSDs only slightly curved on a classical CSD diagram (S-type distribution of Higgins,
2006b), meaningful values for the slope and intercept of the CSD were determined by linear
regression following Higgins (2006b). The ‘Goodness of fit’, Q, is a parameter that describes how
well the data fit to a straight line (Table 2-4), taking into account the error in each point. A value of
Q greater than 0.1 indicates a very significant fit, but values greater than 0.01 are also acceptable
(Higgins, 2006b). The characteristic length (LD) of the CSDs was calculated as -1 / slope. This
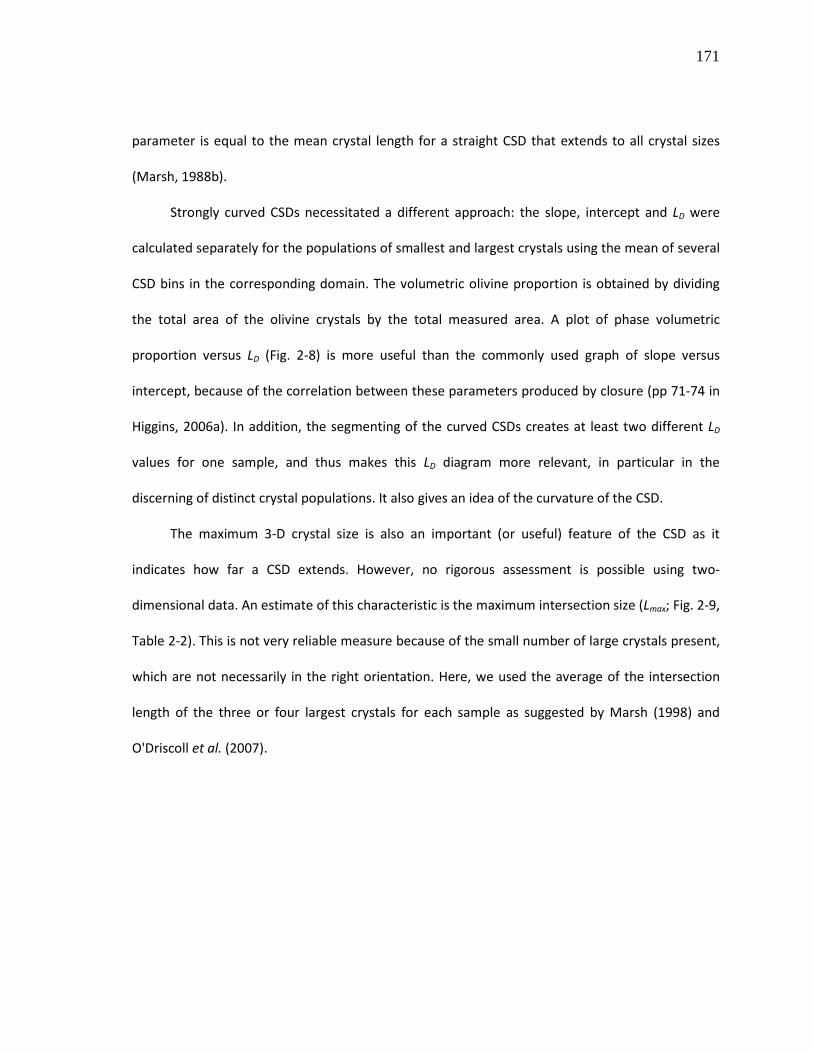
171
parameter is equal to the mean crystal length for a straight CSD that extends to all crystal sizes
(Marsh, 1988b).
Strongly curved CSDs necessitated a different approach: the slope, intercept and LD were
calculated separately for the populations of smallest and largest crystals using the mean of several
CSD bins in the corresponding domain. The volumetric olivine proportion is obtained by dividing
the total area of the olivine crystals by the total measured area. A plot of phase volumetric
proportion versus LD (Fig. 2-8) is more useful than the commonly used graph of slope versus
intercept, because of the correlation between these parameters produced by closure (pp 71-74 in
Higgins, 2006a). In addition, the segmenting of the curved CSDs creates at least two different LD
values for one sample, and thus makes this LD diagram more relevant, in particular in the
discerning of distinct crystal populations. It also gives an idea of the curvature of the CSD.
The maximum 3-D crystal size is also an important (or useful) feature of the CSD as it
indicates how far a CSD extends. However, no rigorous assessment is possible using two-
dimensional data. An estimate of this characteristic is the maximum intersection size (Lmax; Fig. 2-9,
Table 2-2). This is not very reliable measure because of the small number of large crystals present,
which are not necessarily in the right orientation. Here, we used the average of the intersection
length of the three or four largest crystals for each sample as suggested by Marsh (1998) and
O'Driscoll et al. (2007).
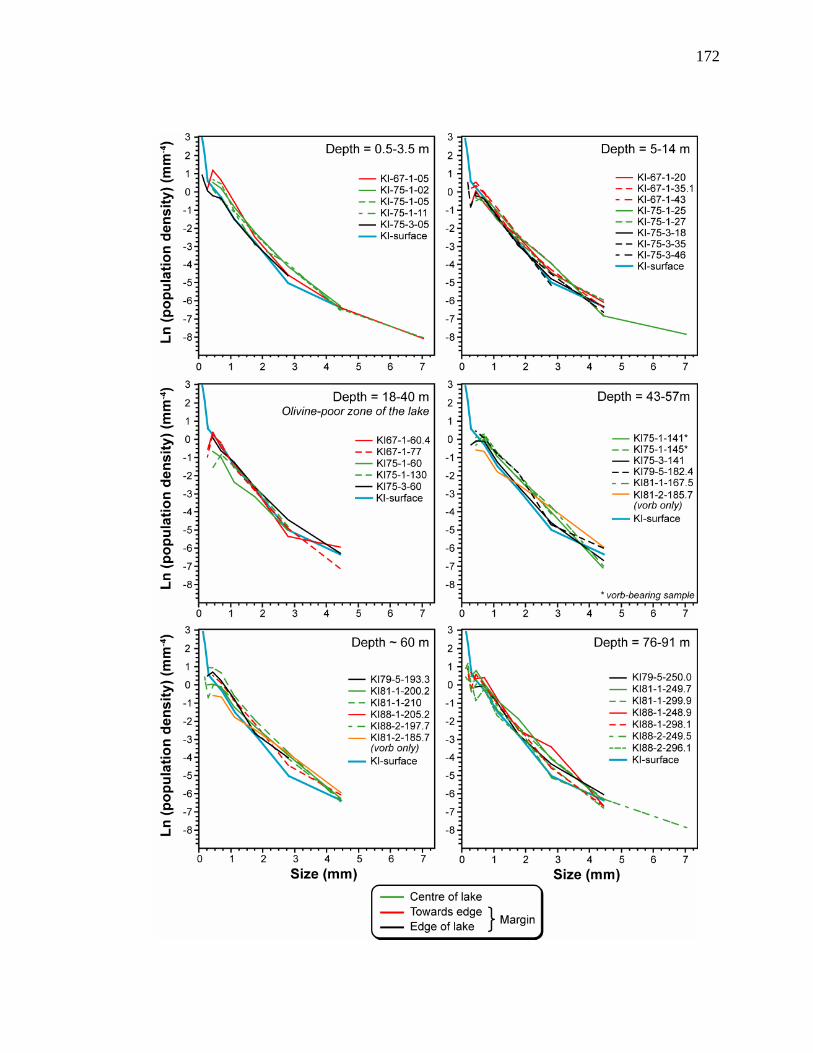
172

173
Figure 2-7. Olivine crystal size distributions (CSDs) of surface and lake samples, plotted at several fixed
depth intervals that cover most of the thickness of the lake. The last part of the sample number is the
depth in feet. The surface sample CSDs are shown in all frames as reference for variations. The mean best
olivine shape for the CSD analysis was chosen to be 1:1.15:1.6 (ellipsoid).
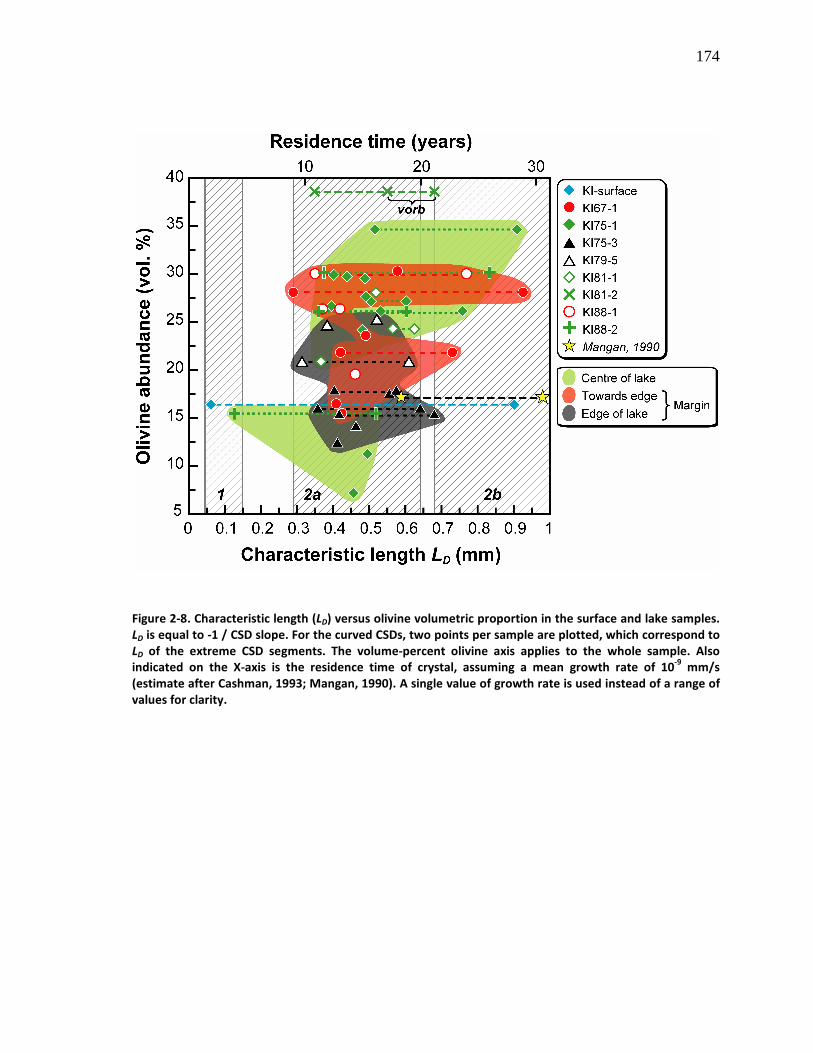
174
Figure 2-8. Characteristic length (LD) versus olivine volumetric proportion in the surface and lake samples.
LD is equal to -1 / CSD slope. For the curved CSDs, two points per sample are plotted, which correspond to
LD of the extreme CSD segments. The volume-percent olivine axis applies to the whole sample. Also
indicated on the X-axis is the residence time of crystal, assuming a mean growth rate of 10-9
mm/s
(estimate after Cashman, 1993; Mangan, 1990). A single value of growth rate is used instead of a range of
values for clarity.
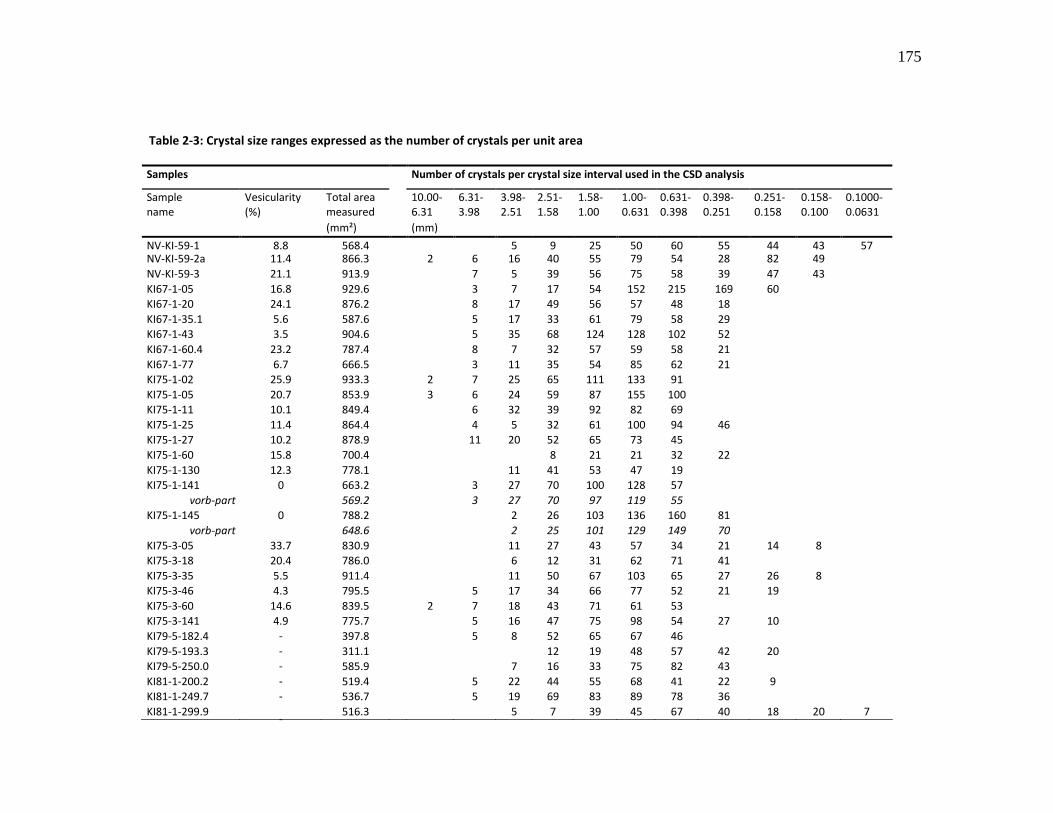
175
Table 2-3: Crystal size ranges expressed as the number of crystals per unit area
Samples Number of crystals per crystal size interval used in the CSD analysis
Sample Vesicularity Total area 10.00- 6.31- 3.98- 2.51- 1.58- 1.00- 0.631- 0.398- 0.251- 0.158- 0.1000- name (%) measured 6.31 3.98 2.51 1.58 1.00 0.631 0.398 0.251 0.158 0.100 0.0631
(mm²) (mm)
NV-KI-59-1 8.8 568.4 5 9 25 50 60 55 44 43 57 NV-KI-59-2a 11.4 866.3 2 6 16 40 55 79 54 28 82 49
NV-KI-59-3 21.1 913.9 7 5 39 56 75 58 39 47 43
KI67-1-05 16.8 929.6 3 7 17 54 152 215 169 60
KI67-1-20 24.1 876.2 8 17 49 56 57 48 18
KI67-1-35.1 5.6 587.6 5 17 33 61 79 58 29
KI67-1-43 3.5 904.6 5 35 68 124 128 102 52
KI67-1-60.4 23.2 787.4 8 7 32 57 59 58 21
KI67-1-77 6.7 666.5 3 11 35 54 85 62 21
KI75-1-02 25.9 933.3 2 7 25 65 111 133 91
KI75-1-05 20.7 853.9 3 6 24 59 87 155 100
KI75-1-11 10.1 849.4 6 32 39 92 82 69
KI75-1-25 11.4 864.4 4 5 32 61 100 94 46
KI75-1-27 10.2 878.9 11 20 52 65 73 45
KI75-1-60 15.8 700.4 8 21 21 32 22
KI75-1-130 12.3 778.1 11 41 53 47 19
KI75-1-141 0 663.2 3 27 70 100 128 57
vorb-part 569.2 3 27 70 97 119 55
KI75-1-145 0 788.2 2 26 103 136 160 81
vorb-part 648.6 2 25 101 129 149 70
KI75-3-05 33.7 830.9 11 27 43 57 34 21 14 8
KI75-3-18 20.4 786.0 6 12 31 62 71 41
KI75-3-35 5.5 911.4 11 50 67 103 65 27 26 8
KI75-3-46 4.3 795.5 5 17 34 66 77 52 21 19
KI75-3-60 14.6 839.5 2 7 18 43 71 61 53
KI75-3-141 4.9 775.7 5 16 47 75 98 54 27 10
KI79-5-182.4 - 397.8 5 8 52 65 67 46
KI79-5-193.3 - 311.1 12 19 48 57 42 20
KI79-5-250.0 - 585.9 7 16 33 75 82 43
KI81-1-200.2 - 519.4 5 22 44 55 68 41 22 9
KI81-1-249.7 - 536.7 5 19 69 83 89 78 36
KI81-1-299.9 -
516.3
5 7 39 45 67 40 18 20 7
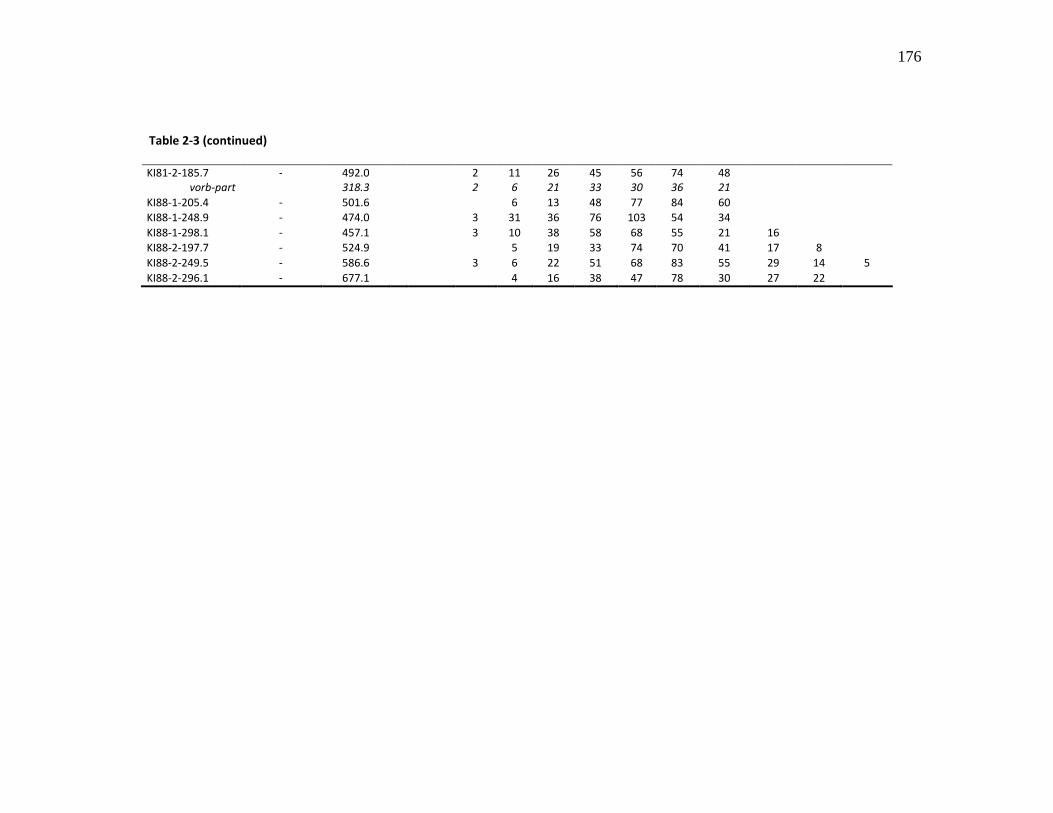
176
Table 2-3 (continued)
KI81-2-185.7 - 492.0 2 11 26 45 56 74 48 vorb-part 318.3 2 6 21 33 30 36 21
KI88-1-205.4 - 501.6 6 13 48 77 84 60
KI88-1-248.9 - 474.0 3 31 36 76 103 54 34
KI88-1-298.1 - 457.1 3 10 38 58 68 55 21 16
KI88-2-197.7 - 524.9 5 19 33 74 70 41 17 8
KI88-2-249.5 - 586.6 3 6 22 51 68 83 55 29 14 5
KI88-2-296.1 - 677.1 4 16 38 47 78 30 27 22
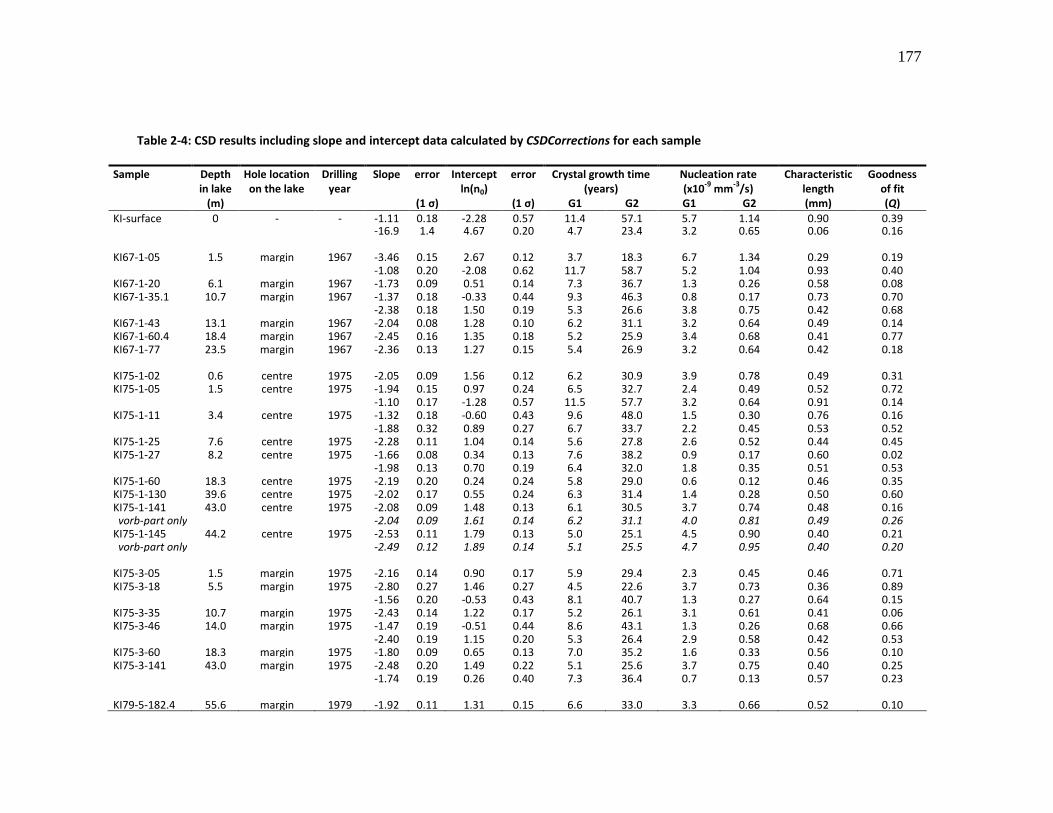
177
Table 2-4: CSD results including slope and intercept data calculated by CSDCorrections for each sample
Sample Depth
in lake
Hole location
on the lake
Drilling
year
Slope error Intercept
ln(n0)
error Crystal growth time
(years)
Nucleation rate
(x10-9
mm-3
/s)
Characteristic
length
Goodness
of fit
(m) (1 σ) (1 σ) G1 G2 G1 G2 (mm) (Q)
KI-surface 0 - - -1.11 0.18 -2.28 0.57 11.4 57.1 5.7 1.14 0.90 0.39 -16.9 1.4 4.67 0.20 4.7 23.4 3.2 0.65 0.06 0.16 KI67-1-05 1.5 margin 1967 -3.46 0.15 2.67 0.12 3.7 18.3 6.7 1.34 0.29 0.19 -1.08 0.20 -2.08 0.62 11.7 58.7 5.2 1.04 0.93 0.40 KI67-1-20 6.1 margin 1967 -1.73 0.09 0.51 0.14 7.3 36.7 1.3 0.26 0.58 0.08 KI67-1-35.1 10.7 margin 1967 -1.37 0.18 -0.33 0.44 9.3 46.3 0.8 0.17 0.73 0.70 -2.38 0.18 1.50 0.19 5.3 26.6 3.8 0.75 0.42 0.68 KI67-1-43 13.1 margin 1967 -2.04 0.08 1.28 0.10 6.2 31.1 3.2 0.64 0.49 0.14 KI67-1-60.4 18.4 margin 1967 -2.45 0.16 1.35 0.18 5.2 25.9 3.4 0.68 0.41 0.77 KI67-1-77 23.5 margin 1967 -2.36 0.13 1.27 0.15 5.4 26.9 3.2 0.64 0.42 0.18 KI75-1-02 0.6 centre 1975 -2.05 0.09 1.56 0.12 6.2 30.9 3.9 0.78 0.49 0.31 KI75-1-05 1.5 centre 1975 -1.94 0.15 0.97 0.24 6.5 32.7 2.4 0.49 0.52 0.72 -1.10 0.17 -1.28 0.57 11.5 57.7 3.2 0.64 0.91 0.14 KI75-1-11 3.4 centre 1975 -1.32 0.18 -0.60 0.43 9.6 48.0 1.5 0.30 0.76 0.16 -1.88 0.32 0.89 0.27 6.7 33.7 2.2 0.45 0.53 0.52 KI75-1-25 7.6 centre 1975 -2.28 0.11 1.04 0.14 5.6 27.8 2.6 0.52 0.44 0.45 KI75-1-27 8.2 centre 1975 -1.66 0.08 0.34 0.13 7.6 38.2 0.9 0.17 0.60 0.02 -1.98 0.13 0.70 0.19 6.4 32.0 1.8 0.35 0.51 0.53 KI75-1-60 18.3 centre 1975 -2.19 0.20 0.24 0.24 5.8 29.0 0.6 0.12 0.46 0.35 KI75-1-130 39.6 centre 1975 -2.02 0.17 0.55 0.24 6.3 31.4 1.4 0.28 0.50 0.60 KI75-1-141 43.0 centre 1975 -2.08 0.09 1.48 0.13 6.1 30.5 3.7 0.74 0.48 0.16 vorb-part only -2.04 0.09 1.61 0.14 6.2 31.1 4.0 0.81 0.49 0.26
KI75-1-145 44.2 centre 1975 -2.53 0.11 1.79 0.13 5.0 25.1 4.5 0.90 0.40 0.21 vorb-part only -2.49 0.12 1.89 0.14 5.1 25.5 4.7 0.95 0.40 0.20
KI75-3-05 1.5 margin 1975 -2.16 0.14 0.90 0.17 5.9 29.4 2.3 0.45 0.46 0.71 KI75-3-18 5.5 margin 1975 -2.80 0.27 1.46 0.27 4.5 22.6 3.7 0.73 0.36 0.89 -1.56 0.20 -0.53 0.43 8.1 40.7 1.3 0.27 0.64 0.15 KI75-3-35 10.7 margin 1975 -2.43 0.14 1.22 0.17 5.2 26.1 3.1 0.61 0.41 0.06 KI75-3-46 14.0 margin 1975 -1.47 0.19 -0.51 0.44 8.6 43.1 1.3 0.26 0.68 0.66 -2.40 0.19 1.15 0.20 5.3 26.4 2.9 0.58 0.42 0.53 KI75-3-60 18.3 margin 1975 -1.80 0.09 0.65 0.13 7.0 35.2 1.6 0.33 0.56 0.10 KI75-3-141 43.0 margin 1975 -2.48 0.20 1.49 0.22 5.1 25.6 3.7 0.75 0.40 0.25 -1.74 0.19 0.26 0.40 7.3 36.4 0.7 0.13 0.57 0.23 KI79-5-182.4 55.6 margin 1979 -1.92 0.11 1.31 0.15 6.6 33.0 3.3 0.66 0.52 0.10
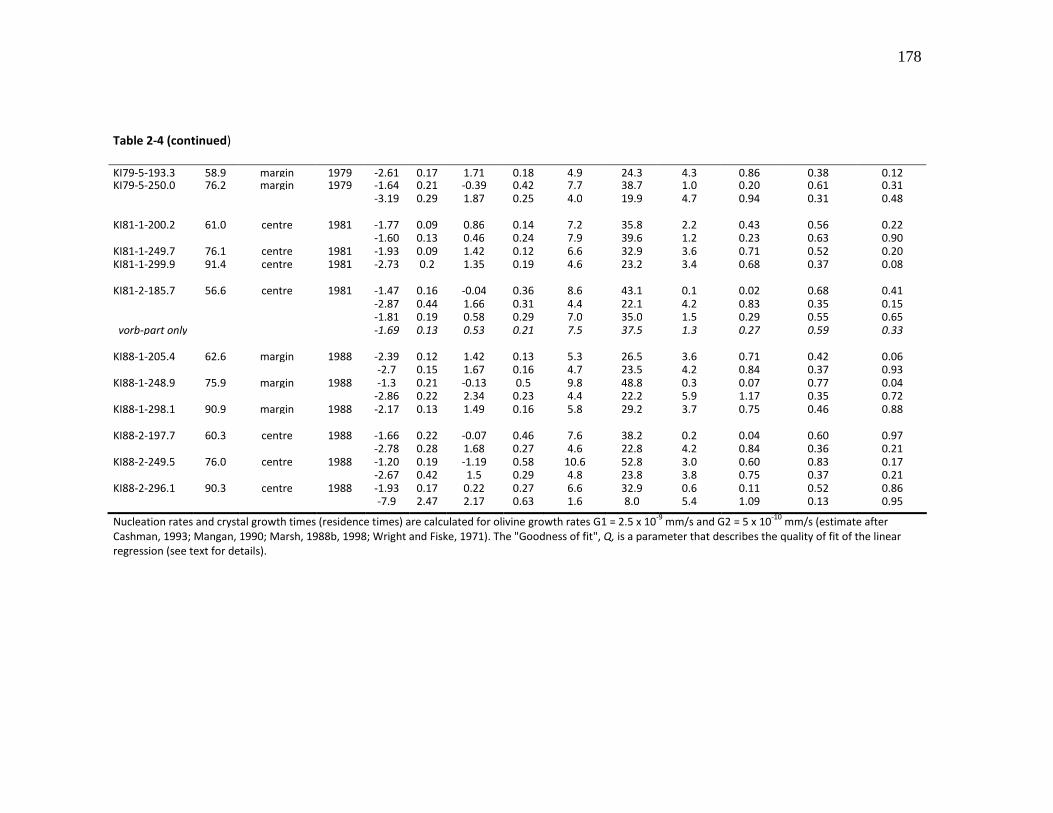
178
Table 2-4 (continued)
KI79-5-193.3 58.9 margin 1979 -2.61 0.17 1.71 0.18 4.9 24.3 4.3 0.86 0.38 0.12 KI79-5-250.0 76.2 margin 1979 -1.64 0.21 -0.39 0.42 7.7 38.7 1.0 0.20 0.61 0.31 -3.19 0.29 1.87 0.25 4.0 19.9 4.7 0.94 0.31 0.48 KI81-1-200.2 61.0 centre 1981 -1.77 0.09 0.86 0.14 7.2 35.8 2.2 0.43 0.56 0.22 -1.60 0.13 0.46 0.24 7.9 39.6 1.2 0.23 0.63 0.90 KI81-1-249.7 76.1 centre 1981 -1.93 0.09 1.42 0.12 6.6 32.9 3.6 0.71 0.52 0.20 KI81-1-299.9 91.4 centre 1981 -2.73 0.2 1.35 0.19 4.6 23.2 3.4 0.68 0.37 0.08 KI81-2-185.7 56.6 centre 1981 -1.47 0.16 -0.04 0.36 8.6 43.1 0.1 0.02 0.68 0.41 -2.87 0.44 1.66 0.31 4.4 22.1 4.2 0.83 0.35 0.15 -1.81 0.19 0.58 0.29 7.0 35.0 1.5 0.29 0.55 0.65 vorb-part only -1.69 0.13 0.53 0.21 7.5 37.5 1.3 0.27 0.59 0.33
KI88-1-205.4 62.6 margin 1988 -2.39 0.12 1.42 0.13 5.3 26.5 3.6 0.71 0.42 0.06 -2.7 0.15 1.67 0.16 4.7 23.5 4.2 0.84 0.37 0.93 KI88-1-248.9 75.9 margin 1988 -1.3 0.21 -0.13 0.5 9.8 48.8 0.3 0.07 0.77 0.04 -2.86 0.22 2.34 0.23 4.4 22.2 5.9 1.17 0.35 0.72 KI88-1-298.1 90.9 margin 1988 -2.17 0.13 1.49 0.16 5.8 29.2 3.7 0.75 0.46 0.88 KI88-2-197.7 60.3 centre 1988 -1.66 0.22 -0.07 0.46 7.6 38.2 0.2 0.04 0.60 0.97 -2.78 0.28 1.68 0.27 4.6 22.8 4.2 0.84 0.36 0.21 KI88-2-249.5 76.0 centre 1988 -1.20 0.19 -1.19 0.58 10.6 52.8 3.0 0.60 0.83 0.17 -2.67 0.42 1.5 0.29 4.8 23.8 3.8 0.75 0.37 0.21 KI88-2-296.1 90.3 centre 1988 -1.93 0.17 0.22 0.27 6.6 32.9 0.6 0.11 0.52 0.86 -7.9 2.47 2.17 0.63 1.6 8.0 5.4 1.09 0.13 0.95 Nucleation rates and crystal growth times (residence times) are calculated for olivine growth rates G1 = 2.5 x 10
-9 mm/s and G2 = 5 x 10
-10 mm/s (estimate after
Cashman, 1993; Mangan, 1990; Marsh, 1988b, 1998; Wright and Fiske, 1971). The "Goodness of fit", Q, is a parameter that describes the quality of fit of the linear regression (see text for details).
179
2.5.2 CSD results
2.5.2.1 General remarks
Although all the Kilauea Iki drill core CSD patterns are broadly similar, they show significant
differences in size, nucleation density and curvature, depending on the bulk drilling date, the
drilling location and the proportions of deformed crystals (Table 2-4; Fig. 2-7). Samples have been
classified by depth in figure 2-7, as a proxy for time of solidification. Most samples have CSDs that
range from ~0.1 mm, the lower analytical limit after stereological conversion, to 4.5 mm; KI67-1-
05, KI75-1-05, KI75-1-25 and KI88-2-249.5 extend to 7.0 mm; and KI75-3-05, KI75-3-35 and KI79-5-
193.3 only extends to 2.8 mm in size (mid-interval intersection length). There is no simple link
between CSDs and either drilling date, location or depth.
Many samples show a turndown of the CSD curves at smallest crystal sizes. However, we
must verify whether this feature is a measurement artefact or a part of the CSD. In order to
validate the true significance of this turndown in terms of magma processes, we plot the glassy
samples separately and check for a turndown. If the turndown at the left side of the CSD exists for
the glassy samples, then we can clearly say that it is not an artefact since all crystals are measured
in glassy samples. The same holds true for some of the samples with a crystallized matrix that also
have a turndown at smallest sizes where only crystals >0.1 mm were measured. Here four glassy
samples were studied: KI81-2-185.7 and the three samples from the hole KI79-5. A clear turndown
is observed for the KI79-5 samples (Fig. 2-7). In addition, no turndown occurs at the smallest sizes
for surface samples that have been the most rapidly cooled; the slope is even much steeper and
180
still negative. This suggests real turndown for lava lake samples. Accordingly, the presence of a
turndown is thus thought to reveal true magma processes there.
About half the CSDs have a significant curvature. The curvature is markedly variable and
appears to be complex, in particular for the samples of the centre of the lake. It commonly
consists of profiles with a steeper slope at small and middle sizes, sometimes both being almost
linear, and a flatter slope at greater sizes, thus forming a clear change in the curve at the right side
of the graph. Sometimes, the curvature is more continuous, or smooth. Most CSDs from the edge
of the lake are curved. A convenient way of describing the characteristics of these plots is to divide
the CSDs into two parts: (1) the main part, for crystal sizes >1.0 mm, and; (2) the part for the
smallest sizes, i.e., <1.0 mm. The mean surface CSD is often used as a bench-mark for CSD
variations. However, this does not imply that it is the most important unit.
2.5.2.2 CSD variations for sizes <1.0 mm
The left side of the CSD plot can be characterised in terms of slope and presence or absence
of a turndown. The mean surface CSD has much steeper slope and greater intercept than the great
majority of drill core CSDs, but no turndown. The turndown at sizes <0.75 mm is present for many
CSDs of the margin of the lake, from shallow to deep levels in the lake. Certain ones display very
steep slopes at sizes <0.5 mm. Turndown is also observed for some CSDs from the centre of lake,
but mostly in the depth range 40-75 m. No turndown is observed for the CSD of the vorb part of
KI81-2-185.7. At 75-90 m, one sample from the margin and two samples from the centre of the
lake, exhibit steep slopes at smallest sizes that closely match the mean surface CSD. If this is not a
stereological artefact, then it is thought to represent a common population of small crystals.
181
2.5.2.3 CSD variations for sizes >1.0 mm
The right side of the CSDs can be described in terms of slope and maximum size. The mean
surface CSD has a relatively steep slope for sizes 1.0-2.8 mm (mid-sized interval), but a flatter slope
for greater sizes than the great majority of lava lake samples. The latter is especially true at depths
from 18 m down, both at the margin and centre of the lake. Significant variations of the drill core
CSDs are commonly observed for crystals >1.0 mm. Sometimes these CSDs match with the mean
surface CSD, either for the mid-sized interval, the greatest sizes, or both those parts of the CSD.
This is observed for both the margin and centre of the lake. However, at depths >10 m, most drill
core CSDs do not match the mean surface CSD for sizes >2.8 mm. At depths >60 m, both drill core
CSDs of the margin and centre of lake often are displaced upward relative to the mean surface
CSD. At 75-90 m, only KI81-1-299.9 has a CSD with the same pattern as the mean surface CSD; the
other CSDs appear generally flatter for sizes 1.0-2.8 mm and steeper for sizes >2.8 mm.
In summary, there are only slight textural variations through the upper 100 meters of the
lava lake. Although we note slightly more textural variations from 60-90 m, this graphical way of
representing the evolution through time via multiple plots at constant depths definitely highlights
the bulk homogeneity of the whole set of CSDs. However, several exceptions remain discernible,
as demonstrated above.
182
2.5.2.4 Other CSD-derived results
A plot of characteristic length (segments and whole samples) versus olivine abundance
shows great variations between samples, and may help for recognition of different crystal
populations (Fig. 2-8). Two main groups regarding the characteristic length are recognised here:
group 1 where LD < 0.15 mm, typically ~0.1; and group 2 where LD is 0.3-1.0 mm. It is convenient to
further divide group 2 into two subcategories, which do not necessarily indicate different
processes: subgroup 2a with LD of 0.30-0.65 mm, and subgroup 2b with LD of 0.7-1.0 mm. Group 1
is only composed of the lower end-member of both the surface samples and KI88-2-296.1.
Subgroup 2b contains the upper end-member of KI67-1-05, KI67-1-35.1, KI75-1-05, KI75-1-11,
KI75-3-46, KI88-1-248.9, KI88-2-249.5, KI81-2-185.7 (vorb) and of the scoria samples of Mangan
(1990). In subgroup 2a, the most common one, lie all the remaining end-members or whole
samples. These three groups or subgroups likely may be attributed to three distinct olivine
populations. Furthermore, less variability is observed at the margin versus centre of the lake, as
illustrated by the coloured areas in figure 2-8.
The total abundance of olivine is very variable (Fig. 2-8). Sample KI75-1-60, KI75-1-130 and
KI88-2-296.1 are clearly poorer in olivine (7-16 vol. %) compared to the other samples from the
same main hole(s) 1975-88 at the centre of the lake (21-33 vol. %). With a range of 13-30 vol. %,
the samples studied from the main hole(s) 1967-88, towards the edge of the lake, show great
variations in the olivine abundance, as well. In contrast, less variability in the olivine content is
noted for the samples from the main hole(s) 1975-79 at the edge of the lake, with 13-25 volume
%. It should be noted though that samples in hole KI75-3 and KI79-5 appear to define separate
zones in the plot, the latter being depleted in olivine compared to the samples from greater
183
depths of KI79-5 hole. The olivine content of hole KI75-3 and KI79-5 samples shows little variation
and range from 13 to 18 vol. % and 21 to 25 vol. %, respectively.
The vorb-bearing KI81-2-185.7 is the richest in olivine among all the samples we studied
here, including our surface samples and the scoria samples from Mangan (1990). The distribution
of LD in this sample is comparable to the other 1981 lava lake samples.
There are significant differences in the maximum 3-D sizes (Lmax) between the Kilauea Iki
samples, with respect to depth (Fig. 2-9). The whole range of values is 2.1-5.6 mm, with a bigger
concentration between 2.7 and 4.0 mm, including the surface samples. Overall, samples from the
centre and toward the edge of the lake have higher Lmax at depths 0-15 m, compared to deeper
levels. In fact, for samples toward the edge of the lake Lmax appears more or less constant, around
3.2 mm, from 15 m deep down. It is much more variable for samples from centre of the lake, with
minimal values (~2 mm) at 20-40 m deep, the olivine-depleted zone defined by Helz (2009). It then
increases almost continuously with depth up to 4 or 5 mm at ~80-95 m deep. In contrast, the
distribution of Lmax for olivine in the edge of the lake begins decreasing with depth at shallower
levels, and then reaches a maximum of ~4 mm at the top of the olivine-depleted zone. Finally Lmax
decreases again to a mean value of ~3 mm, although variations occur. Interestingly, Lmax in the
olivine-depleted zone seems to be controlled by the location in the lake: from lower values at the
centre to higher ones at the edge, via intermediate values toward the edge.
Surprisingly, Lmax of the pumice sample set of Mangan (1990) is comparable to our highest
values, significantly higher than the Lmax of our surface samples. In addition to the bulk variation of
Lmax over all the samples studied from 1975-88, internal variations among the samples from the
same hole are also noted. The best example here is given by the clear dichotomy of the samples in

184
the hole KI75-1 where Lmax appears to range between 2.0 and 3.0 mm from 18 to 44 m deep,
whereas it is about twice that value at shallower depths (1-8 m).
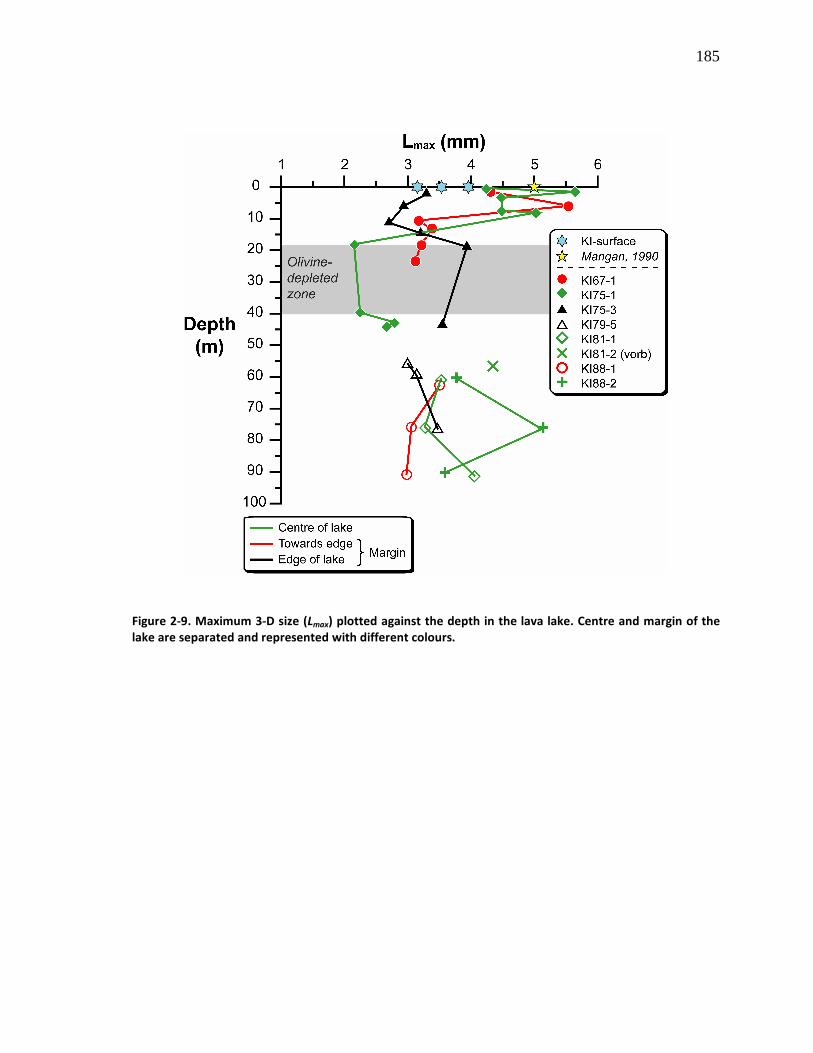
185
Figure 2-9. Maximum 3-D size (Lmax) plotted against the depth in the lava lake. Centre and margin of the
lake are separated and represented with different colours.
186
2.5.2.5 Lateral and depth-related evolution: centre versus margin of the lake
It is instructive to see if there are systematic textural differences between the centre and
margin of the lake. We have therefore compiled characteristic length versus depth data for 1975-
88 (0.5-91 m) at the centre of the lake, and 1967-88 (1.5-91 m) plus 1975-79 (1.5-76 m) at the
northern margin of the lake (Fig. 2-10).
Characteristic length data for the samples from the center of the lake show the greatest
variations compared to the drilling locations at the margin (Fig. 2-10a). Overall, greater values of LD
are found at both the shallowest and deepest parts of the lake. At depths <10 m, LD varies widely
from 0.45 to 0.90 mm. In contrast, less variation between 10-40 m deep is noted, but few samples
have been studied in this depth interval that corresponds to the olivine-poor zone. A sudden
change of LD is noted both around 45 m and 60-65 m deep, with values varying from ~0.4 to ~0.6
mm, and from ~0.4 to >0.8 mm, respectively. From 65 m deep down, the range of LD is large, and
low values of 0.1-0.3 mm are also found. At depths 60-95 m, samples from 1988 drilling have LD
and residence time much more variable relative to the 1981 samples studied here. This is possibly
the result of internal evolution through time. To a certain extent, the stronger variations observed
at both shallower and deeper levels in the lake could be due to the effect of foundered crust at
both upper and lower margins of the lake.
Characteristic length data for the samples from the margin of the lake are less variable than
that observed for the centre (Fig. 2-10b). Until 15-20 m deep, the greatest variations are noted for
the whole margin, with LD varying from 0.3 to 0.9 mm. At depths 20-65 m, LD appears more stable,
with a limited range of 0.4-0.6 mm. However, no samples were studied between 25-60 m depth
because olivine was not sufficiently abundant for a precise CSD to be determined. At depths >65
187
m, LD varies from 0.35 to 0.75 mm. Overall, the textural variations observed for the whole lake
margin are thought to reflect the presence of two distinct olivine populations throughout the
entire thickness of Kilauea Iki lava lake: (1) a population of smaller crystals which estimated LD is
0.30-0.65 mm; and (2) a population of bigger crystals with an estimated LD of 0.7-0.9 mm. Those
two populations correspond to the subgroups 2a and 2b previously defined.
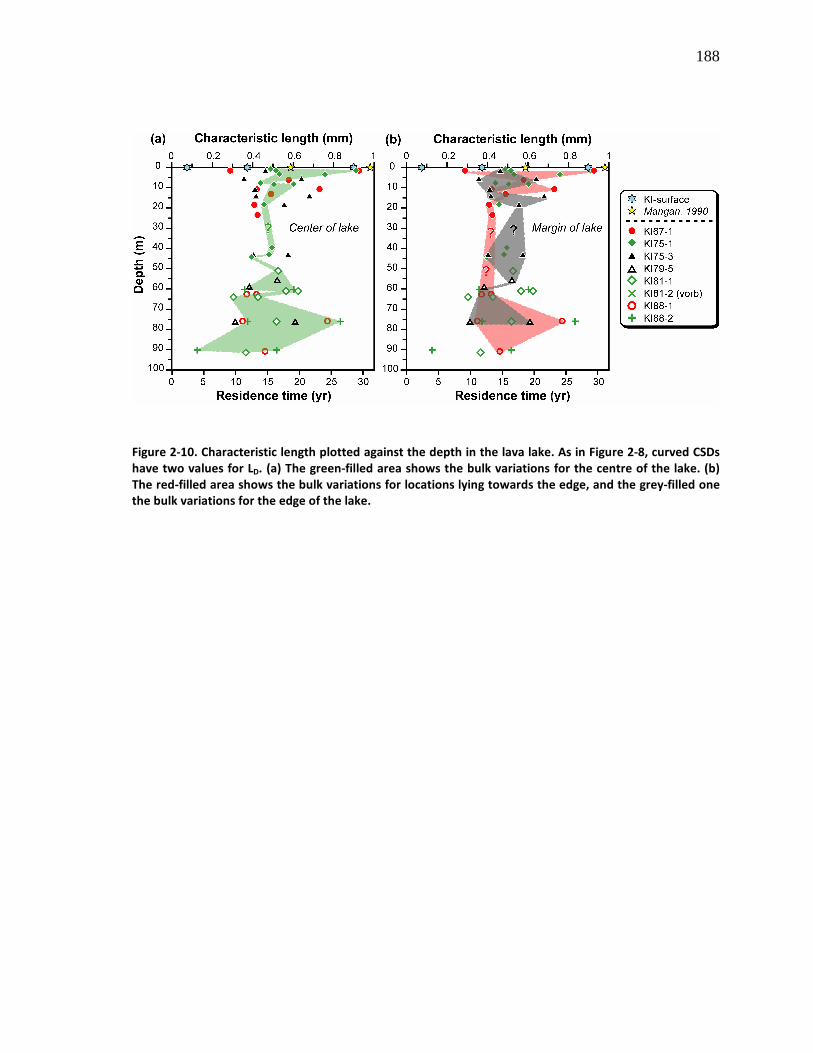
188
Figure 2-10. Characteristic length plotted against the depth in the lava lake. As in Figure 2-8, curved CSDs
have two values for LD. (a) The green-filled area shows the bulk variations for the centre of the lake. (b)
The red-filled area shows the bulk variations for locations lying towards the edge, and the grey-filled one
the bulk variations for the edge of the lake.
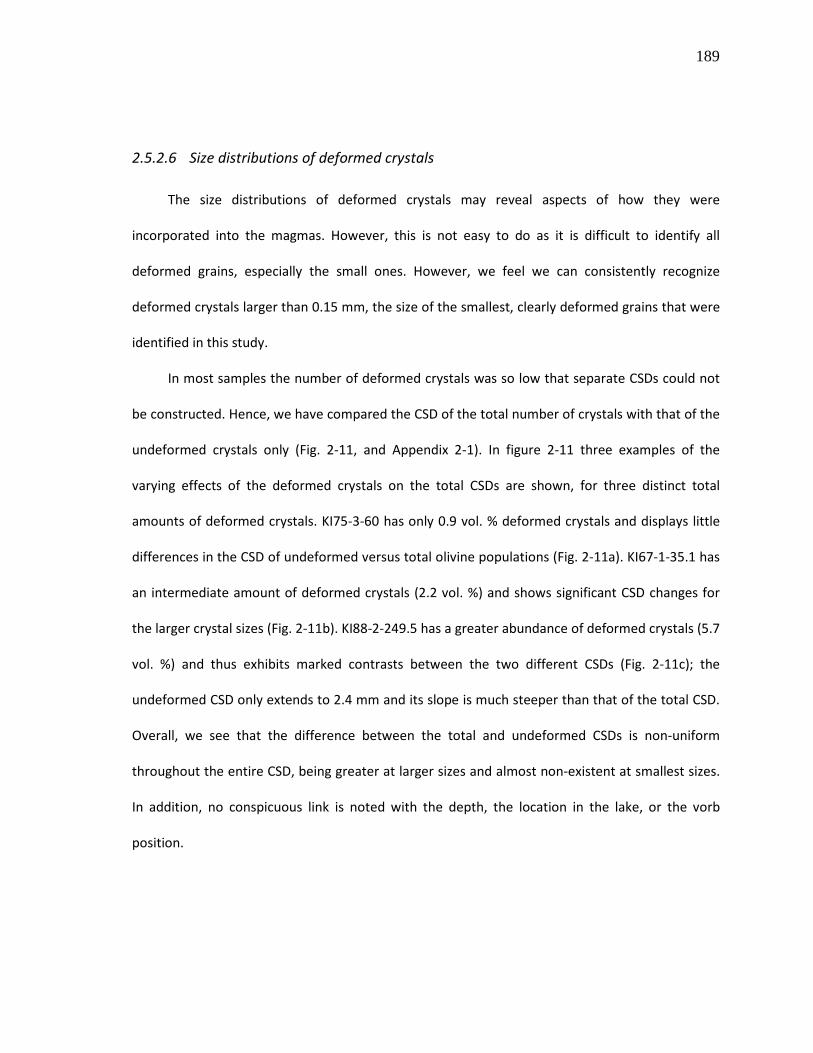
189
2.5.2.6 Size distributions of deformed crystals
The size distributions of deformed crystals may reveal aspects of how they were
incorporated into the magmas. However, this is not easy to do as it is difficult to identify all
deformed grains, especially the small ones. However, we feel we can consistently recognize
deformed crystals larger than 0.15 mm, the size of the smallest, clearly deformed grains that were
identified in this study.
In most samples the number of deformed crystals was so low that separate CSDs could not
be constructed. Hence, we have compared the CSD of the total number of crystals with that of the
undeformed crystals only (Fig. 2-11, and Appendix 2-1). In figure 2-11 three examples of the
varying effects of the deformed crystals on the total CSDs are shown, for three distinct total
amounts of deformed crystals. KI75-3-60 has only 0.9 vol. % deformed crystals and displays little
differences in the CSD of undeformed versus total olivine populations (Fig. 2-11a). KI67-1-35.1 has
an intermediate amount of deformed crystals (2.2 vol. %) and shows significant CSD changes for
the larger crystal sizes (Fig. 2-11b). KI88-2-249.5 has a greater abundance of deformed crystals (5.7
vol. %) and thus exhibits marked contrasts between the two different CSDs (Fig. 2-11c); the
undeformed CSD only extends to 2.4 mm and its slope is much steeper than that of the total CSD.
Overall, we see that the difference between the total and undeformed CSDs is non-uniform
throughout the entire CSD, being greater at larger sizes and almost non-existent at smallest sizes.
In addition, no conspicuous link is noted with the depth, the location in the lake, or the vorb
position.

190
In summary, all CSD plots show that deformed crystals are commonly larger than
undeformed crystals. The deformed crystals hence appear to strongly affect the CSD, even where
they are relatively few in number.
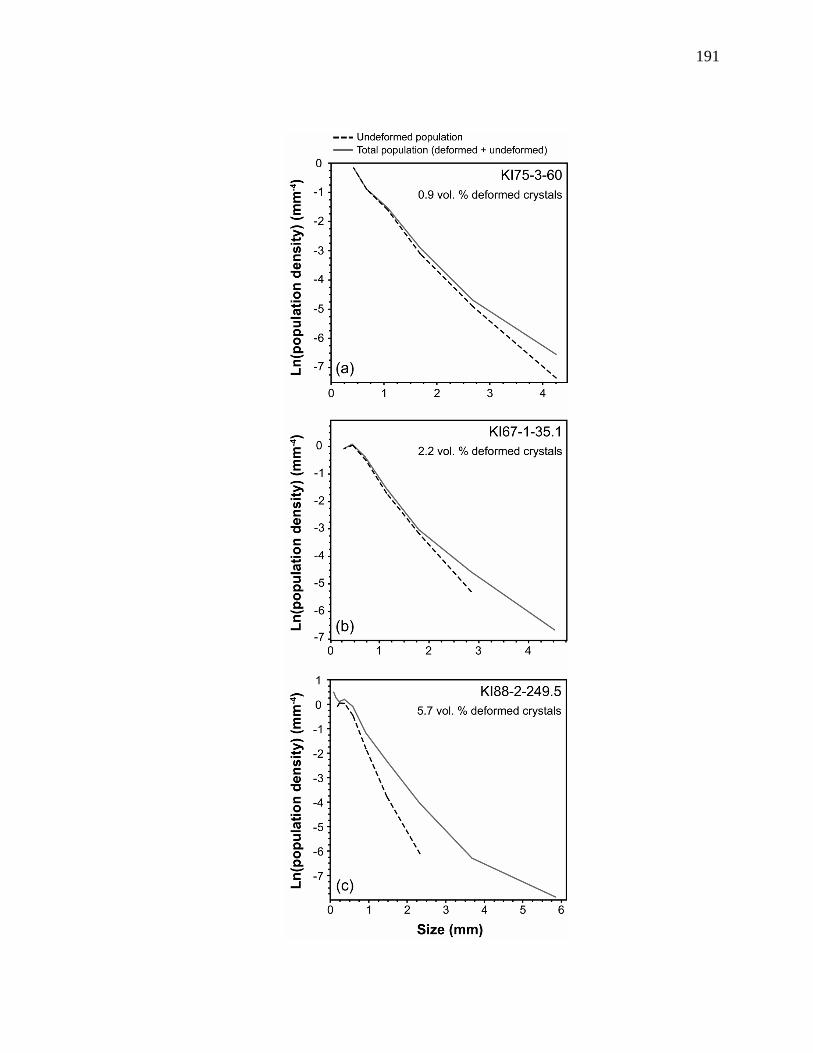
191
192
Figure 2-11. Representative CSDs of undeformed versus total olivine populations, showing the effects of
deformed crystals on the total crystal size distribution. (a) KI75-3-60, with a low amount of deformed
crystals (0.9 vol. %), displays little differences in the CSD of undeformed versus total olivine populations;
(b) KI67-1-35.1, with an intermediate amount of deformed crystals (2.2 vol. %), shows significant CSD
changes for the larger crystal domain; and (c) KI88-2-249.5, with a greater abundance of deformed crystals
(5.7 vol. %), exhibits marked contrasts between the different CSDs, which are greater for large sizes. A
quantitative estimate of the abundance of deformed crystals in each sample is shown at the top right of
each plot.

193
2.5.2.7 Olivine size distribution in the vorbs
The original definition of vorbs included a crystal size aspect (Helz, 1980). It is therefore
interesting to see if this is confirmed by quantitative textural measurements. The CSDs of the vorb
part of KI75-1-141 and KI75-1-145 are very similar, except that KI75-1-145-vorb stops at 2.8 mm
(Fig. 2-12a). In contrast, the CSD of KI81-2-185.7-vorb is rotated to a shallower slope with respect
to the other vorbs (Fig 2-12a) and the CSDs of non-vorbs at similar depths (Fig. 2-7). It would be
interesting to compare the vorb with non-vorb CSDs at those depths, but unfortunately, only KI81-
2-185.7 has sufficient crystals in the non-vorb part of the sample to build an individual CSD (Fig. 2-
12b). In this case, the vorb and non-vorb CSDs are clearly different. The vorb CSD has a bulk slope
flatter than the non-vorb CSD, lower population densities at crystal sizes <1.5 mm for higher
population densities at sizes >1.5 mm, and no change of the slope at sizes larger than 2.8 mm.
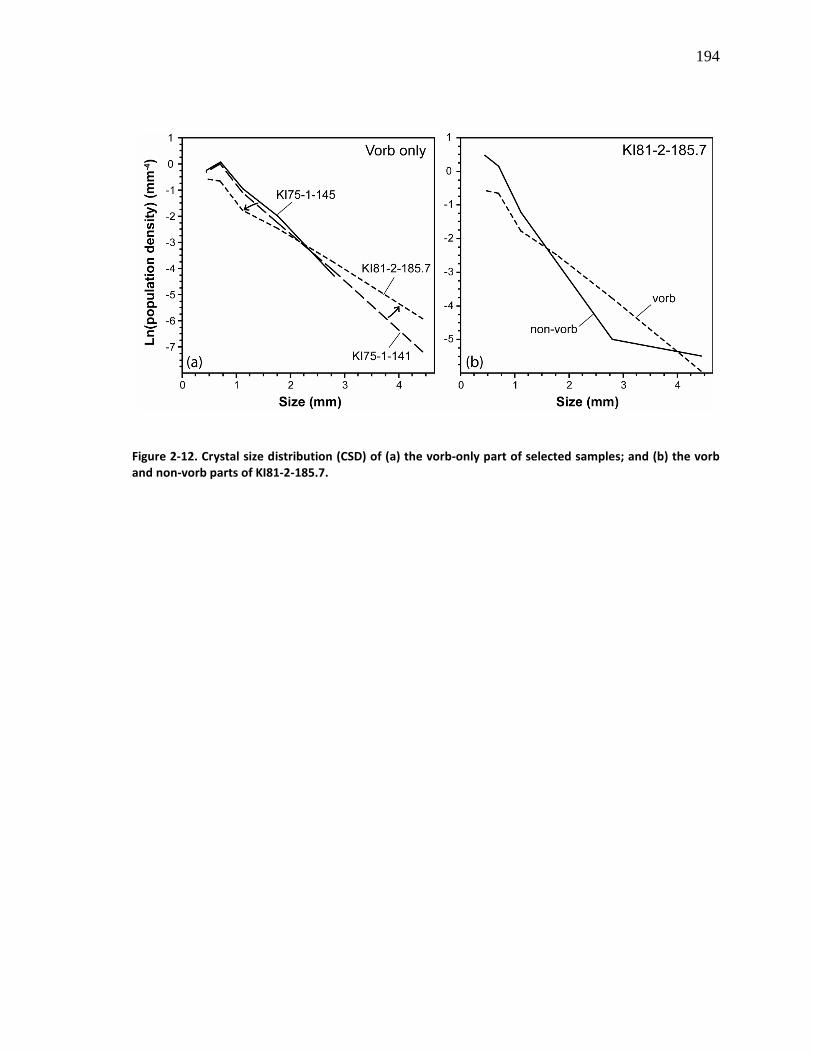
194
Figure 2-12. Crystal size distribution (CSD) of (a) the vorb-only part of selected samples; and (b) the vorb
and non-vorb parts of KI81-2-185.7.
195
2.6 DISCUSSION
The first part of this section deals with olivine residence times in the whole Kilauea Iki
system, that is in both the magmatic plumbing system and the lake itself. The next part is
organised chronologically, as far as possible, from the source of the olivine crystals to the end of
the cooling of the lake. It is divided into two parts: (1) processes that occurred before eruption,
and; (2) processes that occurred in the lava lake. Then, geochemical and textural data are
discussed to decipher how the variations are accounted for, and to draw a coherent petrogenetic
model. Some aspects of a model, such as crystal nucleation, growth, and deformation, or
coarsening, will only affect the rock texture. Other processes will affect both texture and
geochemistry, such as mixing or crystal fractionation and accumulation.
2.6.1 Residence times of olivine in Kilauea Iki magmas
Crystal residence times can be estimated from S-type CSDs (Higgins, 2006b) if a CSD model is
chosen, such as that of Marsh (1988b), and a growth rate defined. This model typically refers to
simple nucleation and growth in a steady-state magma system. It is difficult to precisely define the
growth rate; hence we use a range of values from 2.5 x 10⁻⁹ mm/s (G1) to 5 x 10⁻¹⁰ mm/s (G2),
based on studies of similar rocks (Cashman, 1993, Mangan, 1990, Marsh, 1988, Marsh, 1998,
Wright & Fiske, 1971). Residence time (τ) and LD are related by the equation:
rategrowth
LD=τ
196
Hence, the variations observed in this figure are qualitatively identical to that described for LD in
Section 4.2.4. The crystal populations from group 1 have mean crystal residence times of around
1-1.5 years when using G1, and 4-8 years when using G2 (Table 2-4). Crystal populations from
group 2 have calculated magma residence times significantly higher with values ranging from 4 to
12 years using G1 in the calculations, and from 18 to 59 years using G2.
In summary, the shorter times of 1-8 years estimated from group 1 olivines are thought to
represent the residence time of olivine crystallized both in the shallowest magma storage region
before the eruption, and in the lava lake. Group 2 ages of 4-60 years reflect residence times of
olivine crystallized deeper in the Kilauea Iki system before the eruption. These residence times
agree with that determined by Mangan (1990) from olivine CSDs. She found an average olivine
residence time of 11 ± 4 years for the 1959 Kilauea Iki eruption, with a growth rate of 10-9 mm/s. If
we recalculate her data with our method, we find a range of residence times of ~18-30 years,
using the same mean growth rate of 10-9 mm/s. Our results also accord well with the olivine
residence times determined by Vinet and Higgins (2010) from olivine CSDs for Mauna Ulu lavas,
Hawaii. They proposed olivine residence time ranges of 1-15 years and 3-40 years for the two
texturally different populations revealed in the 1969-74 lavas, using the same growth rates as
presented here.
Crystallisation timescales can also be discussed with regard to location and depth of the
samples in the lake (Fig. 2-10). The residence times plotted in figure 10 were calculated with the
use of a mean olivine growth rate of 10-9 mm/s, instead of a range of values presented above for
clarity of the diagram. The emphasis is now given on the bulk quantitative changes of the
residence times. Olivine residence times for magmas from the centre of the lake show greater
variations than those from the margin (Fig. 2-10a). In addition, greater values are found at both
197
shallower and deeper levels for magmas from both the centre and margin. At depths <10 m, the
residence times range from ~14 to 29 years, whereas it is more constant at 15-50 m depth, with
values around 15 years. Deeper than 60-65 m, the values vary again more strongly from 4 to >25
years. For olivines from the margin of the lake, the residence time variations are less pronounced
(Fig. 2-10b). At depths <10-15 m, the residence time varies from 10-30 years, with little variations
at the edge of the lake. At depths 15-65 m, it appears more stable, centered around 12-18 years,
although only few samples have been analysed. At depths >65 m, the residence time varies from
10-25 years
The variations of residence time (and other textural data) may reflect different crystal
populations present throughout the entire Kilauea Iki lava lake. Overall, two distinct olivine
populations are recognised both at the centre and margin of the lake, which correspond to the
previously defined subgroups 2a and 2b: (1) subgroup 2a olivines, which are smaller crystals with
estimated residence times of 10-20 years; and (2) subgroup 2b olivines, which are bigger crystals
with an estimated residence time of ~24-30 years. To those, a third population of residence time
<5 years, which corresponds to group 1 previously defined, may be added, but it is only present in
a single sample, KI88-2-296.1. Our surface scoria samples contain the three olivine populations,
whereas the eruptive pumice samples of Mangan (1990) does not include the group 1 olivines.
This discrepancy is probably due to her lower CSD analytical precision.
2.6.2 Processes active in Kilauea Iki magma system before eruption
Although this paper focuses on processes active in the lava lake, it is necessary to start by
drawing a synthetic portrait of the major processes at work in the magma system before the
198
eruption. Based on our geochemical and textural results, we consider that crystal or magma
mixing, coarsening, crystal deformation and crystal aggregation played an important role in the
formation of the 1959 Kilauea Iki magmas. Some of these processes were also active during the
solidification of the lake. Consequently, a clear distinction and quantification of pre- and post-
eruption processes is not always easy.
2.6.2.1 Mixing
Mixing is a common phenomenon in igneous systems and evidence for it can be found in
field, textural and geochemical data. Mixing can involve distinct olivine populations from separate
magmas or solid sources. We consider here both the role of magma and crystal mixing in the origin
of the 1959 Kilauea Iki products.
The curvature of CSDs can be used as evidence for mixing: the mixing of two magmas with
non-collinear straight CSDs produces a curved concave-up CSD (Higgins, 1996). This is due to the
logarithmic vertical scale of a classical CSD diagram. This model can also be applied to a rock
formed by two consecutive processes, each process providing straight CSDs. In either case, the
origins of the larger and smaller crystal populations can be treated separately. Textural data has
shown that mixing is important for the formation of some other basaltic rocks (e.g., Higgins, 2009;
Vinet and Higgins, 2010).
Most of our samples are from the lava lake; hence the textural and chemical data acquired
from these samples may have been affected by processes that occurred after the eruption in the
lava lake. Consequently, data from these samples do not fully represent the original features of
the magma system beneath Kilauea Iki, but instead, they likely are the result of a superposition of
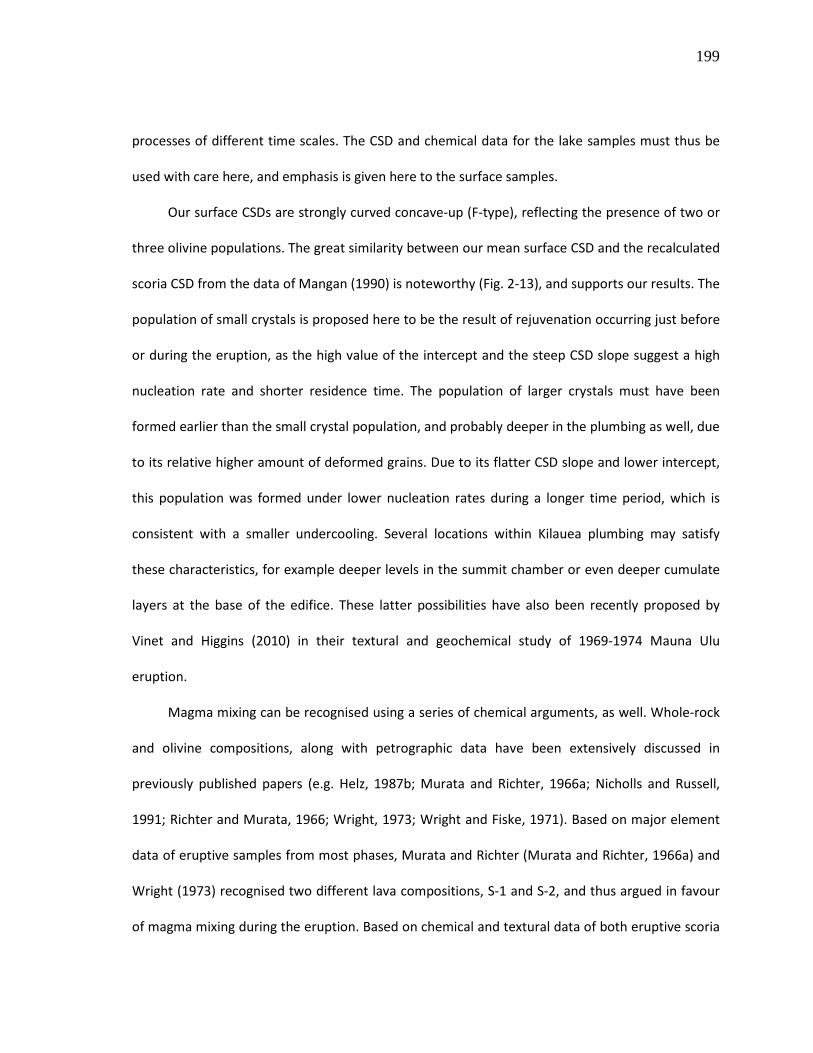
199
processes of different time scales. The CSD and chemical data for the lake samples must thus be
used with care here, and emphasis is given here to the surface samples.
Our surface CSDs are strongly curved concave-up (F-type), reflecting the presence of two or
three olivine populations. The great similarity between our mean surface CSD and the recalculated
scoria CSD from the data of Mangan (1990) is noteworthy (Fig. 2-13), and supports our results. The
population of small crystals is proposed here to be the result of rejuvenation occurring just before
or during the eruption, as the high value of the intercept and the steep CSD slope suggest a high
nucleation rate and shorter residence time. The population of larger crystals must have been
formed earlier than the small crystal population, and probably deeper in the plumbing as well, due
to its relative higher amount of deformed grains. Due to its flatter CSD slope and lower intercept,
this population was formed under lower nucleation rates during a longer time period, which is
consistent with a smaller undercooling. Several locations within Kilauea plumbing may satisfy
these characteristics, for example deeper levels in the summit chamber or even deeper cumulate
layers at the base of the edifice. These latter possibilities have also been recently proposed by
Vinet and Higgins (2010) in their textural and geochemical study of 1969-1974 Mauna Ulu
eruption.
Magma mixing can be recognised using a series of chemical arguments, as well. Whole-rock
and olivine compositions, along with petrographic data have been extensively discussed in
previously published papers (e.g. Helz, 1987b; Murata and Richter, 1966a; Nicholls and Russell,
1991; Richter and Murata, 1966; Wright, 1973; Wright and Fiske, 1971). Based on major element
data of eruptive samples from most phases, Murata and Richter (Murata and Richter, 1966a) and
Wright (1973) recognised two different lava compositions, S-1 and S-2, and thus argued in favour
of magma mixing during the eruption. Based on chemical and textural data of both eruptive scoria
200
and lake samples, Helz (1987b) also proposed a model in which there was mixing of two magmas
with variable amounts of the magma components S-1 and S-2 regarding the eruptive phase. In
several studies it is argued that a MgO-rich magma intruded into and mixed with several
differentiated magmas during the Kilauea Iki eruption (Helz, 1987b; Schwindinger and Anderson,
1989; Wright and Fiske, 1971). The MgO-rich magma entrained olivines with gas and melt
inclusions trapped at 5 kbars (e.g., Harris and Anderson, 1983). This MgO-rich magma is thus
suggested to have risen from deep levels, i.e. the lower crust, within the Kilauea plumbing. Hence,
it may have bypassed the main conduit and summit storage region, and mixed with the
differentiated magmas at shallow depths (Anderson, 1995; Helz, 1987b). On the other hand, most
of the olivines contain inclusions trapped at pressures <1 kbar, thus originating from shallow
depths (Anderson and Brown, 1993). Alternatively, Murata and Richter (1966a, b) proposed a
model in which the shallow magma chamber that fed the eruption was compositionally stratified:
the differentiated magma at the top was erupted first, followed by the olivine-rich magma at the
bottom.
In summary, the olivine populations found in our surface samples may have formed in
different parts of the plumbing system, and undergone different crystallisation histories. Finally,
they may have mixed some time before or maybe partly during the eruption.
The concave-up curvature of at least half of the lake CSDs is strong evidence for magma or
crystal mixing. However, there is probably an overprinting of early (before eruption) and late
(intra-lake) processes we should take into account in these CSDs. Although we feel that late mixing
is of little importance and early mixing likely to be prominent because of the strong curvature of
the mean surface CSD, for example, no estimate can be determined from the textural data, as it is
difficult to distinguish them only using the final products. Furthermore, no strong petrological

201
evidence of mixing is noted among the lake olivine crystals studied here, which accords with the
conclusions of earlier studies such as that of Helz (1987b).
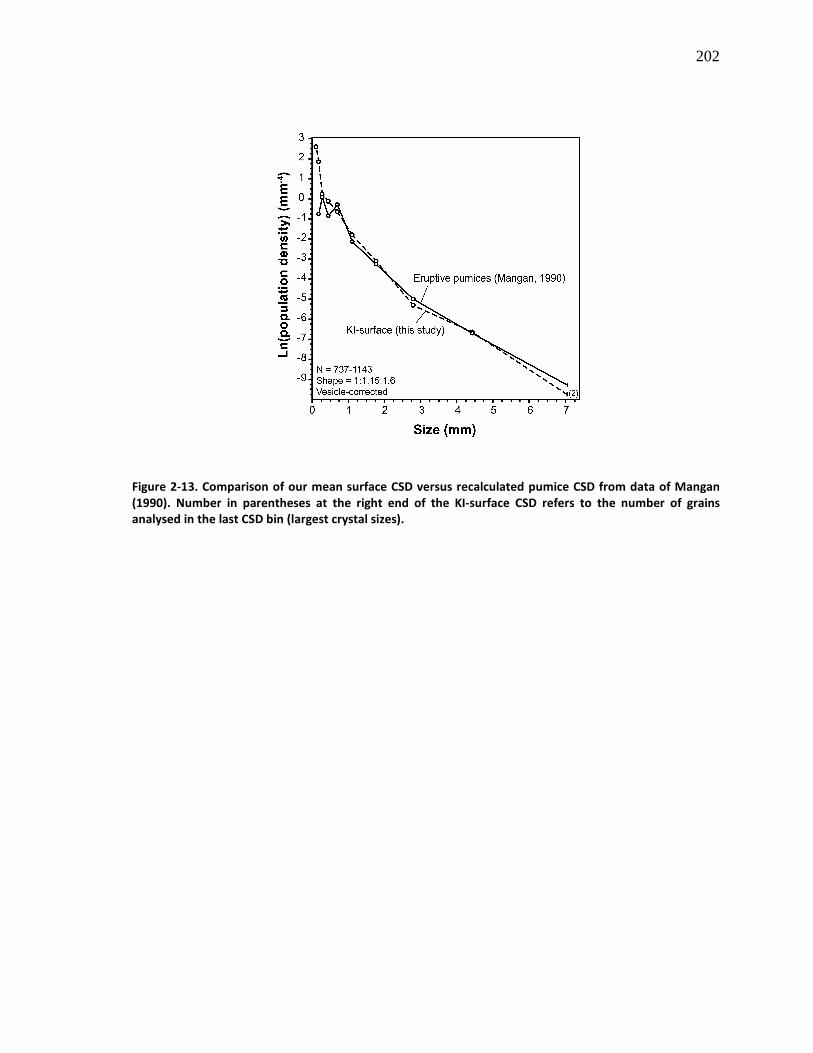
202
Figure 2-13. Comparison of our mean surface CSD versus recalculated pumice CSD from data of Mangan
(1990). Number in parentheses at the right end of the KI-surface CSD refers to the number of grains
analysed in the last CSD bin (largest crystal sizes).
203
2.6.2.2 Coarsening
In an igneous context, coarsening (Ostwald ripening, textural equilibration) is the solution of
small crystals and the simultaneous growth of larger ones as a process of total surface energy
minimization (see review by Voorhees, 1992). This process is most important at temperatures
close to the mineral liquidus. Recently, Simakin and Bindeman (2008) showed that coarsening can
be driven more effectively by thermal oscillations in the magma. The theoretical CSD evolution of
magmas undergoing coarsening has been reviewed by Higgins (2006a). As an ideal result of
coarsening, a straight CSD will be transformed into a hump-shaped CSD, lacking small crystals
(Higgins, 1998; Higgins, 2006a). As coarsening progresses the slope of the right side of the CSD will
decrease, as a result of the increase in growth rate to a maximum with grain size. In a closed
system containing minerals of uniform composition, the total chemical composition is unaffected
by coarsening.
The surface CSDs do not show turndowns at the left side of the plot. This could be
considered as evidence against significant coarsening in the plumbing under Kilauea Iki before the
eruption. However, we have only studied a restricted number of samples. Alternatively,
rejuvenation after coarsening may have produced a new population of small crystals, hence
overprinting the initial turndown at small sizes of the CSDs produced by coarsening. The
implication of coarsening on the surface CSDs is difficult to rigorously test. One possibility may be
that the population of larger crystals, which also contains many deformed grains, was partly
produced by coarsening. In similar rocks from the 1969-74 Mauna Ulu eruption, Vinet and Higgins
(2010) suggested that the main source for the population of large, coarse, and very often
deformed olivine is a deep-seated cumulate lying at crustal levels at the base of the edifice. They
204
also argued in favour of some coarsening in the history of this specific olivine population that
experienced variable degrees of deformation.
A number of lake samples do have a turndown at the left side of the CSDs. These samples
have thus been coarsened. It might have happened in the lava lake during solidification, or earlier
in the magma plumbing system of Kilauea Iki.
2.6.2.3 Deformation of crystals
Deformed olivine crystals are ubiquitous both in the scoria and lake samples, with an
abundance of 0.2 to 12 vol. %, or 2-31 % of the total crystal population (Fig. 2-6; Table 2-2). They
are of great interest here for the evaluation of the origin of the different crystal populations, and
subsequently for the study of olivine distribution or redistribution in the lava lake. It is proposed
here that the deformed crystals are not mantle xenocrysts, but instead are antecrysts, in the sense
of that term as used by Jerram and Martin (2008). This is similar to the ideas of Helz (1987b) for
these specific Kilauea Iki olivines. There are also antecrysts of deformed clinopyroxene.
The assertion that some olivine crystals are antecrysts is in accord with the popular idea
that the deformed crystals in other volcanic rocks in Hawaii are unlikely to represent mantle
xenocrysts or unrelated cumulates from different volcanoes (Baker et al., 1996; Garcia, 1996;
Norman and Garcia, 1999; Wilkinson and Hensel, 1988). This idea is consistent with:
(1) the magmatic origin shown by the fairly high CaO values, around 0.20-0.30 wt. %, of the
scoria olivines (e.g., Norman and Garcia, 1999; Simkin and Smith, 1970; Thompson and
Gibson, 2000);
205
(2) the persistence of melt and Cr-spinel inclusions in both deformed and undeformed
crystals;
(3) the very slight or absence of compositional differences between deformed and
undeformed olivines, even in minor components such as CaO, NiO and MnO, that suggests
that the deformed olivines have a cognate origin with the undeformed ones.
Strictly speaking, these arguments apply only for the scoria olivines since the composition of
the lava lake samples and their olivines must have been modified by intra-lake internal
differentiation and reequilibration throughout the entire cooling period. We have thus avoided a
comparison of lava lake olivine core contents versus olivine composition of the mantle domain,
which may be unreliable in this case.
Sakyi et al. (2008) studied the dislocation microstructures in olivine grains from Kilauea.
They found high densities of dislocations (>106 cm-2) and thus suggest that the olivines have
experienced high-temperature plastic deformation. This interpretation is in agreement with the
kink-banded olivines observed in our samples, given that kink-bands normally form upon
migration of dislocations during thermal restoration at high temperature. The appearance of those
kink-bands attests to a strong deformation regime (Nicolas and Poirier, 1976), in the solid state
(e.g., Green II and Radcliffe, 1972).
Helz (1987b) proposed that the deformed olivines of the 1959 Kilauea Iki eruption were
derived originally from conduit walls, lined by deep crustal cumulates from earlier Kilauea
tholeiites. Wilkinson & Hensel (1988) proposed that the deformed olivines may be cognate with
their hosts and only reflect phenocryst deformation during magma flow through narrow feeders
and conduits, at elevated (but unknown) pressures. In their review of geochemical and geophysical
data on Piton de la Fournaise volcano, La Réunion Island, Peltier et al. (2009) suggested that
206
deformed olivine antecrysts were derived from the walls of the summit magma chamber or from
olivine-enriched layer stored at the base of the reservoir. Others argued in favour of a dunitic
cumulate body formed at the base of, and partly under the shallow reservoirs, at a depth of 4-10
km within the edifice (Clague and Denlinger, 1994; Okubo et al., 1997; Wright and Klein, 2006;
Wyss et al., 2001). Vinet and Higgins (2010) reintroduced this idea of cumulate-derived olivines by
associating it with the influence of the active decollement lying at the base of the edifice, at 9-12
km deep.
Although the deformed crystals have a different history from the undeformed crystals, they
have very similar compositions. Hence, some undeformed crystals may have the same origin as
the deformed ones in the decollement zone. Perhaps there were domains isolated from stress
where olivine grains remained undeformed.
2.6.3 Processes active in Kilauea Iki lava lake
2.6.3.1 Crystal settling
The solidification of a thick magma body such as the Kilauea Iki lava lake is commonly
assumed to be dominated by crystal settling and accumulation, although debate is still active. In
particular, olivine settling is thought to be important in the solidification and differentiation of the
Kilauea Iki lake products, on the basis of their chemical and petrological effects (e.g. Hagerty et al.,
2006; Helz, 1980, 1987a; Helz et al., 1989; Jellinek and Kerr, 2001; Richter and Moore, 1966).
Settling of coarser olivine crystals in the lava lake was proposed to have mostly controlled the
formation of an olivine-depleted zone between 18 and 40 m depth (Helz, 1987a; Mangan and Helz,
207
1985). This process is thought to have been efficient only from 1963 to 1972 (Helz, 1980), mostly
resulting in the current distribution of olivine in the lake. Olivine settling is also argued to be a
major process involved in the differentiation that occurred in the magma chamber before the
1959 Kilauea Iki eruption (Murata and Richter, 1966b; Richter and Murata, 1966).
The abundance of olivine determined in our study can also be examined to see if it supports
olivine settling. The distribution of olivine in the centre of the lava lake follows the generally
settling-related S-shaped pattern with respect to depth noted by Helz (1980; 2009) (Fig. 2-14;
Table 2-2): an olivine-rich zone at upper levels (<18 m), with up to 35 vol. % olivine; an olivine-
depleted zone at intermediate levels (18-40 m), with olivine contents of 7 vol. % in KI75-1-60 (~18
m) and 11 vol. % in KI75-1-130 (~40 m); and an olivine accumulation zone at deeper levels (>45 m),
with values up to 30 vol. %. This pattern is less pronounced for the margin of the lake, and even
totally absent for the very edge that has only 13-18 vol. % olivine over the upper 40 m. Although
only a few samples from the depths corresponding to the olivine-poor zone are studied here, the
strong decrease in olivine abundance seems significant. To a lesser extent, this decrease in total
percent olivine is noted as well at the margin of the lake, with 15-17 vol. % in KI67-1-60.4 (18 m)
and KI67-1-77 (24 m). This tendency is also observed in a plot of Lmax versus depth (Fig. 2-9). In
addition, we have examined several other thin sections of different drill cores from the depth
range 18-40 m in which the olivine content was very low, <5-10 vol. % typically, and olivines >2
mm in size essentially absent. The olivine distribution pattern of the accumulation zone is similar
for samples from both the centre and margin of the lake, with slightly lower values for the very
edge. In a first view, our data seem thus to support the idea of crystal settling.
Crystal settling is commonly proposed based on chemical data or total olivine abundance,
but recently a few studies have used textural data such as the CSD analysis (e.g. Higgins, 2002b;
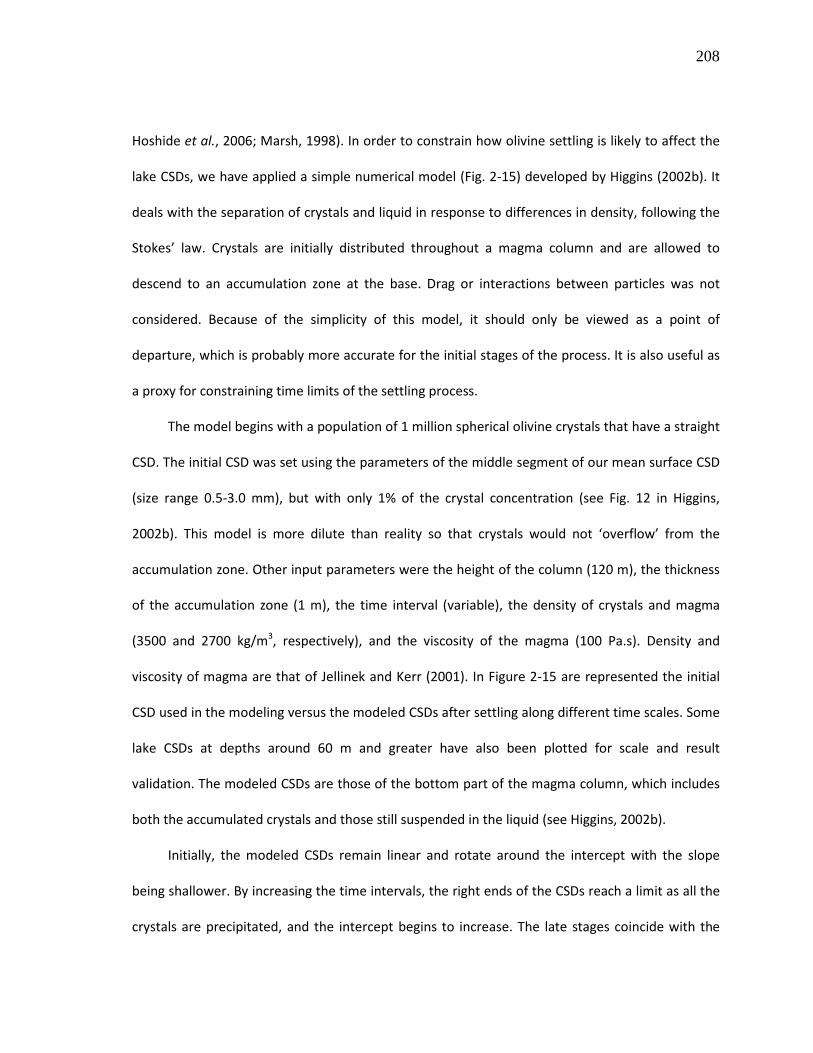
208
Hoshide et al., 2006; Marsh, 1998). In order to constrain how olivine settling is likely to affect the
lake CSDs, we have applied a simple numerical model (Fig. 2-15) developed by Higgins (2002b). It
deals with the separation of crystals and liquid in response to differences in density, following the
Stokes’ law. Crystals are initially distributed throughout a magma column and are allowed to
descend to an accumulation zone at the base. Drag or interactions between particles was not
considered. Because of the simplicity of this model, it should only be viewed as a point of
departure, which is probably more accurate for the initial stages of the process. It is also useful as
a proxy for constraining time limits of the settling process.
The model begins with a population of 1 million spherical olivine crystals that have a straight
CSD. The initial CSD was set using the parameters of the middle segment of our mean surface CSD
(size range 0.5-3.0 mm), but with only 1% of the crystal concentration (see Fig. 12 in Higgins,
2002b). This model is more dilute than reality so that crystals would not ‘overflow’ from the
accumulation zone. Other input parameters were the height of the column (120 m), the thickness
of the accumulation zone (1 m), the time interval (variable), the density of crystals and magma
(3500 and 2700 kg/m3, respectively), and the viscosity of the magma (100 Pa.s). Density and
viscosity of magma are that of Jellinek and Kerr (2001). In Figure 2-15 are represented the initial
CSD used in the modeling versus the modeled CSDs after settling along different time scales. Some
lake CSDs at depths around 60 m and greater have also been plotted for scale and result
validation. The modeled CSDs are those of the bottom part of the magma column, which includes
both the accumulated crystals and those still suspended in the liquid (see Higgins, 2002b).
Initially, the modeled CSDs remain linear and rotate around the intercept with the slope
being shallower. By increasing the time intervals, the right ends of the CSDs reach a limit as all the
crystals are precipitated, and the intercept begins to increase. The late stages coincide with the
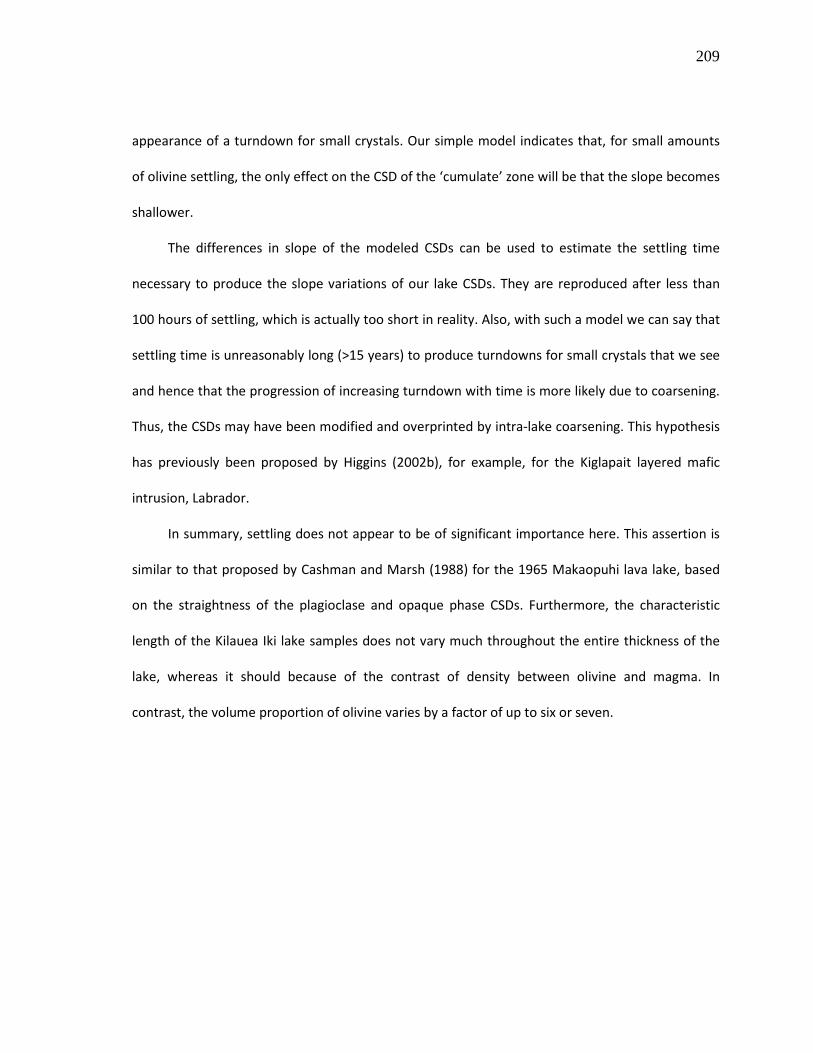
209
appearance of a turndown for small crystals. Our simple model indicates that, for small amounts
of olivine settling, the only effect on the CSD of the ‘cumulate’ zone will be that the slope becomes
shallower.
The differences in slope of the modeled CSDs can be used to estimate the settling time
necessary to produce the slope variations of our lake CSDs. They are reproduced after less than
100 hours of settling, which is actually too short in reality. Also, with such a model we can say that
settling time is unreasonably long (>15 years) to produce turndowns for small crystals that we see
and hence that the progression of increasing turndown with time is more likely due to coarsening.
Thus, the CSDs may have been modified and overprinted by intra-lake coarsening. This hypothesis
has previously been proposed by Higgins (2002b), for example, for the Kiglapait layered mafic
intrusion, Labrador.
In summary, settling does not appear to be of significant importance here. This assertion is
similar to that proposed by Cashman and Marsh (1988) for the 1965 Makaopuhi lava lake, based
on the straightness of the plagioclase and opaque phase CSDs. Furthermore, the characteristic
length of the Kilauea Iki lake samples does not vary much throughout the entire thickness of the
lake, whereas it should because of the contrast of density between olivine and magma. In
contrast, the volume proportion of olivine varies by a factor of up to six or seven.
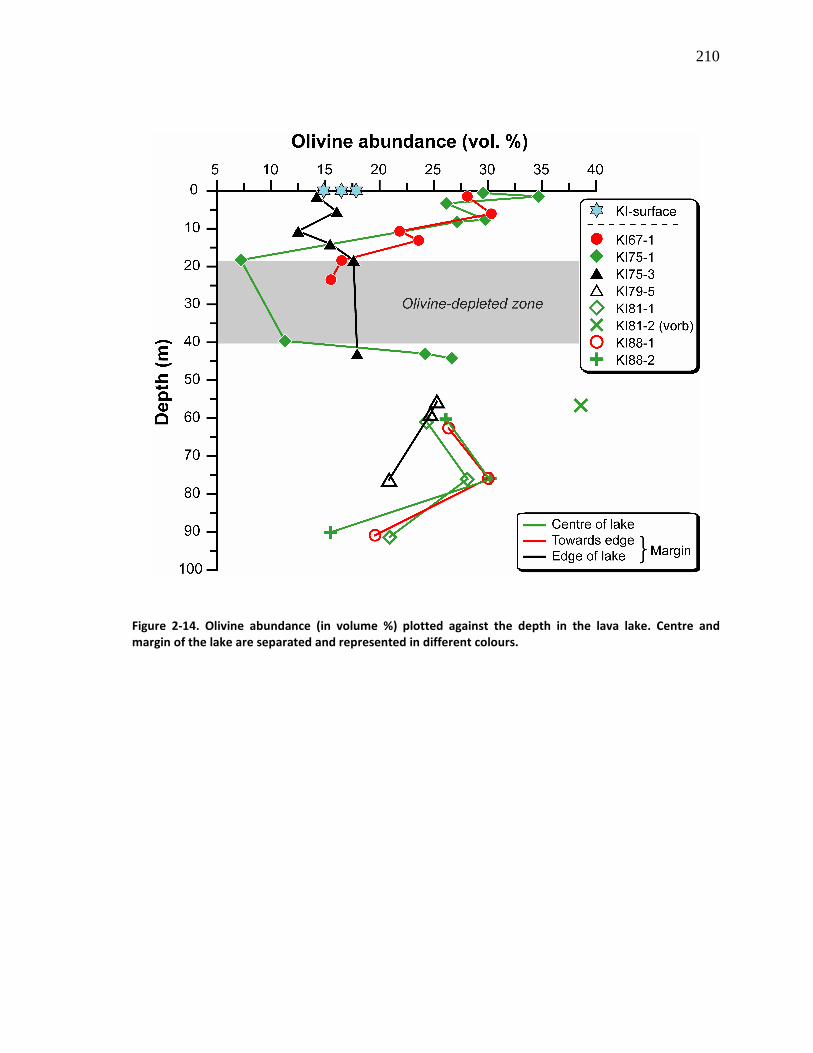
210
Figure 2-14. Olivine abundance (in volume %) plotted against the depth in the lava lake. Centre and
margin of the lake are separated and represented in different colours.
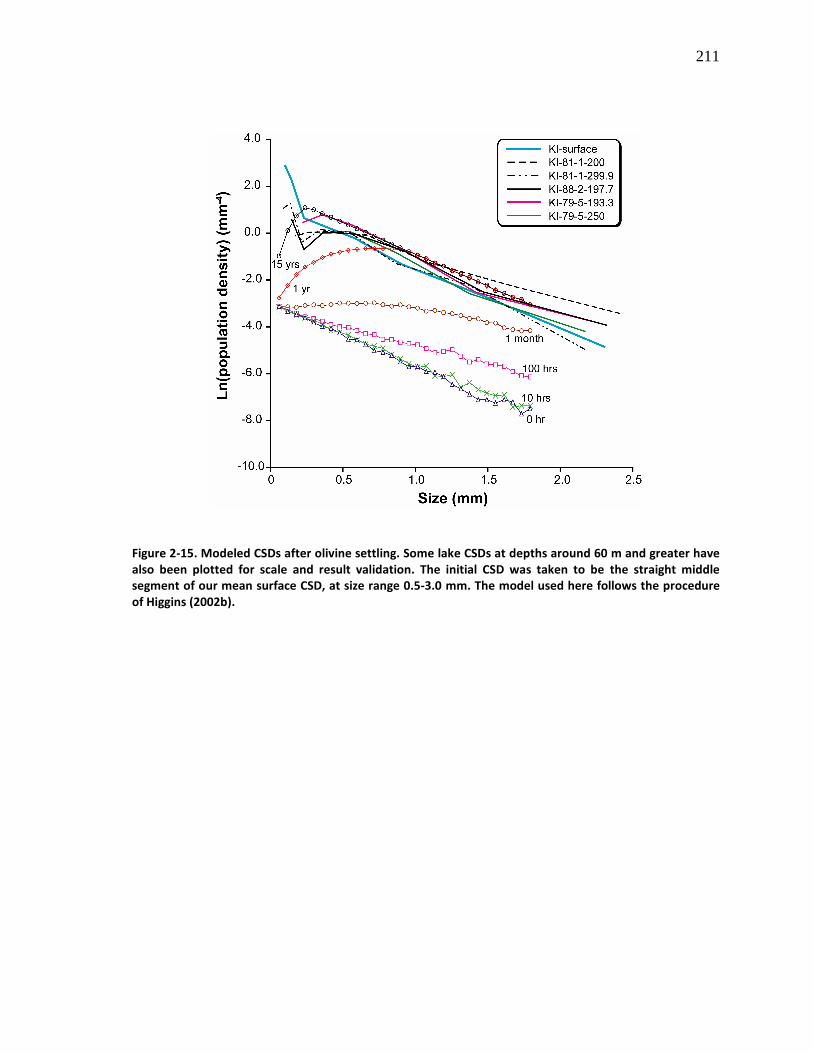
211
Figure 2-15. Modeled CSDs after olivine settling. Some lake CSDs at depths around 60 m and greater have
also been plotted for scale and result validation. The initial CSD was taken to be the straight middle
segment of our mean surface CSD, at size range 0.5-3.0 mm. The model used here follows the procedure
of Higgins (2002b).
212
2.6.3.2 Convective or advective redistribution of crystals
In igneous geology, natural convection motions of magmas or melts are generated by
density differences due to thermal or compositional gradients. Advection is the relative transport
of matter, such as crystals, or heat, by the larger-scale motion of currents in magma or melt. This
may be of thermal, compositional or other origin. It is actually difficult in natural environments to
distinguish which process really occurs relative to the other, which is why they are treated here
together. Both processes are commonly involved in the redistribution of crystals and other
materials; thus, the process of differentiation in many thick magma bodies generally occurs both
at depth (in magma chambers) and at surface levels (in active lava lakes) (e.g. Harris et al., 2005;
Witham and Llewellin, 2006). The occurrence of significant convection or advection in passive, or
inactive lava lakes (see definition in Harris et al., 2005; Swanson et al., 1979) is heavily more
debated (e.g. Davaille and Jaupart, 1993; Evans and Moore, 1968; Hermance and Colp, 1982; Hort
et al., 1999; Jellinek and Kerr, 2001; Moore and Evans, 1967; Rupke and Hort, 2004; Shaw et al.,
1968; Worster et al., 1993; Wright and Okamura, 1977). Below, we will only use the term
‘convection’ for the purpose of simplification.
In natural systems such as the Kilauea Iki lava lake, the timing, extent and location of
convection is difficult to evaluate. However, this process may have a significant control on the way
the crystals are redistributed in the magma, and thus, may lead to some textural record. Hence,
the CSD approach may help in constraining the possible effect of convection on the redistribution
patterns of olivine crystals in the Kilauea Iki lava lake. To evaluate this possibility we have chosen
to use the same CSD numerical model and its parameters as for settling (Higgins, 2002b), but with
the addition of convection velocity as another input parameter. Upward convection competes
213
with settling whereas downward convection enhances it. One should expect that, if convection
occurred in a significant way both in terms of time and space, it would result in a significant
textural response possibly seen in the CSDs. However, a problem arises here. If we use realistic
advection velocities, such as ~1.4 x 10⁻³ m/s, which corresponds to one overturn per day, then we
see no settling at all or complete settling, depending on the source of the vertical motion. Hence,
CSDs cannot be used to determine if there was convection.
Absence of significant large-scale convection in the lava lake was proposed in previous
studies (Barth et al., 1994; Gibb and Henderson, 1992; Helz, 1980; Helz et al., 1989). It accords
with the conclusions of Marsh (1989) that convection is only possible when the crystal fraction is
low, although no precise values can be easily estimated. However, it is in marked contrast with the
view of Jellinek and Kerr (2001) of a “vigorous stirring in the magma”, driven by descending
thermal convection and ascending compositional convection. Also, it somewhat contrasts with the
convective flow differentiation of crystals proposed for the 1965 Makaopuhi lava lake (Cashman
and Marsh, 1988; Wright and Okamura, 1977), which was thought to be particularly active in the
deeper, non-vesiculated lava of this lake.
Convection movements can be associated with diapiric transfers, which are considered here
as the mechanisms responsible for the vorb formation. Segregation veins and vorbs are widely
distributed in the Kilauea Iki lava lake (Helz, 1979; Helz, 1980, 1987a; Helz et al., 1989; Mangan
and Helz, 1985, 1986; Richter and Moore, 1966). The focus is only given here to the vorbs, and not
to segregation veins, since the latter are not present in our samples. Vorbs were interpreted to
play an important role in the evolution of the lake magma, but only in the depth range 18-58 m,
with the 40-58 m interval being more intensely affected (Helz et al., 1989). In this study, most
textural criteria of Helz have been recognised. We also observed that all vorbs are from the centre
214
of the lake, which is consistent with the observations of Helz (1980) and Helz et al. (1989) that few
or no vorb structures have been recognised at the margin of the lake. Slow convective movement
can produce the vorb CSDs. The vorb part of KI81-2-185.7 is a good example for that. Relative to
the mean surface CSD, this vorb has a CSD rotated clockwise around 1.5 mm size (Fig. 2-7). This
CSD pattern, much more conspicuous for this vorb than for the vorbs in KI75-1-141 and KI75-1-
145, is likely a result of the advective currents upward induced by the diapiric transfer responsible
for the vorb formation. In summary, the vorb-related diapiric transfer is thought here to have
participated in the olivine redistribution through the lava lake during its cooling, but only for the
low-Fo group and in a narrow-scale manner.
2.6.3.3 Final crystal growth
The presence of several olivine populations, with zoned or resorbed crystals, along with a
significant proportion of deformed olivines, suggest that crystallisation of the Kilauea Iki magma(s)
occurred at different times and locations or depths in Kilauea’s magma system. Several authors
have argued that post-emplacement crystallisation has occurred in thick basaltic magma bodies,
such as Kilauea Iki lava lake (e.g. Jellinek and Kerr, 2001; Richter and Moore, 1966; Scowen et al.,
1991), as well as the prehistoric and modern Makaopuhi lava lakes (Evans and Moore, 1968;
Hagerty et al., 2006; Moore and Evans, 1967; Wright and Okamura, 1977). But how can we
distinguish crystals that formed before the eruption from crystals that nucleated and grew later
within the lava lake? In the Kilauea Iki lava lake, we noted that the rim Fo content follows a normal
Gaussian distribution throughout the entire thickness of the lake, around a mean of Fo74 (Fig. 2-3).
We also see a minor population of crystals with this as a core composition, particularly towards
215
the base (>60 m), and edge of the lake. Undercooling was strong here, which produced high
nucleation rates that allowed rejuvenation. However, the volume proportion of newly formed
(rejuvenated) crystals in the lake was not quantified for our samples.
Some of our straight lake CSDs, with no apparent turndowns, may result from post-
emplacement growth. This is also applicable for the steep part at the left side of the CSD for
samples from 1988 drillings (mostly at the centre and a little at the margin of the lake), or samples
from the first 15 m of the lake, at the northern edge. This minor feature is possibly attributable to
rejuvenation.
2.6.3.4 Origin of the chemical and mineralogical vertical stratification
One of the major issues of this study lies in the understanding of the mechanisms that
originated and maybe preserved the vertical stratification of the Kilauea Iki lava lake, as defined by
the olivine characteristics. There is no simple explanation to account for the presence at depths
>60 m of olivine crystals with core Fo content of 72-81%. Similarly, all Fo-rich olivines are
constrained to the first 60 m of the lake. This cannot be ascribed to full crystal reequilibration with
the residual, more evolved melt in the lake. This view is in marked contrast with the work of
Scowen et al. (1991) that argued in favour of reequilibration by cationic diffusion, with Mg, Al, Cr
moving outwards from the olivine, and Fe and Ti inwards. We feel that Fe-Mg diffusion between
olivine and the interstitial melt would not be efficient enough, even at magmatic temperatures
around 1100°C, to allow such reequilibration to extend to every crystal core. Our analytical data
show that only the rim has been affected. Also, there is divergence between the composition of
surface olivine and that of lake materials, the former being more Fo-rich.
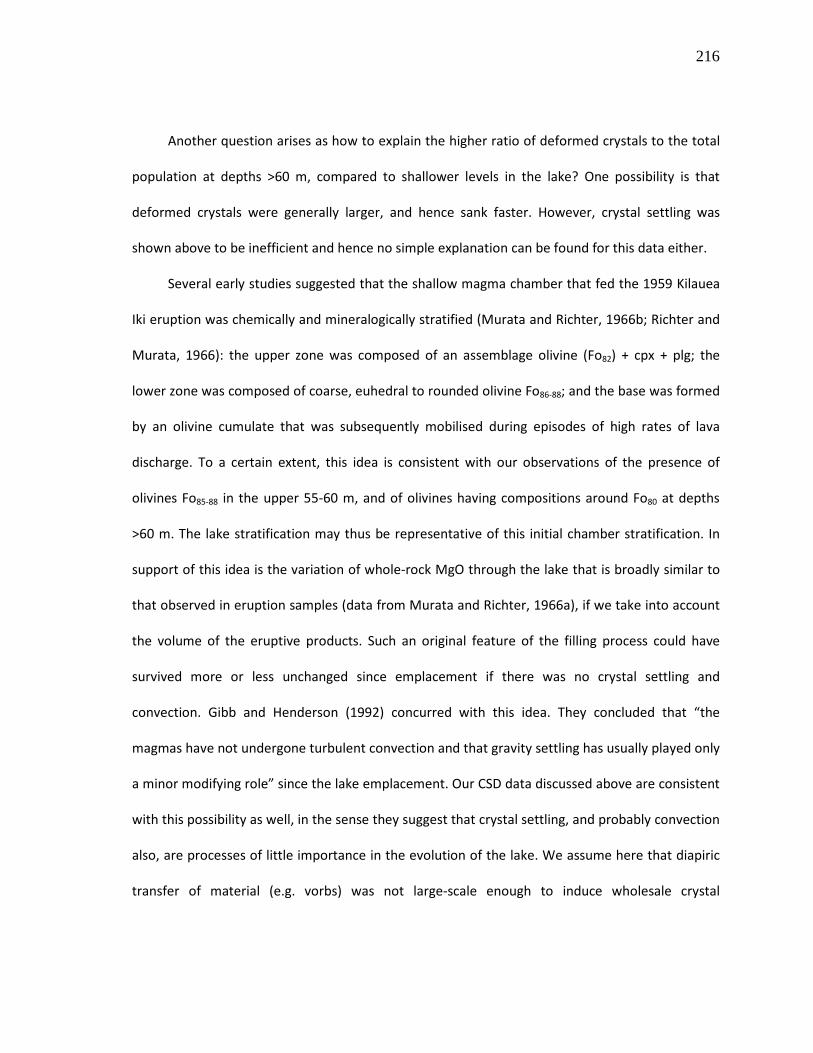
216
Another question arises as how to explain the higher ratio of deformed crystals to the total
population at depths >60 m, compared to shallower levels in the lake? One possibility is that
deformed crystals were generally larger, and hence sank faster. However, crystal settling was
shown above to be inefficient and hence no simple explanation can be found for this data either.
Several early studies suggested that the shallow magma chamber that fed the 1959 Kilauea
Iki eruption was chemically and mineralogically stratified (Murata and Richter, 1966b; Richter and
Murata, 1966): the upper zone was composed of an assemblage olivine (Fo82) + cpx + plg; the
lower zone was composed of coarse, euhedral to rounded olivine Fo86-88; and the base was formed
by an olivine cumulate that was subsequently mobilised during episodes of high rates of lava
discharge. To a certain extent, this idea is consistent with our observations of the presence of
olivines Fo85-88 in the upper 55-60 m, and of olivines having compositions around Fo80 at depths
>60 m. The lake stratification may thus be representative of this initial chamber stratification. In
support of this idea is the variation of whole-rock MgO through the lake that is broadly similar to
that observed in eruption samples (data from Murata and Richter, 1966a), if we take into account
the volume of the eruptive products. Such an original feature of the filling process could have
survived more or less unchanged since emplacement if there was no crystal settling and
convection. Gibb and Henderson (1992) concurred with this idea. They concluded that “the
magmas have not undergone turbulent convection and that gravity settling has usually played only
a minor modifying role” since the lake emplacement. Our CSD data discussed above are consistent
with this possibility as well, in the sense they suggest that crystal settling, and probably convection
also, are processes of little importance in the evolution of the lake. We assume here that diapiric
transfer of material (e.g. vorbs) was not large-scale enough to induce wholesale crystal
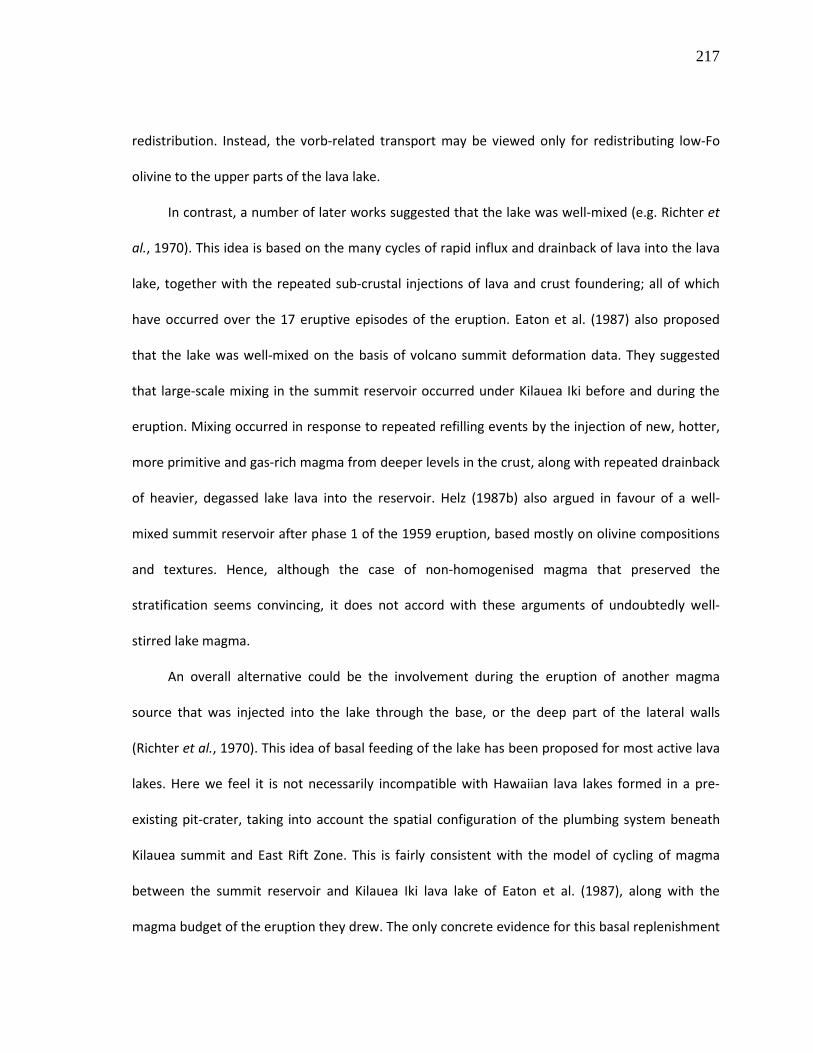
217
redistribution. Instead, the vorb-related transport may be viewed only for redistributing low-Fo
olivine to the upper parts of the lava lake.
In contrast, a number of later works suggested that the lake was well-mixed (e.g. Richter et
al., 1970). This idea is based on the many cycles of rapid influx and drainback of lava into the lava
lake, together with the repeated sub-crustal injections of lava and crust foundering; all of which
have occurred over the 17 eruptive episodes of the eruption. Eaton et al. (1987) also proposed
that the lake was well-mixed on the basis of volcano summit deformation data. They suggested
that large-scale mixing in the summit reservoir occurred under Kilauea Iki before and during the
eruption. Mixing occurred in response to repeated refilling events by the injection of new, hotter,
more primitive and gas-rich magma from deeper levels in the crust, along with repeated drainback
of heavier, degassed lake lava into the reservoir. Helz (1987b) also argued in favour of a well-
mixed summit reservoir after phase 1 of the 1959 eruption, based mostly on olivine compositions
and textures. Hence, although the case of non-homogenised magma that preserved the
stratification seems convincing, it does not accord with these arguments of undoubtedly well-
stirred lake magma.
An overall alternative could be the involvement during the eruption of another magma
source that was injected into the lake through the base, or the deep part of the lateral walls
(Richter et al., 1970). This idea of basal feeding of the lake has been proposed for most active lava
lakes. Here we feel it is not necessarily incompatible with Hawaiian lava lakes formed in a pre-
existing pit-crater, taking into account the spatial configuration of the plumbing system beneath
Kilauea summit and East Rift Zone. This is fairly consistent with the model of cycling of magma
between the summit reservoir and Kilauea Iki lava lake of Eaton et al. (1987), along with the
magma budget of the eruption they drew. The only concrete evidence for this basal replenishment
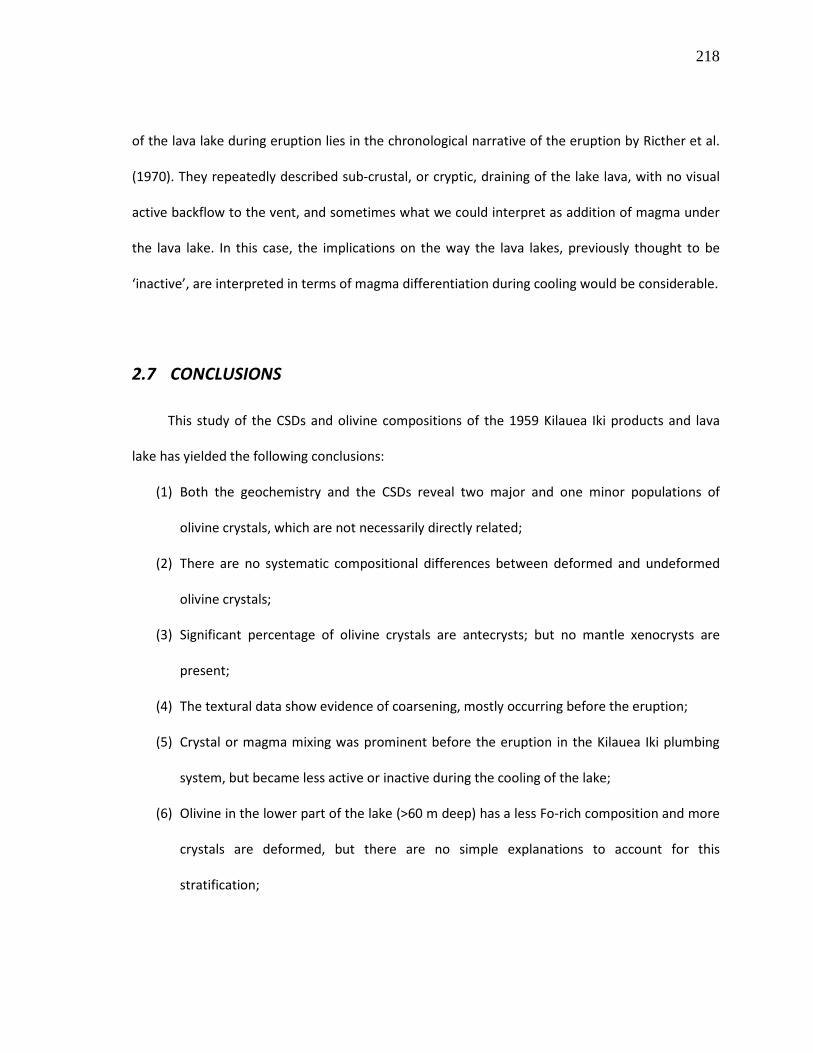
218
of the lava lake during eruption lies in the chronological narrative of the eruption by Ricther et al.
(1970). They repeatedly described sub-crustal, or cryptic, draining of the lake lava, with no visual
active backflow to the vent, and sometimes what we could interpret as addition of magma under
the lava lake. In this case, the implications on the way the lava lakes, previously thought to be
‘inactive’, are interpreted in terms of magma differentiation during cooling would be considerable.
2.7 CONCLUSIONS
This study of the CSDs and olivine compositions of the 1959 Kilauea Iki products and lava
lake has yielded the following conclusions:
(1) Both the geochemistry and the CSDs reveal two major and one minor populations of
olivine crystals, which are not necessarily directly related;
(2) There are no systematic compositional differences between deformed and undeformed
olivine crystals;
(3) Significant percentage of olivine crystals are antecrysts; but no mantle xenocrysts are
present;
(4) The textural data show evidence of coarsening, mostly occurring before the eruption;
(5) Crystal or magma mixing was prominent before the eruption in the Kilauea Iki plumbing
system, but became less active or inactive during the cooling of the lake;
(6) Olivine in the lower part of the lake (>60 m deep) has a less Fo-rich composition and more
crystals are deformed, but there are no simple explanations to account for this
stratification;
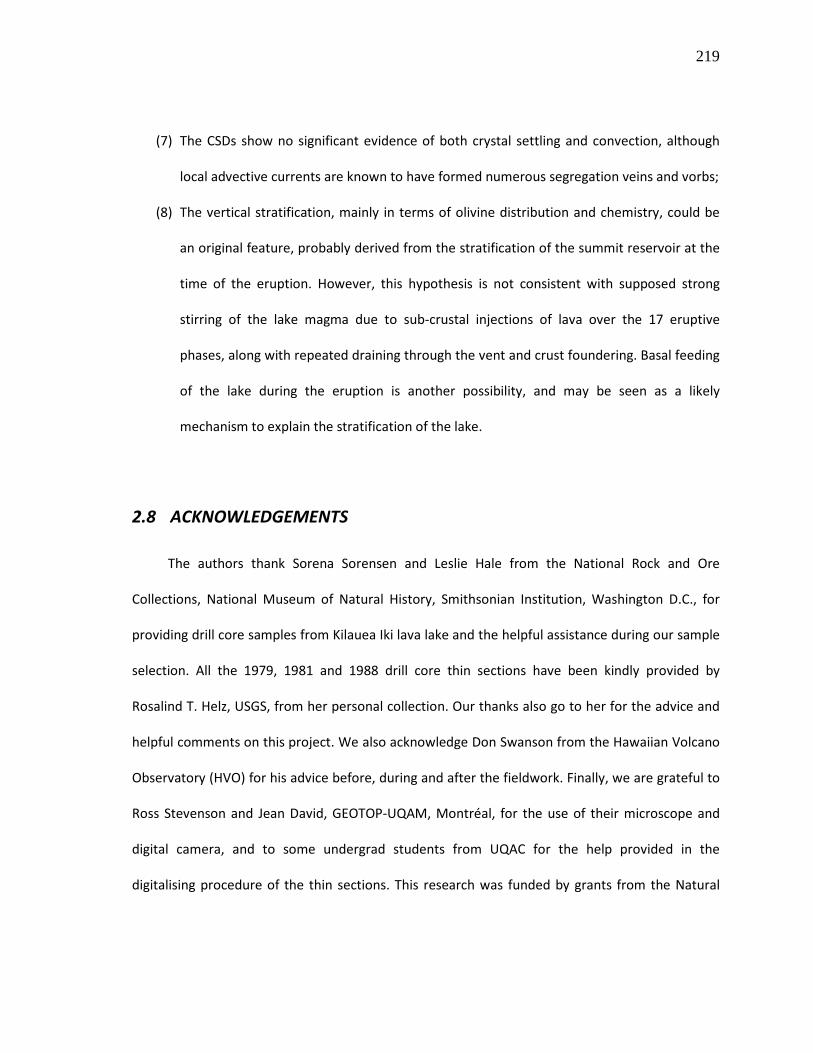
219
(7) The CSDs show no significant evidence of both crystal settling and convection, although
local advective currents are known to have formed numerous segregation veins and vorbs;
(8) The vertical stratification, mainly in terms of olivine distribution and chemistry, could be
an original feature, probably derived from the stratification of the summit reservoir at the
time of the eruption. However, this hypothesis is not consistent with supposed strong
stirring of the lake magma due to sub-crustal injections of lava over the 17 eruptive
phases, along with repeated draining through the vent and crust foundering. Basal feeding
of the lake during the eruption is another possibility, and may be seen as a likely
mechanism to explain the stratification of the lake.
2.8 ACKNOWLEDGEMENTS
The authors thank Sorena Sorensen and Leslie Hale from the National Rock and Ore
Collections, National Museum of Natural History, Smithsonian Institution, Washington D.C., for
providing drill core samples from Kilauea Iki lava lake and the helpful assistance during our sample
selection. All the 1979, 1981 and 1988 drill core thin sections have been kindly provided by
Rosalind T. Helz, USGS, from her personal collection. Our thanks also go to her for the advice and
helpful comments on this project. We also acknowledge Don Swanson from the Hawaiian Volcano
Observatory (HVO) for his advice before, during and after the fieldwork. Finally, we are grateful to
Ross Stevenson and Jean David, GEOTOP-UQAM, Montréal, for the use of their microscope and
digital camera, and to some undergrad students from UQAC for the help provided in the
digitalising procedure of the thin sections. This research was funded by grants from the Natural
220
Science and Engineering Research Council of Canada to MDH, along with scholarships from the
University of Quebec at Chicoutimi (Lucien Bouchard and PAIR scholarships) to NV.
2.9 REFERENCES
Anderson, A.T., 1995. CO2 and the eruptibility of picrite and komatiite. Lithos, 34(1-3): 19-25.
Anderson, A.T. and Brown, G.G., 1993. CO2 contents and formation pressures of some Kilauean melt inclusions. American Mineralogist, 78(7-8): 794-803.
Baker, M.B., Alves, S. and Stolper, E.M., 1996. Petrography and petrology of the Hawaii Scientific Drilling Project lavas: Inferences from olivine phenocryst abundances and compositions. Journal of Geophysical Research-Solid Earth, 101(B5): 11715-11727.
Barth, G.A., Kleinrock, M.C. and Helz, R.T., 1994. The Magma Body at Kilauea-Iki Lava Lake - Potential Insights into Midocean Ridge Magma Chambers. Journal of Geophysical Research-Solid Earth, 99(B4): 7199-7217.
Bowen, N.L., 1928. The Evolution of the Igneous Rocks. Princeton University Press, Princeton, NJ, 332 pp.
Brandeis, G. and Jaupart, C., 1986. On the Interaction between Convection and Crystallization in Cooling Magma Chambers. Earth and Planetary Science Letters, 77(3-4): 345-361.
Cashman, K.V., 1993. Relationship between Plagioclase Crystallization and Cooling Rate in Basaltic Melts. Contributions to Mineralogy and Petrology, 113(1): 126-142.
Cashman, K.V. and Marsh, B.D., 1988. Crystal Size Distribution (Csd) in Rocks and the Kinetics and Dynamics of Crystallization .2. Makaopuhi Lava Lake. Contributions to Mineralogy and Petrology, 99(3): 292-305.
Clague, D.A. and Denlinger, R.P., 1994. Role of olivine cumulates in destabilizing the flanks of Hawaiian volcanoes. Bulletin of Volcanology, 56(6-7): 425-434.
Davaille, A. and Jaupart, C., 1993. Thermal-Convection in Lava Lakes. Geophysical Research Letters, 20(17): 1827-1830.
Eaton, J.P., Richter, D.H. and Krivoy, H.L., 1987. Cycling of magma between the summit reservoir and Kilauea Iki lava lake during the 1959 eruption of Kilauea Volcano. U. S. Geological Survey Professional Paper, 1350: 1307-1335.
221
Evans, B.W. and Moore, J.G., 1968. Mineralogy as a function of depth in the prehistoric Makaopuhi tholeiitic lava lake, Hawaii. Contributions to Mineralogy and Petrology, 17(2): 85-115.
Garcia, M.O., 1996. Petrography and olivine and glass chemistry of lavas from the Hawaii Scientific Drilling Project. Journal of Geophysical Research-Solid Earth, 101(B5): 11701-11713.
Gibb, F.G.F. and Henderson, C.M.B., 1992. Convection and crystal settling in sills. Contributions to Mineralogy and Petrology, 109(4): 538-545.
Green II, H.W. and Radcliffe, S.V., 1972. Dislocation mechanisms in olivine and flow in the upper mantle. Earth and Planetary Science Letters, 15(3): 239-247.
Hagerty, J.J., Shearer, C.K., Vaniman, D.T. and Burger, P.V., 2006. Identifying the effects of petrologic processes in a closed basaltic system using trace-element concentrations in olivines and glasses: Implications for comparative planetology. American Mineralogist, 91(10): 1499-1508.
Harris, A.J.L., Carniel, R. and Jones, J., 2005. Identification of variable convective regimes at Erta Ale Lava Lake. Journal of Volcanology and Geothermal Research, 142(3-4): 207-223.
Harris, D.M. and Anderson, A.T., 1983. Concentrations, sources, and losses of H2O, CO2, and S in Kilauean basalt. Geochimica Et Cosmochimica Acta, 47(6): 1139-1150.
Helz, R.T., 1979. Kilauea Iki lava lake; results of coring the upper crust. In: R.W. Decker, C. Drake, G.P. Eaton and C. Helsley (Editors), Hawaii symposium on Intraplate volcanism and submarine volcanism. U. S. Geological Survey, pp. 145.
Helz, R.T., 1980. Crystallization history of Kilauea Iki lava lake as seen in drill core recovered in 1967-1979. Bulletin Volcanologique, 43(4): 675-701.
Helz, R.T., 1987a. Differenciation behavior of Kilauea Iki lava lake, Kilauea Volcano, Hawaii: An overview of past and current work. In: B.O. Mysen (Editor), Magmatic Processes: Physicochemical Principles. The Geochemical Society, pp. 241-258.
Helz, R.T., 1987b. Diverse olivine types in lava of the 1959 eruption of Kilauea Volcano and their bearing on eruption dynamics. U.S. Geological Survey, Professional Paper, 1350(1): 691-722.
Helz, R.T., 1993. Drilling report and core logs for the 1988 drilling of Kilauea Iki lava lake, Kilauea Volcano, Hawaii, with summary descriptions of the occurrence of foundered crust and fractures in the drill core. U.S. Geological Survey Open-File Report 93-15: 57 p.
Helz, R.T., 2009. Processes active in mafic magma chambers: The example of Kilauea Iki Lava Lake, Hawaii. Lithos, 111: 37-46.
222
Helz, R.T., Banks, N.G., Casadevall, T.J., Fiske, R.S. and Moore, R.B., 1984. A catalogue of drill core recovered from Kilauea Iki lava lake from 1967 to 1979. U.S. Geological Survey Open-File Report 84-484: 72 p.
Helz, R.T., Kirschenbaum, H. and Marinenko, J.W., 1989. Diapiric transfer of melt in Kilauea Iki lava lake, Hawaii - A quick, efficient process of igneous differentiation. Geological Society of America Bulletin, 101(4): 578-594.
Helz, R.T. and Wright, T.L., 1983. Drilling report and core logs for the 1981 drilling of Kilauea Iki lava lake. U.S. Geological Survey Open-File Report 83-326: 66 p.
Hermance, J.F. and Colp, J.L., 1982. Kilauea Iki Lava Lake - Geophysical Constraints on Its Present (1980) Physical State. Journal of Volcanology and Geothermal Research, 13(1-2): 31-61.
Higgins, M.D., 1996. Magma dynamics beneath Kameni volcano, Thera, Greece, as revealed by crystal size and shape measurements. Journal of Volcanology and Geothermal Research, 70(1-2): 37-48.
Higgins, M.D., 1998. Origin of anorthosite by textural coarsening: Quantitative measurements of a natural sequence of textural development. Journal of Petrology, 39(7): 1307-1323.
Higgins, M.D., 2000. Measurement of crystal size distributions. American Mineralogist, 85(9): 1105-1116.
Higgins, M.D., 2002a. Closure in crystal size distributions (CSD), verification of CSD calculations, and the significance of CSD fans. American Mineralogist, 87(1): 171-175.
Higgins, M.D., 2002b. A crystal size-distribution study of the Kiglapait layered mafic intrusion, Labrador, Canada: evidence for textural coarsening. Contributions to Mineralogy and Petrology, 144(3): 314-330.
Higgins, M.D., 2006a. Quantitative Textural Measurements in Igneous and Metamorphic Petrology. Cambridge University Press, Cambridge, UK, 265 pp.
Higgins, M.D., 2006b. Verification of ideal semi-logarithmic, lognormal or fractal crystal size distributions from 2D datasets. Journal of Volcanology and Geothermal Research, 154(1-2): 8-16.
Higgins, M.D., 2009. The Cascadia megathrust earthquake of 1700 may have rejuvenated an isolated basalt volcano in western Canada: Age and petrographic evidence. Journal of Volcanology and Geothermal Research, 179(1-2): 149-156.
Hort, M., Marsh, B.D., Resmini, R.G. and Smith, M.K., 1999. Convection and crystallization in a liquid cooled from above: an experimental and theoretical study. Journal of Petrology, 40(8): 1271-1300.
223
Hoshide, T., Obata, M. and Akatsuka, T., 2006. Crystal settling and crystal growth of olivine in magmatic differentiation - the Murotomisaki Gabbroic Complex, Shikoku, Japan. Journal of Mineralogical and Petrological Sciences, 101(5): 223-239.
Jarvis, R.A. and Woods, A.W., 1994. The nucleation, growth and settling of crystals from a turbulently convecting fluid. Journal of Fluid Mechanics, 273: 83-107.
Jaupart, C. and Tait, S., 1995. Dynamics of Differentiation in Magma Reservoirs. Journal of Geophysical Research-Solid Earth, 100(B9): 17615-17636.
Jellinek, A.M. and Kerr, R.C., 2001. Magma dynamics, crystallization, and chemical differentiation of the 1959 Kilauea Iki lava lake, Hawaii, revisited. Journal of Volcanology and Geothermal Research, 110(3-4): 235-263.
Jerram, D.A. and Martin, V.M., 2008. Understanding crystal populations and their significance through the magma plumbing system. In: C. Annen and G.F. Zellmer (Editors), Dynamics of Crustal Magma Transfer, Storage and Differentiation. Geological Society, Special Publications 304, London, UK, pp. 133-148.
Jurewicz, A.J.G. and Watson, E.B., 1988. Cations in olivine .1. Calcium partitioning and calcium-magnesium distribution between olivines and coexisting melts, with petrologic applications. Contributions to Mineralogy and Petrology, 99(2): 176-185.
Kamenetsky, V.S., Elburg, M., Arculus, R. and Thomas, R., 2006. Magmatic origin of low-Ca olivine in subduction-related magmas: Co-existence of contrasting magmas. Chemical Geology, 233(3-4): 346-357.
Leeman, W.P. and Scheidegger, K.F., 1977. Olivine-liquid distribution coefficients and a test for crystal-liquid equilibrium. Earth and Planetary Science Letters, 35(2): 247-257.
Macdonald, G.A. and Katsura, T., 1961. Variations in the lava of the 1959 eruption in Kilauea Iki. Pacific Science, 15: 358-369.
Mangan, M.T., 1990. Crystal Size Distribution Systematics and the Determination of Magma Storage Times - The 1959 Eruption of Kilauea Volcano, Hawaii. Journal of Volcanology and Geothermal Research, 44(3-4): 295-302.
Mangan, M.T. and Helz, R.T., 1985. Vesicle and phenocryst distribution in Kilauea Iki lava lake, Hawaii [abs.]. EOS, American Geophysical Union Transactions, 66(46): 1133.
Mangan, M.T. and Helz, R.T., 1986. The distribution of vesicles and olivine phenocrysts in samples from drill hole KI 79-3, Kilauea Iki lava lake, Hawaii. U.S. Geological Survey Open-File Report 86-424: 43 p.
Marsh, B.D., 1988a. Crystal Capture, Sorting, and Retention in Convecting Magma. Geological Society of America Bulletin, 100(11): 1720-1737.
224
Marsh, B.D., 1988b. Crystal Size Distribution (Csd) in Rocks and the Kinetics and Dynamics of Crystallization .1. Theory. Contributions to Mineralogy and Petrology, 99(3): 277-291.
Marsh, B.D., 1989. Magma Chambers. Annual Review of Earth and Planetary Sciences, 17: 437-474.
Marsh, B.D., 1996. Solidification fronts and magmatic evolution. Mineralogical Magazine, 60(398): 5-40.
Marsh, B.D., 1998. On the interpretation of crystal size distributions in magmatic systems. Journal of Petrology, 39(4): 553-599.
Marsh, B.D., 2007. Crystallization of silicate magmas deciphered using crystal size distributions. Journal of the American Ceramic Society, 90(3): 746-757.
Martin, D. and Nokes, R., 1988. Crystal Settling in a Vigorously Convecting Magma Chamber. Nature, 332(6164): 534-536.
Martin, D. and Nokes, R., 1989. A Fluid-Dynamic Study of Crystal Settling in Convecting Magmas. Journal of Petrology, 30(6): 1471-1500.
Moore, J.G. and Evans, B.W., 1967. The role of olivine in the crystallization of the prehistoric Makaopuhi tholeiitic lava lake, Hawaii. Contributions to Mineralogy and Petrology, 15: 202-223.
Morgan, D.J. and Jerram, D.A., 2006. On estimating crystal shape for crystal size distribution analysis. Journal of Volcanology and Geothermal Research, 154(1-2): 1-7.
Murata, K.J. and Richter, D.H., 1966a. Chemistry of the lavas of the 1959-60 eruption of Kilauea Volcano, Hawaii. U.S. Geological Survey Professional Paper, 537-A: A1-A26.
Murata, K.J. and Richter, D.H., 1966b. Settling of olivine in Kilauean magma as shown by lavas of 1959 eruption. American Journal of Science, 264(3): 194-203.
Nicholls, J. and Russell, J.K., 1991. Major-element chemical-discrimination of magma-batches in lavas from Kilauea Volcano, Hawaii, 1954 - 1971 eruptions. Canadian Mineralogist, 29: 981-993.
Nicolas, A. and Poirier, J.P., 1976. Crystalline plasticity and solid state flow in metamorphic rocks. John Wiley & Sons, London, UK, 444 pp.
Norman, M.D. and Garcia, M.O., 1999. Primitive magmas and source characteristics of the Hawaiian plume: petrology and geochemistry of shield picrites. Earth and Planetary Science Letters, 168(1-2): 27-44.
225
O'Driscoll, B., Donaldson, C.H., Troll, V.R., Jerram, D.A. and Emeleus, C.H., 2007. An origin for harrisitic and granular olivine in the Rum Layered Suite, NW Scotland: a crystal size distribution study. Journal of Petrology, 48(2): 253-270.
Okubo, P.G., Benz, H.M. and Chouet, B.A., 1997. Imaging the crustal magma sources beneath Mauna Loa and Kilauea volcanoes, Hawaii. Geology, 25(10): 867-870.
Peltier, A., Bachèlery, P. and Staudacher, T., 2009. Magma transport and storage at Piton de La Fournaise (La Réunion) between 1972 and 2007: A review of geophysical and geochemical data. Journal of Volcanology and Geothermal Research, 184(1-2): 93-108.
Richter, D.H. and Eaton, J.P., 1960. The 1959-60 eruption of Kilauea Volcano. New Scientist, 7: 994-997.
Richter, D.H., Eaton, J.P., Murata, K.J., Ault, W.U. and Krivoy, H.L., 1970. Chronological narrative of the 1959-60 eruption of Kilauea Volcano, Hawaii. U.S. Geological Survey Professional Paper, 537-E: E1-E73.
Richter, D.H. and Moore, J.G., 1966. Petrology of the Kilauea Iki lava lake, Hawaii. U.S. Geological Survey, Professional Paper, 537-B: B1-B26.
Richter, D.H. and Murata, K.J., 1966. Petrography of the lavas of the 1959-60 eruption of Kilauea Volcano, Hawaii. U.S. Geological Survey Professional Paper, 537-D: D1-D12.
Rudman, M., 1992. Two-phase natural convection: implications for crystal settling in magma chambers. Physics of The Earth and Planetary Interiors, 72(3-4): 153-172.
Rupke, L.H. and Hort, M., 2004. The impact of side wall cooling on the thermal history of lava lakes. Journal of Volcanology and Geothermal Research, 131(1-2): 165-178.
Sakyi, P.A., Tanaka, R. and Nakamura, E., 2008. Dislocation microstructures in naturally deformed olivine crystals from Hawaiian lavas. Geochimica Et Cosmochimica Acta, 72(12): A819-A819 (abstr.).
Schwindinger, K.R., 1999. Particle dynamics and aggregation of crystals in a magma chamber with application to Kilauea Iki olivines. Journal of Volcanology and Geothermal Research, 88(4): 209-238.
Schwindinger, K.R. and Anderson, A.T., 1989. Synneusis of Kilauea Iki Olivines. Contributions to Mineralogy and Petrology, 103(2): 187-198.
Scowen, P.A.H., Roeder, P.L. and Helz, R.T., 1991. Reequilibration of chromite within Kilauea Iki lava lake, Hawaii. Contributions to Mineralogy and Petrology, 107(1): 8-20.
226
Shaw, H.R., Wright, T.L., Peck, D.L. and Okamura, R., 1968. The viscosity of basaltic magma: an analysis of field measurements in Makaopuhi lava lake, Hawaii. American Journal of Science, 266: 225-264.
Simakin, A.G. and Bindeman, I.N., 2008. Evolution of crystal sizes in the series of dissolution and precipitation events in open magma systems. Journal of Volcanology and Geothermal Research, 177(4): 997-1010.
Simkin, T. and Smith, J.V., 1970. Minor-element distribution in olivine. Journal of Geology, 78(3): 304-325.
Sparks, R.S., Huppert, H.E., Koyaguchi, T. and Hallworth, M.A., 1993. Origin of modal and rythmic igneous layering by sedimentation in a convecting magma chamber. Nature, 361(6409): 246-249.
Stormer, J.C., 1973. Calcium zoning in olivine and its relationship to silica activity and pressure. Geochimica Et Cosmochimica Acta, 37(8): 1815-1821.
Swanson, D.A., Duffield, W.A., Jackson, D.B. and Peterson, D.W., 1979. Chronological narrative of the 1969-71 Mauna Ulu eruption of Kilauea Volcano, Hawaii. U. S. Geological Survey, Professional Paper, 1056: 55 p.
Thompson, R.N. and Gibson, S.A., 2000. Transient high temperatures in mantle plume heads inferred from magnesian olivines in Phanerozoic picrites. Nature, 407(6803): 502-506.
Vinet, N. and Higgins, M.D., 2010. Magma solidification processes beneath Kilauea Volcano, Hawaii: A quantitative textural and geochemical study of the 1969-1974 Mauna Ulu lavas. Journal of Petrology, 51(6): 1297-1332.
Voorhees, P.W., 1992. Ostwald ripening of 2-phase mixtures. Annual Review of Materials Science, 22: 197-215.
Weinstein, S.A., Yuen, D.A. and Olson, P.L., 1988. Evolution of crystal-settling in magma-chamber convection. Earth and Planetary Science Letters, 87(1-2): 237-248.
Wilkinson, J.F.G. and Hensel, H.D., 1988. The petrology of some picrites from Mauna Loa and Kilauea volcanoes, Hawaii. Contributions to Mineralogy and Petrology, 98(3): 326-345.
Witham, F. and Llewellin, E.W., 2006. Stability of lava lakes. Journal of Volcanology and Geothermal Research, 158(3-4): 321-332.
Worster, M.G., Huppert, H.E. and Sparks, R.S.J., 1993. The Crystallization of Lava Lakes. Journal of Geophysical Research-Solid Earth, 98(B9): 15891-15901.
Wright, T.L., 1973. Magma mixing as illustrated by 1959 eruption, Kilauea Volcano, Hawaii. Geological Society of America Bulletin, 84(3): 849-858.
227
Wright, T.L. and Fiske, R.S., 1971. Origin of differentiated and hybrid lavas of Kilauea Volcano, Hawaii. Journal of Petrology, 12(1): 1-65.
Wright, T.L. and Klein, F.W., 2006. Deep magma transport at Kilauea volcano, Hawaii. Lithos, 87(1-2): 50-79.
Wright, T.L. and Okamura, R.T., 1977. Cooling and crystallization of tholeiitic basalt, 1965 Makaopuhi lava lake, Hawaii. U.S. Geological Survey, Professional Paper, 1004: 78 p.
Wyss, M., Klein, F., Nagamine, K. and Wiemer, S., 2001. Anomalously high b-values in the South Flank of Kilauea volcano, Hawaii: evidence for the distribution of magma below Kilauea's East rift zone. Journal of Volcanology and Geothermal Research, 106(1-2): 23-37.
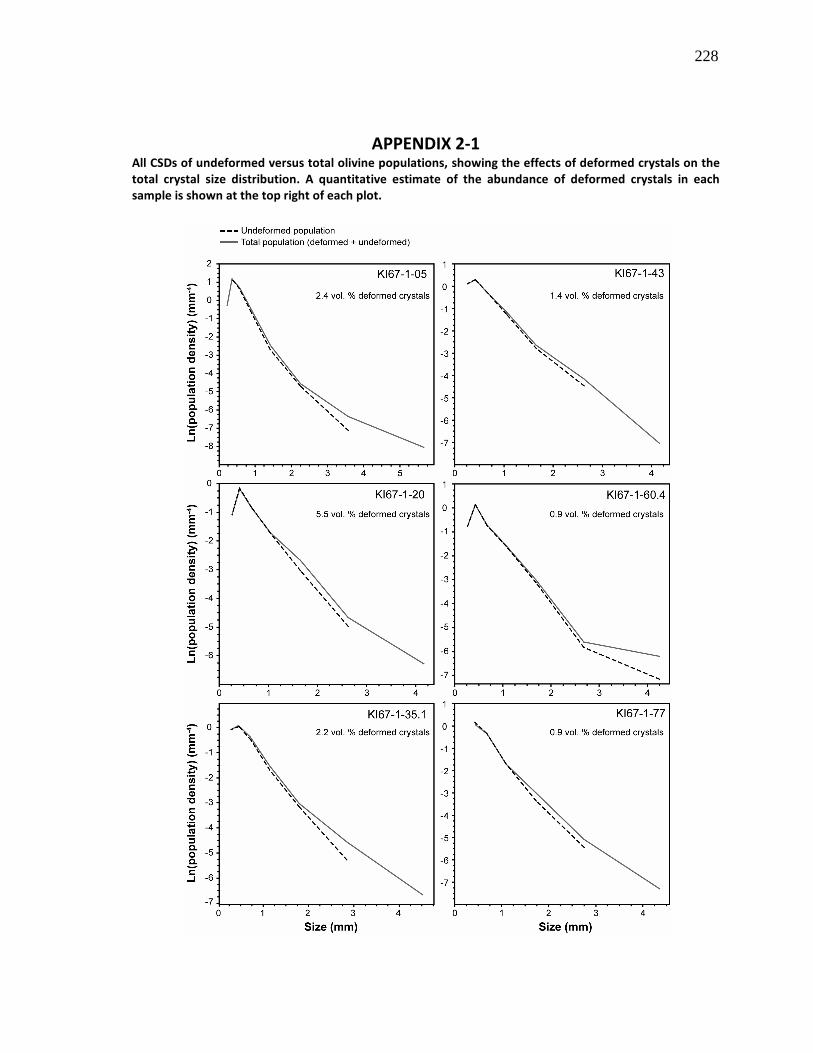
228
APPENDIX 2-1
All CSDs of undeformed versus total olivine populations, showing the effects of deformed crystals on the
total crystal size distribution. A quantitative estimate of the abundance of deformed crystals in each
sample is shown at the top right of each plot.
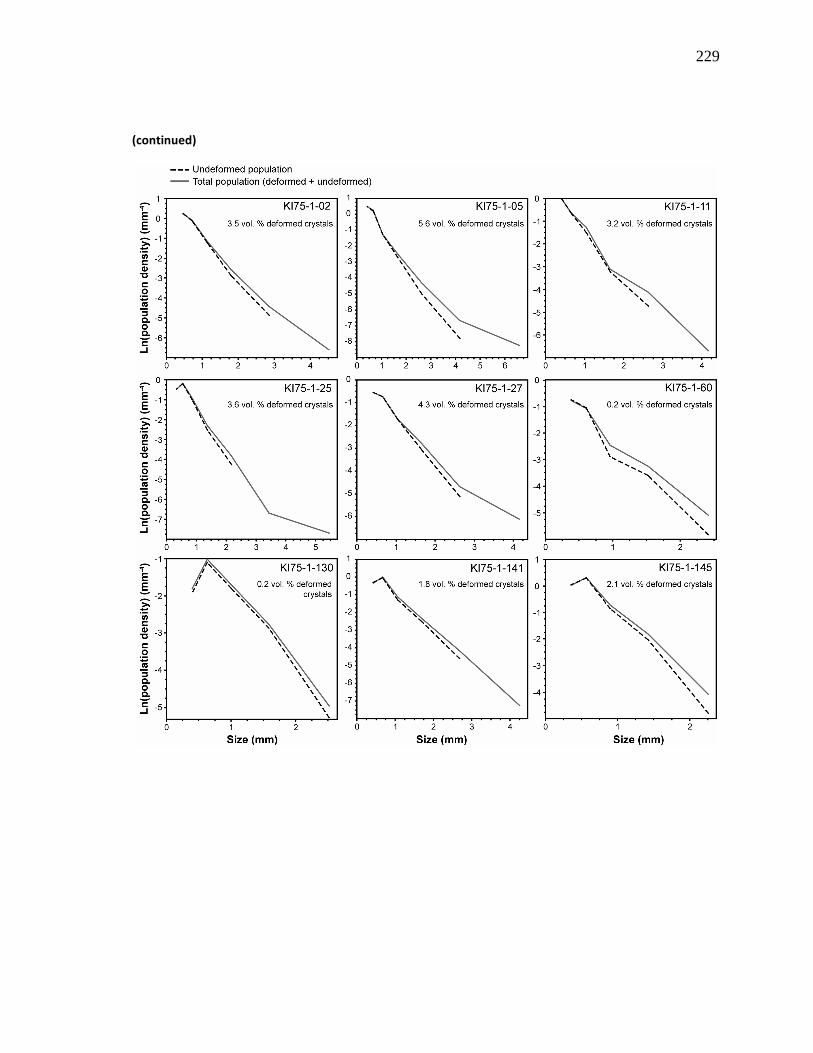
229
(continued)
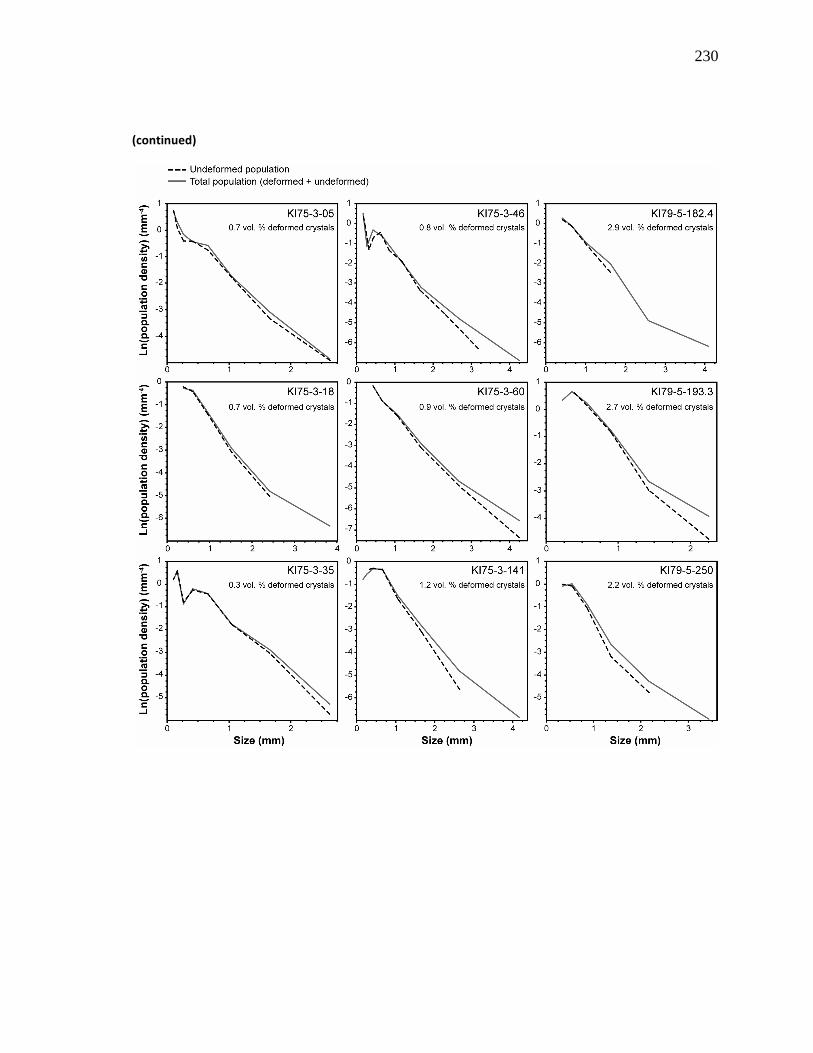
230
(continued)
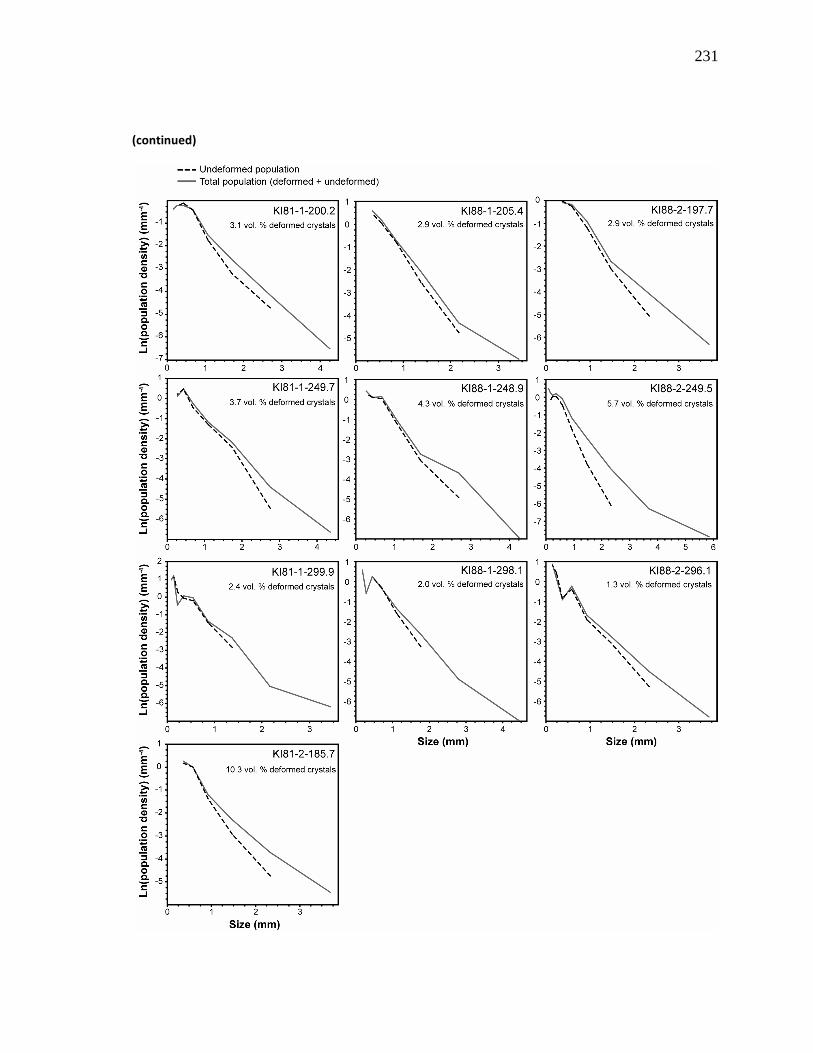
231
(continued)
232
AVANT-PROPOS AU CHAPITRE 3
CONTRIBUTION DES AUTEURS
Le Chapitre 3 est le résultat d’une collaboration avec Dr. Roberta Flemming, responsable
du Laboratoire de Microanalyse par Rayons X, The University of Western Ontario, London, Canada.
L’UQAC n’avait pas l’appareillage nécessaire à l’analyse par diffraction des rayons X de mes
cristaux d’olivine. J’ai ainsi pu recueillir les données indispensables à la rédaction de l’article qui
constitue ce troisième chapitre de thèse. Dr. Flemming m’a aidé à correctement utiliser
l’appareillage et les divers logiciels de traitement de données ; elle a par ailleurs rédigé la partie
« Methods » de l’article.
233
CHAPITRE 3
CRYSTAL STRUCTURE, MOSAICITY AND STRAIN ANALYSIS OF HAWAIIAN
OLIVINES USING IN SITU MICRO X-RAY DIFFRACTION (µXRD)
NICOLAS VINET1, ROBERTA L. FLEMMING2 & MICHAEL D. HIGGINS1
1 SCIENCES DE LA TERRE, UNIVERSITÉ DU QUÉBEC À CHICOUTIMI, CHICOUTIMI, G7H 2B1 CANADA
2 DEPARTMENT OF EARTH SCIENCES, THE UNIVERSITY OF WESTERN ONTARIO, LONDON, ON,
N6A 5B7 CANADA
American Mineralogist In revision

234
3.1 ABSTRACT
Deformation of olivine in a volcanic context is poorly constrained, although deformed olivine
is abundant in some volcanic rocks, and its presence is important for the definition of the
magmatic history of volcanic edifices such as Kilauea Volcano, Hawaii. Deformed olivines at
Kilauea originate in the lower crust, therefore, the classic approaches and interpretations applied
to mantle-derived olivine are not applicable here. In this paper we present data on deformed
olivine crystals from Kilauea lava samples using an in-situ µXRD technique. Our results allow the
validation, and refinement, of optical observations of olivine deformation. We also confirm the
presence of deformation for every olivine crystal size, and quantify it. There are significant
correlations between deformation intensity (strain-related mosaicity) and the olivine composition
and crystal size. Although this technique does not allow the simple estimation of the P-T
conditions of deformation and crystal formation or magmatic history, some constraints have been
provided here, in particular the estimation of a threshold over which deformation undoubtedly
occurred. Micro XRD is shown here to be an easy-to-use, fast, low-cost, non-destructive and less-
ambiguous technique to determine the presence of strain in the crystal structure of magmatic
olivines, and quantify it, even for very small crystals.
Keywords: olivine, deformation, crystal strain, microstructure, mosaicity, µXRD, Hawaii, Kilauea,
Mauna Ulu, Kilauea Iki
235
3.2 INTRODUCTION
In Earth Sciences, the mechanisms responsible for the deformation of a rock, and hence
associated plastic deformation of its constitutive minerals, have been debated for decades. Most
emphasis has been given on plastic deformation of mantle-forming silicates, with predominance of
olivine and pyroxenes. The main reason for this is that the understanding of plastic flow in the
mantle is important in the creation and refining of models explaining the geodynamic processes
and geophysical or rheological properties of the mantle, in particular the upper mantle (e.g.
Mercier, 1985). Rock deformation is influenced by a number of intrinsic and extrinsic factors
(Hobbs, 1985). Some control the migration rate of dislocations, whereas others control the shape,
orientation and distribution of grains, and thus leave an imprint on the microfabric. Temperature
is one of the most important factors influencing the deformation. Many studies have also been
carried out on the dislocation mechanisms themselves. For example, olivine deforms by
dislocation creep in the shallow mantle (Raterron et al., 2009). Constitutive equations have been
proposed to describe dislocation mechanisms in single olivine crystals, taking into account a wide
range of thermodynamic, thermomechanical and microstructural conditions based on
compressional creep experiments at various pressures and temperatures (Bai and Kohlstedt, 1992;
Bai et al., 1991; Demouchy et al., 2009; Durham and Goetze, 1977; Evans and Goetze, 1979;
Kohlsted and Goetze, 1974; Li et al., 2004; Raterron et al., 2004).
In contrast, deformation of olivine now found in a volcanic context has remained poorly
constrained, although deformed olivine is abundant in some volcanic rocks, and its presence is
important for the definition of the magmatic history of such volcanic edifices (e.g. Kilauea Volcano,
Hawaii; Piton de la Fournaise Volcano, La Réunion Island). In such a volcanic context, volcano-
236
related microfabrics are rare. There is no direct relation, or even no relation at all with mantle flow
issues, and thus no need to get lattice-preferred orientation data, for example, for magmatic
olivines. Therefore, classic approaches, techniques and interpretations applied to mantle-related
issues are not applicable, and few data are available.
In this paper we investigate the deformation of olivine crystals from Kilauea Iki and Mauna
Ulu lava samples, using an innovative, in-situ µXRD technique which measures streak length along
the Debye ring (chi angle) in two-dimensional X-ray images (Flemming, 2007). Since it is a recently
developed technique, there are very few quantitative data available for comparison with our data.
Previous studies have examined quartz (Flemming, 2007), zircon (Moser et al., 2009),
orthopyroxene (Izawa et al., 2009; Izawa et al., in review), and diamonds (Smith et al., 2010), but
none have examined olivine. Consequently, our aim is to quantify deformation using such
parameters as the full width at half maximum (FWHM) of peak intensity along the Debye rings.
The focus is also given to the validation of this simple µXRD approach that allows: (1) the clear
recognition of the presence of significant strain in olivine single crystals, even for very small grains;
and, (2) the quantification of the strain-related mosaicity for many different crystallographic
planes. This approach is intended to be easy to apply for a large range of olivine-bearing rock
samples. In turn, reference values, in particular FWHM data, recovered on olivines with well
known origin would be available for the scientific community.
237
3.3 MATERIALS AND METHODS
3.3.1 Materials
All olivines are from 1969-1974 Mauna Ulu (MU) lava samples and 1959 Kilauea Iki (KI)
eruption products. Polished thin sections were examined so that olivine crystals for analysis by
µXRD. All the samples were previously studied using both quantitative textural and geochemical
methods (Vinet and Higgins, 2010; Vinet and Higgins, in revision). These previous studies indicated
the presence of multiple olivine populations that underwent different solidification histories,
including a deformed component that is thought to originate from a cumulate body at the base of
the spreading volcano. A range of both optically deformed (that is, crystals with optical evidence
for deformation) and undeformed olivine crystals of varying sizes and shapes were chosen for
study. The optical deformation features observed in olivine are kink-bands, undulose extinction
and rectangular subgrains. We also included some olivines for which the deformed or undeformed
character is ambiguous.
3.3.2 Micro XRD methods
X-ray diffraction data were collected using a Bruker D8 Discover micro X-ray diffractometer
at the University of Western Ontario. The diffractometer was operated using Cu-Kα radiation
generated at 40 kV and 40 mA. The instrument was equipped with a Gobel mirror parallel optics
system and pinhole collimation to produce a nominal beam diameter of 500 μm. Uncoated
polished thin sections were mounted on an XYZ stage, and precise sample positioning was
accomplished using an optical microscope monitor and laser system (reproducible to within 12.5
238
μm). Diffracted X-rays were detected using a Hi-Star Detector and General Area Detector
Diffraction System (GADDS) software. The two-dimensional detector was positioned at a distance
of ~15 cm from the sample and intersected a 35o segment of diffraction space. The θ-θ geometry
of the diffractometer enabled the sample to remain horizontal and stationary, while the source
and the detector moved independently. The angle between the sample and the source is θ1 while
the angle between the sample and the detector is θ2, where θ1 + θ2 = 2θ, as measured at the
centre of the detector.
Samples were analyzed in omega scan mode, where the X-ray optics (source = θ1; detector =
θ2) were rotated through an omega angle ω, at fixed 2θ. At the start of the omega scan, the source
and detector were positioned at θ1 = x° and θ2 = y°, respectively, such that the starting 2θ = θ1 + θ2
= x + y. Both source and detector were rotated clockwise, by an omega angle of ω, stopping at θ1 =
x + ω and θ2 = y - ω, such that the final 2θ = θ1 + θ2 = x + ω + y - ω = x + y. At all points during
omega rotation, 2θ remained constant, where θ1 + θ2 = 2θ = x + y. Because 2θ has remained
constant from the frame of reference of the detector it appears that the sample has rotated by -ω.
This enabled a greater number of lattice planes in a single crystal to satisfy the Bragg’s Law
diffraction condition. Omega Scan conditions were as follows: Frame 1: θ1=15°, θ2=18.5°, ω=8°,
time=20 minutes; Frame 2: θ1=18°, θ2=45°, ω=30°, time=60 minutes.
Two-dimensional GADDS images yield information in both the 2θ and chi (χ) dimensions.
When using two-dimensional detection methods, polycrystalline samples give powder rings, or
Debye rings, indicative of crystallites having all orientations simultaneously, whereas single
crystals give diffraction spots, indicative of a single orientation. Each diffraction spot having lattice
plane {hkl} lies along an arc of radius 2θhkl. Strained crystals exhibit strain-related mosaicity, visible
239
as elongation or streaking along the Debye ring, as measured by chi angle, χ. For each GADDS
image, peak intensity was integrated in two different ways. First, intensity was integrated along chi
(i.e. integrated along each Debye ring) and plotted as a function of 2θ, to create a one-dimensional
plot of intensity versus 2θ, reminiscent of a conventional powder diffraction pattern. Such a plot is
shown in Figure 1d. These plots are used to assign the Miller index to the observed olivine
diffraction lines, using olivines in the International Centre for Diffraction Data (ICDD) database.
(e.g. olivine was indexed using card # 79-1192). This is typically the only method of integration
performed on two-dimensional data, as it is necessary for phase identification. Additionally, we
performed an integration of narrow regions of 2θ as a function of chi angle. Such integration is
shown in Figure 1e. This enabled examination of the peak shape along the Debye ring as well as
quantitative analysis of peak width along the Debye ring.
3.4 RESULTS AND DISCUSSION
Microstructure and strain information for single olivine crystals can be obtained on 2-D
GADDS images and on the resulting µXRD patterns (Fig. 1). A single homogeneous grain analysed
by µXRD will have a single diffracted X-ray for each hkl plane, producing a single spot on the
GADDS detector (Flemming, 2007). In contrast, an inhomogeneously strained grain will produce
“streaking” or asterism of the diffraction spots in the GADDS image (Fig. 1c) (Flemming, 2007).
These fundamental characteristics are well observed for the olivine grains studied here, with
variability in the brightness of the diffraction spot and length of the streak.
An objective of this study is to validate both the optical petrographic observations of olivine
deformation and the µXRD technique recently developed for in-situ analysis purposes (Flemming,
240
2007; Izawa et al., 2009; Izawa et al., in review; Moser et al., 2009; Smith et al., 2010). A
comparison between the petrographic and XRD evidence of deformation for each crystal is
presented in Table 1. Overall, most optical observations of deformation in olivine crystals (Vinet
and Higgins, 2010; Vinet and Higgins, in revision) were validated or refined using µXRD. With two
exceptions, all the optically deformed crystals of any size also show, as expected, streaked
diffraction patterns that are attributed to strain. Also, with the exceptions of three grains, all
optically undeformed crystals of any size exhibit single diffraction spots in the GADDS images,
which are attributed to the absence of strain. The three exceptions are grains with streaked
diffraction patterns. Hence, the µXRD technique has highlighted the presence of strain in these
grains whereas it was not seen optically. Rare deformed or undeformed grains have diffraction
spots that are difficult to interpret. Therefore, for these grains we were unable to clearly
determine whether there is presence of strain. Finally, for most optically ambiguous grains (with
respect to their deformation nature), we have been able to determine if they were deformed or
undeformed using µXRD.
Olivine deformation was quantified using the full width at half maximum (FWHM) of the line
shape along the direction of Debye ring (chi angle χ). It is a useful parameter of quantification as it
represents a simple way of estimating the quantity of strain-related mosaicity recorded in a single
crystal, and hence the deformation intensity. Intensity of the diffracted rays was integrated along
the Debye rings to produce plots of intensity vs. χ (Fig. 1e). In such plots, the FWHM values of
several plane reflections were determined for 52 single olivine crystals from two Mauna Ulu and
five Kilauea Iki lava samples. Deformed crystals cover the whole range of FWHM values (Table 2;
Fig. 2), 0.3-3.3°, with most analyses ranging from 0.3 to 1.8°. In contrast, undeformed crystals are
constrained to FWHM < 1.0°, with a peak around 0.5° (Fig. 2). It is demonstrated in this study that
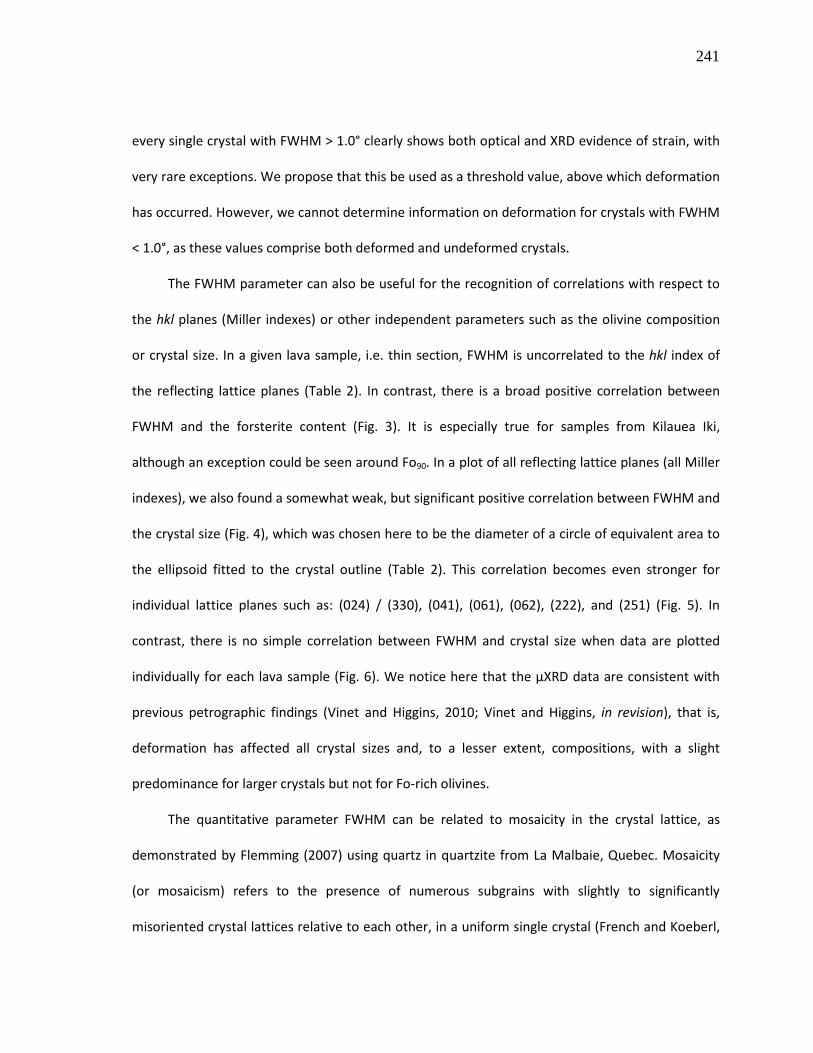
241
every single crystal with FWHM > 1.0° clearly shows both optical and XRD evidence of strain, with
very rare exceptions. We propose that this be used as a threshold value, above which deformation
has occurred. However, we cannot determine information on deformation for crystals with FWHM
< 1.0°, as these values comprise both deformed and undeformed crystals.
The FWHM parameter can also be useful for the recognition of correlations with respect to
the hkl planes (Miller indexes) or other independent parameters such as the olivine composition
or crystal size. In a given lava sample, i.e. thin section, FWHM is uncorrelated to the hkl index of
the reflecting lattice planes (Table 2). In contrast, there is a broad positive correlation between
FWHM and the forsterite content (Fig. 3). It is especially true for samples from Kilauea Iki,
although an exception could be seen around Fo90. In a plot of all reflecting lattice planes (all Miller
indexes), we also found a somewhat weak, but significant positive correlation between FWHM and
the crystal size (Fig. 4), which was chosen here to be the diameter of a circle of equivalent area to
the ellipsoid fitted to the crystal outline (Table 2). This correlation becomes even stronger for
individual lattice planes such as: (024) / (330), (041), (061), (062), (222), and (251) (Fig. 5). In
contrast, there is no simple correlation between FWHM and crystal size when data are plotted
individually for each lava sample (Fig. 6). We notice here that the µXRD data are consistent with
previous petrographic findings (Vinet and Higgins, 2010; Vinet and Higgins, in revision), that is,
deformation has affected all crystal sizes and, to a lesser extent, compositions, with a slight
predominance for larger crystals but not for Fo-rich olivines.
The quantitative parameter FWHM can be related to mosaicity in the crystal lattice, as
demonstrated by Flemming (2007) using quartz in quartzite from La Malbaie, Quebec. Mosaicity
(or mosaicism) refers to the presence of numerous subgrains with slightly to significantly
misoriented crystal lattices relative to each other, in a uniform single crystal (French and Koeberl,
242
2010). It is seen in X-ray diffraction patterns as a broadening of the normally sharp diffraction
peaks of lattice planes (Hanss et al., 1978). Also, Flemming (2007) found a correlation between
inhomogeneous strain in minerals and “streaking” of the diffraction spots in the 2-D GADDS image.
As for her quartz grains, in our polished thin sections of Mauna Ulu and Kilauea Iki lavas, optically
unstrained grains of olivine (Fig. 7a) exhibited single diffraction spots in the corresponding GADDS
image (Fig. 7b). In contrast, the strained, or deformed, olivine grains optically exhibiting kink-
bands, undulose extinction or rectangular subgrains (Fig. 7c), show distorted diffraction spots, or
streaks, in the corresponding GADDS image (Fig. 7d). Streaked diffraction spots may be interpreted
to be caused by strain-related mosaicity or non-ideality of the crystal lattice that is imposed by
inhomogeneous strain (Flemming, 2007). As argued by Flemming, these observations are
consistent with streaking or asterism, as observed by Hörz and Quaide (1973) after shock
experiments on a variety of minerals, and recently treated in the meteorite impact review of
French and Koeberl (2010). Although these observations have been applied to minerals shocked by
a meteorite impact, they are clearly similar to what we have observed here for magmatic olivines,
and may help in our interpretations. Furthermore, for many of our strained olivines exhibiting
streaks (strain-related mosaicity) in the diffraction pattern, the GADDS image (Fig. 7d) reveals that
each streak is resolved into a row of diffraction spots. This was also observed in a quartz sample by
Flemming (2007). She measured the GADDS image and found a consistent angular separation of 2°
between spots. She clearly showed that GADDS images can be used for quantification of strain-
related textures. She also interpreted the angular separation between spots to be a small angle of
misorientation between subgrains, which may represent “edge dislocations climbing into
alignment to form planar arrays of dislocations”. This is also applicable to our deformed olivines

243
showing the same type of strain-related mosaicity, and is suggestive of power law creep (Langdon,
1985).
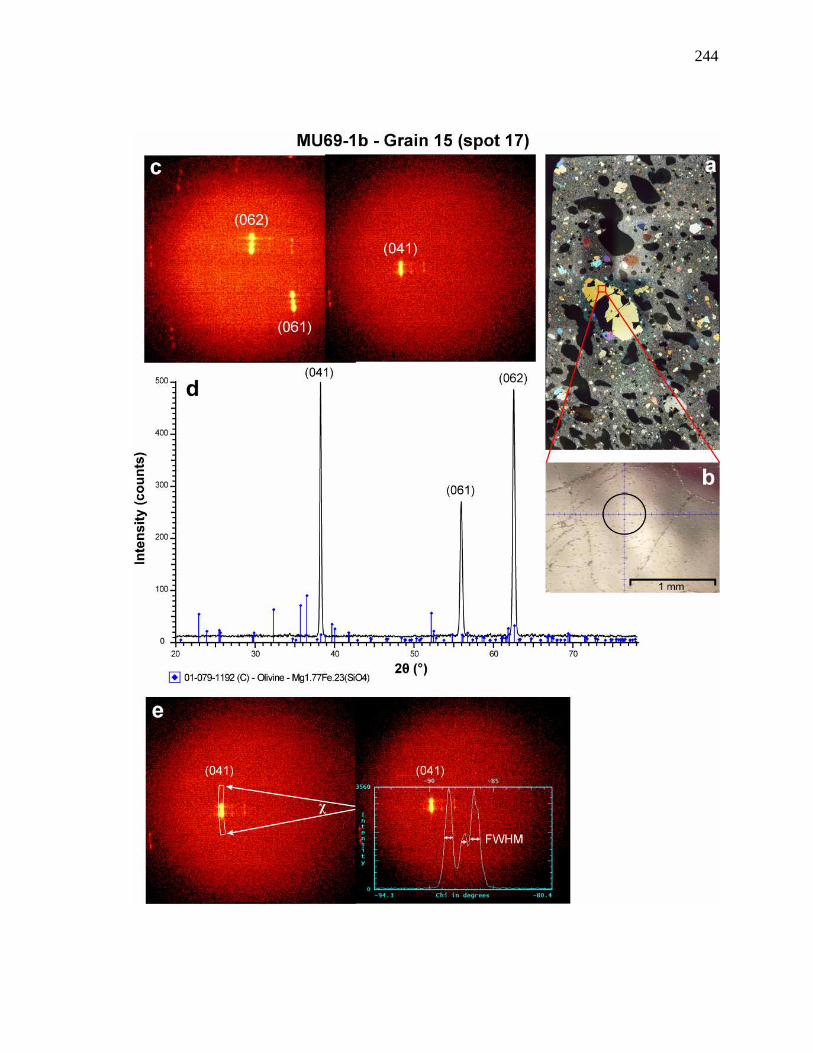
244
245
Figure 3-1. Micro X-ray diffraction data from MU69-1b-grain 15.
(a) Photomicrograph of the whole thin section under crossed polarized light. (b) Image of spot 17 as seen
under the optical microscope monitor at maximum magnification; black circle represents approximate
beam diameter using 500 µm beam. (c) GADDS images from spot 17 showing streaked diffraction
patterns, attributed to strain (omega scan, 2 frames, frame 1 (right) = 20 min, frame 2 (left) = 40 min, 500
μm beam). (d) Plot of intensity versus 2θ for spot 17 (after background subtraction) showing a good match
with an ideal olivine composition: Mg1.77Fe0.23(SiO4); hkl planes indicated on top of peaks. (e) GADDS
image from spot 17 (frame 1) showing integrated box along Debye ring (left), and plot of intensity vs. χ
(right), the angle subtended by the Debye ring; white arrows in right frame indicate full width at half
maximum (FWHM), the representative FWHM value being the sum of the three distances in this case
where there are subgrains.
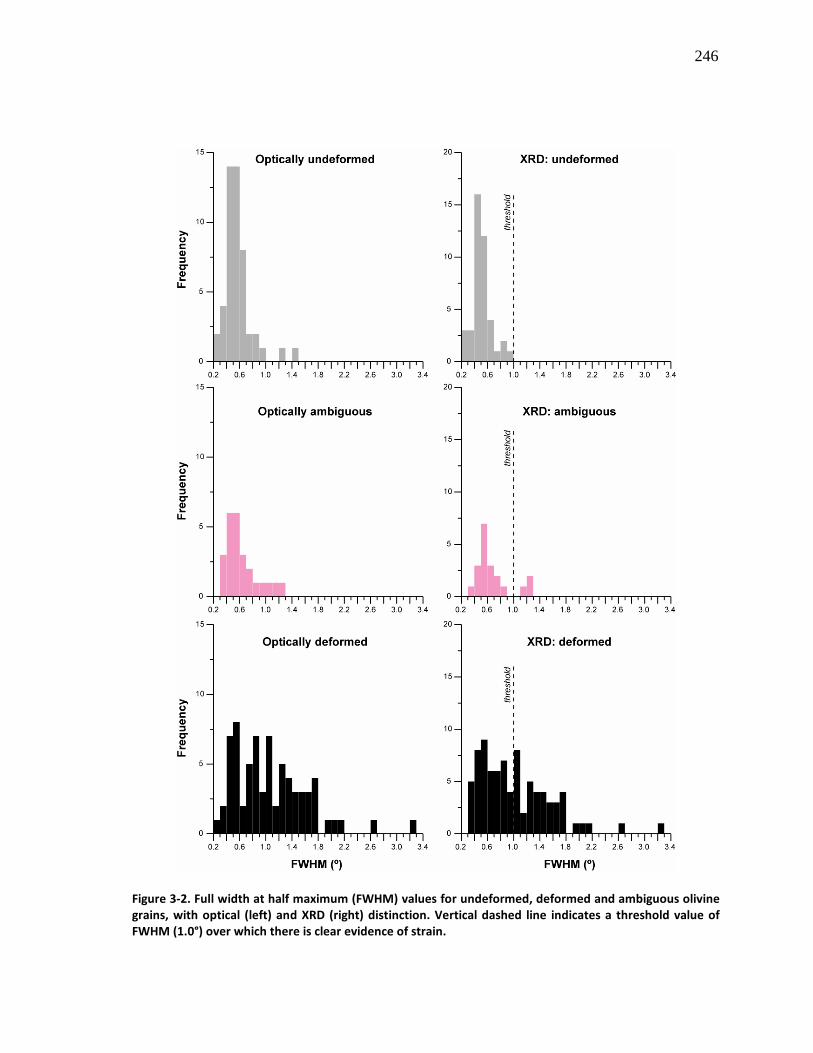
246
Figure 3-2. Full width at half maximum (FWHM) values for undeformed, deformed and ambiguous olivine
grains, with optical (left) and XRD (right) distinction. Vertical dashed line indicates a threshold value of
FWHM (1.0°) over which there is clear evidence of strain.
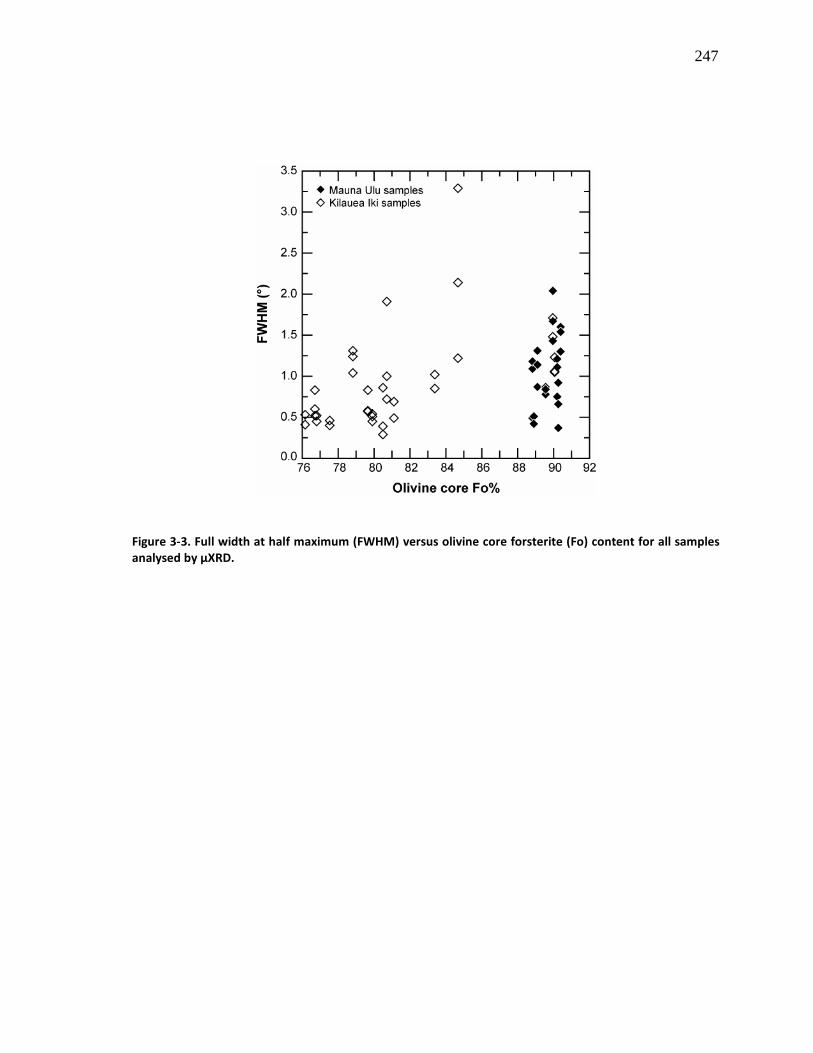
247
Figure 3-3. Full width at half maximum (FWHM) versus olivine core forsterite (Fo) content for all samples
analysed by µXRD.
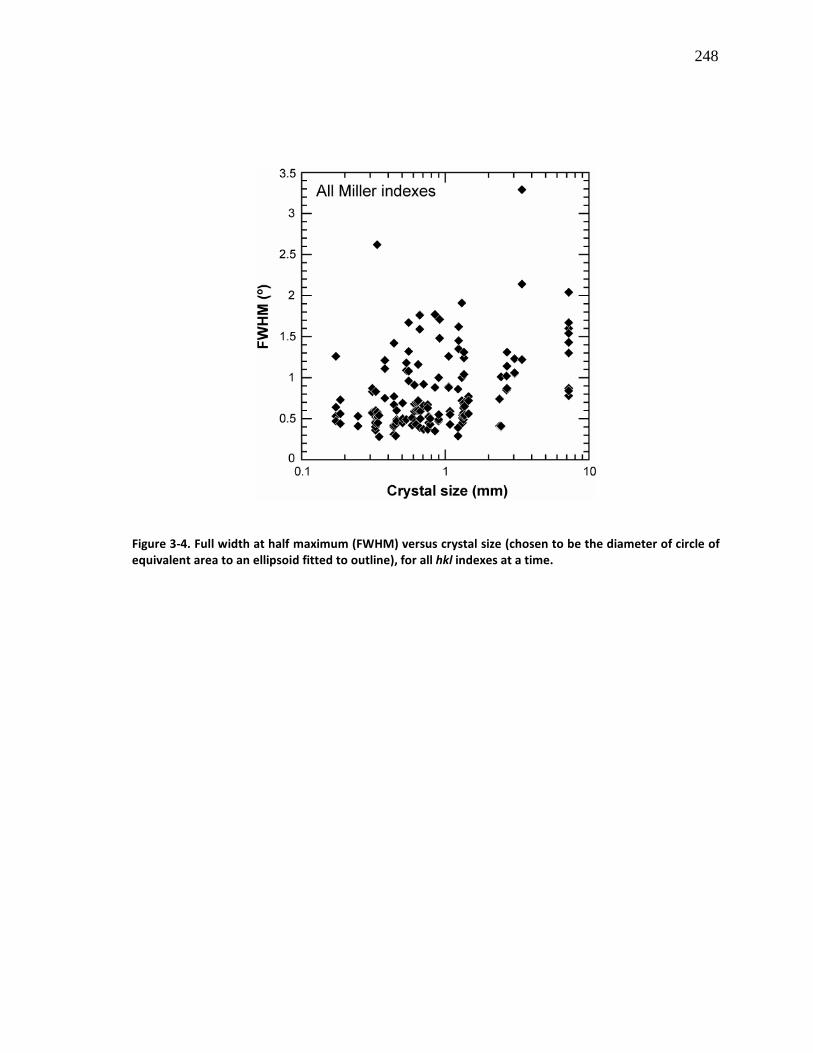
248
Figure 3-4. Full width at half maximum (FWHM) versus crystal size (chosen to be the diameter of circle of
equivalent area to an ellipsoid fitted to outline), for all hkl indexes at a time.
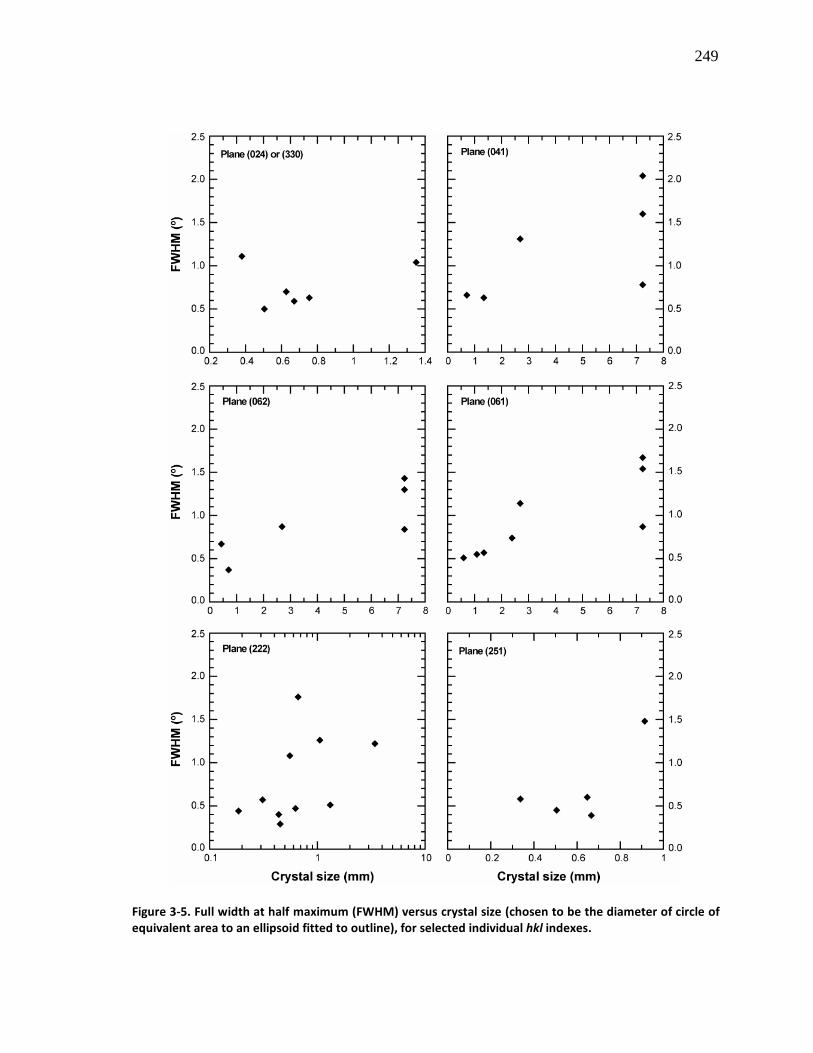
249
Figure 3-5. Full width at half maximum (FWHM) versus crystal size (chosen to be the diameter of circle of
equivalent area to an ellipsoid fitted to outline), for selected individual hkl indexes.
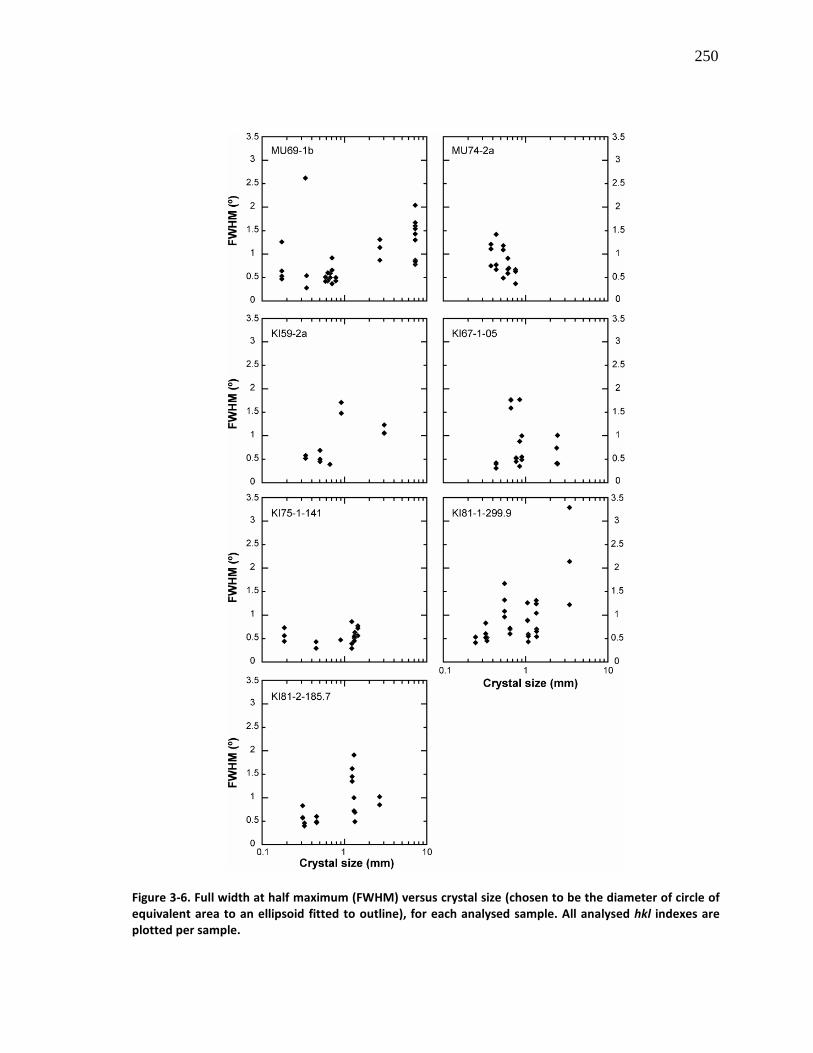
250
Figure 3-6. Full width at half maximum (FWHM) versus crystal size (chosen to be the diameter of circle of
equivalent area to an ellipsoid fitted to outline), for each analysed sample. All analysed hkl indexes are
plotted per sample.
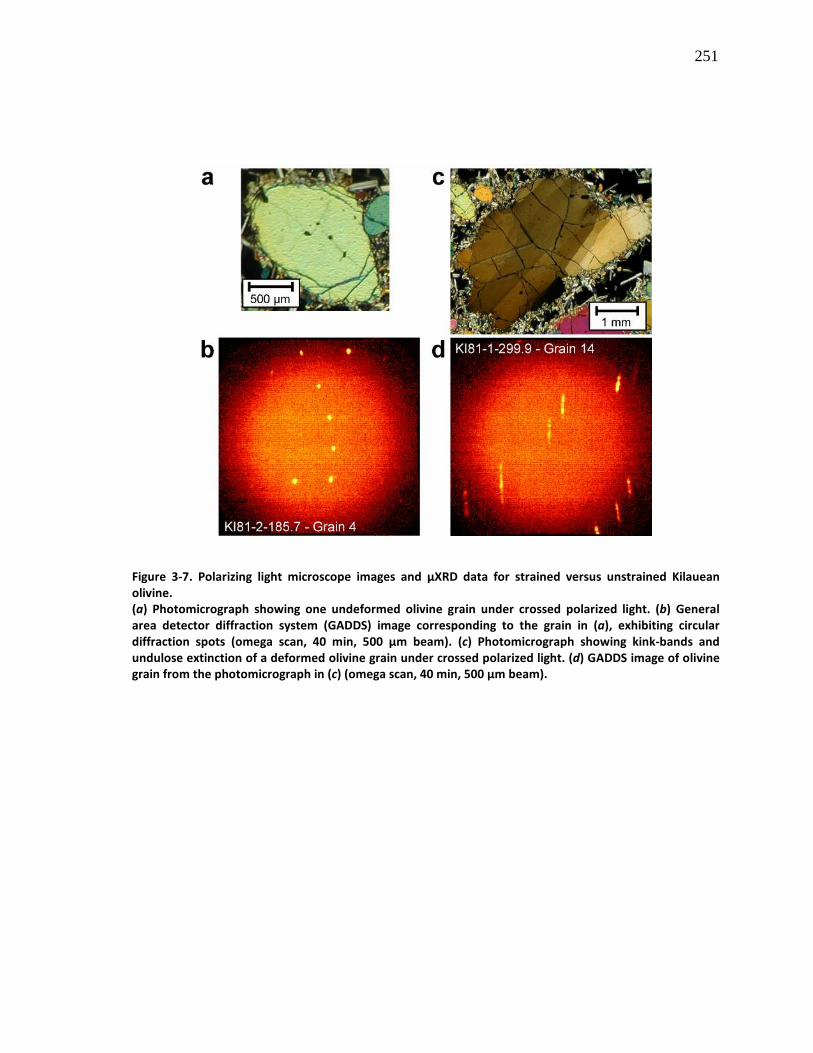
251
Figure 3-7. Polarizing light microscope images and μXRD data for strained versus unstrained Kilauean
olivine.
(a) Photomicrograph showing one undeformed olivine grain under crossed polarized light. (b) General
area detector diffraction system (GADDS) image corresponding to the grain in (a), exhibiting circular
diffraction spots (omega scan, 40 min, 500 μm beam). (c) Photomicrograph showing kink-bands and
undulose extinction of a deformed olivine grain under crossed polarized light. (d) GADDS image of olivine
grain from the photomicrograph in (c) (omega scan, 40 min, 500 μm beam).
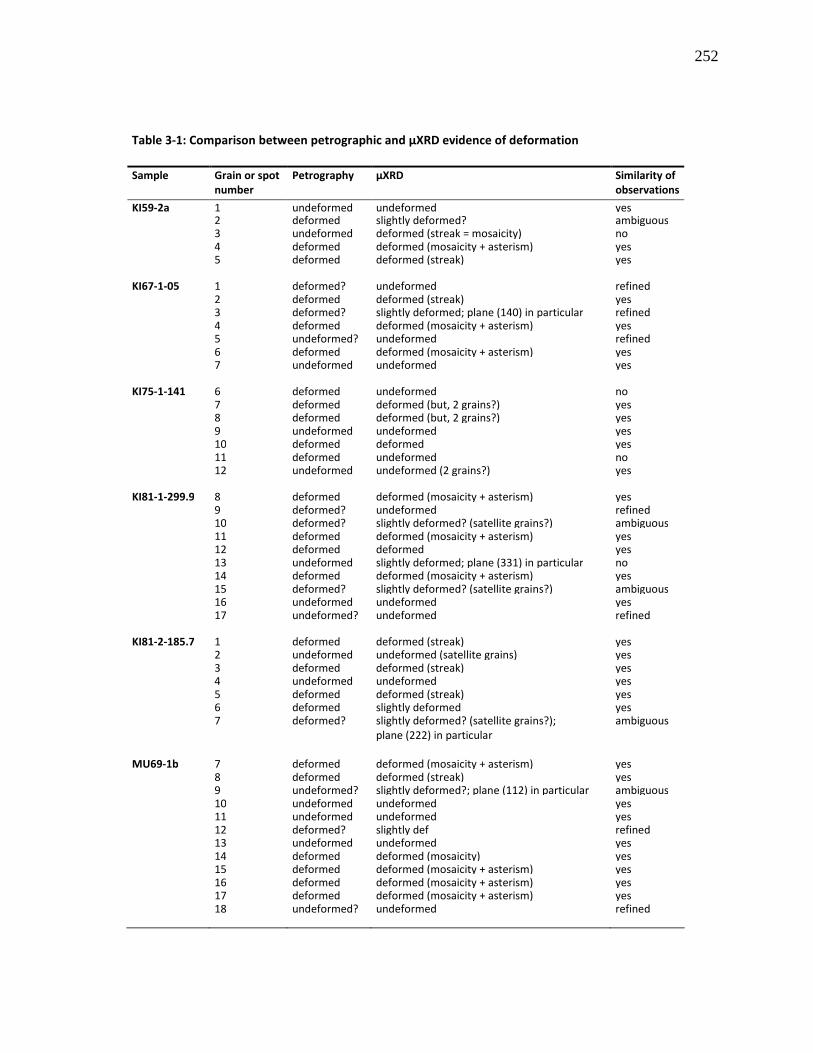
252
Table 3-1: Comparison between petrographic and µXRD evidence of deformation
Sample Grain or spot
number
Petrography µXRD Similarity of
observations
KI59-2a 1 undeformed undeformed yes 2 deformed slightly deformed? ambiguous 3 undeformed deformed (streak = mosaicity) no 4 deformed deformed (mosaicity + asterism) yes 5 deformed deformed (streak) yes KI67-1-05 1 deformed? undeformed refined 2 deformed deformed (streak) yes 3 deformed? slightly deformed; plane (140) in particular refined 4 deformed deformed (mosaicity + asterism) yes 5 undeformed? undeformed refined 6 deformed deformed (mosaicity + asterism) yes 7 undeformed undeformed yes KI75-1-141 6 deformed undeformed no 7 deformed deformed (but, 2 grains?) yes 8 deformed deformed (but, 2 grains?) yes 9 undeformed undeformed yes 10 deformed deformed yes 11 deformed undeformed no 12 undeformed undeformed (2 grains?) yes KI81-1-299.9 8 deformed deformed (mosaicity + asterism) yes 9 deformed? undeformed refined 10 deformed? slightly deformed? (satellite grains?) ambiguous 11 deformed deformed (mosaicity + asterism) yes 12 deformed deformed yes 13 undeformed slightly deformed; plane (331) in particular no 14 deformed deformed (mosaicity + asterism) yes 15 deformed? slightly deformed? (satellite grains?) ambiguous 16 undeformed undeformed yes 17 undeformed? undeformed refined KI81-2-185.7 1 deformed deformed (streak) yes 2 undeformed undeformed (satellite grains) yes 3 deformed deformed (streak) yes 4 undeformed undeformed yes 5 deformed deformed (streak) yes 6 deformed slightly deformed yes 7 deformed? slightly deformed? (satellite grains?);
plane (222) in particular ambiguous
MU69-1b 7 deformed deformed (mosaicity + asterism) yes 8 deformed deformed (streak) yes 9 undeformed? slightly deformed?; plane (112) in particular ambiguous 10 undeformed undeformed yes 11 undeformed undeformed yes 12 deformed? slightly def refined 13 undeformed undeformed yes 14 deformed deformed (mosaicity) yes 15 deformed deformed (mosaicity + asterism) yes 16 deformed deformed (mosaicity + asterism) yes 17 deformed deformed (mosaicity + asterism) yes 18 undeformed? undeformed refined
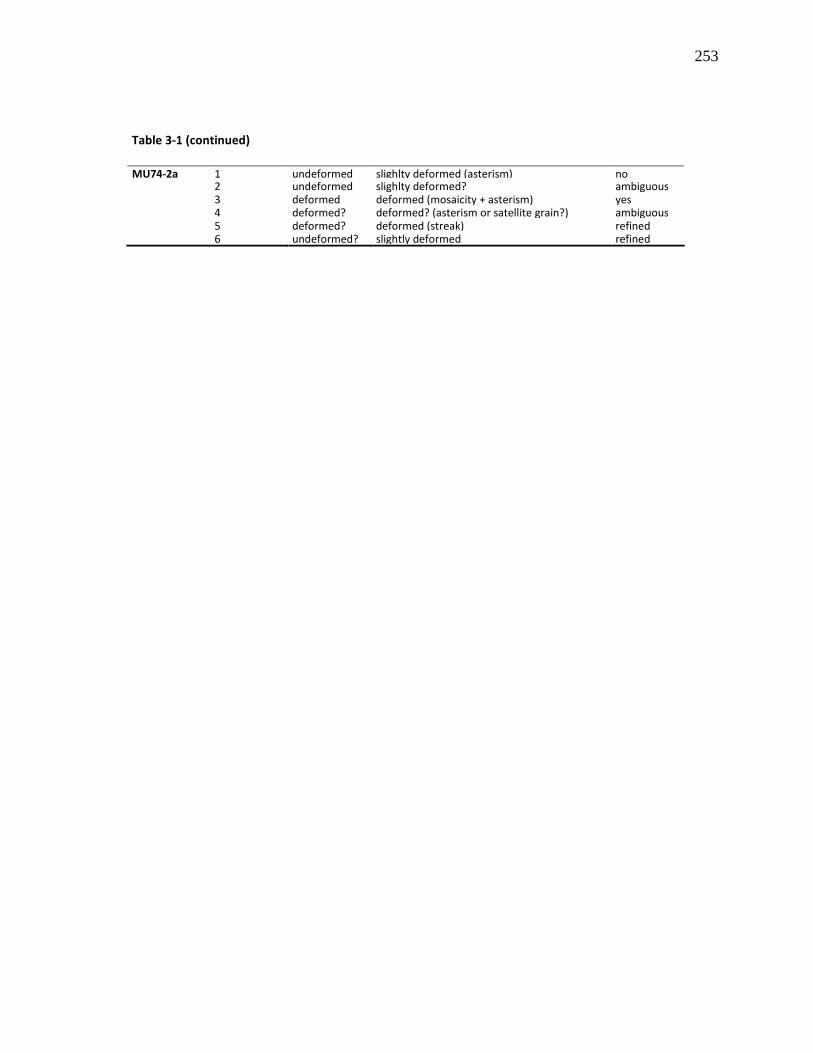
253
Table 3-1 (continued)
MU74-2a 1 undeformed slighlty deformed (asterism) no 2 undeformed slighlty deformed? ambiguous 3 deformed deformed (mosaicity + asterism) yes 4 deformed? deformed? (asterism or satellite grain?) ambiguous 5 deformed? deformed (streak) refined 6 undeformed? slightly deformed refined
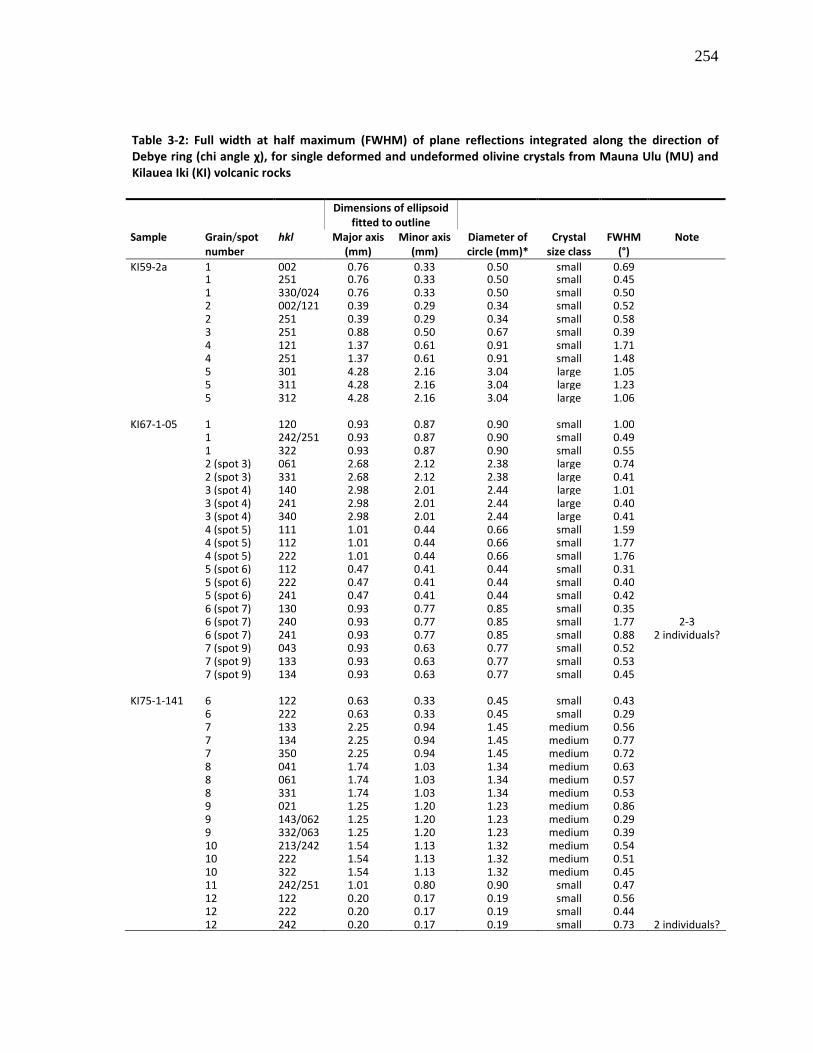
254
Table 3-2: Full width at half maximum (FWHM) of plane reflections integrated along the direction of
Debye ring (chi angle χ), for single deformed and undeformed olivine crystals from Mauna Ulu (MU) and
Kilauea Iki (KI) volcanic rocks
Dimensions of ellipsoid
fitted to outline
Sample Grain/spot
number
hkl Major axis
(mm)
Minor axis
(mm)
Diameter of
circle (mm)*
Crystal
size class
FWHM
(°)
Note
KI59-2a 1 002 0.76 0.33 0.50 small 0.69 1 251 0.76 0.33 0.50 small 0.45 1 330/024 0.76 0.33 0.50 small 0.50 2 002/121 0.39 0.29 0.34 small 0.52 2 251 0.39 0.29 0.34 small 0.58 3 251 0.88 0.50 0.67 small 0.39 4 121 1.37 0.61 0.91 small 1.71 4 251 1.37 0.61 0.91 small 1.48 5 301 4.28 2.16 3.04 large 1.05 5 311 4.28 2.16 3.04 large 1.23 5 312 4.28 2.16 3.04 large 1.06 KI67-1-05 1 120 0.93 0.87 0.90 small 1.00 1 242/251 0.93 0.87 0.90 small 0.49 1 322 0.93 0.87 0.90 small 0.55 2 (spot 3) 061 2.68 2.12 2.38 large 0.74 2 (spot 3) 331 2.68 2.12 2.38 large 0.41 3 (spot 4) 140 2.98 2.01 2.44 large 1.01 3 (spot 4) 241 2.98 2.01 2.44 large 0.40 3 (spot 4) 340 2.98 2.01 2.44 large 0.41 4 (spot 5) 111 1.01 0.44 0.66 small 1.59 4 (spot 5) 112 1.01 0.44 0.66 small 1.77 4 (spot 5) 222 1.01 0.44 0.66 small 1.76 5 (spot 6) 112 0.47 0.41 0.44 small 0.31 5 (spot 6) 222 0.47 0.41 0.44 small 0.40 5 (spot 6) 241 0.47 0.41 0.44 small 0.42 6 (spot 7) 130 0.93 0.77 0.85 small 0.35 6 (spot 7) 240 0.93 0.77 0.85 small 1.77 2-3 6 (spot 7) 241 0.93 0.77 0.85 small 0.88 2 individuals? 7 (spot 9) 043 0.93 0.63 0.77 small 0.52 7 (spot 9) 133 0.93 0.63 0.77 small 0.53 7 (spot 9) 134 0.93 0.63 0.77 small 0.45 KI75-1-141 6 122 0.63 0.33 0.45 small 0.43 6 222 0.63 0.33 0.45 small 0.29 7 133 2.25 0.94 1.45 medium 0.56 7 134 2.25 0.94 1.45 medium 0.77 7 350 2.25 0.94 1.45 medium 0.72 8 041 1.74 1.03 1.34 medium 0.63 8 061 1.74 1.03 1.34 medium 0.57 8 331 1.74 1.03 1.34 medium 0.53 9 021 1.25 1.20 1.23 medium 0.86 9 143/062 1.25 1.20 1.23 medium 0.29 9 332/063 1.25 1.20 1.23 medium 0.39 10 213/242 1.54 1.13 1.32 medium 0.54 10 222 1.54 1.13 1.32 medium 0.51 10 322 1.54 1.13 1.32 medium 0.45 11 242/251 1.01 0.80 0.90 small 0.47 12 122 0.20 0.17 0.19 small 0.56 12 222 0.20 0.17 0.19 small 0.44 12 242 0.20 0.17 0.19 small 0.73 2 individuals?
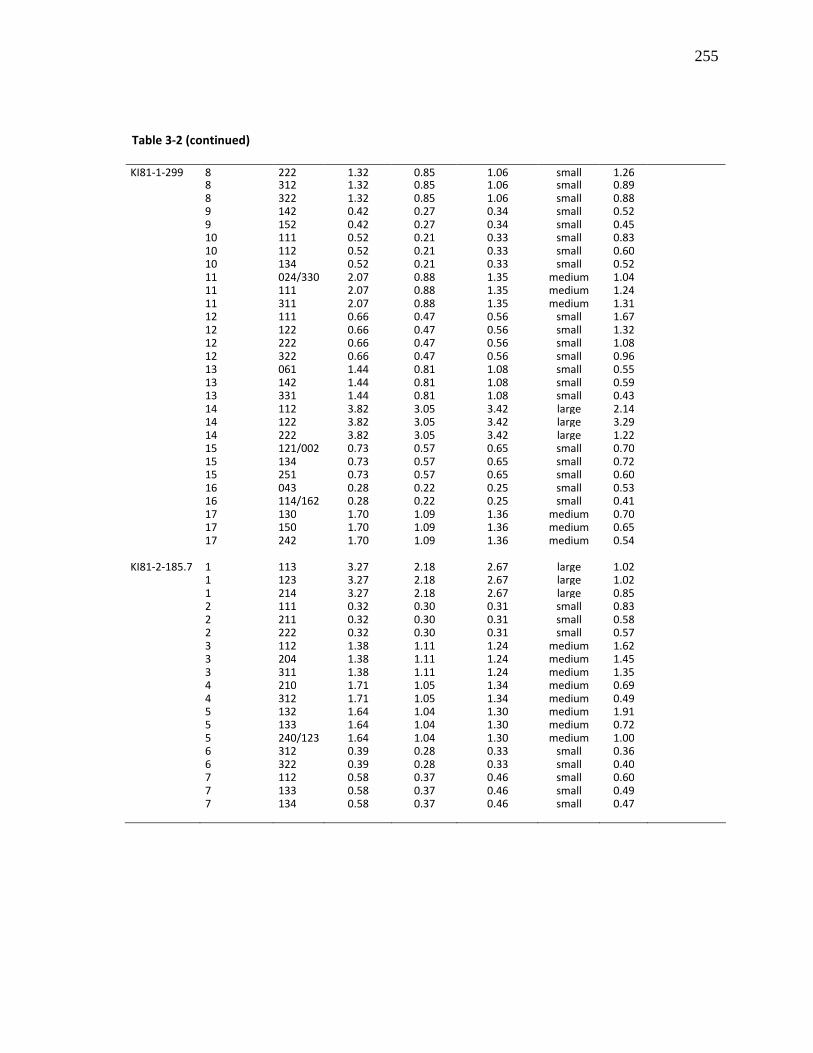
255
Table 3-2 (continued)
KI81-1-299 8 222 1.32 0.85 1.06 small 1.26 8 312 1.32 0.85 1.06 small 0.89 8 322 1.32 0.85 1.06 small 0.88 9 142 0.42 0.27 0.34 small 0.52 9 152 0.42 0.27 0.34 small 0.45 10 111 0.52 0.21 0.33 small 0.83 10 112 0.52 0.21 0.33 small 0.60 10 134 0.52 0.21 0.33 small 0.52 11 024/330 2.07 0.88 1.35 medium 1.04 11 111 2.07 0.88 1.35 medium 1.24 11 311 2.07 0.88 1.35 medium 1.31 12 111 0.66 0.47 0.56 small 1.67 12 122 0.66 0.47 0.56 small 1.32 12 222 0.66 0.47 0.56 small 1.08 12 322 0.66 0.47 0.56 small 0.96 13 061 1.44 0.81 1.08 small 0.55 13 142 1.44 0.81 1.08 small 0.59 13 331 1.44 0.81 1.08 small 0.43 14 112 3.82 3.05 3.42 large 2.14 14 122 3.82 3.05 3.42 large 3.29 14 222 3.82 3.05 3.42 large 1.22 15 121/002 0.73 0.57 0.65 small 0.70 15 134 0.73 0.57 0.65 small 0.72 15 251 0.73 0.57 0.65 small 0.60 16 043 0.28 0.22 0.25 small 0.53 16 114/162 0.28 0.22 0.25 small 0.41 17 130 1.70 1.09 1.36 medium 0.70 17 150 1.70 1.09 1.36 medium 0.65 17 242 1.70 1.09 1.36 medium 0.54 KI81-2-185.7 1 113 3.27 2.18 2.67 large 1.02 1 123 3.27 2.18 2.67 large 1.02 1 214 3.27 2.18 2.67 large 0.85 2 111 0.32 0.30 0.31 small 0.83 2 211 0.32 0.30 0.31 small 0.58 2 222 0.32 0.30 0.31 small 0.57 3 112 1.38 1.11 1.24 medium 1.62 3 204 1.38 1.11 1.24 medium 1.45 3 311 1.38 1.11 1.24 medium 1.35 4 210 1.71 1.05 1.34 medium 0.69 4 312 1.71 1.05 1.34 medium 0.49 5 132 1.64 1.04 1.30 medium 1.91 5 133 1.64 1.04 1.30 medium 0.72 5 240/123 1.64 1.04 1.30 medium 1.00 6 312 0.39 0.28 0.33 small 0.36 6 322 0.39 0.28 0.33 small 0.40 7 112 0.58 0.37 0.46 small 0.60 7 133 0.58 0.37 0.46 small 0.49 7 134 0.58 0.37 0.46 small 0.47
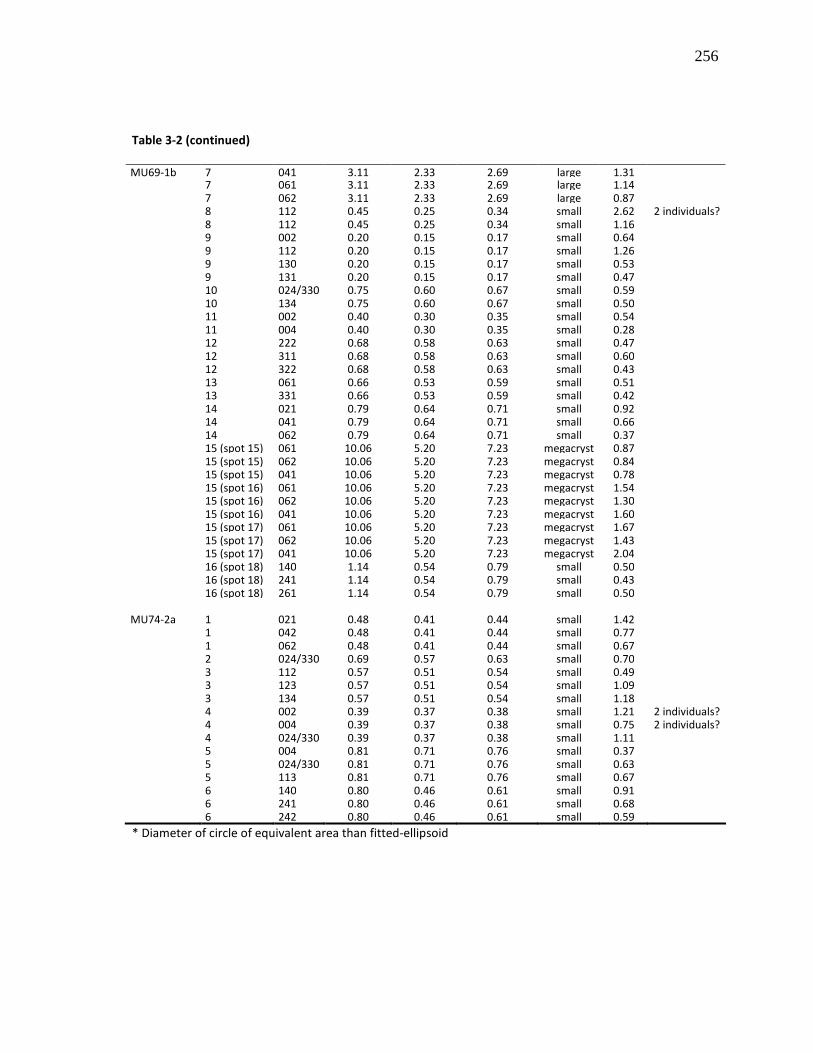
256
Table 3-2 (continued)
MU69-1b 7 041 3.11 2.33 2.69 large 1.31 7 061 3.11 2.33 2.69 large 1.14 7 062 3.11 2.33 2.69 large 0.87 8 112 0.45 0.25 0.34 small 2.62 2 individuals? 8 112 0.45 0.25 0.34 small 1.16 9 002 0.20 0.15 0.17 small 0.64 9 112 0.20 0.15 0.17 small 1.26 9 130 0.20 0.15 0.17 small 0.53 9 131 0.20 0.15 0.17 small 0.47 10 024/330 0.75 0.60 0.67 small 0.59 10 134 0.75 0.60 0.67 small 0.50 11 002 0.40 0.30 0.35 small 0.54 11 004 0.40 0.30 0.35 small 0.28 12 222 0.68 0.58 0.63 small 0.47 12 311 0.68 0.58 0.63 small 0.60 12 322 0.68 0.58 0.63 small 0.43 13 061 0.66 0.53 0.59 small 0.51 13 331 0.66 0.53 0.59 small 0.42 14 021 0.79 0.64 0.71 small 0.92 14 041 0.79 0.64 0.71 small 0.66 14 062 0.79 0.64 0.71 small 0.37 15 (spot 15) 061 10.06 5.20 7.23 megacryst 0.87 15 (spot 15) 062 10.06 5.20 7.23 megacryst 0.84 15 (spot 15) 041 10.06 5.20 7.23 megacryst 0.78 15 (spot 16) 061 10.06 5.20 7.23 megacryst 1.54 15 (spot 16) 062 10.06 5.20 7.23 megacryst 1.30 15 (spot 16) 041 10.06 5.20 7.23 megacryst 1.60 15 (spot 17) 061 10.06 5.20 7.23 megacryst 1.67 15 (spot 17) 062 10.06 5.20 7.23 megacryst 1.43 15 (spot 17) 041 10.06 5.20 7.23 megacryst 2.04 16 (spot 18) 140 1.14 0.54 0.79 small 0.50 16 (spot 18) 241 1.14 0.54 0.79 small 0.43 16 (spot 18) 261 1.14 0.54 0.79 small 0.50 MU74-2a 1 021 0.48 0.41 0.44 small 1.42 1 042 0.48 0.41 0.44 small 0.77 1 062 0.48 0.41 0.44 small 0.67 2 024/330 0.69 0.57 0.63 small 0.70 3 112 0.57 0.51 0.54 small 0.49 3 123 0.57 0.51 0.54 small 1.09 3 134 0.57 0.51 0.54 small 1.18 4 002 0.39 0.37 0.38 small 1.21 2 individuals? 4 004 0.39 0.37 0.38 small 0.75 2 individuals? 4 024/330 0.39 0.37 0.38 small 1.11 5 004 0.81 0.71 0.76 small 0.37 5 024/330 0.81 0.71 0.76 small 0.63 5 113 0.81 0.71 0.76 small 0.67 6 140 0.80 0.46 0.61 small 0.91 6 241 0.80 0.46 0.61 small 0.68 6 242 0.80 0.46 0.61 small 0.59
* Diameter of circle of equivalent area than fitted-ellipsoid
257
3.5 CONCLUDING REMARKS
This µXRD study of some Kilauea Iki and Mauna Ulu olivines has yielded the following
conclusions and implications:
� The optical petrographic observations of olivine deformation were validated and refined
using the µXRD technique;
� Micro XRD applied to single olivine crystals in Hawaiian tholeiitic basalts is shown to be an
easy-to-use, fast, low-cost, non-destructive and less-ambiguous technique to determine the
presence of strain in the crystal structure, and possibly quantify it, even for very small
crystals;
� Although this technique does not allow the simple estimation of the P-T conditions of
deformation and crystal formation or magmatic history, some constraints have been
provided here, in particular the estimation of a threshold over which deformation
undoubtedly occurred;
� In the future, it would be interesting to carry out such µXRD analyses for a wide range of
single, deformed and undeformed olivine crystals with precise constraints on their
formation and magmatic environments, such as upper, lower, and sub-continental
lithospheric mantle, shallow magma chambers, volcano cumulates, etc. A complementary
approach would be to analyse experimental olivines by µXRD, olivines being formed under
well-constrained temperature, pressure and other thermodynamic parameters. Overall, this
data collecting approach using the µXRD technique will allow the formation of a complete
reference data set of qualitative and quantitative parameters useful to document
deformation of magmatic olivines;
258
� Although mosaicity is often a shock effect, it can also be produced by endogenic processes
(French and Koeberl, 2010, and references therein). French and Koeberl noted that there are
no quantitative estimations of intensity of mosaicity in the literature, along with a lack of
data about characteristics of mosaicity versus mineral composition or grain size, for
example. In the present study, we gain insights into the relationship between the intensity
of mosaicity, as estimated using FWHM, and olivine composition along with grain size. We
also yield constraints on the level of mosaicity in basaltic rocks not affected by impact
events, so that it could be used either in meteorite studies as a background level of non-
shock-produced mosaicity, or in other studies of igneous rocks as a useful level range for
comparison purposes.
3.6 ACKNOWLEDGEMENTS
We acknowledge Don Swanson from the Hawaiian Volcano Observatory (HVO) for his advice
before, during and after the fieldwork, and the staff of the Hawaii National Park. This research was
partly funded by grants from the Natural Science and Engineering Research Council of Canada to
MDH.
259
3.7 REFERENCES
Bai, Q., and Kohlstedt, D.L. (1992) High-temperature creep of olivine single crystals. 2. dislocation structures. Tectonophysics, 206(1-2), 1-29.
Bai, Q., Mackwell, S.J., and Kohlstedt, D.L. (1991) High-temperature creep of olivine single crystals. 1. Mechanical results for buffered samples. Journal of Geophysical Research-Solid Earth and Planets, 96(B2), 2441-2463.
Demouchy, S., Schneider, S.E., Mackwell, S.J., Zimmerman, M.E., and Kohlstedt, D.L. (2009) Experimental deformation of olivine single crystals at lithospheric temperatures. Geophysical Research Letters, 36(L04304), doi:10.1029/2008gl036611.
Durham, W.B., and Goetze, C. (1977) Plastic flow of oriented single crystals of olivine. 1. Mechanical data. Journal of Geophysical Research, 82(36), 5737-5753.
Evans, B., and Goetze, C. (1979) The temperature variation of hardness of olivine and its implication for polycrystalline yield stress. Journal of Geophysical Research, 84(B10), 5505-5524.
Flemming, R.L. (2007) Micro X-ray diffraction (µXRD): a versatile technique for characterization of earth and planetary materials. Canadian Journal of Earth Sciences, 44(9), 1333-1346.
French, B.M., and Koeberl, C. (2010) The convincing identification of terrestrial meteorite impact structures: What works, what doesn't, and why. Earth-Science Reviews, 98(1-2), 123-170.
Hanss, R.E., Montague, B.R., Davis, M.K., Galindo, C., and Hoerz, F. (1978) X-ray diffractometer studies of shocked materials. Proceedings of the 9th Lunar and Planetary Science Conference, 2, p. 2773-2787. Pergamon Press (New York), Houston, TX.
Hobbs, B.E. (1985) The Geological Significances of Microfabric Analysis. In H.-R. Wenk, Ed. Preferred Orientation in Deformed Metals and Rocks: An Introduction to Modern Texture Analysis, p. 463-484. Academic Press, Inc.
Hörz, F., and Quaide, W. (1973) Debye-scherrer investigations of experimentally shocked silicates. Earth, Moon, and Planets, 6(1), 45-82.
Izawa, M.R.M., Flemming, R.L., and Banerjee, N.R. (2009) Shock stage assessment and petrography of 11 Antarctic enstatite chondrites. 40th Lunar and Planetary Science Conference, Abs. #1322, Houston, Texas.
-. (in review) Micro X-ray diffraction (μXRD) assessment of shock stage in enstatite chondrites. Meteoritics & Planetary Science.
260
Kohlsted, D.L., and Goetze, C. (1974) Low-stress high-temperature creep in olivine single crystals. Journal of Geophysical Research, 79(14), 2045-2051.
Langdon, T.G. (1985) Regimes of Plastic Deformation. In H.-R. Wenk, Ed. Preferred Orientation in Deformed Metals and Rocks: An Introduction to Modern Texture Analysis, p. 219-232. Academic Press, Inc.
Li, L., Weidner, D., Raterron, P., Chen, J.H., and Vaughan, M. (2004) Stress measurements of deforming olivine at high pressure. Physics of The Earth and Planetary Interiors, 143, 357-367.
Mercier, J.-C.C. (1985) Olivine and Pyroxenes. In H.-R. Wenk, Ed. Preferred Orientation in Deformed Metals and Rocks: An Introduction to Modern Texture Analysis, p. 407-430. Academic Press, Inc.
Moser, D.E., Davis, W.J., Reddy, S.M., Flemming, R.L., and Hart, R.J. (2009) Zircon U-Pb strain chronometry reveals deep impact-triggered flow. Earth and Planetary Science Letters, 277(1-2), 73-79.
Raterron, P., Amiguet, E., Chen, J., Li, L., and Cordier, P. (2009) Experimental deformation of olivine single crystals at mantle pressures and temperatures. Physics of The Earth and Planetary Interiors, 172(1-2), 74-83.
Raterron, P., Wu, Y.J., Weidner, D.J., and Chen, J.H. (2004) Low-temperature olivine rheology at high pressure. Physics of The Earth and Planetary Interiors, 145(1-4), 149-159.
Smith, E., Helmstaedt, H.H., and Flemming, R.L. (2010) Survival of the Brown Colour in Diamond During Storage in the Subcontinental Lithospheric Mantle. Canadian Mineralogist, 48(3), 571-582.
Vinet, N., and Higgins, M.D. (2010) Magma solidification processes beneath Kilauea Volcano, Hawaii: A quantitative textural and geochemical study of the 1969-1974 Mauna Ulu lavas. Journal of Petrology, 51(6), 1297-1332.
-. (in revision) What can crystal size distributions and olivine compositions tell us about magma solidification processes inside Kilauea Iki lava lake, Hawaii? Journal of Volcanology and Geothermal Research.
261
SYNTHÈSE ET CONCLUSION
Dans cette thèse, l'étude de la solidification des magmas basaltiques, et donc les articles
qui constituent ce travail, s'articulent autour du même composant central : l'olivine. Ce minéral est
certes très commun et généralement abondant dans les basaltes, mais il se retrouve ici aussi sous
la forme de cristaux déformés, d'origine magmatique. Ce point constitue clairement un aspect
crucial de l'étude, la présence d'olivines déformées étant généralement une particularité des
roches mantelliques et plutoniques, mais beaucoup plus rare en contexte volcanique. Les cristaux
déformés présents dans nos laves du Kilauea ont pour source commune majoritaire un cumulat de
base d'édifice, situé au niveau du décollement majeur, à ~10-12 km de profondeur. L'analyse
structurale de ces cristaux d'olivine déformés s'insère dans l'optique générale d'une meilleure
compréhension de la déformation et du système magmatique hôte.
Dans le premier article (Chapitre 1), les principaux processus de solidification magmatique
ont été examinés et quantifiés à des profondeurs de 0 à 12 km à l'intérieur du Kilauea. Un modèle
pétrogénétique et semi-chronologique simple expliquant la dynamique du système magmatique
("plumbing") à ces profondeurs est également proposé. Ce modèle traite de l'origine et de
l'histoire de solidification des magmas de l'éruption de 1969-1974 du Mauna Ulu, mais rend aussi
compte de la dynamique plus globale qui affecte les "entrailles" du Kilauea. En résumé, cet article
met en évidence l'existence de deux populations majeures d'olivines magmatiques, cogénétiques
par ailleurs. Parmi ces olivines, de nombreux cristaux déformés (présence de bandes de
déformation, extinction ondulante, etc.) sont présents. Aucune olivine mantellique n'est reconnue
262
ici ; les cristaux déformés sont en fait d'origine magmatique. Les résultats montrent que les
magmas à l'origine de l'éruption du Mauna Ulu ont suivi deux trajets différents : (1) transit du
magma transportant la plupart des olivines déformées le long du décollement majeur sous
l'édifice, puis remontée à travers des sortes de conduits verticaux jusqu'à la région sous Mauna
Ulu ; et (2) remontée du magma transportant les olivines non déformées par le conduit
magmatique principal jusqu'au réservoir sommital, puis transfert sous la East Rift Zone et mélange
des magmas dans des réservoirs secondaires.
Dans le deuxième article (Chapitre 2) l'approche combinée de la chimie in situ et des CSDs
de l'olivine appliquée aux échantillons de surface du Kilauea Iki et aux échantillons du lac de lave
(profondeurs : 0-90 m), a permis de déterminer et quantifier toute une série de processus de
solidification pré-éruption et intra-lac. La géochimie et les CSDs révèlent la présence de deux
populations majeures et une population mineure d'olivines ; ces populations ne sont pas
nécessairement directement reliées. À l'image du Mauna Ulu, nombre de cristaux présentent des
évidences pétrologiques de déformation, mais aucun xénocristal mantellique n'est présent. Nos
résultats suggèrent l'influence majeure du mélange de magmas (ou cristaux) et du mûrissement
textural dans le système magmatique avant éruption. Ces processus deviennent peu actifs lors du
refroidissement du lac. La modélisation CSD n'a fournit aucune évidence de sédimentation
gravitaire des cristaux, ni de convection. Cet article met aussi l'accent sur l'existence dans le lac de
lave d'une stratification verticale minéralogique et chimique dont l'origine reste quelque peu
ambiguë. Il se peut que ce soit le résultat d'une stratification originelle, dérivée de la stratification
du réservoir magmatique au moment de l'éruption. Cependant, cette hypothèse est en désaccord
avec les observations faites en cours d'éruption qui démontrent clairement que le magma du lac a
263
subi un fort brassage tout au long des 17 phases éruptives. Le remplissage du lac de lave par sa
base lors de l'éruption constitue une autre possibilité proposée ici.
Le troisième article (Chapitre 3) présente l'analyse microstructurale in situ par micro-
diffraction des rayons X (µXRD) d'olivines déformées et non déformées provenant de certains
échantillons déjà étudiés dans les articles 1 et 2. Cette étude utilise une technique innovante, non
destructive, peu coûteuse et rapide à mettre en œuvre permettant de recueillir des informations
sur la structure interne des cristaux, ainsi que le mode et l'intensité de déformation. Dr. Roberta
Flemming, University of Western Ontario, London, Canada, m’a appris comment utiliser le
diffractomètre à rayons X et m’a aidé dans l’analyse des données brutes. Elle a également
participé à la rédaction de la méthodologie de l’article. Les résultats ont permis de valider les
observations pétrographiques de déformation faites à l'aide du microscope. Cette analyse µXRD a
aussi permis de confirmer la présence de déformation pour toutes les tailles de grains d'olivine,
sans corrélation simple avec leur chimie, et de quantifier cette déformation. Cette technique ne
permet cependant pas une estimation simple des conditions pression-température de
déformation ou de formation des cristaux, ni d'apporter d'informations sur l'histoire magmatique.
Il a cependant été possible de fixer un seuil quantitatif au-delà duquel toute olivine est déformée
de façon significative.
Globalement, cette thèse a permis de mieux comprendre et de quantifier les principaux
processus de solidification des magmas basaltiques, via l'étude des produits volcaniques de
l'éruption latérale de 1969-1974 du Mauna Ulu (système ouvert), et l'éruption sommitale de 1959
du Kilauea Iki (système fermé). L'olivine a été le minéral de choix puisque très abondant, précoce
dans l'histoire de la solidification, et adapté à l'étude combinée des compositions chimiques et des
264
textures magmatiques. La chromite aurait été un minéral complémentaire intéressant dans ce
type d'approche, puisqu'il est lui aussi abondant, précoce, et souvent associé à l'olivine dans nos
échantillons. Cependant, l'étude de la chromite fera uniquement partie de projets futurs.
Deux modèles de solidification magmatique sont proposés (Chapitres 1 et 2), l'un appliqué
aux systèmes ouverts et l'autre aux systèmes fermés. Nos modèles se révèlent être partiellement
en accord avec les modèles présentés dans la problématique. Ils amènent également une part
significative de nouveauté ou de raffinement, en particulier grâce à la quantification des
mécanismes en général, incluant une estimation temporelle via l'analyse CSD. Par exemple, les
mouvements convectifs et la sédimentation gravitaire à grande échelle dans le lac de lave sont ici
considérés comme négligeables, ce qui est en contradiction avec la plupart des travaux antérieurs.
Un modèle de transfert des magmas à l'intérieur du système magmatique du Kilauea est
également proposé (Chapitre 1). Ce modèle s'applique sur toute l'épaisseur de l'édifice (0-12 km
de profondeur).
Cette thèse traite aussi plus en détail l'aspect déformation magmatique de l'olivine, et
amène une quantification appliquée au milieu naturel. Une réponse positive est apportée à la
question de la quantification et reconnaissance de ce type de déformation magmatique. La
combinaison de la pétrographie classique et de l'analyse structurale in situ par µXRD se révèle être
une approche adaptée dans ce cas. Cependant, la question du mode de déformation à l'œuvre
dans la structure même de l'olivine ne trouve pas de réponse précise ici ; la µXRD n'apporte pas
toutes les informations requises. Plus précisément, le lien entre les résultats µXRD et le mode de
déformation cristalline n'est pas direct, si lien simple il y a.
265
D'un point de vue méthodologique global, cette étude démontre clairement l'intérêt de
combiner les approches texturale et géochimique, notamment dans le cas de systèmes naturels en
domaine volcanique. Cette conclusion est vraie autant en système ouvert que fermé, même si la
plupart des modèles CSD sont par défaut adaptés aux systèmes ouverts ; une approximation en
système fermé est alors requise, mais tout à fait valable. Dans les Chapitres 1 et 2 la double
approche basée sur la combinaison distribution de la taille des cristaux et géochimie, a permis
d'apporter davantage d'informations quantitatives sur les processus de solidification des magmas
basaltiques. En effet, certains de ces processus n'affectent que la texture des roches (i.e.
nucléation et croissance cristallines, déformation, mûrissement textural) ; ils ne sont donc
quantifiables que par l'approche texturale. D'autres processus affectent à la fois la texture et la
chimie des roches (i.e. mélange, fractionnement et accumulation) ; ils peuvent donc être étudiés
par la combinaison des deux approches, texturale et géochimique. Cependant, les effets texturaux
de plusieurs processus (e.g. agrégation vs. mûrissement textural) sur les CSDs peuvent se
superposés (partiellement ou totalement), et donc engendrés une certaine ambiguïté dans
l'interprétation des résultats. Ce cas de figure a régulièrement posé problème tout au long du
doctorat, et l'aspect géochimique s'est alors révélé indispensable pour aller plus de l'avant.
Concernant l'analyse microstructurale de la déformation des olivines, il serait intéressant à
terme de mener ce genre d'études µXRD sur une large gamme de cristaux, olivine et autres
silicates naturels, déformés et non déformés, dont les conditions de formation et l'environnement
magmatique sont parfaitement connus. L'apport de l'analyse µXRD d'olivines (ou autres silicates)
expérimentales serait également significatif. Cette démarche permettrait de créer une base de
données qualitatives et quantitatives complète, utile pour documenter la déformation
magmatique des minéraux silicatés, trop peu contrainte à l'heure actuelle. Notre étude µXRD met
266
en évidence la relation entre l'intensité de déformation (ou de "mosaïcité"), exprimée par le
paramètre FWHM, et la composition de l'olivine ou la taille de grain. Le niveau de mosaïcité, très
utile dans les études sur les météorites, est ainsi contraint ici dans le cas de roches basaltiques non
affectées par un impact météorique, et pourrait servir de base de comparaison pour de futures
études sur les météorites (comme seuil de référence) ou sur les roches ignées.
Finalement, même si la signification des résultats est difficile à prédire dans un domaine
d’étude en cours de développement telle que la quantification texturale appliquée aux roches
magmatiques, cette thèse apporte l'évidence que l'application d'une dynamique de recherche
exploratoire peut aboutir à la formation de modèles cohérents. De plus, le développement de
l'outil textural pour l'étude des magmas pourrait aboutir à de nouvelles conclusions (ou théories)
quant aux processus magmatiques associés. Par exemple, si le mûrissement textural est un
processus pétrologique comparable en importance à la décantation/sédimentation des cristaux, il
pourrait avoir des implications importantes sur la façon dont les compositions chimiques et
isotopiques des roches et minéraux sont interprétées. De plus, la quantification texturale des
roches magmatiques est un domaine de recherche en pleine croissance. Il est donc nécessaire de
profiter de toutes les opportunités pour un avancement rapide des connaissances en la matière.
En résumé, ce travail participe pleinement à l'essor global de la pétrologie vers l'aspect textural et
microstructural.
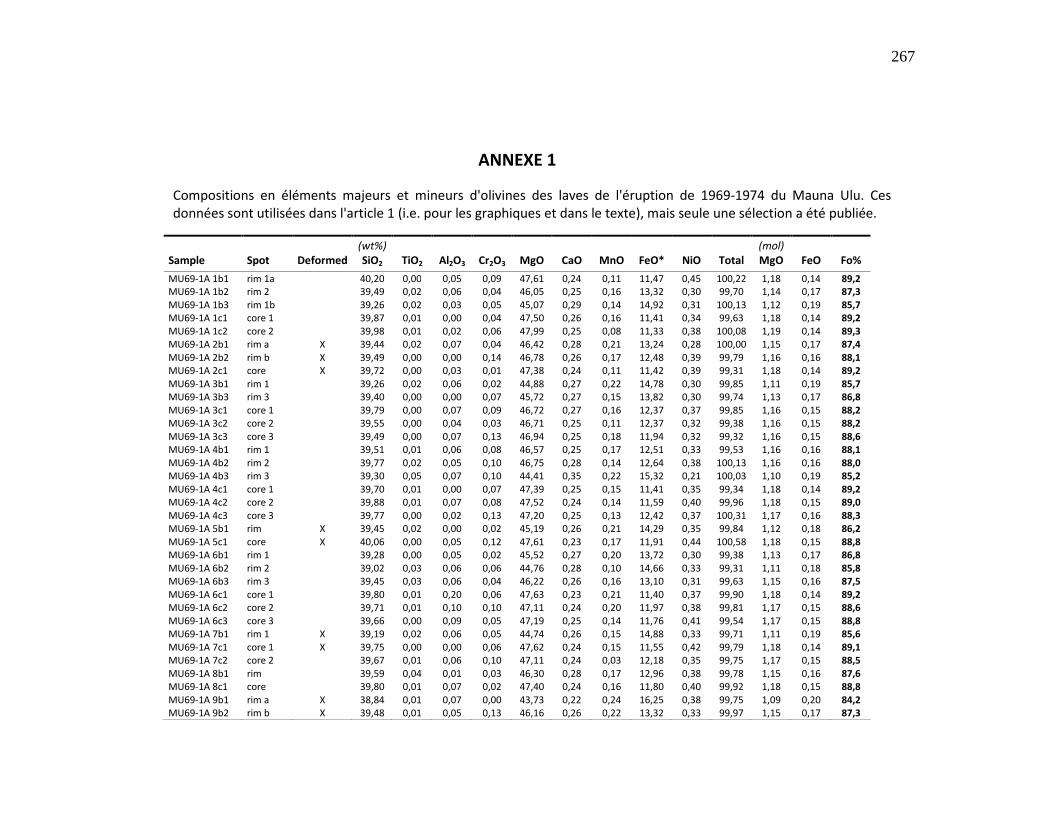
267
ANNEXE 1
Compositions en éléments majeurs et mineurs d'olivines des laves de l'éruption de 1969-1974 du Mauna Ulu. Ces données sont utilisées dans l'article 1 (i.e. pour les graphiques et dans le texte), mais seule une sélection a été publiée.
(wt%) (mol) Sample Spot Deformed SiO2 TiO2 Al2O3 Cr2O3 MgO CaO MnO FeO* NiO Total MgO FeO Fo%
MU69-1A 1b1 rim 1a 40,20 0,00 0,05 0,09 47,61 0,24 0,11 11,47 0,45 100,22 1,18 0,14 89,2 MU69-1A 1b2 rim 2 39,49 0,02 0,06 0,04 46,05 0,25 0,16 13,32 0,30 99,70 1,14 0,17 87,3 MU69-1A 1b3 rim 1b 39,26 0,02 0,03 0,05 45,07 0,29 0,14 14,92 0,31 100,13 1,12 0,19 85,7 MU69-1A 1c1 core 1 39,87 0,01 0,00 0,04 47,50 0,26 0,16 11,41 0,34 99,63 1,18 0,14 89,2 MU69-1A 1c2 core 2 39,98 0,01 0,02 0,06 47,99 0,25 0,08 11,33 0,38 100,08 1,19 0,14 89,3 MU69-1A 2b1 rim a X 39,44 0,02 0,07 0,04 46,42 0,28 0,21 13,24 0,28 100,00 1,15 0,17 87,4 MU69-1A 2b2 rim b X 39,49 0,00 0,00 0,14 46,78 0,26 0,17 12,48 0,39 99,79 1,16 0,16 88,1 MU69-1A 2c1 core X 39,72 0,00 0,03 0,01 47,38 0,24 0,11 11,42 0,39 99,31 1,18 0,14 89,2 MU69-1A 3b1 rim 1 39,26 0,02 0,06 0,02 44,88 0,27 0,22 14,78 0,30 99,85 1,11 0,19 85,7 MU69-1A 3b3 rim 3 39,40 0,00 0,00 0,07 45,72 0,27 0,15 13,82 0,30 99,74 1,13 0,17 86,8 MU69-1A 3c1 core 1 39,79 0,00 0,07 0,09 46,72 0,27 0,16 12,37 0,37 99,85 1,16 0,15 88,2 MU69-1A 3c2 core 2 39,55 0,00 0,04 0,03 46,71 0,25 0,11 12,37 0,32 99,38 1,16 0,15 88,2 MU69-1A 3c3 core 3 39,49 0,00 0,07 0,13 46,94 0,25 0,18 11,94 0,32 99,32 1,16 0,15 88,6 MU69-1A 4b1 rim 1 39,51 0,01 0,06 0,08 46,57 0,25 0,17 12,51 0,33 99,53 1,16 0,16 88,1 MU69-1A 4b2 rim 2 39,77 0,02 0,05 0,10 46,75 0,28 0,14 12,64 0,38 100,13 1,16 0,16 88,0 MU69-1A 4b3 rim 3 39,30 0,05 0,07 0,10 44,41 0,35 0,22 15,32 0,21 100,03 1,10 0,19 85,2 MU69-1A 4c1 core 1 39,70 0,01 0,00 0,07 47,39 0,25 0,15 11,41 0,35 99,34 1,18 0,14 89,2 MU69-1A 4c2 core 2 39,88 0,01 0,07 0,08 47,52 0,24 0,14 11,59 0,40 99,96 1,18 0,15 89,0 MU69-1A 4c3 core 3 39,77 0,00 0,02 0,13 47,20 0,25 0,13 12,42 0,37 100,31 1,17 0,16 88,3 MU69-1A 5b1 rim X 39,45 0,02 0,00 0,02 45,19 0,26 0,21 14,29 0,35 99,84 1,12 0,18 86,2 MU69-1A 5c1 core X 40,06 0,00 0,05 0,12 47,61 0,23 0,17 11,91 0,44 100,58 1,18 0,15 88,8 MU69-1A 6b1 rim 1 39,28 0,00 0,05 0,02 45,52 0,27 0,20 13,72 0,30 99,38 1,13 0,17 86,8 MU69-1A 6b2 rim 2 39,02 0,03 0,06 0,06 44,76 0,28 0,10 14,66 0,33 99,31 1,11 0,18 85,8 MU69-1A 6b3 rim 3 39,45 0,03 0,06 0,04 46,22 0,26 0,16 13,10 0,31 99,63 1,15 0,16 87,5 MU69-1A 6c1 core 1 39,80 0,01 0,20 0,06 47,63 0,23 0,21 11,40 0,37 99,90 1,18 0,14 89,2 MU69-1A 6c2 core 2 39,71 0,01 0,10 0,10 47,11 0,24 0,20 11,97 0,38 99,81 1,17 0,15 88,6 MU69-1A 6c3 core 3 39,66 0,00 0,09 0,05 47,19 0,25 0,14 11,76 0,41 99,54 1,17 0,15 88,8 MU69-1A 7b1 rim 1 X 39,19 0,02 0,06 0,05 44,74 0,26 0,15 14,88 0,33 99,71 1,11 0,19 85,6 MU69-1A 7c1 core 1 X 39,75 0,00 0,00 0,06 47,62 0,24 0,15 11,55 0,42 99,79 1,18 0,14 89,1 MU69-1A 7c2 core 2 39,67 0,01 0,06 0,10 47,11 0,24 0,03 12,18 0,35 99,75 1,17 0,15 88,5 MU69-1A 8b1 rim 39,59 0,04 0,01 0,03 46,30 0,28 0,17 12,96 0,38 99,78 1,15 0,16 87,6 MU69-1A 8c1 core 39,80 0,01 0,07 0,02 47,40 0,24 0,16 11,80 0,40 99,92 1,18 0,15 88,8 MU69-1A 9b1 rim a X 38,84 0,01 0,07 0,00 43,73 0,22 0,24 16,25 0,38 99,75 1,09 0,20 84,2 MU69-1A 9b2 rim b X 39,48 0,01 0,05 0,13 46,16 0,26 0,22 13,32 0,33 99,97 1,15 0,17 87,3
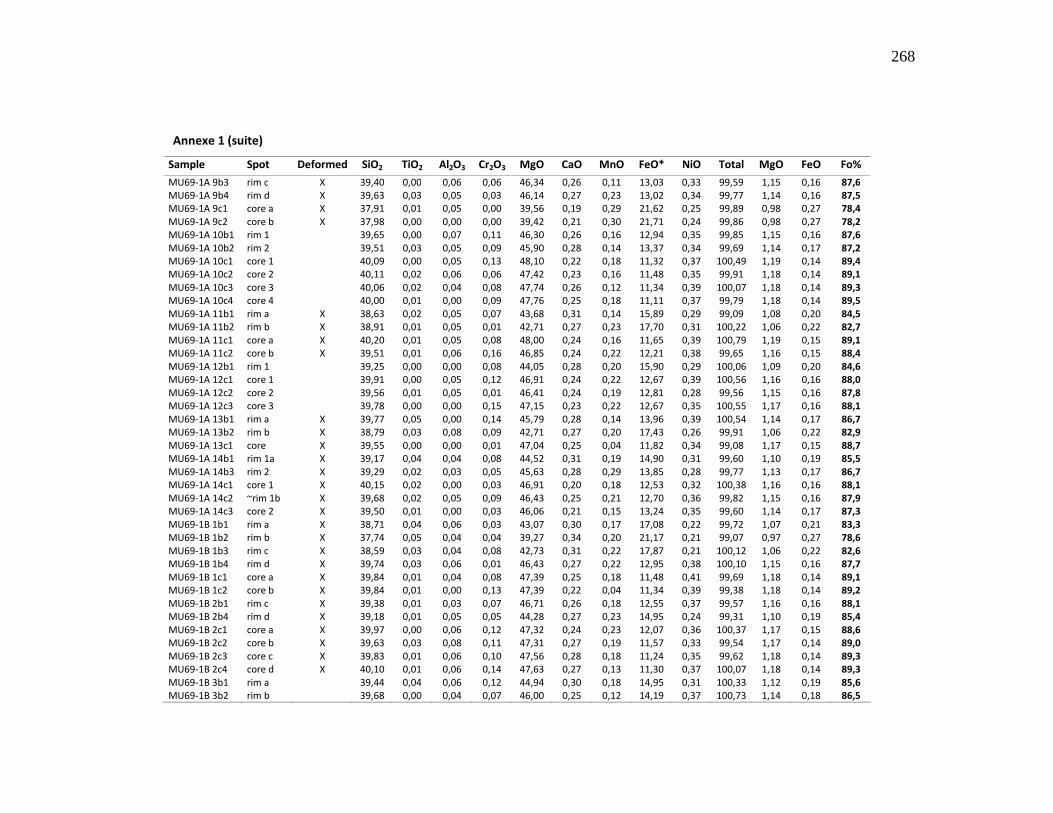
268
Annexe 1 (suite)
Sample Spot Deformed SiO2 TiO2 Al2O3 Cr2O3 MgO CaO MnO FeO* NiO Total MgO FeO Fo%
MU69-1A 9b3 rim c X 39,40 0,00 0,06 0,06 46,34 0,26 0,11 13,03 0,33 99,59 1,15 0,16 87,6 MU69-1A 9b4 rim d X 39,63 0,03 0,05 0,03 46,14 0,27 0,23 13,02 0,34 99,77 1,14 0,16 87,5 MU69-1A 9c1 core a X 37,91 0,01 0,05 0,00 39,56 0,19 0,29 21,62 0,25 99,89 0,98 0,27 78,4 MU69-1A 9c2 core b X 37,98 0,00 0,00 0,00 39,42 0,21 0,30 21,71 0,24 99,86 0,98 0,27 78,2 MU69-1A 10b1 rim 1 39,65 0,00 0,07 0,11 46,30 0,26 0,16 12,94 0,35 99,85 1,15 0,16 87,6 MU69-1A 10b2 rim 2 39,51 0,03 0,05 0,09 45,90 0,28 0,14 13,37 0,34 99,69 1,14 0,17 87,2 MU69-1A 10c1 core 1 40,09 0,00 0,05 0,13 48,10 0,22 0,18 11,32 0,37 100,49 1,19 0,14 89,4 MU69-1A 10c2 core 2 40,11 0,02 0,06 0,06 47,42 0,23 0,16 11,48 0,35 99,91 1,18 0,14 89,1 MU69-1A 10c3 core 3 40,06 0,02 0,04 0,08 47,74 0,26 0,12 11,34 0,39 100,07 1,18 0,14 89,3 MU69-1A 10c4 core 4 40,00 0,01 0,00 0,09 47,76 0,25 0,18 11,11 0,37 99,79 1,18 0,14 89,5 MU69-1A 11b1 rim a X 38,63 0,02 0,05 0,07 43,68 0,31 0,14 15,89 0,29 99,09 1,08 0,20 84,5 MU69-1A 11b2 rim b X 38,91 0,01 0,05 0,01 42,71 0,27 0,23 17,70 0,31 100,22 1,06 0,22 82,7 MU69-1A 11c1 core a X 40,20 0,01 0,05 0,08 48,00 0,24 0,16 11,65 0,39 100,79 1,19 0,15 89,1 MU69-1A 11c2 core b X 39,51 0,01 0,06 0,16 46,85 0,24 0,22 12,21 0,38 99,65 1,16 0,15 88,4 MU69-1A 12b1 rim 1 39,25 0,00 0,00 0,08 44,05 0,28 0,20 15,90 0,29 100,06 1,09 0,20 84,6 MU69-1A 12c1 core 1 39,91 0,00 0,05 0,12 46,91 0,24 0,22 12,67 0,39 100,56 1,16 0,16 88,0 MU69-1A 12c2 core 2 39,56 0,01 0,05 0,01 46,41 0,24 0,19 12,81 0,28 99,56 1,15 0,16 87,8 MU69-1A 12c3 core 3 39,78 0,00 0,00 0,15 47,15 0,23 0,22 12,67 0,35 100,55 1,17 0,16 88,1 MU69-1A 13b1 rim a X 39,77 0,05 0,00 0,14 45,79 0,28 0,14 13,96 0,39 100,54 1,14 0,17 86,7 MU69-1A 13b2 rim b X 38,79 0,03 0,08 0,09 42,71 0,27 0,20 17,43 0,26 99,91 1,06 0,22 82,9 MU69-1A 13c1 core X 39,55 0,00 0,00 0,01 47,04 0,25 0,04 11,82 0,34 99,08 1,17 0,15 88,7 MU69-1A 14b1 rim 1a X 39,17 0,04 0,04 0,08 44,52 0,31 0,19 14,90 0,31 99,60 1,10 0,19 85,5 MU69-1A 14b3 rim 2 X 39,29 0,02 0,03 0,05 45,63 0,28 0,29 13,85 0,28 99,77 1,13 0,17 86,7 MU69-1A 14c1 core 1 X 40,15 0,02 0,00 0,03 46,91 0,20 0,18 12,53 0,32 100,38 1,16 0,16 88,1 MU69-1A 14c2 ~rim 1b X 39,68 0,02 0,05 0,09 46,43 0,25 0,21 12,70 0,36 99,82 1,15 0,16 87,9 MU69-1A 14c3 core 2 X 39,50 0,01 0,00 0,03 46,06 0,21 0,15 13,24 0,35 99,60 1,14 0,17 87,3 MU69-1B 1b1 rim a X 38,71 0,04 0,06 0,03 43,07 0,30 0,17 17,08 0,22 99,72 1,07 0,21 83,3 MU69-1B 1b2 rim b X 37,74 0,05 0,04 0,04 39,27 0,34 0,20 21,17 0,21 99,07 0,97 0,27 78,6 MU69-1B 1b3 rim c X 38,59 0,03 0,04 0,08 42,73 0,31 0,22 17,87 0,21 100,12 1,06 0,22 82,6 MU69-1B 1b4 rim d X 39,74 0,03 0,06 0,01 46,43 0,27 0,22 12,95 0,38 100,10 1,15 0,16 87,7 MU69-1B 1c1 core a X 39,84 0,01 0,04 0,08 47,39 0,25 0,18 11,48 0,41 99,69 1,18 0,14 89,1 MU69-1B 1c2 core b X 39,84 0,01 0,00 0,13 47,39 0,22 0,04 11,34 0,39 99,38 1,18 0,14 89,2 MU69-1B 2b1 rim c X 39,38 0,01 0,03 0,07 46,71 0,26 0,18 12,55 0,37 99,57 1,16 0,16 88,1 MU69-1B 2b4 rim d X 39,18 0,01 0,05 0,05 44,28 0,27 0,23 14,95 0,24 99,31 1,10 0,19 85,4 MU69-1B 2c1 core a X 39,97 0,00 0,06 0,12 47,32 0,24 0,23 12,07 0,36 100,37 1,17 0,15 88,6 MU69-1B 2c2 core b X 39,63 0,03 0,08 0,11 47,31 0,27 0,19 11,57 0,33 99,54 1,17 0,14 89,0 MU69-1B 2c3 core c X 39,83 0,01 0,06 0,10 47,56 0,28 0,18 11,24 0,35 99,62 1,18 0,14 89,3 MU69-1B 2c4 core d X 40,10 0,01 0,06 0,14 47,63 0,27 0,13 11,30 0,37 100,07 1,18 0,14 89,3 MU69-1B 3b1 rim a 39,44 0,04 0,06 0,12 44,94 0,30 0,18 14,95 0,31 100,33 1,12 0,19 85,6 MU69-1B 3b2 rim b 39,68 0,00 0,04 0,07 46,00 0,25 0,12 14,19 0,37 100,73 1,14 0,18 86,5
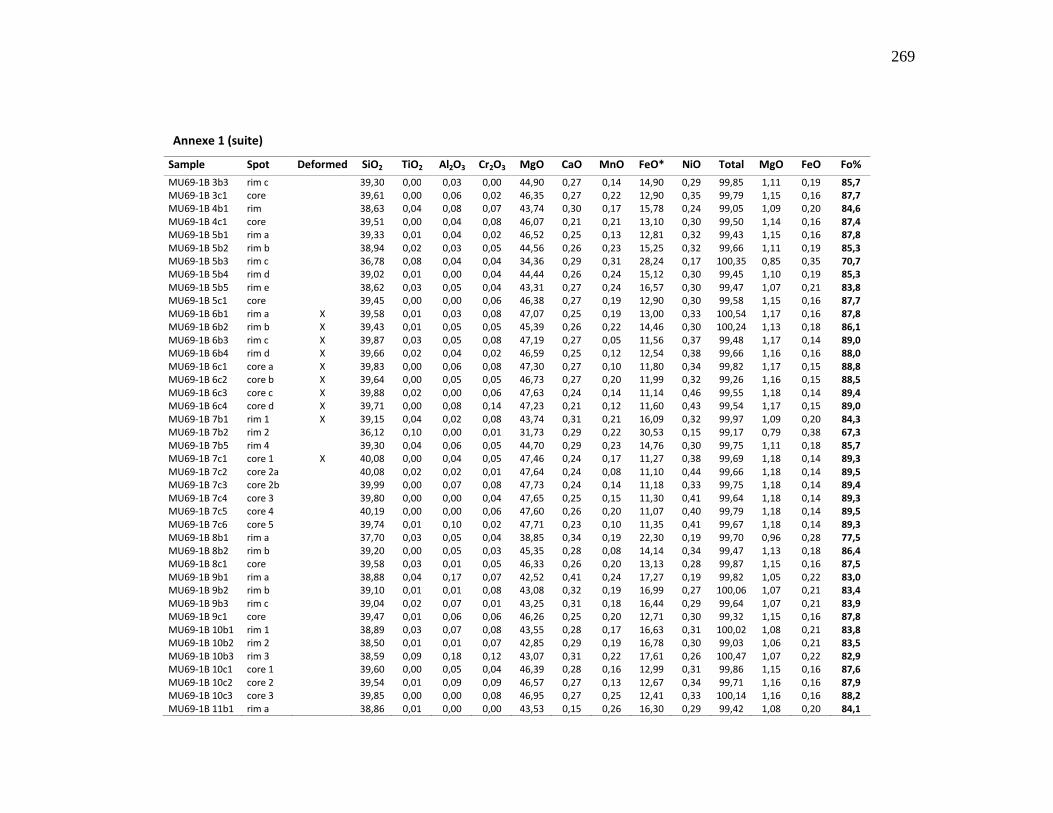
269
Annexe 1 (suite)
Sample Spot Deformed SiO2 TiO2 Al2O3 Cr2O3 MgO CaO MnO FeO* NiO Total MgO FeO Fo%
MU69-1B 3b3 rim c 39,30 0,00 0,03 0,00 44,90 0,27 0,14 14,90 0,29 99,85 1,11 0,19 85,7 MU69-1B 3c1 core 39,61 0,00 0,06 0,02 46,35 0,27 0,22 12,90 0,35 99,79 1,15 0,16 87,7 MU69-1B 4b1 rim 38,63 0,04 0,08 0,07 43,74 0,30 0,17 15,78 0,24 99,05 1,09 0,20 84,6 MU69-1B 4c1 core 39,51 0,00 0,04 0,08 46,07 0,21 0,21 13,10 0,30 99,50 1,14 0,16 87,4 MU69-1B 5b1 rim a 39,33 0,01 0,04 0,02 46,52 0,25 0,13 12,81 0,32 99,43 1,15 0,16 87,8 MU69-1B 5b2 rim b 38,94 0,02 0,03 0,05 44,56 0,26 0,23 15,25 0,32 99,66 1,11 0,19 85,3 MU69-1B 5b3 rim c 36,78 0,08 0,04 0,04 34,36 0,29 0,31 28,24 0,17 100,35 0,85 0,35 70,7 MU69-1B 5b4 rim d 39,02 0,01 0,00 0,04 44,44 0,26 0,24 15,12 0,30 99,45 1,10 0,19 85,3 MU69-1B 5b5 rim e 38,62 0,03 0,05 0,04 43,31 0,27 0,24 16,57 0,30 99,47 1,07 0,21 83,8 MU69-1B 5c1 core 39,45 0,00 0,00 0,06 46,38 0,27 0,19 12,90 0,30 99,58 1,15 0,16 87,7 MU69-1B 6b1 rim a X 39,58 0,01 0,03 0,08 47,07 0,25 0,19 13,00 0,33 100,54 1,17 0,16 87,8 MU69-1B 6b2 rim b X 39,43 0,01 0,05 0,05 45,39 0,26 0,22 14,46 0,30 100,24 1,13 0,18 86,1 MU69-1B 6b3 rim c X 39,87 0,03 0,05 0,08 47,19 0,27 0,05 11,56 0,37 99,48 1,17 0,14 89,0 MU69-1B 6b4 rim d X 39,66 0,02 0,04 0,02 46,59 0,25 0,12 12,54 0,38 99,66 1,16 0,16 88,0 MU69-1B 6c1 core a X 39,83 0,00 0,06 0,08 47,30 0,27 0,10 11,80 0,34 99,82 1,17 0,15 88,8 MU69-1B 6c2 core b X 39,64 0,00 0,05 0,05 46,73 0,27 0,20 11,99 0,32 99,26 1,16 0,15 88,5 MU69-1B 6c3 core c X 39,88 0,02 0,00 0,06 47,63 0,24 0,14 11,14 0,46 99,55 1,18 0,14 89,4 MU69-1B 6c4 core d X 39,71 0,00 0,08 0,14 47,23 0,21 0,12 11,60 0,43 99,54 1,17 0,15 89,0 MU69-1B 7b1 rim 1 X 39,15 0,04 0,02 0,08 43,74 0,31 0,21 16,09 0,32 99,97 1,09 0,20 84,3 MU69-1B 7b2 rim 2 36,12 0,10 0,00 0,01 31,73 0,29 0,22 30,53 0,15 99,17 0,79 0,38 67,3 MU69-1B 7b5 rim 4 39,30 0,04 0,06 0,05 44,70 0,29 0,23 14,76 0,30 99,75 1,11 0,18 85,7 MU69-1B 7c1 core 1 X 40,08 0,00 0,04 0,05 47,46 0,24 0,17 11,27 0,38 99,69 1,18 0,14 89,3 MU69-1B 7c2 core 2a 40,08 0,02 0,02 0,01 47,64 0,24 0,08 11,10 0,44 99,66 1,18 0,14 89,5 MU69-1B 7c3 core 2b 39,99 0,00 0,07 0,08 47,73 0,24 0,14 11,18 0,33 99,75 1,18 0,14 89,4 MU69-1B 7c4 core 3 39,80 0,00 0,00 0,04 47,65 0,25 0,15 11,30 0,41 99,64 1,18 0,14 89,3 MU69-1B 7c5 core 4 40,19 0,00 0,00 0,06 47,60 0,26 0,20 11,07 0,40 99,79 1,18 0,14 89,5 MU69-1B 7c6 core 5 39,74 0,01 0,10 0,02 47,71 0,23 0,10 11,35 0,41 99,67 1,18 0,14 89,3 MU69-1B 8b1 rim a 37,70 0,03 0,05 0,04 38,85 0,34 0,19 22,30 0,19 99,70 0,96 0,28 77,5 MU69-1B 8b2 rim b 39,20 0,00 0,05 0,03 45,35 0,28 0,08 14,14 0,34 99,47 1,13 0,18 86,4 MU69-1B 8c1 core 39,58 0,03 0,01 0,05 46,33 0,26 0,20 13,13 0,28 99,87 1,15 0,16 87,5 MU69-1B 9b1 rim a 38,88 0,04 0,17 0,07 42,52 0,41 0,24 17,27 0,19 99,82 1,05 0,22 83,0 MU69-1B 9b2 rim b 39,10 0,01 0,01 0,08 43,08 0,32 0,19 16,99 0,27 100,06 1,07 0,21 83,4 MU69-1B 9b3 rim c 39,04 0,02 0,07 0,01 43,25 0,31 0,18 16,44 0,29 99,64 1,07 0,21 83,9 MU69-1B 9c1 core 39,47 0,01 0,06 0,06 46,26 0,25 0,20 12,71 0,30 99,32 1,15 0,16 87,8 MU69-1B 10b1 rim 1 38,89 0,03 0,07 0,08 43,55 0,28 0,17 16,63 0,31 100,02 1,08 0,21 83,8 MU69-1B 10b2 rim 2 38,50 0,01 0,01 0,07 42,85 0,29 0,19 16,78 0,30 99,03 1,06 0,21 83,5 MU69-1B 10b3 rim 3 38,59 0,09 0,18 0,12 43,07 0,31 0,22 17,61 0,26 100,47 1,07 0,22 82,9 MU69-1B 10c1 core 1 39,60 0,00 0,05 0,04 46,39 0,28 0,16 12,99 0,31 99,86 1,15 0,16 87,6 MU69-1B 10c2 core 2 39,54 0,01 0,09 0,09 46,57 0,27 0,13 12,67 0,34 99,71 1,16 0,16 87,9 MU69-1B 10c3 core 3 39,85 0,00 0,00 0,08 46,95 0,27 0,25 12,41 0,33 100,14 1,16 0,16 88,2 MU69-1B 11b1 rim a 38,86 0,01 0,00 0,00 43,53 0,15 0,26 16,30 0,29 99,42 1,08 0,20 84,1
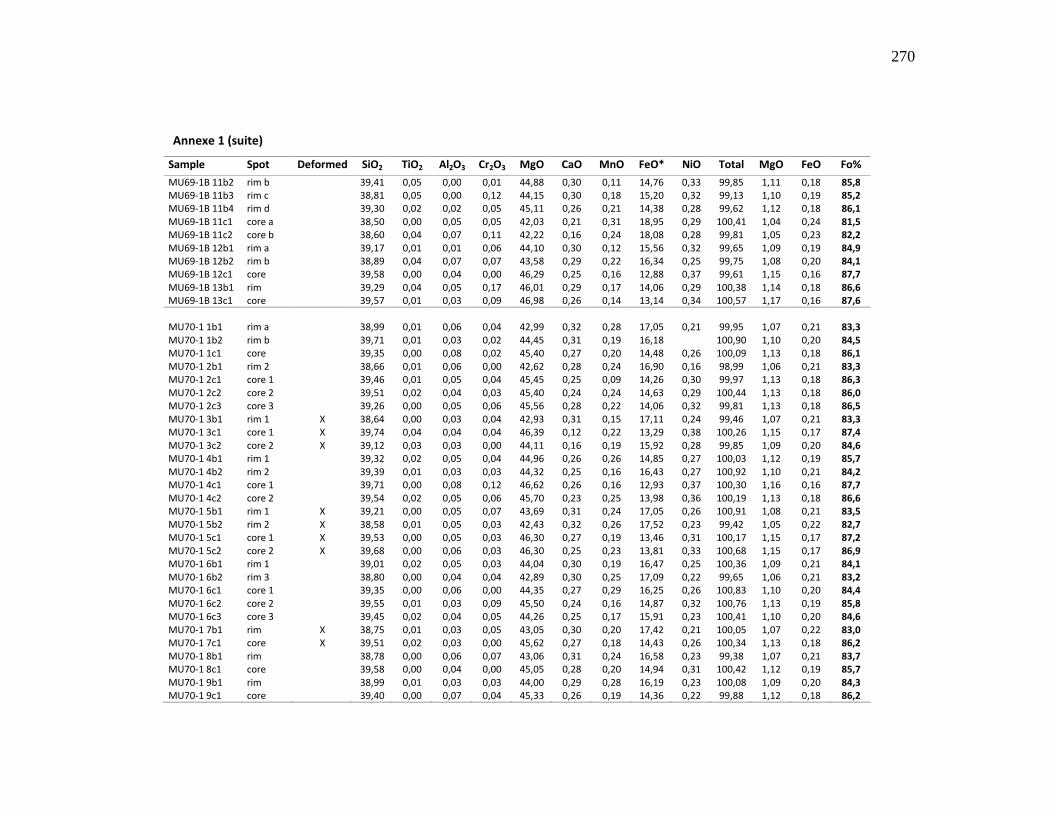
270
Annexe 1 (suite)
Sample Spot Deformed SiO2 TiO2 Al2O3 Cr2O3 MgO CaO MnO FeO* NiO Total MgO FeO Fo%
MU69-1B 11b2 rim b 39,41 0,05 0,00 0,01 44,88 0,30 0,11 14,76 0,33 99,85 1,11 0,18 85,8 MU69-1B 11b3 rim c 38,81 0,05 0,00 0,12 44,15 0,30 0,18 15,20 0,32 99,13 1,10 0,19 85,2 MU69-1B 11b4 rim d 39,30 0,02 0,02 0,05 45,11 0,26 0,21 14,38 0,28 99,62 1,12 0,18 86,1 MU69-1B 11c1 core a 38,50 0,00 0,05 0,05 42,03 0,21 0,31 18,95 0,29 100,41 1,04 0,24 81,5 MU69-1B 11c2 core b 38,60 0,04 0,07 0,11 42,22 0,16 0,24 18,08 0,28 99,81 1,05 0,23 82,2 MU69-1B 12b1 rim a 39,17 0,01 0,01 0,06 44,10 0,30 0,12 15,56 0,32 99,65 1,09 0,19 84,9 MU69-1B 12b2 rim b 38,89 0,04 0,07 0,07 43,58 0,29 0,22 16,34 0,25 99,75 1,08 0,20 84,1 MU69-1B 12c1 core 39,58 0,00 0,04 0,00 46,29 0,25 0,16 12,88 0,37 99,61 1,15 0,16 87,7 MU69-1B 13b1 rim 39,29 0,04 0,05 0,17 46,01 0,29 0,17 14,06 0,29 100,38 1,14 0,18 86,6 MU69-1B 13c1 core 39,57 0,01 0,03 0,09 46,98 0,26 0,14 13,14 0,34 100,57 1,17 0,16 87,6
MU70-1 1b1 rim a 38,99 0,01 0,06 0,04 42,99 0,32 0,28 17,05 0,21 99,95 1,07 0,21 83,3 MU70-1 1b2 rim b 39,71 0,01 0,03 0,02 44,45 0,31 0,19 16,18 100,90 1,10 0,20 84,5 MU70-1 1c1 core 39,35 0,00 0,08 0,02 45,40 0,27 0,20 14,48 0,26 100,09 1,13 0,18 86,1 MU70-1 2b1 rim 2 38,66 0,01 0,06 0,00 42,62 0,28 0,24 16,90 0,16 98,99 1,06 0,21 83,3 MU70-1 2c1 core 1 39,46 0,01 0,05 0,04 45,45 0,25 0,09 14,26 0,30 99,97 1,13 0,18 86,3 MU70-1 2c2 core 2 39,51 0,02 0,04 0,03 45,40 0,24 0,24 14,63 0,29 100,44 1,13 0,18 86,0 MU70-1 2c3 core 3 39,26 0,00 0,05 0,06 45,56 0,28 0,22 14,06 0,32 99,81 1,13 0,18 86,5 MU70-1 3b1 rim 1 X 38,64 0,00 0,03 0,04 42,93 0,31 0,15 17,11 0,24 99,46 1,07 0,21 83,3 MU70-1 3c1 core 1 X 39,74 0,04 0,04 0,04 46,39 0,12 0,22 13,29 0,38 100,26 1,15 0,17 87,4 MU70-1 3c2 core 2 X 39,12 0,03 0,03 0,00 44,11 0,16 0,19 15,92 0,28 99,85 1,09 0,20 84,6 MU70-1 4b1 rim 1 39,32 0,02 0,05 0,04 44,96 0,26 0,26 14,85 0,27 100,03 1,12 0,19 85,7 MU70-1 4b2 rim 2 39,39 0,01 0,03 0,03 44,32 0,25 0,16 16,43 0,27 100,92 1,10 0,21 84,2 MU70-1 4c1 core 1 39,71 0,00 0,08 0,12 46,62 0,26 0,16 12,93 0,37 100,30 1,16 0,16 87,7 MU70-1 4c2 core 2 39,54 0,02 0,05 0,06 45,70 0,23 0,25 13,98 0,36 100,19 1,13 0,18 86,6 MU70-1 5b1 rim 1 X 39,21 0,00 0,05 0,07 43,69 0,31 0,24 17,05 0,26 100,91 1,08 0,21 83,5 MU70-1 5b2 rim 2 X 38,58 0,01 0,05 0,03 42,43 0,32 0,26 17,52 0,23 99,42 1,05 0,22 82,7 MU70-1 5c1 core 1 X 39,53 0,00 0,05 0,03 46,30 0,27 0,19 13,46 0,31 100,17 1,15 0,17 87,2 MU70-1 5c2 core 2 X 39,68 0,00 0,06 0,03 46,30 0,25 0,23 13,81 0,33 100,68 1,15 0,17 86,9 MU70-1 6b1 rim 1 39,01 0,02 0,05 0,03 44,04 0,30 0,19 16,47 0,25 100,36 1,09 0,21 84,1 MU70-1 6b2 rim 3 38,80 0,00 0,04 0,04 42,89 0,30 0,25 17,09 0,22 99,65 1,06 0,21 83,2 MU70-1 6c1 core 1 39,35 0,00 0,06 0,00 44,35 0,27 0,29 16,25 0,26 100,83 1,10 0,20 84,4 MU70-1 6c2 core 2 39,55 0,01 0,03 0,09 45,50 0,24 0,16 14,87 0,32 100,76 1,13 0,19 85,8 MU70-1 6c3 core 3 39,45 0,02 0,04 0,05 44,26 0,25 0,17 15,91 0,23 100,41 1,10 0,20 84,6 MU70-1 7b1 rim X 38,75 0,01 0,03 0,05 43,05 0,30 0,20 17,42 0,21 100,05 1,07 0,22 83,0 MU70-1 7c1 core X 39,51 0,02 0,03 0,00 45,62 0,27 0,18 14,43 0,26 100,34 1,13 0,18 86,2 MU70-1 8b1 rim 38,78 0,00 0,06 0,07 43,06 0,31 0,24 16,58 0,23 99,38 1,07 0,21 83,7 MU70-1 8c1 core 39,58 0,00 0,04 0,00 45,05 0,28 0,20 14,94 0,31 100,42 1,12 0,19 85,7 MU70-1 9b1 rim 38,99 0,01 0,03 0,03 44,00 0,29 0,28 16,19 0,23 100,08 1,09 0,20 84,3 MU70-1 9c1 core 39,40 0,00 0,07 0,04 45,33 0,26 0,19 14,36 0,22 99,88 1,12 0,18 86,2
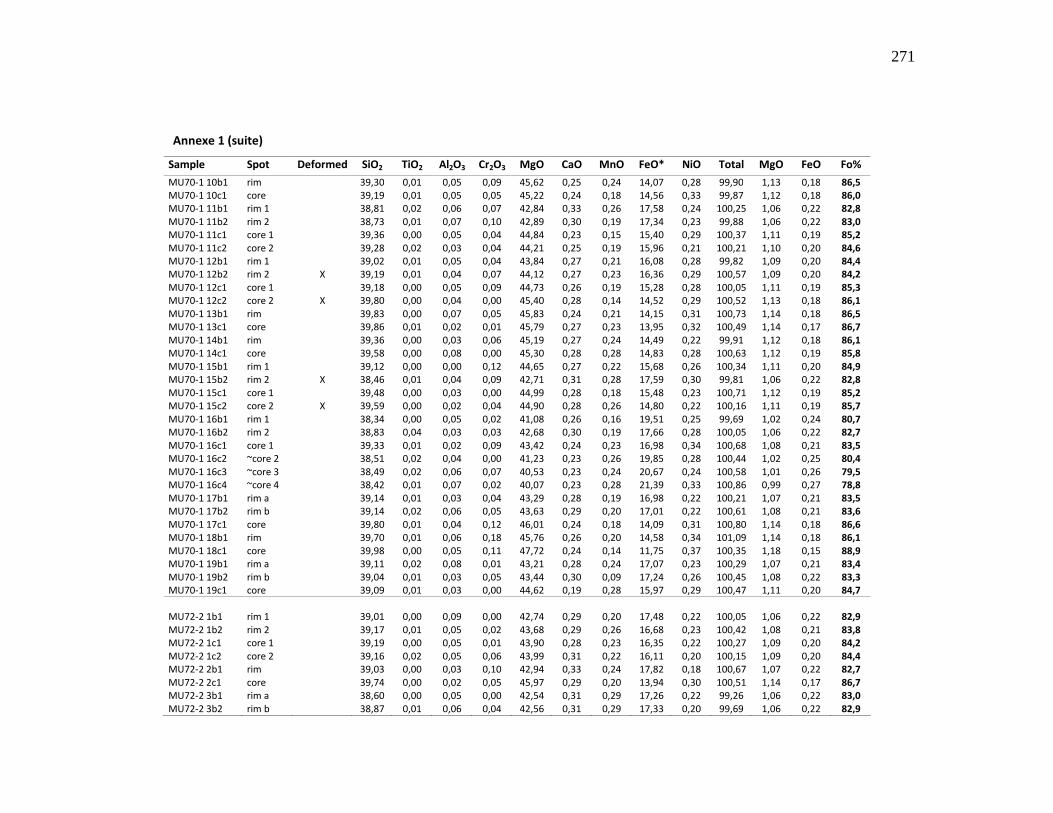
271
Annexe 1 (suite)
Sample Spot Deformed SiO2 TiO2 Al2O3 Cr2O3 MgO CaO MnO FeO* NiO Total MgO FeO Fo%
MU70-1 10b1 rim 39,30 0,01 0,05 0,09 45,62 0,25 0,24 14,07 0,28 99,90 1,13 0,18 86,5 MU70-1 10c1 core 39,19 0,01 0,05 0,05 45,22 0,24 0,18 14,56 0,33 99,87 1,12 0,18 86,0 MU70-1 11b1 rim 1 38,81 0,02 0,06 0,07 42,84 0,33 0,26 17,58 0,24 100,25 1,06 0,22 82,8 MU70-1 11b2 rim 2 38,73 0,01 0,07 0,10 42,89 0,30 0,19 17,34 0,23 99,88 1,06 0,22 83,0 MU70-1 11c1 core 1 39,36 0,00 0,05 0,04 44,84 0,23 0,15 15,40 0,29 100,37 1,11 0,19 85,2 MU70-1 11c2 core 2 39,28 0,02 0,03 0,04 44,21 0,25 0,19 15,96 0,21 100,21 1,10 0,20 84,6 MU70-1 12b1 rim 1 39,02 0,01 0,05 0,04 43,84 0,27 0,21 16,08 0,28 99,82 1,09 0,20 84,4 MU70-1 12b2 rim 2 X 39,19 0,01 0,04 0,07 44,12 0,27 0,23 16,36 0,29 100,57 1,09 0,20 84,2 MU70-1 12c1 core 1 39,18 0,00 0,05 0,09 44,73 0,26 0,19 15,28 0,28 100,05 1,11 0,19 85,3 MU70-1 12c2 core 2 X 39,80 0,00 0,04 0,00 45,40 0,28 0,14 14,52 0,29 100,52 1,13 0,18 86,1 MU70-1 13b1 rim 39,83 0,00 0,07 0,05 45,83 0,24 0,21 14,15 0,31 100,73 1,14 0,18 86,5 MU70-1 13c1 core 39,86 0,01 0,02 0,01 45,79 0,27 0,23 13,95 0,32 100,49 1,14 0,17 86,7 MU70-1 14b1 rim 39,36 0,00 0,03 0,06 45,19 0,27 0,24 14,49 0,22 99,91 1,12 0,18 86,1 MU70-1 14c1 core 39,58 0,00 0,08 0,00 45,30 0,28 0,28 14,83 0,28 100,63 1,12 0,19 85,8 MU70-1 15b1 rim 1 39,12 0,00 0,00 0,12 44,65 0,27 0,22 15,68 0,26 100,34 1,11 0,20 84,9 MU70-1 15b2 rim 2 X 38,46 0,01 0,04 0,09 42,71 0,31 0,28 17,59 0,30 99,81 1,06 0,22 82,8 MU70-1 15c1 core 1 39,48 0,00 0,03 0,00 44,99 0,28 0,18 15,48 0,23 100,71 1,12 0,19 85,2 MU70-1 15c2 core 2 X 39,59 0,00 0,02 0,04 44,90 0,28 0,26 14,80 0,22 100,16 1,11 0,19 85,7 MU70-1 16b1 rim 1 38,34 0,00 0,05 0,02 41,08 0,26 0,16 19,51 0,25 99,69 1,02 0,24 80,7 MU70-1 16b2 rim 2 38,83 0,04 0,03 0,03 42,68 0,30 0,19 17,66 0,28 100,05 1,06 0,22 82,7 MU70-1 16c1 core 1 39,33 0,01 0,02 0,09 43,42 0,24 0,23 16,98 0,34 100,68 1,08 0,21 83,5 MU70-1 16c2 ~core 2 38,51 0,02 0,04 0,00 41,23 0,23 0,26 19,85 0,28 100,44 1,02 0,25 80,4 MU70-1 16c3 ~core 3 38,49 0,02 0,06 0,07 40,53 0,23 0,24 20,67 0,24 100,58 1,01 0,26 79,5 MU70-1 16c4 ~core 4 38,42 0,01 0,07 0,02 40,07 0,23 0,28 21,39 0,33 100,86 0,99 0,27 78,8 MU70-1 17b1 rim a 39,14 0,01 0,03 0,04 43,29 0,28 0,19 16,98 0,22 100,21 1,07 0,21 83,5 MU70-1 17b2 rim b 39,14 0,02 0,06 0,05 43,63 0,29 0,20 17,01 0,22 100,61 1,08 0,21 83,6 MU70-1 17c1 core 39,80 0,01 0,04 0,12 46,01 0,24 0,18 14,09 0,31 100,80 1,14 0,18 86,6 MU70-1 18b1 rim 39,70 0,01 0,06 0,18 45,76 0,26 0,20 14,58 0,34 101,09 1,14 0,18 86,1 MU70-1 18c1 core 39,98 0,00 0,05 0,11 47,72 0,24 0,14 11,75 0,37 100,35 1,18 0,15 88,9 MU70-1 19b1 rim a 39,11 0,02 0,08 0,01 43,21 0,28 0,24 17,07 0,23 100,29 1,07 0,21 83,4 MU70-1 19b2 rim b 39,04 0,01 0,03 0,05 43,44 0,30 0,09 17,24 0,26 100,45 1,08 0,22 83,3 MU70-1 19c1 core 39,09 0,01 0,03 0,00 44,62 0,19 0,28 15,97 0,29 100,47 1,11 0,20 84,7
MU72-2 1b1 rim 1 39,01 0,00 0,09 0,00 42,74 0,29 0,20 17,48 0,22 100,05 1,06 0,22 82,9 MU72-2 1b2 rim 2 39,17 0,01 0,05 0,02 43,68 0,29 0,26 16,68 0,23 100,42 1,08 0,21 83,8 MU72-2 1c1 core 1 39,19 0,00 0,05 0,01 43,90 0,28 0,23 16,35 0,22 100,27 1,09 0,20 84,2 MU72-2 1c2 core 2 39,16 0,02 0,05 0,06 43,99 0,31 0,22 16,11 0,20 100,15 1,09 0,20 84,4 MU72-2 2b1 rim 39,03 0,00 0,03 0,10 42,94 0,33 0,24 17,82 0,18 100,67 1,07 0,22 82,7 MU72-2 2c1 core 39,74 0,00 0,02 0,05 45,97 0,29 0,20 13,94 0,30 100,51 1,14 0,17 86,7 MU72-2 3b1 rim a 38,60 0,00 0,05 0,00 42,54 0,31 0,29 17,26 0,22 99,26 1,06 0,22 83,0 MU72-2 3b2 rim b 38,87 0,01 0,06 0,04 42,56 0,31 0,29 17,33 0,20 99,69 1,06 0,22 82,9
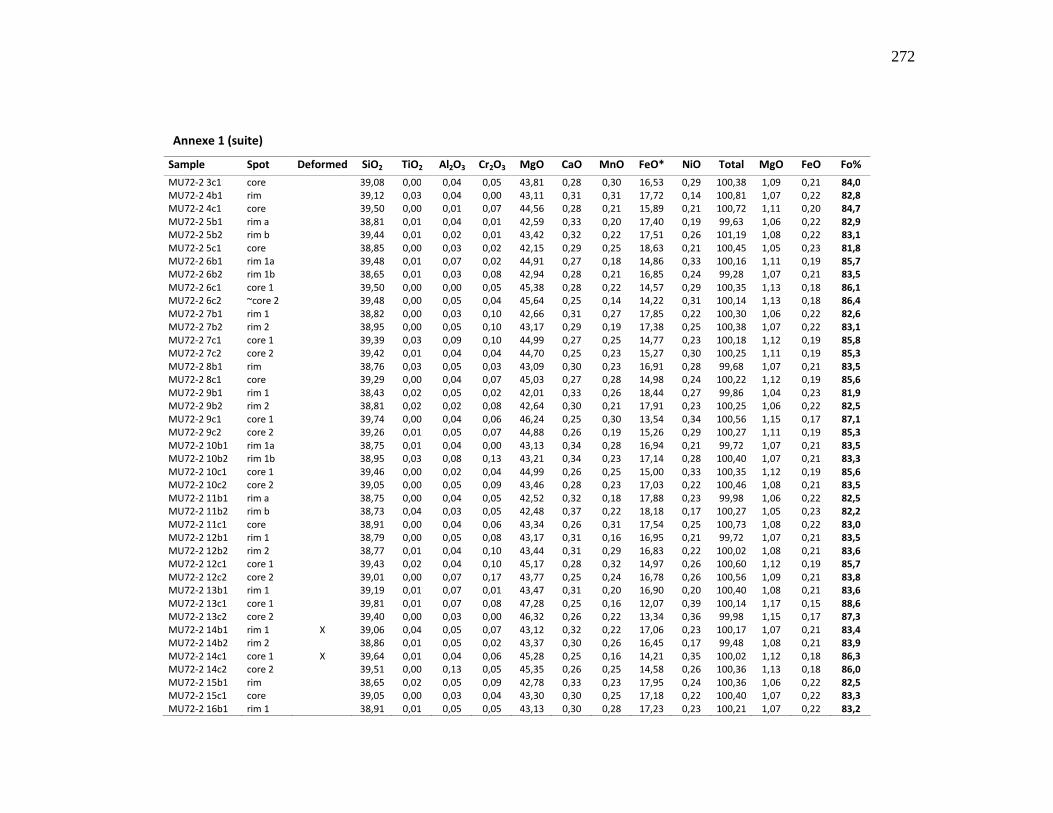
272
Annexe 1 (suite)
Sample Spot Deformed SiO2 TiO2 Al2O3 Cr2O3 MgO CaO MnO FeO* NiO Total MgO FeO Fo%
MU72-2 3c1 core 39,08 0,00 0,04 0,05 43,81 0,28 0,30 16,53 0,29 100,38 1,09 0,21 84,0 MU72-2 4b1 rim 39,12 0,03 0,04 0,00 43,11 0,31 0,31 17,72 0,14 100,81 1,07 0,22 82,8 MU72-2 4c1 core 39,50 0,00 0,01 0,07 44,56 0,28 0,21 15,89 0,21 100,72 1,11 0,20 84,7 MU72-2 5b1 rim a 38,81 0,01 0,04 0,01 42,59 0,33 0,20 17,40 0,19 99,63 1,06 0,22 82,9 MU72-2 5b2 rim b 39,44 0,01 0,02 0,01 43,42 0,32 0,22 17,51 0,26 101,19 1,08 0,22 83,1 MU72-2 5c1 core 38,85 0,00 0,03 0,02 42,15 0,29 0,25 18,63 0,21 100,45 1,05 0,23 81,8 MU72-2 6b1 rim 1a 39,48 0,01 0,07 0,02 44,91 0,27 0,18 14,86 0,33 100,16 1,11 0,19 85,7 MU72-2 6b2 rim 1b 38,65 0,01 0,03 0,08 42,94 0,28 0,21 16,85 0,24 99,28 1,07 0,21 83,5 MU72-2 6c1 core 1 39,50 0,00 0,00 0,05 45,38 0,28 0,22 14,57 0,29 100,35 1,13 0,18 86,1 MU72-2 6c2 ~core 2 39,48 0,00 0,05 0,04 45,64 0,25 0,14 14,22 0,31 100,14 1,13 0,18 86,4 MU72-2 7b1 rim 1 38,82 0,00 0,03 0,10 42,66 0,31 0,27 17,85 0,22 100,30 1,06 0,22 82,6 MU72-2 7b2 rim 2 38,95 0,00 0,05 0,10 43,17 0,29 0,19 17,38 0,25 100,38 1,07 0,22 83,1 MU72-2 7c1 core 1 39,39 0,03 0,09 0,10 44,99 0,27 0,25 14,77 0,23 100,18 1,12 0,19 85,8 MU72-2 7c2 core 2 39,42 0,01 0,04 0,04 44,70 0,25 0,23 15,27 0,30 100,25 1,11 0,19 85,3 MU72-2 8b1 rim 38,76 0,03 0,05 0,03 43,09 0,30 0,23 16,91 0,28 99,68 1,07 0,21 83,5 MU72-2 8c1 core 39,29 0,00 0,04 0,07 45,03 0,27 0,28 14,98 0,24 100,22 1,12 0,19 85,6 MU72-2 9b1 rim 1 38,43 0,02 0,05 0,02 42,01 0,33 0,26 18,44 0,27 99,86 1,04 0,23 81,9 MU72-2 9b2 rim 2 38,81 0,02 0,02 0,08 42,64 0,30 0,21 17,91 0,23 100,25 1,06 0,22 82,5 MU72-2 9c1 core 1 39,74 0,00 0,04 0,06 46,24 0,25 0,30 13,54 0,34 100,56 1,15 0,17 87,1 MU72-2 9c2 core 2 39,26 0,01 0,05 0,07 44,88 0,26 0,19 15,26 0,29 100,27 1,11 0,19 85,3 MU72-2 10b1 rim 1a 38,75 0,01 0,04 0,00 43,13 0,34 0,28 16,94 0,21 99,72 1,07 0,21 83,5 MU72-2 10b2 rim 1b 38,95 0,03 0,08 0,13 43,21 0,34 0,23 17,14 0,28 100,40 1,07 0,21 83,3 MU72-2 10c1 core 1 39,46 0,00 0,02 0,04 44,99 0,26 0,25 15,00 0,33 100,35 1,12 0,19 85,6 MU72-2 10c2 core 2 39,05 0,00 0,05 0,09 43,46 0,28 0,23 17,03 0,22 100,46 1,08 0,21 83,5 MU72-2 11b1 rim a 38,75 0,00 0,04 0,05 42,52 0,32 0,18 17,88 0,23 99,98 1,06 0,22 82,5 MU72-2 11b2 rim b 38,73 0,04 0,03 0,05 42,48 0,37 0,22 18,18 0,17 100,27 1,05 0,23 82,2 MU72-2 11c1 core 38,91 0,00 0,04 0,06 43,34 0,26 0,31 17,54 0,25 100,73 1,08 0,22 83,0 MU72-2 12b1 rim 1 38,79 0,00 0,05 0,08 43,17 0,31 0,16 16,95 0,21 99,72 1,07 0,21 83,5 MU72-2 12b2 rim 2 38,77 0,01 0,04 0,10 43,44 0,31 0,29 16,83 0,22 100,02 1,08 0,21 83,6 MU72-2 12c1 core 1 39,43 0,02 0,04 0,10 45,17 0,28 0,32 14,97 0,26 100,60 1,12 0,19 85,7 MU72-2 12c2 core 2 39,01 0,00 0,07 0,17 43,77 0,25 0,24 16,78 0,26 100,56 1,09 0,21 83,8 MU72-2 13b1 rim 1 39,19 0,01 0,07 0,01 43,47 0,31 0,20 16,90 0,20 100,40 1,08 0,21 83,6 MU72-2 13c1 core 1 39,81 0,01 0,07 0,08 47,28 0,25 0,16 12,07 0,39 100,14 1,17 0,15 88,6 MU72-2 13c2 core 2 39,40 0,00 0,03 0,00 46,32 0,26 0,22 13,34 0,36 99,98 1,15 0,17 87,3 MU72-2 14b1 rim 1 X 39,06 0,04 0,05 0,07 43,12 0,32 0,22 17,06 0,23 100,17 1,07 0,21 83,4 MU72-2 14b2 rim 2 38,86 0,01 0,05 0,02 43,37 0,30 0,26 16,45 0,17 99,48 1,08 0,21 83,9 MU72-2 14c1 core 1 X 39,64 0,01 0,04 0,06 45,28 0,25 0,16 14,21 0,35 100,02 1,12 0,18 86,3 MU72-2 14c2 core 2 39,51 0,00 0,13 0,05 45,35 0,26 0,25 14,58 0,26 100,36 1,13 0,18 86,0 MU72-2 15b1 rim 38,65 0,02 0,05 0,09 42,78 0,33 0,23 17,95 0,24 100,36 1,06 0,22 82,5 MU72-2 15c1 core 39,05 0,00 0,03 0,04 43,30 0,30 0,25 17,18 0,22 100,40 1,07 0,22 83,3 MU72-2 16b1 rim 1 38,91 0,01 0,05 0,05 43,13 0,30 0,28 17,23 0,23 100,21 1,07 0,22 83,2
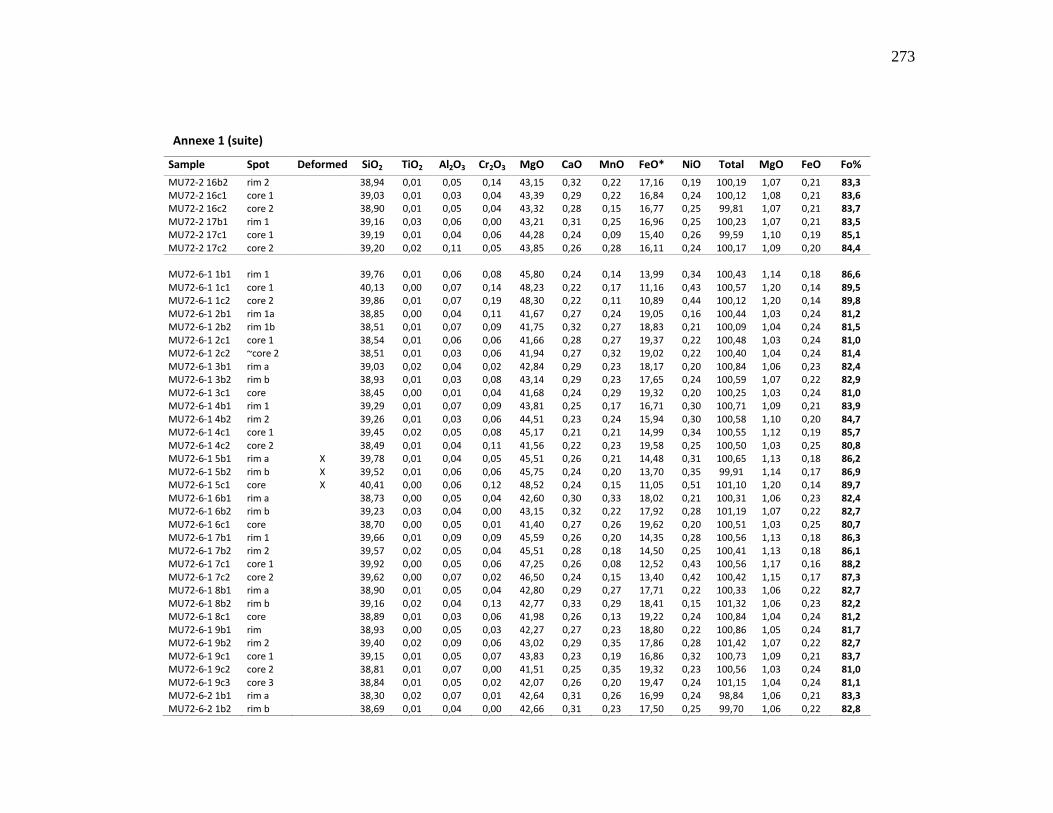
273
Annexe 1 (suite)
Sample Spot Deformed SiO2 TiO2 Al2O3 Cr2O3 MgO CaO MnO FeO* NiO Total MgO FeO Fo%
MU72-2 16b2 rim 2 38,94 0,01 0,05 0,14 43,15 0,32 0,22 17,16 0,19 100,19 1,07 0,21 83,3 MU72-2 16c1 core 1 39,03 0,01 0,03 0,04 43,39 0,29 0,22 16,84 0,24 100,12 1,08 0,21 83,6 MU72-2 16c2 core 2 38,90 0,01 0,05 0,04 43,32 0,28 0,15 16,77 0,25 99,81 1,07 0,21 83,7 MU72-2 17b1 rim 1 39,16 0,03 0,06 0,00 43,21 0,31 0,25 16,96 0,25 100,23 1,07 0,21 83,5 MU72-2 17c1 core 1 39,19 0,01 0,04 0,06 44,28 0,24 0,09 15,40 0,26 99,59 1,10 0,19 85,1 MU72-2 17c2 core 2 39,20 0,02 0,11 0,05 43,85 0,26 0,28 16,11 0,24 100,17 1,09 0,20 84,4 MU72-6-1 1b1 rim 1 39,76 0,01 0,06 0,08 45,80 0,24 0,14 13,99 0,34 100,43 1,14 0,18 86,6 MU72-6-1 1c1 core 1 40,13 0,00 0,07 0,14 48,23 0,22 0,17 11,16 0,43 100,57 1,20 0,14 89,5 MU72-6-1 1c2 core 2 39,86 0,01 0,07 0,19 48,30 0,22 0,11 10,89 0,44 100,12 1,20 0,14 89,8 MU72-6-1 2b1 rim 1a 38,85 0,00 0,04 0,11 41,67 0,27 0,24 19,05 0,16 100,44 1,03 0,24 81,2 MU72-6-1 2b2 rim 1b 38,51 0,01 0,07 0,09 41,75 0,32 0,27 18,83 0,21 100,09 1,04 0,24 81,5 MU72-6-1 2c1 core 1 38,54 0,01 0,06 0,06 41,66 0,28 0,27 19,37 0,22 100,48 1,03 0,24 81,0 MU72-6-1 2c2 ~core 2 38,51 0,01 0,03 0,06 41,94 0,27 0,32 19,02 0,22 100,40 1,04 0,24 81,4 MU72-6-1 3b1 rim a 39,03 0,02 0,04 0,02 42,84 0,29 0,23 18,17 0,20 100,84 1,06 0,23 82,4 MU72-6-1 3b2 rim b 38,93 0,01 0,03 0,08 43,14 0,29 0,23 17,65 0,24 100,59 1,07 0,22 82,9 MU72-6-1 3c1 core 38,45 0,00 0,01 0,04 41,68 0,24 0,29 19,32 0,20 100,25 1,03 0,24 81,0 MU72-6-1 4b1 rim 1 39,29 0,01 0,07 0,09 43,81 0,25 0,17 16,71 0,30 100,71 1,09 0,21 83,9 MU72-6-1 4b2 rim 2 39,26 0,01 0,03 0,06 44,51 0,23 0,24 15,94 0,30 100,58 1,10 0,20 84,7 MU72-6-1 4c1 core 1 39,45 0,02 0,05 0,08 45,17 0,21 0,21 14,99 0,34 100,55 1,12 0,19 85,7 MU72-6-1 4c2 core 2 38,49 0,01 0,04 0,11 41,56 0,22 0,23 19,58 0,25 100,50 1,03 0,25 80,8 MU72-6-1 5b1 rim a X 39,78 0,01 0,04 0,05 45,51 0,26 0,21 14,48 0,31 100,65 1,13 0,18 86,2 MU72-6-1 5b2 rim b X 39,52 0,01 0,06 0,06 45,75 0,24 0,20 13,70 0,35 99,91 1,14 0,17 86,9 MU72-6-1 5c1 core X 40,41 0,00 0,06 0,12 48,52 0,24 0,15 11,05 0,51 101,10 1,20 0,14 89,7 MU72-6-1 6b1 rim a 38,73 0,00 0,05 0,04 42,60 0,30 0,33 18,02 0,21 100,31 1,06 0,23 82,4 MU72-6-1 6b2 rim b 39,23 0,03 0,04 0,00 43,15 0,32 0,22 17,92 0,28 101,19 1,07 0,22 82,7 MU72-6-1 6c1 core 38,70 0,00 0,05 0,01 41,40 0,27 0,26 19,62 0,20 100,51 1,03 0,25 80,7 MU72-6-1 7b1 rim 1 39,66 0,01 0,09 0,09 45,59 0,26 0,20 14,35 0,28 100,56 1,13 0,18 86,3 MU72-6-1 7b2 rim 2 39,57 0,02 0,05 0,04 45,51 0,28 0,18 14,50 0,25 100,41 1,13 0,18 86,1 MU72-6-1 7c1 core 1 39,92 0,00 0,05 0,06 47,25 0,26 0,08 12,52 0,43 100,56 1,17 0,16 88,2 MU72-6-1 7c2 core 2 39,62 0,00 0,07 0,02 46,50 0,24 0,15 13,40 0,42 100,42 1,15 0,17 87,3 MU72-6-1 8b1 rim a 38,90 0,01 0,05 0,04 42,80 0,29 0,27 17,71 0,22 100,33 1,06 0,22 82,7 MU72-6-1 8b2 rim b 39,16 0,02 0,04 0,13 42,77 0,33 0,29 18,41 0,15 101,32 1,06 0,23 82,2 MU72-6-1 8c1 core 38,89 0,01 0,03 0,06 41,98 0,26 0,13 19,22 0,24 100,84 1,04 0,24 81,2 MU72-6-1 9b1 rim 38,93 0,00 0,05 0,03 42,27 0,27 0,23 18,80 0,22 100,86 1,05 0,24 81,7 MU72-6-1 9b2 rim 2 39,40 0,02 0,09 0,06 43,02 0,29 0,35 17,86 0,28 101,42 1,07 0,22 82,7 MU72-6-1 9c1 core 1 39,15 0,01 0,05 0,07 43,83 0,23 0,19 16,86 0,32 100,73 1,09 0,21 83,7 MU72-6-1 9c2 core 2 38,81 0,01 0,07 0,00 41,51 0,25 0,35 19,32 0,23 100,56 1,03 0,24 81,0 MU72-6-1 9c3 core 3 38,84 0,01 0,05 0,02 42,07 0,26 0,20 19,47 0,24 101,15 1,04 0,24 81,1 MU72-6-2 1b1 rim a 38,30 0,02 0,07 0,01 42,64 0,31 0,26 16,99 0,24 98,84 1,06 0,21 83,3 MU72-6-2 1b2 rim b 38,69 0,01 0,04 0,00 42,66 0,31 0,23 17,50 0,25 99,70 1,06 0,22 82,8
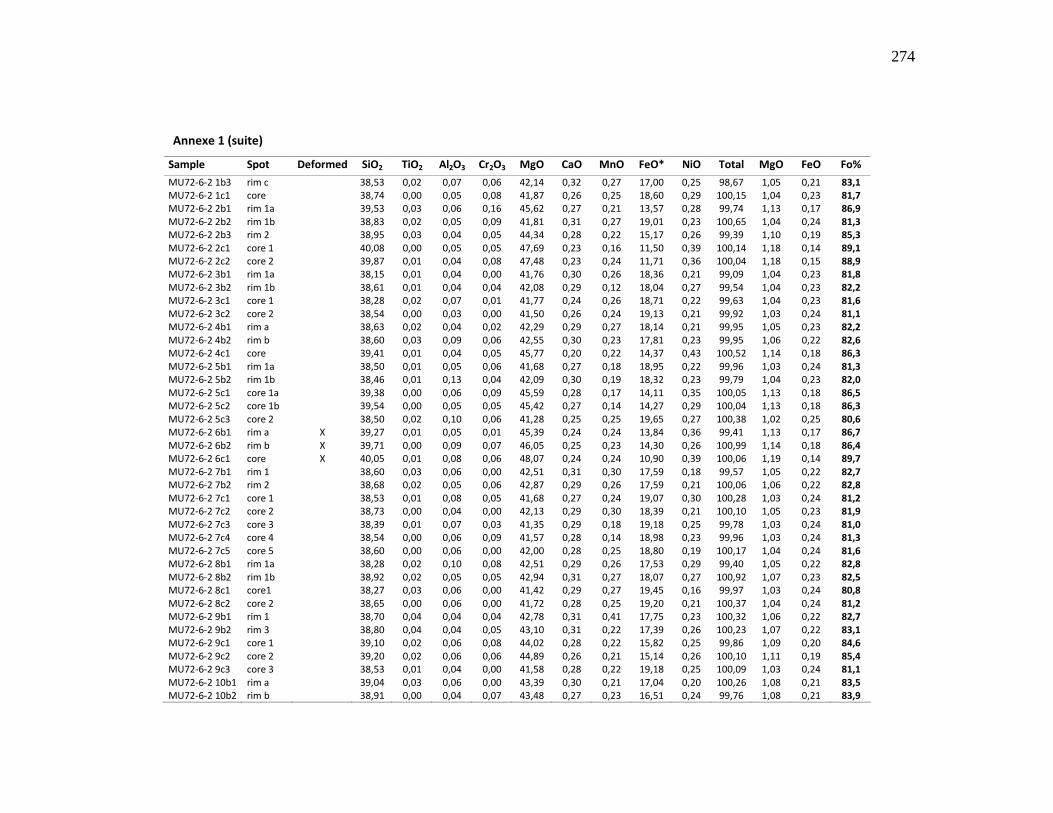
274
Annexe 1 (suite)
Sample Spot Deformed SiO2 TiO2 Al2O3 Cr2O3 MgO CaO MnO FeO* NiO Total MgO FeO Fo%
MU72-6-2 1b3 rim c 38,53 0,02 0,07 0,06 42,14 0,32 0,27 17,00 0,25 98,67 1,05 0,21 83,1 MU72-6-2 1c1 core 38,74 0,00 0,05 0,08 41,87 0,26 0,25 18,60 0,29 100,15 1,04 0,23 81,7 MU72-6-2 2b1 rim 1a 39,53 0,03 0,06 0,16 45,62 0,27 0,21 13,57 0,28 99,74 1,13 0,17 86,9 MU72-6-2 2b2 rim 1b 38,83 0,02 0,05 0,09 41,81 0,31 0,27 19,01 0,23 100,65 1,04 0,24 81,3 MU72-6-2 2b3 rim 2 38,95 0,03 0,04 0,05 44,34 0,28 0,22 15,17 0,26 99,39 1,10 0,19 85,3 MU72-6-2 2c1 core 1 40,08 0,00 0,05 0,05 47,69 0,23 0,16 11,50 0,39 100,14 1,18 0,14 89,1 MU72-6-2 2c2 core 2 39,87 0,01 0,04 0,08 47,48 0,23 0,24 11,71 0,36 100,04 1,18 0,15 88,9 MU72-6-2 3b1 rim 1a 38,15 0,01 0,04 0,00 41,76 0,30 0,26 18,36 0,21 99,09 1,04 0,23 81,8 MU72-6-2 3b2 rim 1b 38,61 0,01 0,04 0,04 42,08 0,29 0,12 18,04 0,27 99,54 1,04 0,23 82,2 MU72-6-2 3c1 core 1 38,28 0,02 0,07 0,01 41,77 0,24 0,26 18,71 0,22 99,63 1,04 0,23 81,6 MU72-6-2 3c2 core 2 38,54 0,00 0,03 0,00 41,50 0,26 0,24 19,13 0,21 99,92 1,03 0,24 81,1 MU72-6-2 4b1 rim a 38,63 0,02 0,04 0,02 42,29 0,29 0,27 18,14 0,21 99,95 1,05 0,23 82,2 MU72-6-2 4b2 rim b 38,60 0,03 0,09 0,06 42,55 0,30 0,23 17,81 0,23 99,95 1,06 0,22 82,6 MU72-6-2 4c1 core 39,41 0,01 0,04 0,05 45,77 0,20 0,22 14,37 0,43 100,52 1,14 0,18 86,3 MU72-6-2 5b1 rim 1a 38,50 0,01 0,05 0,06 41,68 0,27 0,18 18,95 0,22 99,96 1,03 0,24 81,3 MU72-6-2 5b2 rim 1b 38,46 0,01 0,13 0,04 42,09 0,30 0,19 18,32 0,23 99,79 1,04 0,23 82,0 MU72-6-2 5c1 core 1a 39,38 0,00 0,06 0,09 45,59 0,28 0,17 14,11 0,35 100,05 1,13 0,18 86,5 MU72-6-2 5c2 core 1b 39,54 0,00 0,05 0,05 45,42 0,27 0,14 14,27 0,29 100,04 1,13 0,18 86,3 MU72-6-2 5c3 core 2 38,50 0,02 0,10 0,06 41,28 0,25 0,25 19,65 0,27 100,38 1,02 0,25 80,6 MU72-6-2 6b1 rim a X 39,27 0,01 0,05 0,01 45,39 0,24 0,24 13,84 0,36 99,41 1,13 0,17 86,7 MU72-6-2 6b2 rim b X 39,71 0,00 0,09 0,07 46,05 0,25 0,23 14,30 0,26 100,99 1,14 0,18 86,4 MU72-6-2 6c1 core X 40,05 0,01 0,08 0,06 48,07 0,24 0,24 10,90 0,39 100,06 1,19 0,14 89,7 MU72-6-2 7b1 rim 1 38,60 0,03 0,06 0,00 42,51 0,31 0,30 17,59 0,18 99,57 1,05 0,22 82,7 MU72-6-2 7b2 rim 2 38,68 0,02 0,05 0,06 42,87 0,29 0,26 17,59 0,21 100,06 1,06 0,22 82,8 MU72-6-2 7c1 core 1 38,53 0,01 0,08 0,05 41,68 0,27 0,24 19,07 0,30 100,28 1,03 0,24 81,2 MU72-6-2 7c2 core 2 38,73 0,00 0,04 0,00 42,13 0,29 0,30 18,39 0,21 100,10 1,05 0,23 81,9 MU72-6-2 7c3 core 3 38,39 0,01 0,07 0,03 41,35 0,29 0,18 19,18 0,25 99,78 1,03 0,24 81,0 MU72-6-2 7c4 core 4 38,54 0,00 0,06 0,09 41,57 0,28 0,14 18,98 0,23 99,96 1,03 0,24 81,3 MU72-6-2 7c5 core 5 38,60 0,00 0,06 0,00 42,00 0,28 0,25 18,80 0,19 100,17 1,04 0,24 81,6 MU72-6-2 8b1 rim 1a 38,28 0,02 0,10 0,08 42,51 0,29 0,26 17,53 0,29 99,40 1,05 0,22 82,8 MU72-6-2 8b2 rim 1b 38,92 0,02 0,05 0,05 42,94 0,31 0,27 18,07 0,27 100,92 1,07 0,23 82,5 MU72-6-2 8c1 core1 38,27 0,03 0,06 0,00 41,42 0,29 0,27 19,45 0,16 99,97 1,03 0,24 80,8 MU72-6-2 8c2 core 2 38,65 0,00 0,06 0,00 41,72 0,28 0,25 19,20 0,21 100,37 1,04 0,24 81,2 MU72-6-2 9b1 rim 1 38,70 0,04 0,04 0,04 42,78 0,31 0,41 17,75 0,23 100,32 1,06 0,22 82,7 MU72-6-2 9b2 rim 3 38,80 0,04 0,04 0,05 43,10 0,31 0,22 17,39 0,26 100,23 1,07 0,22 83,1 MU72-6-2 9c1 core 1 39,10 0,02 0,06 0,08 44,02 0,28 0,22 15,82 0,25 99,86 1,09 0,20 84,6 MU72-6-2 9c2 core 2 39,20 0,02 0,06 0,06 44,89 0,26 0,21 15,14 0,26 100,10 1,11 0,19 85,4 MU72-6-2 9c3 core 3 38,53 0,01 0,04 0,00 41,58 0,28 0,22 19,18 0,25 100,09 1,03 0,24 81,1 MU72-6-2 10b1 rim a 39,04 0,03 0,06 0,00 43,39 0,30 0,21 17,04 0,20 100,26 1,08 0,21 83,5 MU72-6-2 10b2 rim b 38,91 0,00 0,04 0,07 43,48 0,27 0,23 16,51 0,24 99,76 1,08 0,21 83,9
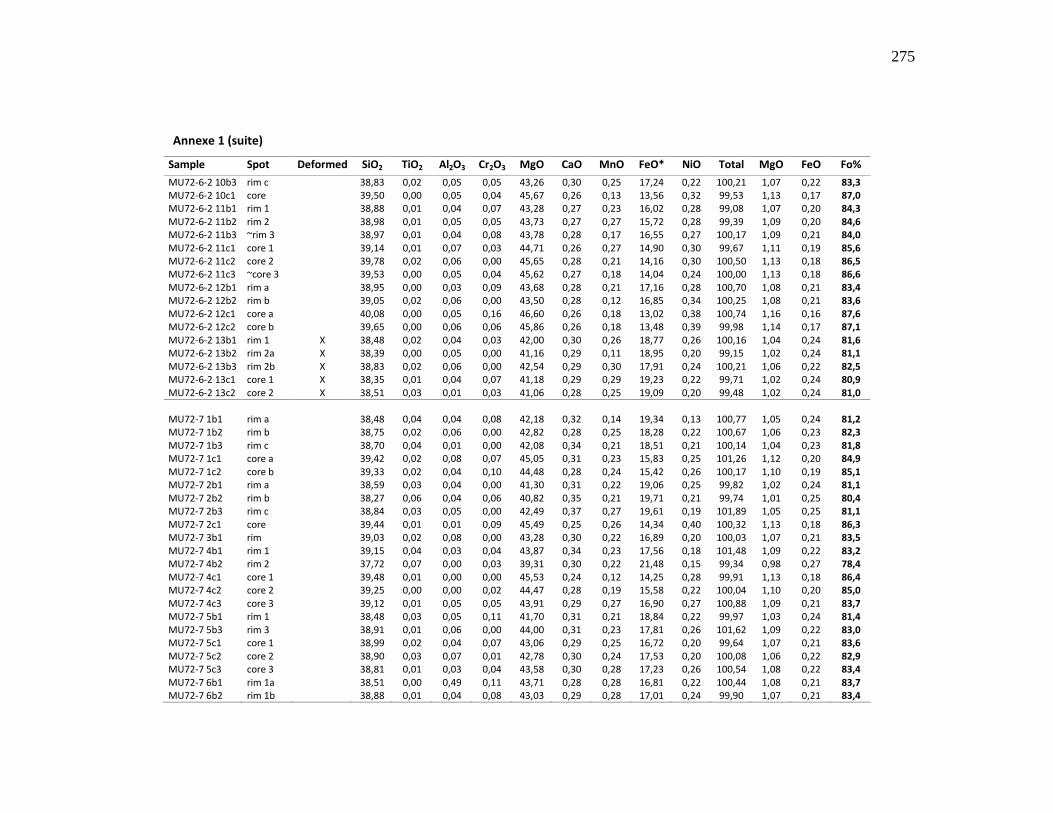
275
Annexe 1 (suite)
Sample Spot Deformed SiO2 TiO2 Al2O3 Cr2O3 MgO CaO MnO FeO* NiO Total MgO FeO Fo%
MU72-6-2 10b3 rim c 38,83 0,02 0,05 0,05 43,26 0,30 0,25 17,24 0,22 100,21 1,07 0,22 83,3 MU72-6-2 10c1 core 39,50 0,00 0,05 0,04 45,67 0,26 0,13 13,56 0,32 99,53 1,13 0,17 87,0 MU72-6-2 11b1 rim 1 38,88 0,01 0,04 0,07 43,28 0,27 0,23 16,02 0,28 99,08 1,07 0,20 84,3 MU72-6-2 11b2 rim 2 38,98 0,01 0,05 0,05 43,73 0,27 0,27 15,72 0,28 99,39 1,09 0,20 84,6 MU72-6-2 11b3 ~rim 3 38,97 0,01 0,04 0,08 43,78 0,28 0,17 16,55 0,27 100,17 1,09 0,21 84,0 MU72-6-2 11c1 core 1 39,14 0,01 0,07 0,03 44,71 0,26 0,27 14,90 0,30 99,67 1,11 0,19 85,6 MU72-6-2 11c2 core 2 39,78 0,02 0,06 0,00 45,65 0,28 0,21 14,16 0,30 100,50 1,13 0,18 86,5 MU72-6-2 11c3 ~core 3 39,53 0,00 0,05 0,04 45,62 0,27 0,18 14,04 0,24 100,00 1,13 0,18 86,6 MU72-6-2 12b1 rim a 38,95 0,00 0,03 0,09 43,68 0,28 0,21 17,16 0,28 100,70 1,08 0,21 83,4 MU72-6-2 12b2 rim b 39,05 0,02 0,06 0,00 43,50 0,28 0,12 16,85 0,34 100,25 1,08 0,21 83,6 MU72-6-2 12c1 core a 40,08 0,00 0,05 0,16 46,60 0,26 0,18 13,02 0,38 100,74 1,16 0,16 87,6 MU72-6-2 12c2 core b 39,65 0,00 0,06 0,06 45,86 0,26 0,18 13,48 0,39 99,98 1,14 0,17 87,1 MU72-6-2 13b1 rim 1 X 38,48 0,02 0,04 0,03 42,00 0,30 0,26 18,77 0,26 100,16 1,04 0,24 81,6 MU72-6-2 13b2 rim 2a X 38,39 0,00 0,05 0,00 41,16 0,29 0,11 18,95 0,20 99,15 1,02 0,24 81,1 MU72-6-2 13b3 rim 2b X 38,83 0,02 0,06 0,00 42,54 0,29 0,30 17,91 0,24 100,21 1,06 0,22 82,5 MU72-6-2 13c1 core 1 X 38,35 0,01 0,04 0,07 41,18 0,29 0,29 19,23 0,22 99,71 1,02 0,24 80,9 MU72-6-2 13c2 core 2 X 38,51 0,03 0,01 0,03 41,06 0,28 0,25 19,09 0,20 99,48 1,02 0,24 81,0 MU72-7 1b1 rim a 38,48 0,04 0,04 0,08 42,18 0,32 0,14 19,34 0,13 100,77 1,05 0,24 81,2 MU72-7 1b2 rim b 38,75 0,02 0,06 0,00 42,82 0,28 0,25 18,28 0,22 100,67 1,06 0,23 82,3 MU72-7 1b3 rim c 38,70 0,04 0,01 0,00 42,08 0,34 0,21 18,51 0,21 100,14 1,04 0,23 81,8 MU72-7 1c1 core a 39,42 0,02 0,08 0,07 45,05 0,31 0,23 15,83 0,25 101,26 1,12 0,20 84,9 MU72-7 1c2 core b 39,33 0,02 0,04 0,10 44,48 0,28 0,24 15,42 0,26 100,17 1,10 0,19 85,1 MU72-7 2b1 rim a 38,59 0,03 0,04 0,00 41,30 0,31 0,22 19,06 0,25 99,82 1,02 0,24 81,1 MU72-7 2b2 rim b 38,27 0,06 0,04 0,06 40,82 0,35 0,21 19,71 0,21 99,74 1,01 0,25 80,4 MU72-7 2b3 rim c 38,84 0,03 0,05 0,00 42,49 0,37 0,27 19,61 0,19 101,89 1,05 0,25 81,1 MU72-7 2c1 core 39,44 0,01 0,01 0,09 45,49 0,25 0,26 14,34 0,40 100,32 1,13 0,18 86,3 MU72-7 3b1 rim 39,03 0,02 0,08 0,00 43,28 0,30 0,22 16,89 0,20 100,03 1,07 0,21 83,5 MU72-7 4b1 rim 1 39,15 0,04 0,03 0,04 43,87 0,34 0,23 17,56 0,18 101,48 1,09 0,22 83,2 MU72-7 4b2 rim 2 37,72 0,07 0,00 0,03 39,31 0,30 0,22 21,48 0,15 99,34 0,98 0,27 78,4 MU72-7 4c1 core 1 39,48 0,01 0,00 0,00 45,53 0,24 0,12 14,25 0,28 99,91 1,13 0,18 86,4 MU72-7 4c2 core 2 39,25 0,00 0,00 0,02 44,47 0,28 0,19 15,58 0,22 100,04 1,10 0,20 85,0 MU72-7 4c3 core 3 39,12 0,01 0,05 0,05 43,91 0,29 0,27 16,90 0,27 100,88 1,09 0,21 83,7 MU72-7 5b1 rim 1 38,48 0,03 0,05 0,11 41,70 0,31 0,21 18,84 0,22 99,97 1,03 0,24 81,4 MU72-7 5b3 rim 3 38,91 0,01 0,06 0,00 44,00 0,31 0,23 17,81 0,26 101,62 1,09 0,22 83,0 MU72-7 5c1 core 1 38,99 0,02 0,04 0,07 43,06 0,29 0,25 16,72 0,20 99,64 1,07 0,21 83,6 MU72-7 5c2 core 2 38,90 0,03 0,07 0,01 42,78 0,30 0,24 17,53 0,20 100,08 1,06 0,22 82,9 MU72-7 5c3 core 3 38,81 0,01 0,03 0,04 43,58 0,30 0,28 17,23 0,26 100,54 1,08 0,22 83,4 MU72-7 6b1 rim 1a 38,51 0,00 0,49 0,11 43,71 0,28 0,28 16,81 0,22 100,44 1,08 0,21 83,7 MU72-7 6b2 rim 1b 38,88 0,01 0,04 0,08 43,03 0,29 0,28 17,01 0,24 99,90 1,07 0,21 83,4

276
Annexe 1 (suite)
Sample Spot Deformed SiO2 TiO2 Al2O3 Cr2O3 MgO CaO MnO FeO* NiO Total MgO FeO Fo%
MU72-7 6b4 rim 4 38,36 0,02 0,05 0,04 41,61 0,33 0,25 19,35 0,20 100,22 1,03 0,24 81,0 MU72-7 6c1 core 1a 39,33 0,00 0,01 0,01 45,37 0,27 0,25 14,86 0,31 100,40 1,13 0,19 85,8 MU72-7 6c2 core 1b 39,41 0,00 0,04 0,05 45,39 0,26 0,14 14,61 0,29 100,21 1,13 0,18 86,0 MU72-7 6c3 core 2 39,51 0,00 0,00 0,06 45,48 0,27 0,16 14,42 0,26 100,17 1,13 0,18 86,2 MU72-7 6c4 core 3 X 39,49 0,01 0,04 0,00 45,21 0,27 0,30 14,59 0,25 100,17 1,12 0,18 86,0 MU72-7 7b1 rim 1a X 38,42 0,01 0,06 0,06 44,26 0,34 0,17 17,85 0,16 101,37 1,10 0,22 83,1 MU72-7 7b2 rim 1b X 38,68 0,01 0,04 0,07 42,12 0,31 0,25 18,54 0,17 100,21 1,05 0,23 81,8 MU72-7 7c1 core 1 X 38,99 0,01 0,00 0,00 44,17 0,28 0,20 16,89 0,26 100,81 1,10 0,21 83,8 MU72-7 7c2 core 2 38,69 0,00 0,09 0,04 42,94 0,30 0,29 17,18 0,20 99,75 1,07 0,22 83,2 MU72-7 8b1 rim 1 39,05 0,01 0,04 0,04 43,31 0,27 0,19 16,77 0,21 99,88 1,07 0,21 83,6 MU72-7 8b2 rim 2 38,93 0,04 0,05 0,05 42,44 0,33 0,11 18,19 0,18 100,31 1,05 0,23 82,2 MU72-7 8c1 core 1 39,47 0,00 0,06 0,03 45,18 0,28 0,16 15,81 0,20 101,19 1,12 0,20 85,0 MU72-7 8c2 core 2 38,87 0,00 0,00 0,06 44,36 0,29 0,22 15,62 0,27 99,71 1,10 0,20 84,9 MU72-7 9b1 rim a X 37,84 0,02 0,04 0,00 38,37 0,26 0,31 24,29 0,17 101,35 0,95 0,30 75,8 MU72-7 9b2 rim b X 38,22 0,03 0,04 0,00 42,85 0,30 0,30 19,95 0,22 101,92 1,06 0,25 81,0 MU72-7 9b4 rim d X 37,84 0,05 0,03 0,02 39,23 0,33 0,26 22,68 0,20 100,66 0,97 0,28 77,4 MU72-7 9c1 core X 39,21 0,01 0,05 0,05 44,28 0,26 0,24 15,79 0,25 100,16 1,10 0,20 84,7 MU72-7 10b2 rim 1b X 38,63 0,06 0,06 0,09 43,41 0,32 0,29 18,62 0,17 101,66 1,08 0,23 82,2 MU72-7 10b3 rim 2 X 38,86 0,02 0,04 0,06 42,37 0,32 0,27 18,17 0,19 100,34 1,05 0,23 82,2 MU72-7 10c1 core 1 X 39,18 0,00 0,04 0,07 45,36 0,26 0,20 14,77 0,36 100,23 1,13 0,18 85,9 MU72-7 10c2 core 2a X 39,04 0,02 0,05 0,04 43,63 0,27 0,24 16,26 0,32 99,87 1,08 0,20 84,2 MU72-7 10c3 core 2b X 39,25 0,02 0,04 0,05 44,94 0,25 0,19 15,60 0,31 100,70 1,12 0,20 85,1 MU72-7 11b1 rim 1a X 38,20 0,01 0,04 0,02 41,06 0,33 0,23 18,86 0,19 98,93 1,02 0,24 81,2 MU72-7 11b2 rim 1b X 38,87 0,03 0,05 0,07 43,45 0,31 0,28 16,97 0,22 100,24 1,08 0,21 83,5 MU72-7 11b3 rim 2 38,39 0,06 0,09 0,01 40,93 0,32 0,18 20,08 0,19 100,28 1,02 0,25 80,1 MU72-7 11c1 core 1 X 39,33 0,00 0,03 0,06 44,78 0,27 0,17 15,03 0,29 99,99 1,11 0,19 85,5 MU72-7 11c2 core 2 39,55 0,02 0,01 0,10 44,96 0,27 0,25 15,07 0,22 100,52 1,12 0,19 85,5 MU72-7 12b1 rim 1a 38,74 0,03 0,03 0,05 42,66 0,32 0,37 17,53 0,21 99,95 1,06 0,22 82,8 MU72-7 12b2 rim 1b 38,77 0,02 0,03 0,07 42,43 0,32 0,25 17,40 0,21 99,48 1,05 0,22 82,8 MU72-7 12c1 core 1 38,82 0,01 0,06 0,07 43,34 0,29 0,33 16,48 0,22 99,67 1,08 0,21 83,9 MU72-7 12c2 core 2 38,97 0,00 0,00 0,04 43,62 0,27 0,21 16,74 0,22 100,10 1,08 0,21 83,8 MU72-7 13b1 rim 1 39,07 0,01 0,06 0,06 42,98 0,30 0,26 17,29 0,23 100,26 1,07 0,22 83,1 MU72-7 13b3 rim 3 38,25 0,03 0,04 0,01 41,68 0,32 0,34 18,97 0,20 99,85 1,03 0,24 81,3 MU72-7 13c1 core 1 39,26 0,01 0,00 0,06 44,30 0,28 0,24 16,21 0,29 100,66 1,10 0,20 84,4 MU72-7 13c2 core 2 38,98 0,02 0,06 0,07 43,54 0,29 0,26 17,12 0,17 100,51 1,08 0,21 83,4 MU72-7 13c3 core 3 39,22 0,00 0,01 0,05 44,81 0,29 0,17 15,10 0,23 99,89 1,11 0,19 85,5 MU72-7 13c4 core 4 39,23 0,00 0,00 0,02 44,61 0,28 0,20 15,07 0,29 99,71 1,11 0,19 85,4 MU72-7 14b1 rim a X 39,19 0,03 0,06 0,02 44,53 0,28 0,17 15,40 0,31 100,00 1,10 0,19 85,1 MU72-7 14b2 rim b X 39,23 0,01 0,06 0,11 45,66 0,26 0,21 13,95 0,37 99,86 1,13 0,17 86,6 MU72-7 14c1 core a X 39,56 0,01 0,08 0,08 47,55 0,25 0,14 11,35 0,38 99,39 1,18 0,14 89,2 MU72-7 14c2 core b X 39,72 0,02 0,03 0,09 47,27 0,24 0,11 11,85 0,32 99,65 1,17 0,15 88,8
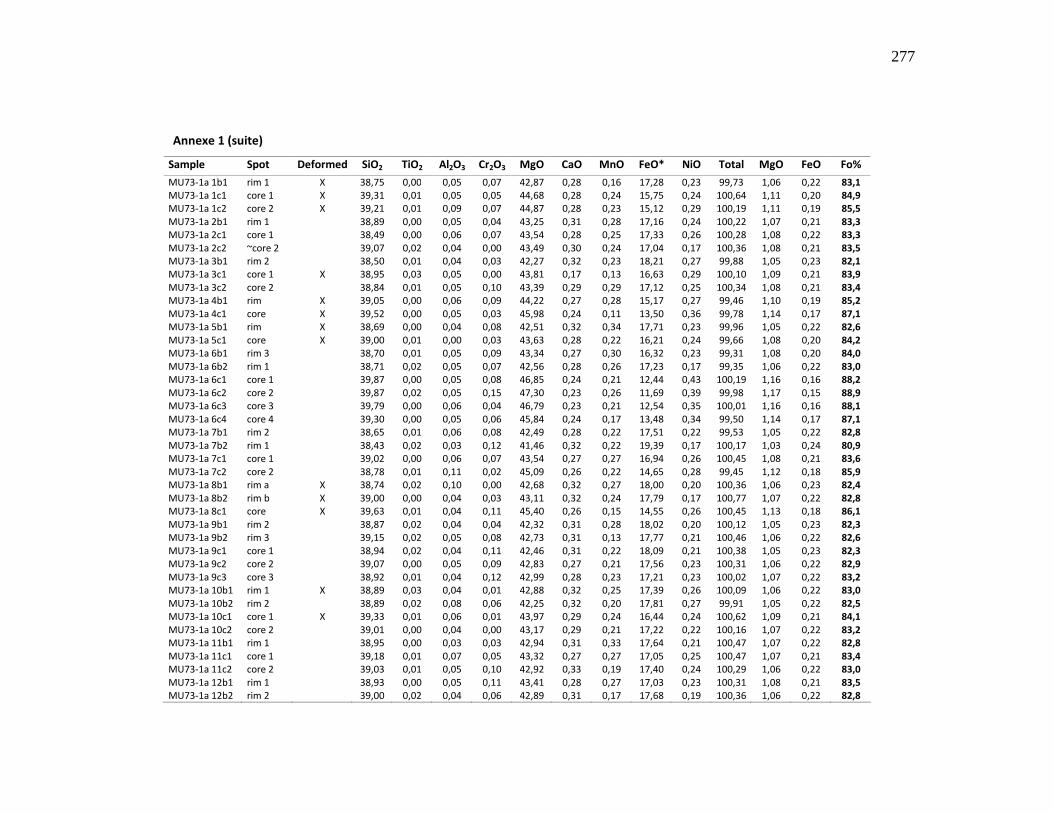
277
Annexe 1 (suite)
Sample Spot Deformed SiO2 TiO2 Al2O3 Cr2O3 MgO CaO MnO FeO* NiO Total MgO FeO Fo%
MU73-1a 1b1 rim 1 X 38,75 0,00 0,05 0,07 42,87 0,28 0,16 17,28 0,23 99,73 1,06 0,22 83,1 MU73-1a 1c1 core 1 X 39,31 0,01 0,05 0,05 44,68 0,28 0,24 15,75 0,24 100,64 1,11 0,20 84,9 MU73-1a 1c2 core 2 X 39,21 0,01 0,09 0,07 44,87 0,28 0,23 15,12 0,29 100,19 1,11 0,19 85,5 MU73-1a 2b1 rim 1 38,89 0,00 0,05 0,04 43,25 0,31 0,28 17,16 0,24 100,22 1,07 0,21 83,3 MU73-1a 2c1 core 1 38,49 0,00 0,06 0,07 43,54 0,28 0,25 17,33 0,26 100,28 1,08 0,22 83,3 MU73-1a 2c2 ~core 2 39,07 0,02 0,04 0,00 43,49 0,30 0,24 17,04 0,17 100,36 1,08 0,21 83,5 MU73-1a 3b1 rim 2 38,50 0,01 0,04 0,03 42,27 0,32 0,23 18,21 0,27 99,88 1,05 0,23 82,1 MU73-1a 3c1 core 1 X 38,95 0,03 0,05 0,00 43,81 0,17 0,13 16,63 0,29 100,10 1,09 0,21 83,9 MU73-1a 3c2 core 2 38,84 0,01 0,05 0,10 43,39 0,29 0,29 17,12 0,25 100,34 1,08 0,21 83,4 MU73-1a 4b1 rim X 39,05 0,00 0,06 0,09 44,22 0,27 0,28 15,17 0,27 99,46 1,10 0,19 85,2 MU73-1a 4c1 core X 39,52 0,00 0,05 0,03 45,98 0,24 0,11 13,50 0,36 99,78 1,14 0,17 87,1 MU73-1a 5b1 rim X 38,69 0,00 0,04 0,08 42,51 0,32 0,34 17,71 0,23 99,96 1,05 0,22 82,6 MU73-1a 5c1 core X 39,00 0,01 0,00 0,03 43,63 0,28 0,22 16,21 0,24 99,66 1,08 0,20 84,2 MU73-1a 6b1 rim 3 38,70 0,01 0,05 0,09 43,34 0,27 0,30 16,32 0,23 99,31 1,08 0,20 84,0 MU73-1a 6b2 rim 1 38,71 0,02 0,05 0,07 42,56 0,28 0,26 17,23 0,17 99,35 1,06 0,22 83,0 MU73-1a 6c1 core 1 39,87 0,00 0,05 0,08 46,85 0,24 0,21 12,44 0,43 100,19 1,16 0,16 88,2 MU73-1a 6c2 core 2 39,87 0,02 0,05 0,15 47,30 0,23 0,26 11,69 0,39 99,98 1,17 0,15 88,9 MU73-1a 6c3 core 3 39,79 0,00 0,06 0,04 46,79 0,23 0,21 12,54 0,35 100,01 1,16 0,16 88,1 MU73-1a 6c4 core 4 39,30 0,00 0,05 0,06 45,84 0,24 0,17 13,48 0,34 99,50 1,14 0,17 87,1 MU73-1a 7b1 rim 2 38,65 0,01 0,06 0,08 42,49 0,28 0,22 17,51 0,22 99,53 1,05 0,22 82,8 MU73-1a 7b2 rim 1 38,43 0,02 0,03 0,12 41,46 0,32 0,22 19,39 0,17 100,17 1,03 0,24 80,9 MU73-1a 7c1 core 1 39,02 0,00 0,06 0,07 43,54 0,27 0,27 16,94 0,26 100,45 1,08 0,21 83,6 MU73-1a 7c2 core 2 38,78 0,01 0,11 0,02 45,09 0,26 0,22 14,65 0,28 99,45 1,12 0,18 85,9 MU73-1a 8b1 rim a X 38,74 0,02 0,10 0,00 42,68 0,32 0,27 18,00 0,20 100,36 1,06 0,23 82,4 MU73-1a 8b2 rim b X 39,00 0,00 0,04 0,03 43,11 0,32 0,24 17,79 0,17 100,77 1,07 0,22 82,8 MU73-1a 8c1 core X 39,63 0,01 0,04 0,11 45,40 0,26 0,15 14,55 0,26 100,45 1,13 0,18 86,1 MU73-1a 9b1 rim 2 38,87 0,02 0,04 0,04 42,32 0,31 0,28 18,02 0,20 100,12 1,05 0,23 82,3 MU73-1a 9b2 rim 3 39,15 0,02 0,05 0,08 42,73 0,31 0,13 17,77 0,21 100,46 1,06 0,22 82,6 MU73-1a 9c1 core 1 38,94 0,02 0,04 0,11 42,46 0,31 0,22 18,09 0,21 100,38 1,05 0,23 82,3 MU73-1a 9c2 core 2 39,07 0,00 0,05 0,09 42,83 0,27 0,21 17,56 0,23 100,31 1,06 0,22 82,9 MU73-1a 9c3 core 3 38,92 0,01 0,04 0,12 42,99 0,28 0,23 17,21 0,23 100,02 1,07 0,22 83,2 MU73-1a 10b1 rim 1 X 38,89 0,03 0,04 0,01 42,88 0,32 0,25 17,39 0,26 100,09 1,06 0,22 83,0 MU73-1a 10b2 rim 2 38,89 0,02 0,08 0,06 42,25 0,32 0,20 17,81 0,27 99,91 1,05 0,22 82,5 MU73-1a 10c1 core 1 X 39,33 0,01 0,06 0,01 43,97 0,29 0,24 16,44 0,24 100,62 1,09 0,21 84,1 MU73-1a 10c2 core 2 39,01 0,00 0,04 0,00 43,17 0,29 0,21 17,22 0,22 100,16 1,07 0,22 83,2 MU73-1a 11b1 rim 1 38,95 0,00 0,03 0,03 42,94 0,31 0,33 17,64 0,21 100,47 1,07 0,22 82,8 MU73-1a 11c1 core 1 39,18 0,01 0,07 0,05 43,32 0,27 0,27 17,05 0,25 100,47 1,07 0,21 83,4 MU73-1a 11c2 core 2 39,03 0,01 0,05 0,10 42,92 0,33 0,19 17,40 0,24 100,29 1,06 0,22 83,0 MU73-1a 12b1 rim 1 38,93 0,00 0,05 0,11 43,41 0,28 0,27 17,03 0,23 100,31 1,08 0,21 83,5 MU73-1a 12b2 rim 2 39,00 0,02 0,04 0,06 42,89 0,31 0,17 17,68 0,19 100,36 1,06 0,22 82,8
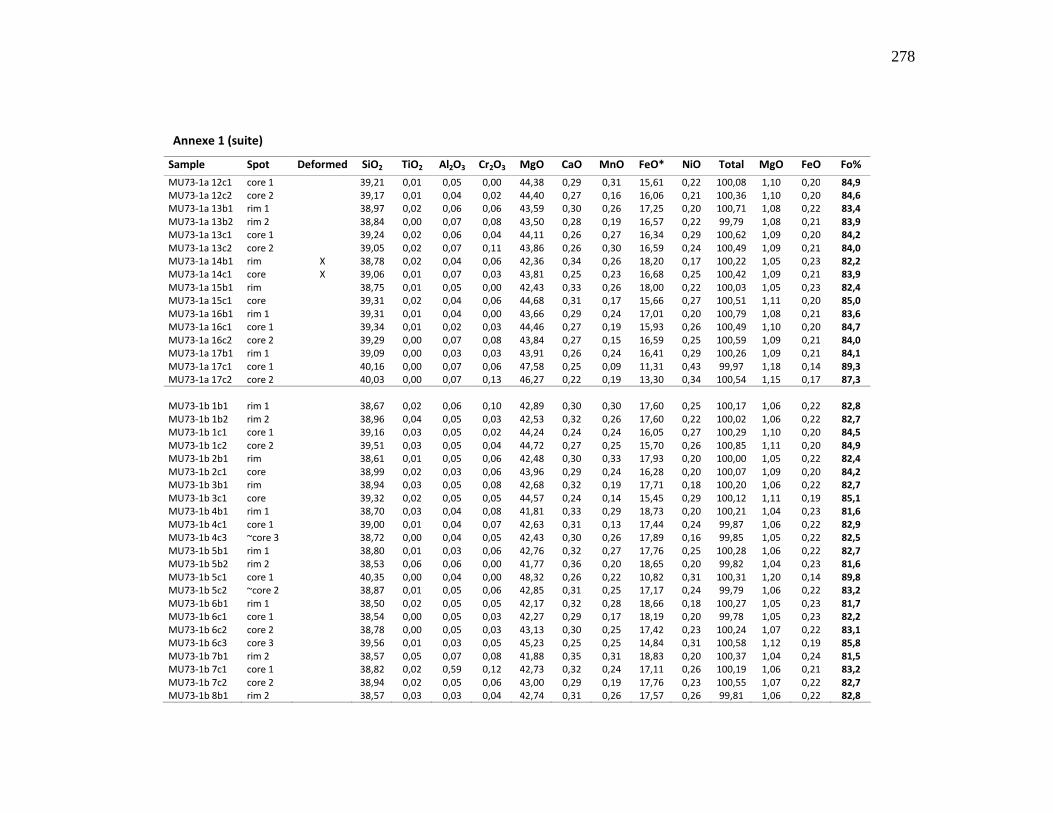
278
Annexe 1 (suite)
Sample Spot Deformed SiO2 TiO2 Al2O3 Cr2O3 MgO CaO MnO FeO* NiO Total MgO FeO Fo%
MU73-1a 12c1 core 1 39,21 0,01 0,05 0,00 44,38 0,29 0,31 15,61 0,22 100,08 1,10 0,20 84,9 MU73-1a 12c2 core 2 39,17 0,01 0,04 0,02 44,40 0,27 0,16 16,06 0,21 100,36 1,10 0,20 84,6 MU73-1a 13b1 rim 1 38,97 0,02 0,06 0,06 43,59 0,30 0,26 17,25 0,20 100,71 1,08 0,22 83,4 MU73-1a 13b2 rim 2 38,84 0,00 0,07 0,08 43,50 0,28 0,19 16,57 0,22 99,79 1,08 0,21 83,9 MU73-1a 13c1 core 1 39,24 0,02 0,06 0,04 44,11 0,26 0,27 16,34 0,29 100,62 1,09 0,20 84,2 MU73-1a 13c2 core 2 39,05 0,02 0,07 0,11 43,86 0,26 0,30 16,59 0,24 100,49 1,09 0,21 84,0 MU73-1a 14b1 rim X 38,78 0,02 0,04 0,06 42,36 0,34 0,26 18,20 0,17 100,22 1,05 0,23 82,2 MU73-1a 14c1 core X 39,06 0,01 0,07 0,03 43,81 0,25 0,23 16,68 0,25 100,42 1,09 0,21 83,9 MU73-1a 15b1 rim 38,75 0,01 0,05 0,00 42,43 0,33 0,26 18,00 0,22 100,03 1,05 0,23 82,4 MU73-1a 15c1 core 39,31 0,02 0,04 0,06 44,68 0,31 0,17 15,66 0,27 100,51 1,11 0,20 85,0 MU73-1a 16b1 rim 1 39,31 0,01 0,04 0,00 43,66 0,29 0,24 17,01 0,20 100,79 1,08 0,21 83,6 MU73-1a 16c1 core 1 39,34 0,01 0,02 0,03 44,46 0,27 0,19 15,93 0,26 100,49 1,10 0,20 84,7 MU73-1a 16c2 core 2 39,29 0,00 0,07 0,08 43,84 0,27 0,15 16,59 0,25 100,59 1,09 0,21 84,0 MU73-1a 17b1 rim 1 39,09 0,00 0,03 0,03 43,91 0,26 0,24 16,41 0,29 100,26 1,09 0,21 84,1 MU73-1a 17c1 core 1 40,16 0,00 0,07 0,06 47,58 0,25 0,09 11,31 0,43 99,97 1,18 0,14 89,3 MU73-1a 17c2 core 2 40,03 0,00 0,07 0,13 46,27 0,22 0,19 13,30 0,34 100,54 1,15 0,17 87,3
MU73-1b 1b1 rim 1 38,67 0,02 0,06 0,10 42,89 0,30 0,30 17,60 0,25 100,17 1,06 0,22 82,8 MU73-1b 1b2 rim 2 38,96 0,04 0,05 0,03 42,53 0,32 0,26 17,60 0,22 100,02 1,06 0,22 82,7 MU73-1b 1c1 core 1 39,16 0,03 0,05 0,02 44,24 0,24 0,24 16,05 0,27 100,29 1,10 0,20 84,5 MU73-1b 1c2 core 2 39,51 0,03 0,05 0,04 44,72 0,27 0,25 15,70 0,26 100,85 1,11 0,20 84,9 MU73-1b 2b1 rim 38,61 0,01 0,05 0,06 42,48 0,30 0,33 17,93 0,20 100,00 1,05 0,22 82,4 MU73-1b 2c1 core 38,99 0,02 0,03 0,06 43,96 0,29 0,24 16,28 0,20 100,07 1,09 0,20 84,2 MU73-1b 3b1 rim 38,94 0,03 0,05 0,08 42,68 0,32 0,19 17,71 0,18 100,20 1,06 0,22 82,7 MU73-1b 3c1 core 39,32 0,02 0,05 0,05 44,57 0,24 0,14 15,45 0,29 100,12 1,11 0,19 85,1 MU73-1b 4b1 rim 1 38,70 0,03 0,04 0,08 41,81 0,33 0,29 18,73 0,20 100,21 1,04 0,23 81,6 MU73-1b 4c1 core 1 39,00 0,01 0,04 0,07 42,63 0,31 0,13 17,44 0,24 99,87 1,06 0,22 82,9 MU73-1b 4c3 ~core 3 38,72 0,00 0,04 0,05 42,43 0,30 0,26 17,89 0,16 99,85 1,05 0,22 82,5 MU73-1b 5b1 rim 1 38,80 0,01 0,03 0,06 42,76 0,32 0,27 17,76 0,25 100,28 1,06 0,22 82,7 MU73-1b 5b2 rim 2 38,53 0,06 0,06 0,00 41,77 0,36 0,20 18,65 0,20 99,82 1,04 0,23 81,6 MU73-1b 5c1 core 1 40,35 0,00 0,04 0,00 48,32 0,26 0,22 10,82 0,31 100,31 1,20 0,14 89,8 MU73-1b 5c2 ~core 2 38,87 0,01 0,05 0,06 42,85 0,31 0,25 17,17 0,24 99,79 1,06 0,22 83,2 MU73-1b 6b1 rim 1 38,50 0,02 0,05 0,05 42,17 0,32 0,28 18,66 0,18 100,27 1,05 0,23 81,7 MU73-1b 6c1 core 1 38,54 0,00 0,05 0,03 42,27 0,29 0,17 18,19 0,20 99,78 1,05 0,23 82,2 MU73-1b 6c2 core 2 38,78 0,00 0,05 0,03 43,13 0,30 0,25 17,42 0,23 100,24 1,07 0,22 83,1 MU73-1b 6c3 core 3 39,56 0,01 0,03 0,05 45,23 0,25 0,25 14,84 0,31 100,58 1,12 0,19 85,8 MU73-1b 7b1 rim 2 38,57 0,05 0,07 0,08 41,88 0,35 0,31 18,83 0,20 100,37 1,04 0,24 81,5 MU73-1b 7c1 core 1 38,82 0,02 0,59 0,12 42,73 0,32 0,24 17,11 0,26 100,19 1,06 0,21 83,2 MU73-1b 7c2 core 2 38,94 0,02 0,05 0,06 43,00 0,29 0,19 17,76 0,23 100,55 1,07 0,22 82,7 MU73-1b 8b1 rim 2 38,57 0,03 0,03 0,04 42,74 0,31 0,26 17,57 0,26 99,81 1,06 0,22 82,8
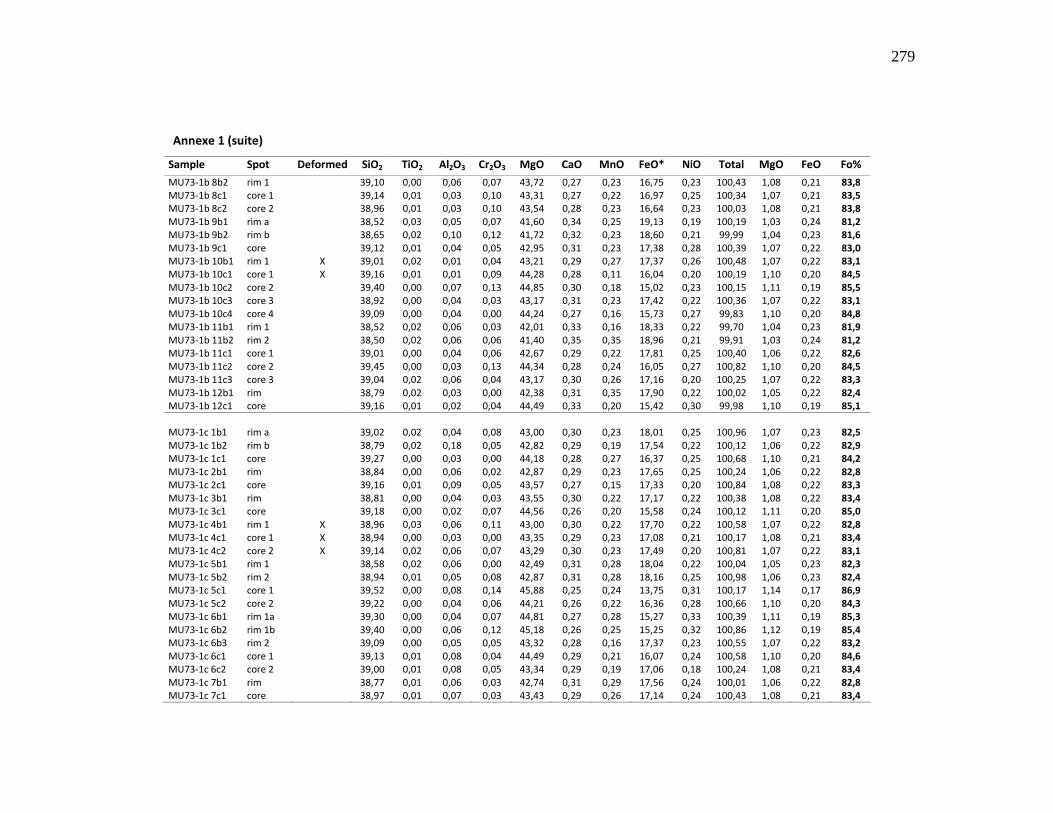
279
Annexe 1 (suite)
Sample Spot Deformed SiO2 TiO2 Al2O3 Cr2O3 MgO CaO MnO FeO* NiO Total MgO FeO Fo%
MU73-1b 8b2 rim 1 39,10 0,00 0,06 0,07 43,72 0,27 0,23 16,75 0,23 100,43 1,08 0,21 83,8 MU73-1b 8c1 core 1 39,14 0,01 0,03 0,10 43,31 0,27 0,22 16,97 0,25 100,34 1,07 0,21 83,5 MU73-1b 8c2 core 2 38,96 0,01 0,03 0,10 43,54 0,28 0,23 16,64 0,23 100,03 1,08 0,21 83,8 MU73-1b 9b1 rim a 38,52 0,03 0,05 0,07 41,60 0,34 0,25 19,13 0,19 100,19 1,03 0,24 81,2 MU73-1b 9b2 rim b 38,65 0,02 0,10 0,12 41,72 0,32 0,23 18,60 0,21 99,99 1,04 0,23 81,6 MU73-1b 9c1 core 39,12 0,01 0,04 0,05 42,95 0,31 0,23 17,38 0,28 100,39 1,07 0,22 83,0 MU73-1b 10b1 rim 1 X 39,01 0,02 0,01 0,04 43,21 0,29 0,27 17,37 0,26 100,48 1,07 0,22 83,1 MU73-1b 10c1 core 1 X 39,16 0,01 0,01 0,09 44,28 0,28 0,11 16,04 0,20 100,19 1,10 0,20 84,5 MU73-1b 10c2 core 2 39,40 0,00 0,07 0,13 44,85 0,30 0,18 15,02 0,23 100,15 1,11 0,19 85,5 MU73-1b 10c3 core 3 38,92 0,00 0,04 0,03 43,17 0,31 0,23 17,42 0,22 100,36 1,07 0,22 83,1 MU73-1b 10c4 core 4 39,09 0,00 0,04 0,00 44,24 0,27 0,16 15,73 0,27 99,83 1,10 0,20 84,8 MU73-1b 11b1 rim 1 38,52 0,02 0,06 0,03 42,01 0,33 0,16 18,33 0,22 99,70 1,04 0,23 81,9 MU73-1b 11b2 rim 2 38,50 0,02 0,06 0,06 41,40 0,35 0,35 18,96 0,21 99,91 1,03 0,24 81,2 MU73-1b 11c1 core 1 39,01 0,00 0,04 0,06 42,67 0,29 0,22 17,81 0,25 100,40 1,06 0,22 82,6 MU73-1b 11c2 core 2 39,45 0,00 0,03 0,13 44,34 0,28 0,24 16,05 0,27 100,82 1,10 0,20 84,5 MU73-1b 11c3 core 3 39,04 0,02 0,06 0,04 43,17 0,30 0,26 17,16 0,20 100,25 1,07 0,22 83,3 MU73-1b 12b1 rim 38,79 0,02 0,03 0,00 42,38 0,31 0,35 17,90 0,22 100,02 1,05 0,22 82,4 MU73-1b 12c1 core 39,16 0,01 0,02 0,04 44,49 0,33 0,20 15,42 0,30 99,98 1,10 0,19 85,1
MU73-1c 1b1 rim a 39,02 0,02 0,04 0,08 43,00 0,30 0,23 18,01 0,25 100,96 1,07 0,23 82,5 MU73-1c 1b2 rim b 38,79 0,02 0,18 0,05 42,82 0,29 0,19 17,54 0,22 100,12 1,06 0,22 82,9 MU73-1c 1c1 core 39,27 0,00 0,03 0,00 44,18 0,28 0,27 16,37 0,25 100,68 1,10 0,21 84,2 MU73-1c 2b1 rim 38,84 0,00 0,06 0,02 42,87 0,29 0,23 17,65 0,25 100,24 1,06 0,22 82,8 MU73-1c 2c1 core 39,16 0,01 0,09 0,05 43,57 0,27 0,15 17,33 0,20 100,84 1,08 0,22 83,3 MU73-1c 3b1 rim 38,81 0,00 0,04 0,03 43,55 0,30 0,22 17,17 0,22 100,38 1,08 0,22 83,4 MU73-1c 3c1 core 39,18 0,00 0,02 0,07 44,56 0,26 0,20 15,58 0,24 100,12 1,11 0,20 85,0 MU73-1c 4b1 rim 1 X 38,96 0,03 0,06 0,11 43,00 0,30 0,22 17,70 0,22 100,58 1,07 0,22 82,8 MU73-1c 4c1 core 1 X 38,94 0,00 0,03 0,00 43,35 0,29 0,23 17,08 0,21 100,17 1,08 0,21 83,4 MU73-1c 4c2 core 2 X 39,14 0,02 0,06 0,07 43,29 0,30 0,23 17,49 0,20 100,81 1,07 0,22 83,1 MU73-1c 5b1 rim 1 38,58 0,02 0,06 0,00 42,49 0,31 0,28 18,04 0,22 100,04 1,05 0,23 82,3 MU73-1c 5b2 rim 2 38,94 0,01 0,05 0,08 42,87 0,31 0,28 18,16 0,25 100,98 1,06 0,23 82,4 MU73-1c 5c1 core 1 39,52 0,00 0,08 0,14 45,88 0,25 0,24 13,75 0,31 100,17 1,14 0,17 86,9 MU73-1c 5c2 core 2 39,22 0,00 0,04 0,06 44,21 0,26 0,22 16,36 0,28 100,66 1,10 0,20 84,3 MU73-1c 6b1 rim 1a 39,30 0,00 0,04 0,07 44,81 0,27 0,28 15,27 0,33 100,39 1,11 0,19 85,3 MU73-1c 6b2 rim 1b 39,40 0,00 0,06 0,12 45,18 0,26 0,25 15,25 0,32 100,86 1,12 0,19 85,4 MU73-1c 6b3 rim 2 39,09 0,00 0,05 0,05 43,32 0,28 0,16 17,37 0,23 100,55 1,07 0,22 83,2 MU73-1c 6c1 core 1 39,13 0,01 0,08 0,04 44,49 0,29 0,21 16,07 0,24 100,58 1,10 0,20 84,6 MU73-1c 6c2 core 2 39,00 0,01 0,08 0,05 43,34 0,29 0,19 17,06 0,18 100,24 1,08 0,21 83,4 MU73-1c 7b1 rim 38,77 0,01 0,06 0,03 42,74 0,31 0,29 17,56 0,24 100,01 1,06 0,22 82,8 MU73-1c 7c1 core 38,97 0,01 0,07 0,03 43,43 0,29 0,26 17,14 0,24 100,43 1,08 0,21 83,4
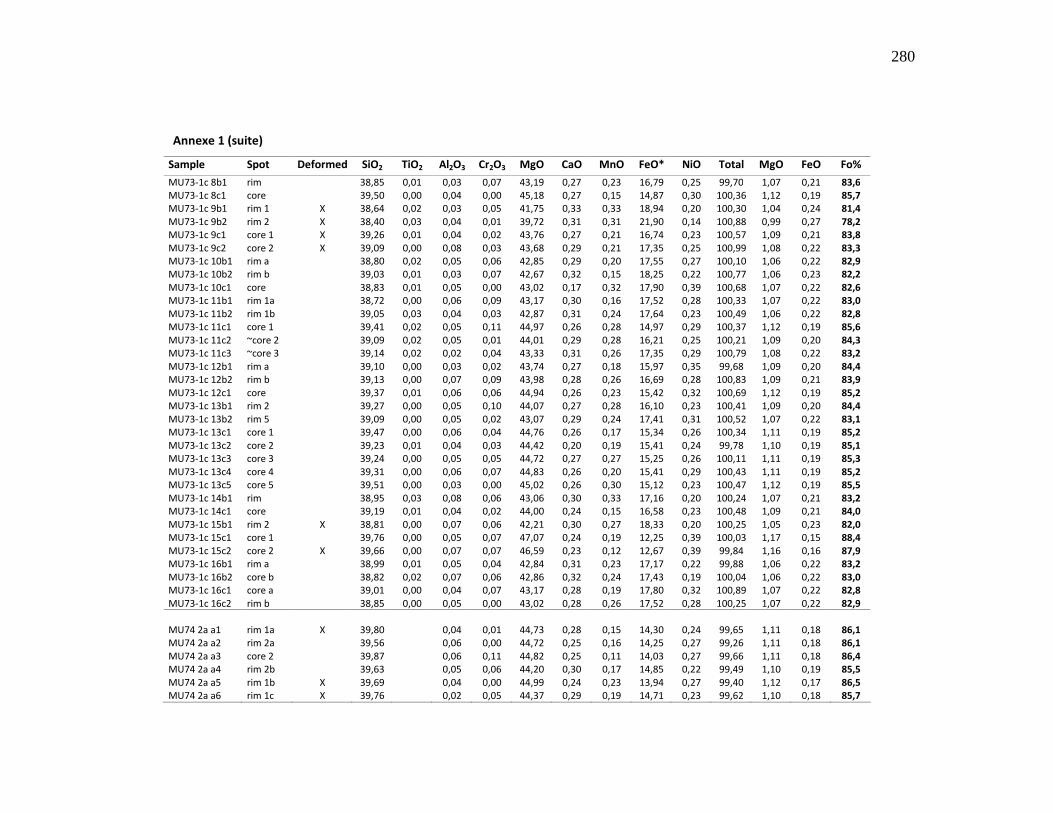
280
Annexe 1 (suite)
Sample Spot Deformed SiO2 TiO2 Al2O3 Cr2O3 MgO CaO MnO FeO* NiO Total MgO FeO Fo%
MU73-1c 8b1 rim 38,85 0,01 0,03 0,07 43,19 0,27 0,23 16,79 0,25 99,70 1,07 0,21 83,6 MU73-1c 8c1 core 39,50 0,00 0,04 0,00 45,18 0,27 0,15 14,87 0,30 100,36 1,12 0,19 85,7 MU73-1c 9b1 rim 1 X 38,64 0,02 0,03 0,05 41,75 0,33 0,33 18,94 0,20 100,30 1,04 0,24 81,4 MU73-1c 9b2 rim 2 X 38,40 0,03 0,04 0,01 39,72 0,31 0,31 21,90 0,14 100,88 0,99 0,27 78,2 MU73-1c 9c1 core 1 X 39,26 0,01 0,04 0,02 43,76 0,27 0,21 16,74 0,23 100,57 1,09 0,21 83,8 MU73-1c 9c2 core 2 X 39,09 0,00 0,08 0,03 43,68 0,29 0,21 17,35 0,25 100,99 1,08 0,22 83,3 MU73-1c 10b1 rim a 38,80 0,02 0,05 0,06 42,85 0,29 0,20 17,55 0,27 100,10 1,06 0,22 82,9 MU73-1c 10b2 rim b 39,03 0,01 0,03 0,07 42,67 0,32 0,15 18,25 0,22 100,77 1,06 0,23 82,2 MU73-1c 10c1 core 38,83 0,01 0,05 0,00 43,02 0,17 0,32 17,90 0,39 100,68 1,07 0,22 82,6 MU73-1c 11b1 rim 1a 38,72 0,00 0,06 0,09 43,17 0,30 0,16 17,52 0,28 100,33 1,07 0,22 83,0 MU73-1c 11b2 rim 1b 39,05 0,03 0,04 0,03 42,87 0,31 0,24 17,64 0,23 100,49 1,06 0,22 82,8 MU73-1c 11c1 core 1 39,41 0,02 0,05 0,11 44,97 0,26 0,28 14,97 0,29 100,37 1,12 0,19 85,6 MU73-1c 11c2 ~core 2 39,09 0,02 0,05 0,01 44,01 0,29 0,28 16,21 0,25 100,21 1,09 0,20 84,3 MU73-1c 11c3 ~core 3 39,14 0,02 0,02 0,04 43,33 0,31 0,26 17,35 0,29 100,79 1,08 0,22 83,2 MU73-1c 12b1 rim a 39,10 0,00 0,03 0,02 43,74 0,27 0,18 15,97 0,35 99,68 1,09 0,20 84,4 MU73-1c 12b2 rim b 39,13 0,00 0,07 0,09 43,98 0,28 0,26 16,69 0,28 100,83 1,09 0,21 83,9 MU73-1c 12c1 core 39,37 0,01 0,06 0,06 44,94 0,26 0,23 15,42 0,32 100,69 1,12 0,19 85,2 MU73-1c 13b1 rim 2 39,27 0,00 0,05 0,10 44,07 0,27 0,28 16,10 0,23 100,41 1,09 0,20 84,4 MU73-1c 13b2 rim 5 39,09 0,00 0,05 0,02 43,07 0,29 0,24 17,41 0,31 100,52 1,07 0,22 83,1 MU73-1c 13c1 core 1 39,47 0,00 0,06 0,04 44,76 0,26 0,17 15,34 0,26 100,34 1,11 0,19 85,2 MU73-1c 13c2 core 2 39,23 0,01 0,04 0,03 44,42 0,20 0,19 15,41 0,24 99,78 1,10 0,19 85,1 MU73-1c 13c3 core 3 39,24 0,00 0,05 0,05 44,72 0,27 0,27 15,25 0,26 100,11 1,11 0,19 85,3 MU73-1c 13c4 core 4 39,31 0,00 0,06 0,07 44,83 0,26 0,20 15,41 0,29 100,43 1,11 0,19 85,2 MU73-1c 13c5 core 5 39,51 0,00 0,03 0,00 45,02 0,26 0,30 15,12 0,23 100,47 1,12 0,19 85,5 MU73-1c 14b1 rim 38,95 0,03 0,08 0,06 43,06 0,30 0,33 17,16 0,20 100,24 1,07 0,21 83,2 MU73-1c 14c1 core 39,19 0,01 0,04 0,02 44,00 0,24 0,15 16,58 0,23 100,48 1,09 0,21 84,0 MU73-1c 15b1 rim 2 X 38,81 0,00 0,07 0,06 42,21 0,30 0,27 18,33 0,20 100,25 1,05 0,23 82,0 MU73-1c 15c1 core 1 39,76 0,00 0,05 0,07 47,07 0,24 0,19 12,25 0,39 100,03 1,17 0,15 88,4 MU73-1c 15c2 core 2 X 39,66 0,00 0,07 0,07 46,59 0,23 0,12 12,67 0,39 99,84 1,16 0,16 87,9 MU73-1c 16b1 rim a 38,99 0,01 0,05 0,04 42,84 0,31 0,23 17,17 0,22 99,88 1,06 0,22 83,2 MU73-1c 16b2 core b 38,82 0,02 0,07 0,06 42,86 0,32 0,24 17,43 0,19 100,04 1,06 0,22 83,0 MU73-1c 16c1 core a 39,01 0,00 0,04 0,07 43,17 0,28 0,19 17,80 0,32 100,89 1,07 0,22 82,8 MU73-1c 16c2 rim b 38,85 0,00 0,05 0,00 43,02 0,28 0,26 17,52 0,28 100,25 1,07 0,22 82,9 MU74 2a a1 rim 1a X 39,80 0,04 0,01 44,73 0,28 0,15 14,30 0,24 99,65 1,11 0,18 86,1 MU74 2a a2 rim 2a 39,56 0,06 0,00 44,72 0,25 0,16 14,25 0,27 99,26 1,11 0,18 86,1 MU74 2a a3 core 2 39,87 0,06 0,11 44,82 0,25 0,11 14,03 0,27 99,66 1,11 0,18 86,4 MU74 2a a4 rim 2b 39,63 0,05 0,06 44,20 0,30 0,17 14,85 0,22 99,49 1,10 0,19 85,5 MU74 2a a5 rim 1b X 39,69 0,04 0,00 44,99 0,24 0,23 13,94 0,27 99,40 1,12 0,17 86,5 MU74 2a a6 rim 1c X 39,76 0,02 0,05 44,37 0,29 0,19 14,71 0,23 99,62 1,10 0,18 85,7
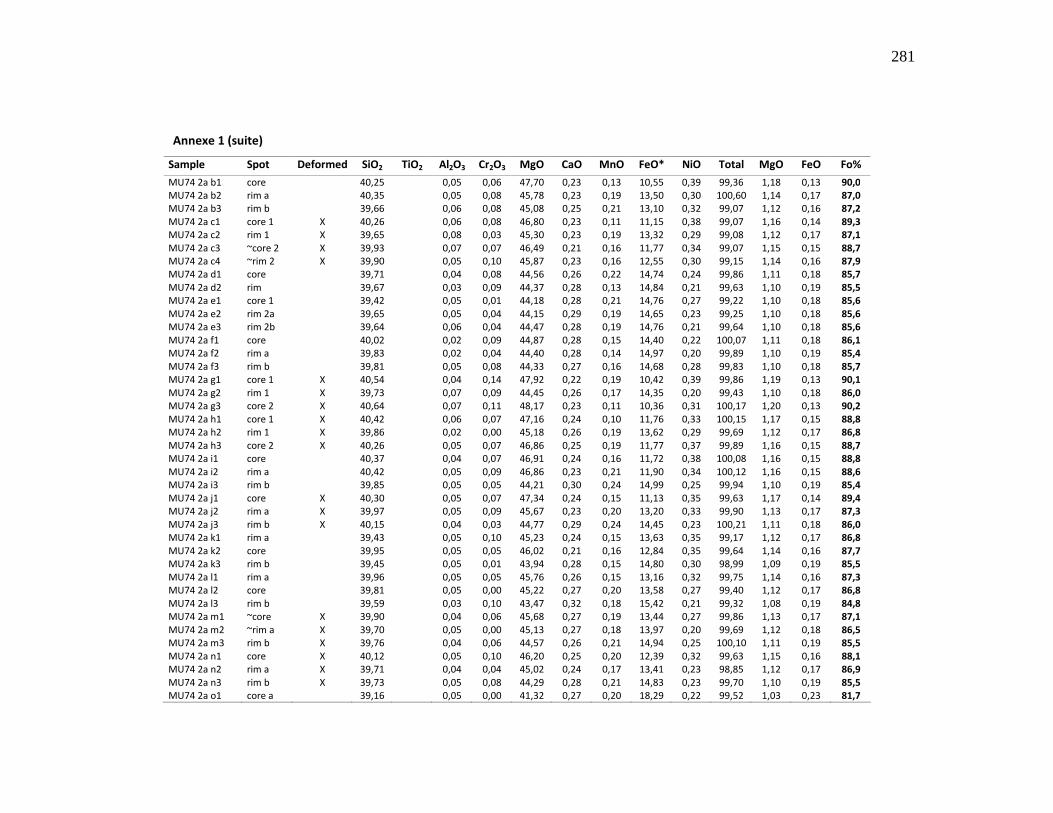
281
Annexe 1 (suite)
Sample Spot Deformed SiO2 TiO2 Al2O3 Cr2O3 MgO CaO MnO FeO* NiO Total MgO FeO Fo%
MU74 2a b1 core 40,25 0,05 0,06 47,70 0,23 0,13 10,55 0,39 99,36 1,18 0,13 90,0 MU74 2a b2 rim a 40,35 0,05 0,08 45,78 0,23 0,19 13,50 0,30 100,60 1,14 0,17 87,0 MU74 2a b3 rim b 39,66 0,06 0,08 45,08 0,25 0,21 13,10 0,32 99,07 1,12 0,16 87,2 MU74 2a c1 core 1 X 40,26 0,06 0,08 46,80 0,23 0,11 11,15 0,38 99,07 1,16 0,14 89,3 MU74 2a c2 rim 1 X 39,65 0,08 0,03 45,30 0,23 0,19 13,32 0,29 99,08 1,12 0,17 87,1 MU74 2a c3 ~core 2 X 39,93 0,07 0,07 46,49 0,21 0,16 11,77 0,34 99,07 1,15 0,15 88,7 MU74 2a c4 ~rim 2 X 39,90 0,05 0,10 45,87 0,23 0,16 12,55 0,30 99,15 1,14 0,16 87,9 MU74 2a d1 core 39,71 0,04 0,08 44,56 0,26 0,22 14,74 0,24 99,86 1,11 0,18 85,7 MU74 2a d2 rim 39,67 0,03 0,09 44,37 0,28 0,13 14,84 0,21 99,63 1,10 0,19 85,5 MU74 2a e1 core 1 39,42 0,05 0,01 44,18 0,28 0,21 14,76 0,27 99,22 1,10 0,18 85,6 MU74 2a e2 rim 2a 39,65 0,05 0,04 44,15 0,29 0,19 14,65 0,23 99,25 1,10 0,18 85,6 MU74 2a e3 rim 2b 39,64 0,06 0,04 44,47 0,28 0,19 14,76 0,21 99,64 1,10 0,18 85,6 MU74 2a f1 core 40,02 0,02 0,09 44,87 0,28 0,15 14,40 0,22 100,07 1,11 0,18 86,1 MU74 2a f2 rim a 39,83 0,02 0,04 44,40 0,28 0,14 14,97 0,20 99,89 1,10 0,19 85,4 MU74 2a f3 rim b 39,81 0,05 0,08 44,33 0,27 0,16 14,68 0,28 99,83 1,10 0,18 85,7 MU74 2a g1 core 1 X 40,54 0,04 0,14 47,92 0,22 0,19 10,42 0,39 99,86 1,19 0,13 90,1 MU74 2a g2 rim 1 X 39,73 0,07 0,09 44,45 0,26 0,17 14,35 0,20 99,43 1,10 0,18 86,0 MU74 2a g3 core 2 X 40,64 0,07 0,11 48,17 0,23 0,11 10,36 0,31 100,17 1,20 0,13 90,2 MU74 2a h1 core 1 X 40,42 0,06 0,07 47,16 0,24 0,10 11,76 0,33 100,15 1,17 0,15 88,8 MU74 2a h2 rim 1 X 39,86 0,02 0,00 45,18 0,26 0,19 13,62 0,29 99,69 1,12 0,17 86,8 MU74 2a h3 core 2 X 40,26 0,05 0,07 46,86 0,25 0,19 11,77 0,37 99,89 1,16 0,15 88,7 MU74 2a i1 core 40,37 0,04 0,07 46,91 0,24 0,16 11,72 0,38 100,08 1,16 0,15 88,8 MU74 2a i2 rim a 40,42 0,05 0,09 46,86 0,23 0,21 11,90 0,34 100,12 1,16 0,15 88,6 MU74 2a i3 rim b 39,85 0,05 0,05 44,21 0,30 0,24 14,99 0,25 99,94 1,10 0,19 85,4 MU74 2a j1 core X 40,30 0,05 0,07 47,34 0,24 0,15 11,13 0,35 99,63 1,17 0,14 89,4 MU74 2a j2 rim a X 39,97 0,05 0,09 45,67 0,23 0,20 13,20 0,33 99,90 1,13 0,17 87,3 MU74 2a j3 rim b X 40,15 0,04 0,03 44,77 0,29 0,24 14,45 0,23 100,21 1,11 0,18 86,0 MU74 2a k1 rim a 39,43 0,05 0,10 45,23 0,24 0,15 13,63 0,35 99,17 1,12 0,17 86,8 MU74 2a k2 core 39,95 0,05 0,05 46,02 0,21 0,16 12,84 0,35 99,64 1,14 0,16 87,7 MU74 2a k3 rim b 39,45 0,05 0,01 43,94 0,28 0,15 14,80 0,30 98,99 1,09 0,19 85,5 MU74 2a l1 rim a 39,96 0,05 0,05 45,76 0,26 0,15 13,16 0,32 99,75 1,14 0,16 87,3 MU74 2a l2 core 39,81 0,05 0,00 45,22 0,27 0,20 13,58 0,27 99,40 1,12 0,17 86,8 MU74 2a l3 rim b 39,59 0,03 0,10 43,47 0,32 0,18 15,42 0,21 99,32 1,08 0,19 84,8 MU74 2a m1 ~core X 39,90 0,04 0,06 45,68 0,27 0,19 13,44 0,27 99,86 1,13 0,17 87,1 MU74 2a m2 ~rim a X 39,70 0,05 0,00 45,13 0,27 0,18 13,97 0,20 99,69 1,12 0,18 86,5 MU74 2a m3 rim b X 39,76 0,04 0,06 44,57 0,26 0,21 14,94 0,25 100,10 1,11 0,19 85,5 MU74 2a n1 core X 40,12 0,05 0,10 46,20 0,25 0,20 12,39 0,32 99,63 1,15 0,16 88,1 MU74 2a n2 rim a X 39,71 0,04 0,04 45,02 0,24 0,17 13,41 0,23 98,85 1,12 0,17 86,9 MU74 2a n3 rim b X 39,73 0,05 0,08 44,29 0,28 0,21 14,83 0,23 99,70 1,10 0,19 85,5 MU74 2a o1 core a 39,16 0,05 0,00 41,32 0,27 0,20 18,29 0,22 99,52 1,03 0,23 81,7
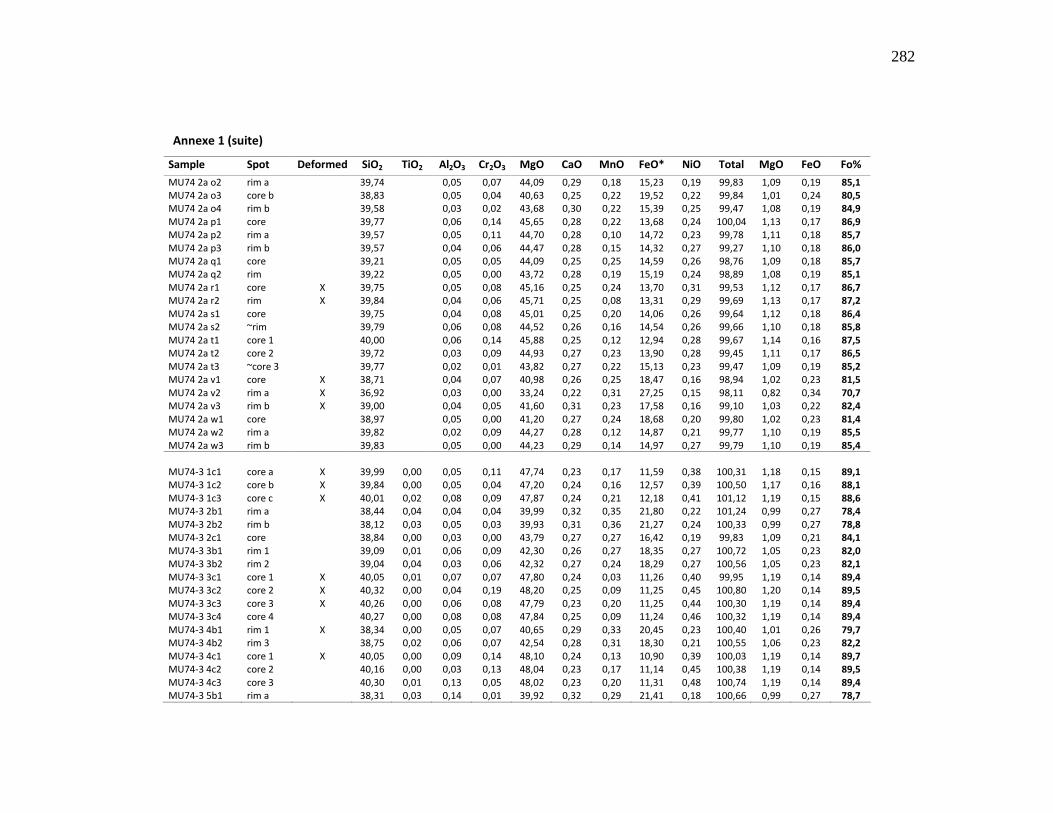
282
Annexe 1 (suite)
Sample Spot Deformed SiO2 TiO2 Al2O3 Cr2O3 MgO CaO MnO FeO* NiO Total MgO FeO Fo%
MU74 2a o2 rim a 39,74 0,05 0,07 44,09 0,29 0,18 15,23 0,19 99,83 1,09 0,19 85,1 MU74 2a o3 core b 38,83 0,05 0,04 40,63 0,25 0,22 19,52 0,22 99,84 1,01 0,24 80,5 MU74 2a o4 rim b 39,58 0,03 0,02 43,68 0,30 0,22 15,39 0,25 99,47 1,08 0,19 84,9 MU74 2a p1 core 39,77 0,06 0,14 45,65 0,28 0,22 13,68 0,24 100,04 1,13 0,17 86,9 MU74 2a p2 rim a 39,57 0,05 0,11 44,70 0,28 0,10 14,72 0,23 99,78 1,11 0,18 85,7 MU74 2a p3 rim b 39,57 0,04 0,06 44,47 0,28 0,15 14,32 0,27 99,27 1,10 0,18 86,0 MU74 2a q1 core 39,21 0,05 0,05 44,09 0,25 0,25 14,59 0,26 98,76 1,09 0,18 85,7 MU74 2a q2 rim 39,22 0,05 0,00 43,72 0,28 0,19 15,19 0,24 98,89 1,08 0,19 85,1 MU74 2a r1 core X 39,75 0,05 0,08 45,16 0,25 0,24 13,70 0,31 99,53 1,12 0,17 86,7 MU74 2a r2 rim X 39,84 0,04 0,06 45,71 0,25 0,08 13,31 0,29 99,69 1,13 0,17 87,2 MU74 2a s1 core 39,75 0,04 0,08 45,01 0,25 0,20 14,06 0,26 99,64 1,12 0,18 86,4 MU74 2a s2 ~rim 39,79 0,06 0,08 44,52 0,26 0,16 14,54 0,26 99,66 1,10 0,18 85,8 MU74 2a t1 core 1 40,00 0,06 0,14 45,88 0,25 0,12 12,94 0,28 99,67 1,14 0,16 87,5 MU74 2a t2 core 2 39,72 0,03 0,09 44,93 0,27 0,23 13,90 0,28 99,45 1,11 0,17 86,5 MU74 2a t3 ~core 3 39,77 0,02 0,01 43,82 0,27 0,22 15,13 0,23 99,47 1,09 0,19 85,2 MU74 2a v1 core X 38,71 0,04 0,07 40,98 0,26 0,25 18,47 0,16 98,94 1,02 0,23 81,5 MU74 2a v2 rim a X 36,92 0,03 0,00 33,24 0,22 0,31 27,25 0,15 98,11 0,82 0,34 70,7 MU74 2a v3 rim b X 39,00 0,04 0,05 41,60 0,31 0,23 17,58 0,16 99,10 1,03 0,22 82,4 MU74 2a w1 core 38,97 0,05 0,00 41,20 0,27 0,24 18,68 0,20 99,80 1,02 0,23 81,4 MU74 2a w2 rim a 39,82 0,02 0,09 44,27 0,28 0,12 14,87 0,21 99,77 1,10 0,19 85,5 MU74 2a w3 rim b 39,83 0,05 0,00 44,23 0,29 0,14 14,97 0,27 99,79 1,10 0,19 85,4 MU74-3 1c1 core a X 39,99 0,00 0,05 0,11 47,74 0,23 0,17 11,59 0,38 100,31 1,18 0,15 89,1 MU74-3 1c2 core b X 39,84 0,00 0,05 0,04 47,20 0,24 0,16 12,57 0,39 100,50 1,17 0,16 88,1 MU74-3 1c3 core c X 40,01 0,02 0,08 0,09 47,87 0,24 0,21 12,18 0,41 101,12 1,19 0,15 88,6 MU74-3 2b1 rim a 38,44 0,04 0,04 0,04 39,99 0,32 0,35 21,80 0,22 101,24 0,99 0,27 78,4 MU74-3 2b2 rim b 38,12 0,03 0,05 0,03 39,93 0,31 0,36 21,27 0,24 100,33 0,99 0,27 78,8 MU74-3 2c1 core 38,84 0,00 0,03 0,00 43,79 0,27 0,27 16,42 0,19 99,83 1,09 0,21 84,1 MU74-3 3b1 rim 1 39,09 0,01 0,06 0,09 42,30 0,26 0,27 18,35 0,27 100,72 1,05 0,23 82,0 MU74-3 3b2 rim 2 39,04 0,04 0,03 0,06 42,32 0,27 0,24 18,29 0,27 100,56 1,05 0,23 82,1 MU74-3 3c1 core 1 X 40,05 0,01 0,07 0,07 47,80 0,24 0,03 11,26 0,40 99,95 1,19 0,14 89,4 MU74-3 3c2 core 2 X 40,32 0,00 0,04 0,19 48,20 0,25 0,09 11,25 0,45 100,80 1,20 0,14 89,5 MU74-3 3c3 core 3 X 40,26 0,00 0,06 0,08 47,79 0,23 0,20 11,25 0,44 100,30 1,19 0,14 89,4 MU74-3 3c4 core 4 40,27 0,00 0,08 0,08 47,84 0,25 0,09 11,24 0,46 100,32 1,19 0,14 89,4 MU74-3 4b1 rim 1 X 38,34 0,00 0,05 0,07 40,65 0,29 0,33 20,45 0,23 100,40 1,01 0,26 79,7 MU74-3 4b2 rim 3 38,75 0,02 0,06 0,07 42,54 0,28 0,31 18,30 0,21 100,55 1,06 0,23 82,2 MU74-3 4c1 core 1 X 40,05 0,00 0,09 0,14 48,10 0,24 0,13 10,90 0,39 100,03 1,19 0,14 89,7 MU74-3 4c2 core 2 40,16 0,00 0,03 0,13 48,04 0,23 0,17 11,14 0,45 100,38 1,19 0,14 89,5 MU74-3 4c3 core 3 40,30 0,01 0,13 0,05 48,02 0,23 0,20 11,31 0,48 100,74 1,19 0,14 89,4 MU74-3 5b1 rim a 38,31 0,03 0,14 0,01 39,92 0,32 0,29 21,41 0,18 100,66 0,99 0,27 78,7
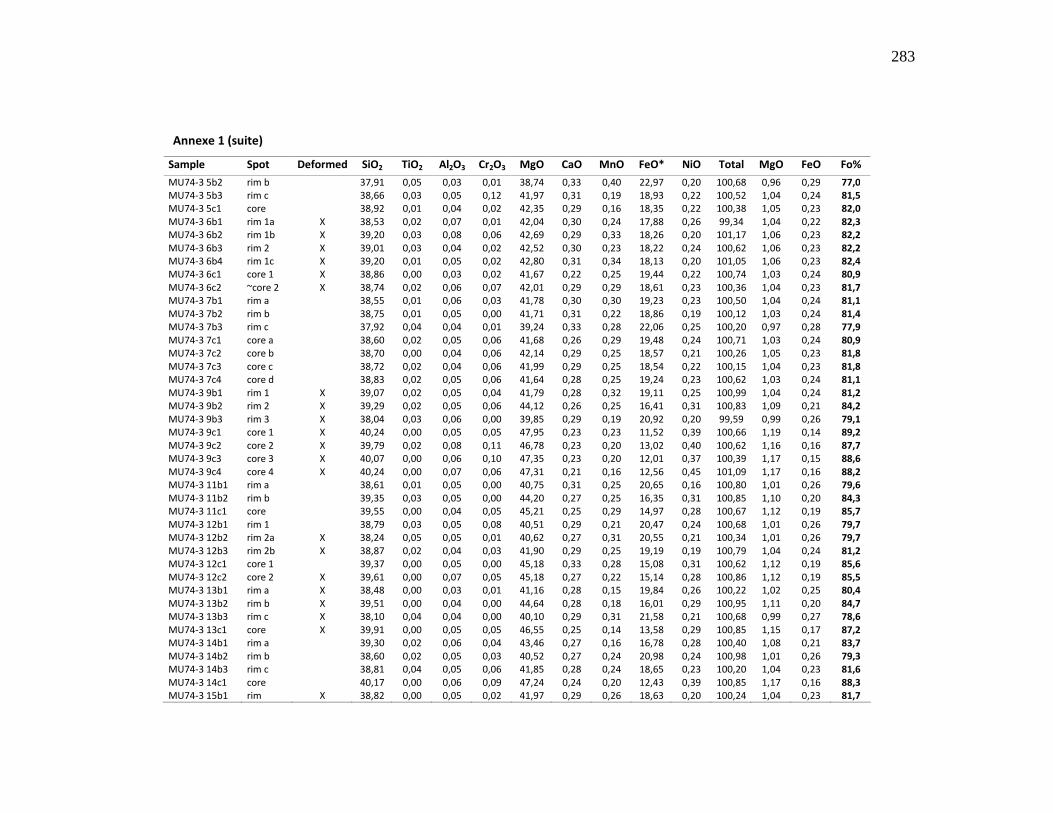
283
Annexe 1 (suite)
Sample Spot Deformed SiO2 TiO2 Al2O3 Cr2O3 MgO CaO MnO FeO* NiO Total MgO FeO Fo%
MU74-3 5b2 rim b 37,91 0,05 0,03 0,01 38,74 0,33 0,40 22,97 0,20 100,68 0,96 0,29 77,0 MU74-3 5b3 rim c 38,66 0,03 0,05 0,12 41,97 0,31 0,19 18,93 0,22 100,52 1,04 0,24 81,5 MU74-3 5c1 core 38,92 0,01 0,04 0,02 42,35 0,29 0,16 18,35 0,22 100,38 1,05 0,23 82,0 MU74-3 6b1 rim 1a X 38,53 0,02 0,07 0,01 42,04 0,30 0,24 17,88 0,26 99,34 1,04 0,22 82,3 MU74-3 6b2 rim 1b X 39,20 0,03 0,08 0,06 42,69 0,29 0,33 18,26 0,20 101,17 1,06 0,23 82,2 MU74-3 6b3 rim 2 X 39,01 0,03 0,04 0,02 42,52 0,30 0,23 18,22 0,24 100,62 1,06 0,23 82,2 MU74-3 6b4 rim 1c X 39,20 0,01 0,05 0,02 42,80 0,31 0,34 18,13 0,20 101,05 1,06 0,23 82,4 MU74-3 6c1 core 1 X 38,86 0,00 0,03 0,02 41,67 0,22 0,25 19,44 0,22 100,74 1,03 0,24 80,9 MU74-3 6c2 ~core 2 X 38,74 0,02 0,06 0,07 42,01 0,29 0,29 18,61 0,23 100,36 1,04 0,23 81,7 MU74-3 7b1 rim a 38,55 0,01 0,06 0,03 41,78 0,30 0,30 19,23 0,23 100,50 1,04 0,24 81,1 MU74-3 7b2 rim b 38,75 0,01 0,05 0,00 41,71 0,31 0,22 18,86 0,19 100,12 1,03 0,24 81,4 MU74-3 7b3 rim c 37,92 0,04 0,04 0,01 39,24 0,33 0,28 22,06 0,25 100,20 0,97 0,28 77,9 MU74-3 7c1 core a 38,60 0,02 0,05 0,06 41,68 0,26 0,29 19,48 0,24 100,71 1,03 0,24 80,9 MU74-3 7c2 core b 38,70 0,00 0,04 0,06 42,14 0,29 0,25 18,57 0,21 100,26 1,05 0,23 81,8 MU74-3 7c3 core c 38,72 0,02 0,04 0,06 41,99 0,29 0,25 18,54 0,22 100,15 1,04 0,23 81,8 MU74-3 7c4 core d 38,83 0,02 0,05 0,06 41,64 0,28 0,25 19,24 0,23 100,62 1,03 0,24 81,1 MU74-3 9b1 rim 1 X 39,07 0,02 0,05 0,04 41,79 0,28 0,32 19,11 0,25 100,99 1,04 0,24 81,2 MU74-3 9b2 rim 2 X 39,29 0,02 0,05 0,06 44,12 0,26 0,25 16,41 0,31 100,83 1,09 0,21 84,2 MU74-3 9b3 rim 3 X 38,04 0,03 0,06 0,00 39,85 0,29 0,19 20,92 0,20 99,59 0,99 0,26 79,1 MU74-3 9c1 core 1 X 40,24 0,00 0,05 0,05 47,95 0,23 0,23 11,52 0,39 100,66 1,19 0,14 89,2 MU74-3 9c2 core 2 X 39,79 0,02 0,08 0,11 46,78 0,23 0,20 13,02 0,40 100,62 1,16 0,16 87,7 MU74-3 9c3 core 3 X 40,07 0,00 0,06 0,10 47,35 0,23 0,20 12,01 0,37 100,39 1,17 0,15 88,6 MU74-3 9c4 core 4 X 40,24 0,00 0,07 0,06 47,31 0,21 0,16 12,56 0,45 101,09 1,17 0,16 88,2 MU74-3 11b1 rim a 38,61 0,01 0,05 0,00 40,75 0,31 0,25 20,65 0,16 100,80 1,01 0,26 79,6 MU74-3 11b2 rim b 39,35 0,03 0,05 0,00 44,20 0,27 0,25 16,35 0,31 100,85 1,10 0,20 84,3 MU74-3 11c1 core 39,55 0,00 0,04 0,05 45,21 0,25 0,29 14,97 0,28 100,67 1,12 0,19 85,7 MU74-3 12b1 rim 1 38,79 0,03 0,05 0,08 40,51 0,29 0,21 20,47 0,24 100,68 1,01 0,26 79,7 MU74-3 12b2 rim 2a X 38,24 0,05 0,05 0,01 40,62 0,27 0,31 20,55 0,21 100,34 1,01 0,26 79,7 MU74-3 12b3 rim 2b X 38,87 0,02 0,04 0,03 41,90 0,29 0,25 19,19 0,19 100,79 1,04 0,24 81,2 MU74-3 12c1 core 1 39,37 0,00 0,05 0,00 45,18 0,33 0,28 15,08 0,31 100,62 1,12 0,19 85,6 MU74-3 12c2 core 2 X 39,61 0,00 0,07 0,05 45,18 0,27 0,22 15,14 0,28 100,86 1,12 0,19 85,5 MU74-3 13b1 rim a X 38,48 0,00 0,03 0,01 41,16 0,28 0,15 19,84 0,26 100,22 1,02 0,25 80,4 MU74-3 13b2 rim b X 39,51 0,00 0,04 0,00 44,64 0,28 0,18 16,01 0,29 100,95 1,11 0,20 84,7 MU74-3 13b3 rim c X 38,10 0,04 0,04 0,00 40,10 0,29 0,31 21,58 0,21 100,68 0,99 0,27 78,6 MU74-3 13c1 core X 39,91 0,00 0,05 0,05 46,55 0,25 0,14 13,58 0,29 100,85 1,15 0,17 87,2 MU74-3 14b1 rim a 39,30 0,02 0,06 0,04 43,46 0,27 0,16 16,78 0,28 100,40 1,08 0,21 83,7 MU74-3 14b2 rim b 38,60 0,02 0,05 0,03 40,52 0,27 0,24 20,98 0,24 100,98 1,01 0,26 79,3 MU74-3 14b3 rim c 38,81 0,04 0,05 0,06 41,85 0,28 0,24 18,65 0,23 100,20 1,04 0,23 81,6 MU74-3 14c1 core 40,17 0,00 0,06 0,09 47,24 0,24 0,20 12,43 0,39 100,85 1,17 0,16 88,3 MU74-3 15b1 rim X 38,82 0,00 0,05 0,02 41,97 0,29 0,26 18,63 0,20 100,24 1,04 0,23 81,7
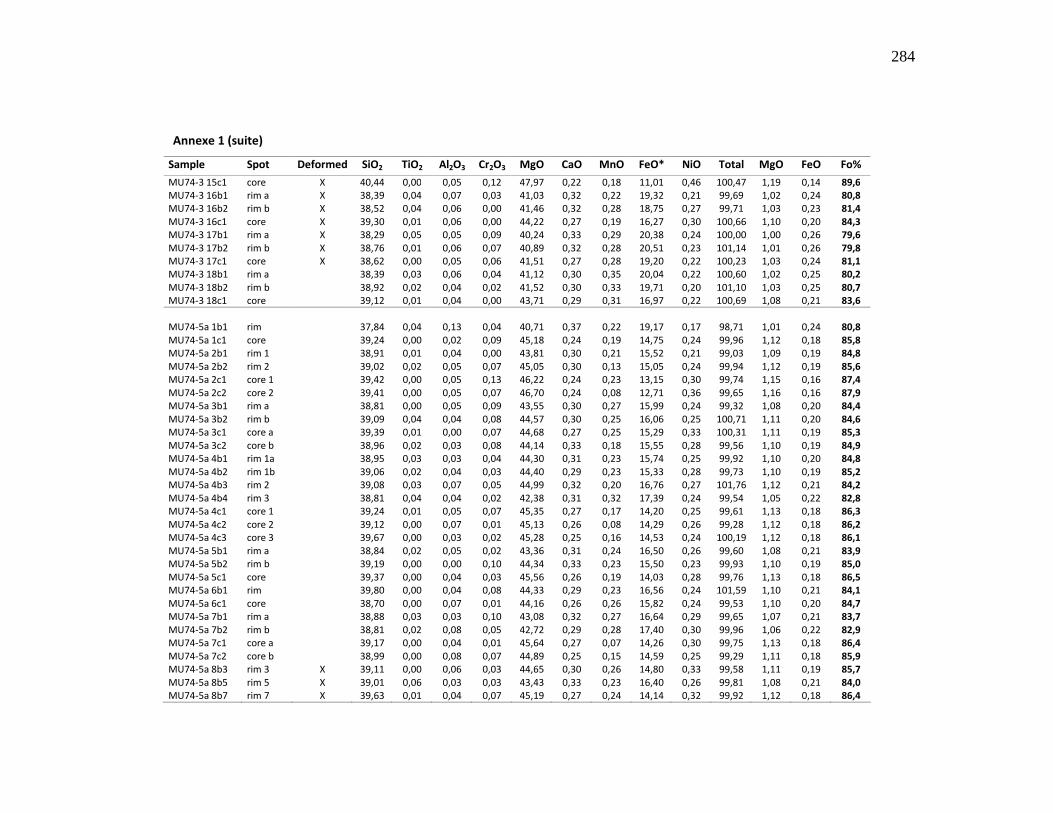
284
Annexe 1 (suite)
Sample Spot Deformed SiO2 TiO2 Al2O3 Cr2O3 MgO CaO MnO FeO* NiO Total MgO FeO Fo%
MU74-3 15c1 core X 40,44 0,00 0,05 0,12 47,97 0,22 0,18 11,01 0,46 100,47 1,19 0,14 89,6 MU74-3 16b1 rim a X 38,39 0,04 0,07 0,03 41,03 0,32 0,22 19,32 0,21 99,69 1,02 0,24 80,8 MU74-3 16b2 rim b X 38,52 0,04 0,06 0,00 41,46 0,32 0,28 18,75 0,27 99,71 1,03 0,23 81,4 MU74-3 16c1 core X 39,30 0,01 0,06 0,00 44,22 0,27 0,19 16,27 0,30 100,66 1,10 0,20 84,3 MU74-3 17b1 rim a X 38,29 0,05 0,05 0,09 40,24 0,33 0,29 20,38 0,24 100,00 1,00 0,26 79,6 MU74-3 17b2 rim b X 38,76 0,01 0,06 0,07 40,89 0,32 0,28 20,51 0,23 101,14 1,01 0,26 79,8 MU74-3 17c1 core X 38,62 0,00 0,05 0,06 41,51 0,27 0,28 19,20 0,22 100,23 1,03 0,24 81,1 MU74-3 18b1 rim a 38,39 0,03 0,06 0,04 41,12 0,30 0,35 20,04 0,22 100,60 1,02 0,25 80,2 MU74-3 18b2 rim b 38,92 0,02 0,04 0,02 41,52 0,30 0,33 19,71 0,20 101,10 1,03 0,25 80,7 MU74-3 18c1 core 39,12 0,01 0,04 0,00 43,71 0,29 0,31 16,97 0,22 100,69 1,08 0,21 83,6
MU74-5a 1b1 rim 37,84 0,04 0,13 0,04 40,71 0,37 0,22 19,17 0,17 98,71 1,01 0,24 80,8 MU74-5a 1c1 core 39,24 0,00 0,02 0,09 45,18 0,24 0,19 14,75 0,24 99,96 1,12 0,18 85,8 MU74-5a 2b1 rim 1 38,91 0,01 0,04 0,00 43,81 0,30 0,21 15,52 0,21 99,03 1,09 0,19 84,8 MU74-5a 2b2 rim 2 39,02 0,02 0,05 0,07 45,05 0,30 0,13 15,05 0,24 99,94 1,12 0,19 85,6 MU74-5a 2c1 core 1 39,42 0,00 0,05 0,13 46,22 0,24 0,23 13,15 0,30 99,74 1,15 0,16 87,4 MU74-5a 2c2 core 2 39,41 0,00 0,05 0,07 46,70 0,24 0,08 12,71 0,36 99,65 1,16 0,16 87,9 MU74-5a 3b1 rim a 38,81 0,00 0,05 0,09 43,55 0,30 0,27 15,99 0,24 99,32 1,08 0,20 84,4 MU74-5a 3b2 rim b 39,09 0,04 0,04 0,08 44,57 0,30 0,25 16,06 0,25 100,71 1,11 0,20 84,6 MU74-5a 3c1 core a 39,39 0,01 0,00 0,07 44,68 0,27 0,25 15,29 0,33 100,31 1,11 0,19 85,3 MU74-5a 3c2 core b 38,96 0,02 0,03 0,08 44,14 0,33 0,18 15,55 0,28 99,56 1,10 0,19 84,9 MU74-5a 4b1 rim 1a 38,95 0,03 0,03 0,04 44,30 0,31 0,23 15,74 0,25 99,92 1,10 0,20 84,8 MU74-5a 4b2 rim 1b 39,06 0,02 0,04 0,03 44,40 0,29 0,23 15,33 0,28 99,73 1,10 0,19 85,2 MU74-5a 4b3 rim 2 39,08 0,03 0,07 0,05 44,99 0,32 0,20 16,76 0,27 101,76 1,12 0,21 84,2 MU74-5a 4b4 rim 3 38,81 0,04 0,04 0,02 42,38 0,31 0,32 17,39 0,24 99,54 1,05 0,22 82,8 MU74-5a 4c1 core 1 39,24 0,01 0,05 0,07 45,35 0,27 0,17 14,20 0,25 99,61 1,13 0,18 86,3 MU74-5a 4c2 core 2 39,12 0,00 0,07 0,01 45,13 0,26 0,08 14,29 0,26 99,28 1,12 0,18 86,2 MU74-5a 4c3 core 3 39,67 0,00 0,03 0,02 45,28 0,25 0,16 14,53 0,24 100,19 1,12 0,18 86,1 MU74-5a 5b1 rim a 38,84 0,02 0,05 0,02 43,36 0,31 0,24 16,50 0,26 99,60 1,08 0,21 83,9 MU74-5a 5b2 rim b 39,19 0,00 0,00 0,10 44,34 0,33 0,23 15,50 0,23 99,93 1,10 0,19 85,0 MU74-5a 5c1 core 39,37 0,00 0,04 0,03 45,56 0,26 0,19 14,03 0,28 99,76 1,13 0,18 86,5 MU74-5a 6b1 rim 39,80 0,00 0,04 0,08 44,33 0,29 0,23 16,56 0,24 101,59 1,10 0,21 84,1 MU74-5a 6c1 core 38,70 0,00 0,07 0,01 44,16 0,26 0,26 15,82 0,24 99,53 1,10 0,20 84,7 MU74-5a 7b1 rim a 38,88 0,03 0,03 0,10 43,08 0,32 0,27 16,64 0,29 99,65 1,07 0,21 83,7 MU74-5a 7b2 rim b 38,81 0,02 0,08 0,05 42,72 0,29 0,28 17,40 0,30 99,96 1,06 0,22 82,9 MU74-5a 7c1 core a 39,17 0,00 0,04 0,01 45,64 0,27 0,07 14,26 0,30 99,75 1,13 0,18 86,4 MU74-5a 7c2 core b 38,99 0,00 0,08 0,07 44,89 0,25 0,15 14,59 0,25 99,29 1,11 0,18 85,9 MU74-5a 8b3 rim 3 X 39,11 0,00 0,06 0,03 44,65 0,30 0,26 14,80 0,33 99,58 1,11 0,19 85,7 MU74-5a 8b5 rim 5 X 39,01 0,06 0,03 0,03 43,43 0,33 0,23 16,40 0,26 99,81 1,08 0,21 84,0 MU74-5a 8b7 rim 7 X 39,63 0,01 0,04 0,07 45,19 0,27 0,24 14,14 0,32 99,92 1,12 0,18 86,4
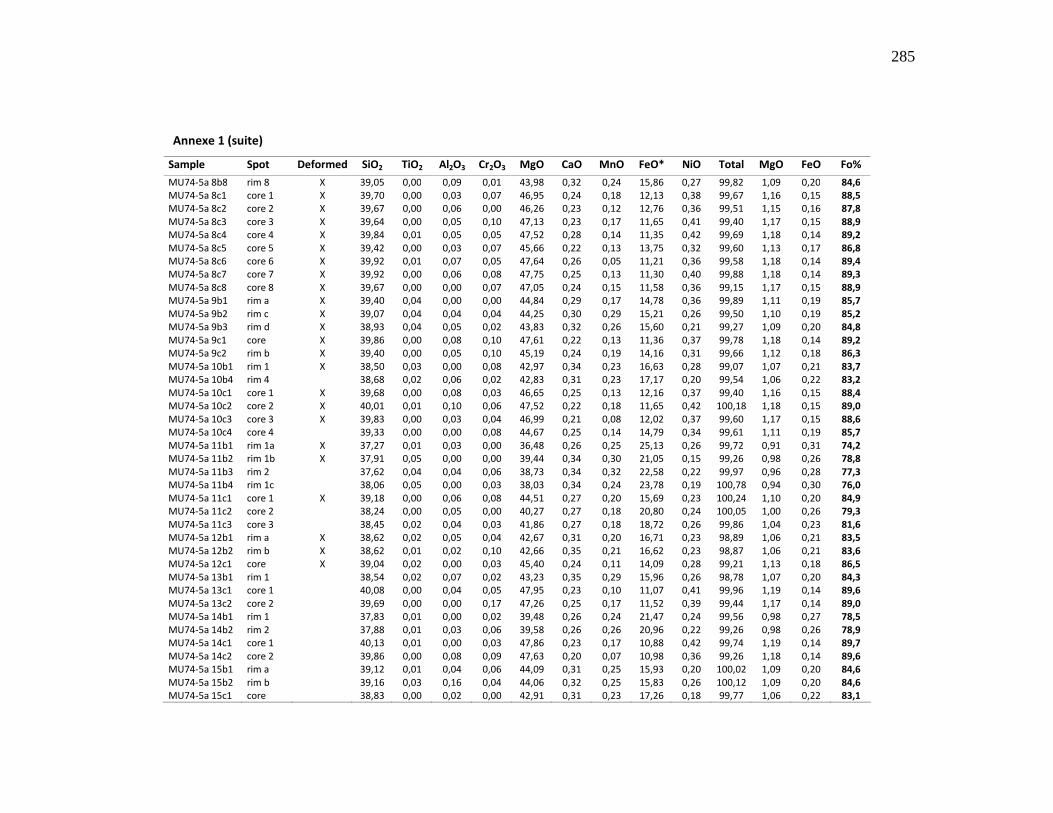
285
Annexe 1 (suite)
Sample Spot Deformed SiO2 TiO2 Al2O3 Cr2O3 MgO CaO MnO FeO* NiO Total MgO FeO Fo%
MU74-5a 8b8 rim 8 X 39,05 0,00 0,09 0,01 43,98 0,32 0,24 15,86 0,27 99,82 1,09 0,20 84,6 MU74-5a 8c1 core 1 X 39,70 0,00 0,03 0,07 46,95 0,24 0,18 12,13 0,38 99,67 1,16 0,15 88,5 MU74-5a 8c2 core 2 X 39,67 0,00 0,06 0,00 46,26 0,23 0,12 12,76 0,36 99,51 1,15 0,16 87,8 MU74-5a 8c3 core 3 X 39,64 0,00 0,05 0,10 47,13 0,23 0,17 11,65 0,41 99,40 1,17 0,15 88,9 MU74-5a 8c4 core 4 X 39,84 0,01 0,05 0,05 47,52 0,28 0,14 11,35 0,42 99,69 1,18 0,14 89,2 MU74-5a 8c5 core 5 X 39,42 0,00 0,03 0,07 45,66 0,22 0,13 13,75 0,32 99,60 1,13 0,17 86,8 MU74-5a 8c6 core 6 X 39,92 0,01 0,07 0,05 47,64 0,26 0,05 11,21 0,36 99,58 1,18 0,14 89,4 MU74-5a 8c7 core 7 X 39,92 0,00 0,06 0,08 47,75 0,25 0,13 11,30 0,40 99,88 1,18 0,14 89,3 MU74-5a 8c8 core 8 X 39,67 0,00 0,00 0,07 47,05 0,24 0,15 11,58 0,36 99,15 1,17 0,15 88,9 MU74-5a 9b1 rim a X 39,40 0,04 0,00 0,00 44,84 0,29 0,17 14,78 0,36 99,89 1,11 0,19 85,7 MU74-5a 9b2 rim c X 39,07 0,04 0,04 0,04 44,25 0,30 0,29 15,21 0,26 99,50 1,10 0,19 85,2 MU74-5a 9b3 rim d X 38,93 0,04 0,05 0,02 43,83 0,32 0,26 15,60 0,21 99,27 1,09 0,20 84,8 MU74-5a 9c1 core X 39,86 0,00 0,08 0,10 47,61 0,22 0,13 11,36 0,37 99,78 1,18 0,14 89,2 MU74-5a 9c2 rim b X 39,40 0,00 0,05 0,10 45,19 0,24 0,19 14,16 0,31 99,66 1,12 0,18 86,3 MU74-5a 10b1 rim 1 X 38,50 0,03 0,00 0,08 42,97 0,34 0,23 16,63 0,28 99,07 1,07 0,21 83,7 MU74-5a 10b4 rim 4 38,68 0,02 0,06 0,02 42,83 0,31 0,23 17,17 0,20 99,54 1,06 0,22 83,2 MU74-5a 10c1 core 1 X 39,68 0,00 0,08 0,03 46,65 0,25 0,13 12,16 0,37 99,40 1,16 0,15 88,4 MU74-5a 10c2 core 2 X 40,01 0,01 0,10 0,06 47,52 0,22 0,18 11,65 0,42 100,18 1,18 0,15 89,0 MU74-5a 10c3 core 3 X 39,83 0,00 0,03 0,04 46,99 0,21 0,08 12,02 0,37 99,60 1,17 0,15 88,6 MU74-5a 10c4 core 4 39,33 0,00 0,00 0,08 44,67 0,25 0,14 14,79 0,34 99,61 1,11 0,19 85,7 MU74-5a 11b1 rim 1a X 37,27 0,01 0,03 0,00 36,48 0,26 0,25 25,13 0,26 99,72 0,91 0,31 74,2 MU74-5a 11b2 rim 1b X 37,91 0,05 0,00 0,00 39,44 0,34 0,30 21,05 0,15 99,26 0,98 0,26 78,8 MU74-5a 11b3 rim 2 37,62 0,04 0,04 0,06 38,73 0,34 0,32 22,58 0,22 99,97 0,96 0,28 77,3 MU74-5a 11b4 rim 1c 38,06 0,05 0,00 0,03 38,03 0,34 0,24 23,78 0,19 100,78 0,94 0,30 76,0 MU74-5a 11c1 core 1 X 39,18 0,00 0,06 0,08 44,51 0,27 0,20 15,69 0,23 100,24 1,10 0,20 84,9 MU74-5a 11c2 core 2 38,24 0,00 0,05 0,00 40,27 0,27 0,18 20,80 0,24 100,05 1,00 0,26 79,3 MU74-5a 11c3 core 3 38,45 0,02 0,04 0,03 41,86 0,27 0,18 18,72 0,26 99,86 1,04 0,23 81,6 MU74-5a 12b1 rim a X 38,62 0,02 0,05 0,04 42,67 0,31 0,20 16,71 0,23 98,89 1,06 0,21 83,5 MU74-5a 12b2 rim b X 38,62 0,01 0,02 0,10 42,66 0,35 0,21 16,62 0,23 98,87 1,06 0,21 83,6 MU74-5a 12c1 core X 39,04 0,02 0,00 0,03 45,40 0,24 0,11 14,09 0,28 99,21 1,13 0,18 86,5 MU74-5a 13b1 rim 1 38,54 0,02 0,07 0,02 43,23 0,35 0,29 15,96 0,26 98,78 1,07 0,20 84,3 MU74-5a 13c1 core 1 40,08 0,00 0,04 0,05 47,95 0,23 0,10 11,07 0,41 99,96 1,19 0,14 89,6 MU74-5a 13c2 core 2 39,69 0,00 0,00 0,17 47,26 0,25 0,17 11,52 0,39 99,44 1,17 0,14 89,0 MU74-5a 14b1 rim 1 37,83 0,01 0,00 0,02 39,48 0,26 0,24 21,47 0,24 99,56 0,98 0,27 78,5 MU74-5a 14b2 rim 2 37,88 0,01 0,03 0,06 39,58 0,26 0,26 20,96 0,22 99,26 0,98 0,26 78,9 MU74-5a 14c1 core 1 40,13 0,01 0,00 0,03 47,86 0,23 0,17 10,88 0,42 99,74 1,19 0,14 89,7 MU74-5a 14c2 core 2 39,86 0,00 0,08 0,09 47,63 0,20 0,07 10,98 0,36 99,26 1,18 0,14 89,6 MU74-5a 15b1 rim a 39,12 0,01 0,04 0,06 44,09 0,31 0,25 15,93 0,20 100,02 1,09 0,20 84,6 MU74-5a 15b2 rim b 39,16 0,03 0,16 0,04 44,06 0,32 0,25 15,83 0,26 100,12 1,09 0,20 84,6 MU74-5a 15c1 core 38,83 0,00 0,02 0,00 42,91 0,31 0,23 17,26 0,18 99,77 1,06 0,22 83,1
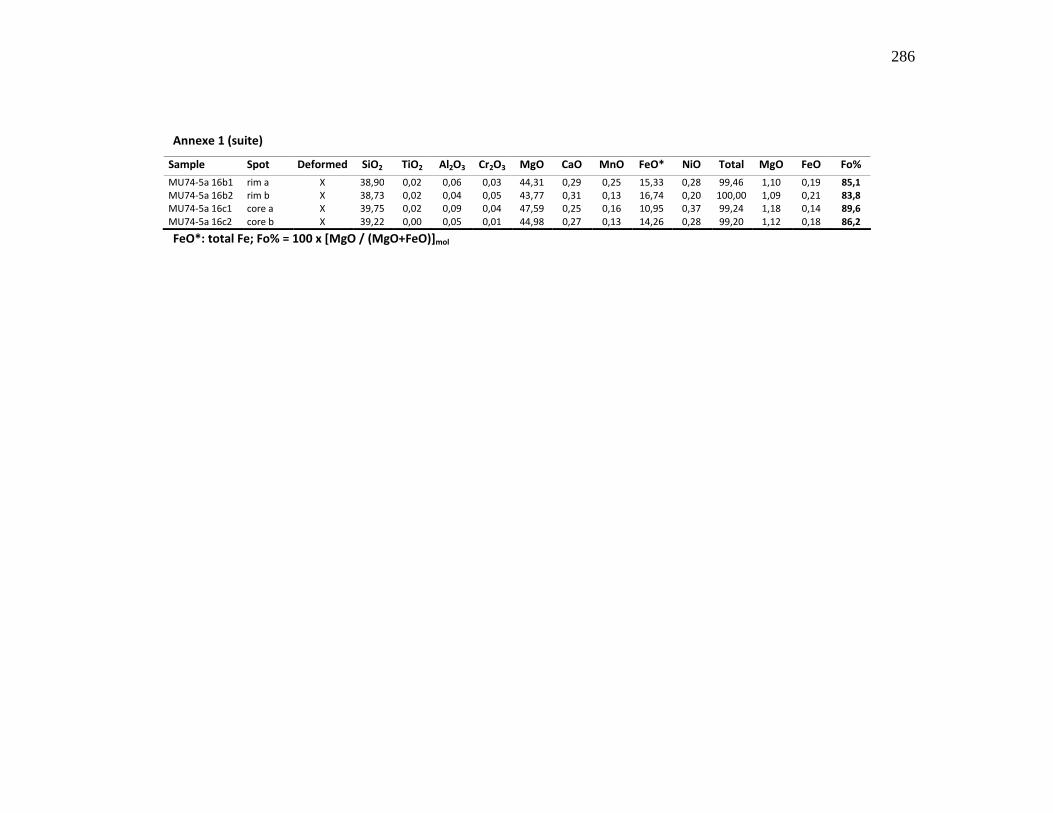
286
Annexe 1 (suite)
Sample Spot Deformed SiO2 TiO2 Al2O3 Cr2O3 MgO CaO MnO FeO* NiO Total MgO FeO Fo%
MU74-5a 16b1 rim a X 38,90 0,02 0,06 0,03 44,31 0,29 0,25 15,33 0,28 99,46 1,10 0,19 85,1 MU74-5a 16b2 rim b X 38,73 0,02 0,04 0,05 43,77 0,31 0,13 16,74 0,20 100,00 1,09 0,21 83,8 MU74-5a 16c1 core a X 39,75 0,02 0,09 0,04 47,59 0,25 0,16 10,95 0,37 99,24 1,18 0,14 89,6 MU74-5a 16c2 core b X 39,22 0,00 0,05 0,01 44,98 0,27 0,13 14,26 0,28 99,20 1,12 0,18 86,2
FeO*: total Fe; Fo% = 100 x [MgO / (MgO+FeO)]mol

287
ANNEXE 2
Compositions en éléments majeurs et mineurs d'olivines du Kilauea Iki provenant des scories et d'échantillons de forage du lac de lave. Ces données sont utilisées dans l'article 2, mais seule une sélection a été soumise pour publication.
(wt%) (mol) Sample Spot Depth
(m) Deformed SiO2 TiO2 Al2O3 Cr2O3 MgO CaO MnO FeO* NiO Total MgO FeO Fo%
Surface KI59 1 c o1 core - X 40,13 - 0,05 0,12 47,28 0,26 0,13 11,43 0,33 99,90 1,75 0,24 89,1 KI59 1 c o2 ~rim 1a - X 39,92 - 0,07 0,10 46,49 0,25 0,15 11,45 0,35 98,79 1,74 0,24 88,9 KI59 1 c o3 rim 1b - X 40,00 - 0,05 0,06 46,54 0,26 0,16 11,50 0,35 98,94 1,74 0,24 88,9 KI59 1 c o4 ~rim 1c - X 40,20 - 0,05 0,10 46,94 0,27 0,14 11,74 0,31 99,74 1,74 0,24 88,8 KI59 1 d o1 core 1a - X 40,31 - 0,09 0,03 47,55 0,24 0,19 10,77 0,36 99,53 1,76 0,22 89,7 KI59 1 d o2 rim - X 40,03 - 0,06 0,06 47,47 0,25 0,13 10,79 0,35 99,22 1,76 0,23 89,7 KI59 1 d o3 core 1b - X 39,97 - 0,07 0,07 47,20 0,26 0,12 10,70 0,33 98,72 1,76 0,22 89,8 KI59 1 h o1 core - X 39,67 - 0,07 0,04 46,06 0,24 0,16 12,24 0,33 98,98 1,73 0,26 88,2 KI59 1 h o3 rim 1b - X 39,95 - 0,06 0,11 46,30 0,27 0,21 12,06 0,27 99,36 1,73 0,25 88,4 KI59 1 h o4 ~rim 1c - X 40,14 - 0,07 0,06 46,35 0,27 0,14 12,37 0,31 99,77 1,72 0,26 88,1 KI59 1 j o1 core - X 40,11 - 0,05 0,12 47,20 0,25 0,16 11,31 0,32 99,52 1,75 0,24 89,2 KI59 1 j o2 rim 1a - X 39,57 - 0,07 0,04 44,62 0,30 0,21 14,67 0,21 99,68 1,68 0,31 85,8 KI59 1 j o3 rim 1b - X 40,21 - 0,06 0,08 47,07 0,26 0,18 11,49 0,35 99,70 1,74 0,24 89,0 KI59 1 j o4 rim 1c - X 40,35 - 0,06 0,07 47,27 0,26 0,16 11,24 0,31 99,72 1,75 0,23 89,3 KI59 1 l o1 core 1 - X 39,61 - 0,05 0,02 44,89 0,28 0,17 14,09 0,27 99,37 1,69 0,30 86,3 KI59 1 l o2 ~rim 2a - X 39,46 - 0,05 0,02 44,76 0,27 0,21 14,02 0,27 99,10 1,69 0,30 86,3 KI59 1 l o3 core 2 - X 39,20 - 0,05 0,05 44,43 0,27 0,23 13,88 0,25 98,49 1,69 0,30 86,4 KI59 1 l o4 rim 2b - X 39,40 - 0,05 0,04 44,54 0,28 0,19 14,09 0,26 98,90 1,68 0,30 86,2 KI59 1 l o5 rim 2c - X 39,27 - 0,05 0,05 44,66 0,27 0,18 13,95 0,25 98,70 1,69 0,30 86,4 KI59 1 p o1 core - X 40,07 - 0,05 0,07 47,35 0,26 0,12 10,78 0,43 99,17 1,76 0,22 89,7 KI59 1 p o2 ~rim 1a - X 39,99 - 0,06 0,10 47,24 0,23 0,22 11,00 0,38 99,22 1,75 0,23 89,5 KI59 1 p o3 rim 1b - X 39,79 - 0,07 0,10 46,22 0,25 0,10 12,14 0,39 99,05 1,73 0,26 88,3 KI59 1 a o1 core 1 - 39,95 - 0,03 0,04 46,85 0,25 0,16 11,67 0,36 99,35 1,74 0,24 88,8 KI59 1 a o2 core 2 - 40,22 - 0,06 0,11 46,93 0,25 0,13 11,41 0,29 99,39 1,74 0,24 89,1 KI59 1 a o3 core 3 - 40,48 - 0,06 0,01 47,15 0,26 0,17 11,38 0,37 99,88 1,74 0,24 89,1 KI59 1 a o4 rim 1 - 41,21 - 0,05 0,03 46,35 0,26 0,20 12,02 0,33 100,45 1,70 0,25 88,4 KI59 1 b o1 core 1 - 40,99 - 0,05 0,06 46,95 0,26 0,17 11,14 0,30 99,90 1,73 0,23 89,3 KI59 1 b o2 rim 1 - 39,61 - 0,05 0,07 46,72 0,27 0,12 11,33 0,31 98,59 1,75 0,24 89,1 KI59 1 b o3 rim 2a - 40,09 - 0,03 0,00 46,80 0,26 0,17 11,72 0,36 99,55 1,74 0,24 88,8 KI59 1 b o4 core 2 - 40,28 - 0,06 0,08 46,85 0,25 0,16 11,29 0,30 99,28 1,74 0,24 89,2 KI59 1 b o5 rim 2b - 39,90 - 0,06 0,07 46,72 0,27 0,19 11,99 0,30 99,61 1,74 0,25 88,5 KI59 1 e o1 core - 39,87 - 0,05 0,07 46,20 0,29 0,17 12,78 0,31 99,74 1,72 0,27 87,7
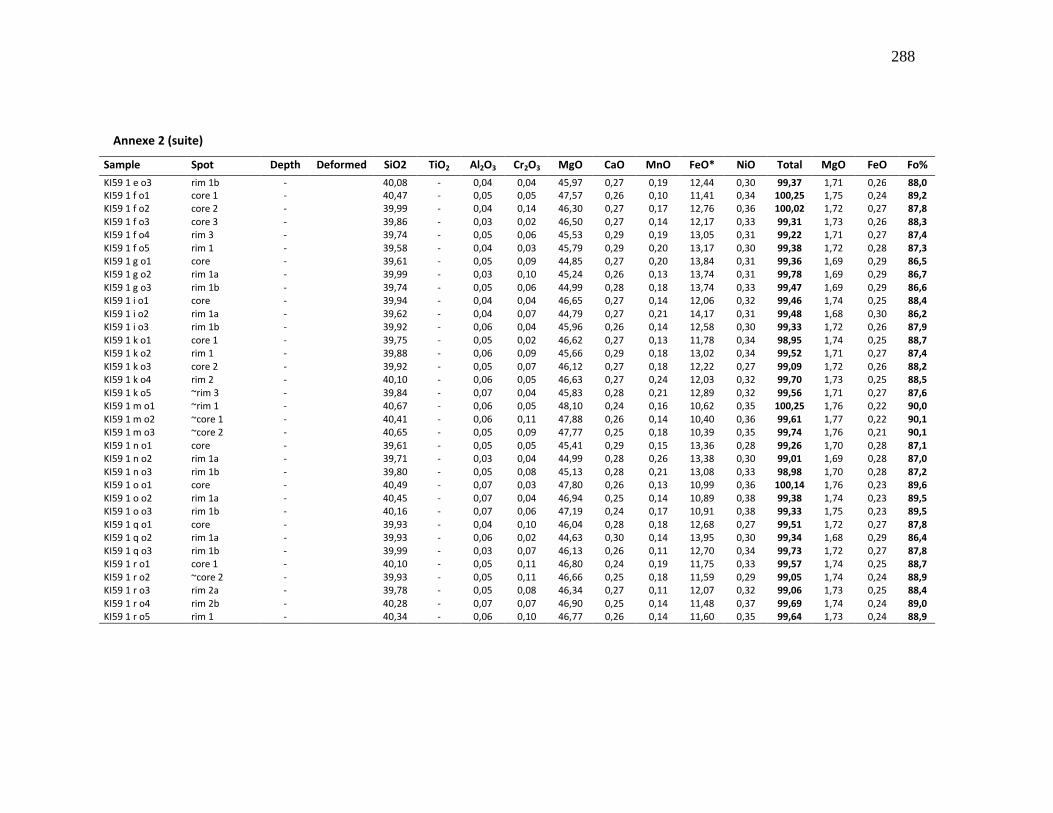
288
Annexe 2 (suite)
Sample Spot Depth Deformed SiO2 TiO2 Al2O3 Cr2O3 MgO CaO MnO FeO* NiO Total MgO FeO Fo%
KI59 1 e o3 rim 1b - 40,08 - 0,04 0,04 45,97 0,27 0,19 12,44 0,30 99,37 1,71 0,26 88,0 KI59 1 f o1 core 1 - 40,47 - 0,05 0,05 47,57 0,26 0,10 11,41 0,34 100,25 1,75 0,24 89,2 KI59 1 f o2 core 2 - 39,99 - 0,04 0,14 46,30 0,27 0,17 12,76 0,36 100,02 1,72 0,27 87,8 KI59 1 f o3 core 3 - 39,86 - 0,03 0,02 46,50 0,27 0,14 12,17 0,33 99,31 1,73 0,26 88,3 KI59 1 f o4 rim 3 - 39,74 - 0,05 0,06 45,53 0,29 0,19 13,05 0,31 99,22 1,71 0,27 87,4 KI59 1 f o5 rim 1 - 39,58 - 0,04 0,03 45,79 0,29 0,20 13,17 0,30 99,38 1,72 0,28 87,3 KI59 1 g o1 core - 39,61 - 0,05 0,09 44,85 0,27 0,20 13,84 0,31 99,36 1,69 0,29 86,5 KI59 1 g o2 rim 1a - 39,99 - 0,03 0,10 45,24 0,26 0,13 13,74 0,31 99,78 1,69 0,29 86,7 KI59 1 g o3 rim 1b - 39,74 - 0,05 0,06 44,99 0,28 0,18 13,74 0,33 99,47 1,69 0,29 86,6 KI59 1 i o1 core - 39,94 - 0,04 0,04 46,65 0,27 0,14 12,06 0,32 99,46 1,74 0,25 88,4 KI59 1 i o2 rim 1a - 39,62 - 0,04 0,07 44,79 0,27 0,21 14,17 0,31 99,48 1,68 0,30 86,2 KI59 1 i o3 rim 1b - 39,92 - 0,06 0,04 45,96 0,26 0,14 12,58 0,30 99,33 1,72 0,26 87,9 KI59 1 k o1 core 1 - 39,75 - 0,05 0,02 46,62 0,27 0,13 11,78 0,34 98,95 1,74 0,25 88,7 KI59 1 k o2 rim 1 - 39,88 - 0,06 0,09 45,66 0,29 0,18 13,02 0,34 99,52 1,71 0,27 87,4 KI59 1 k o3 core 2 - 39,92 - 0,05 0,07 46,12 0,27 0,18 12,22 0,27 99,09 1,72 0,26 88,2 KI59 1 k o4 rim 2 - 40,10 - 0,06 0,05 46,63 0,27 0,24 12,03 0,32 99,70 1,73 0,25 88,5 KI59 1 k o5 ~rim 3 - 39,84 - 0,07 0,04 45,83 0,28 0,21 12,89 0,32 99,56 1,71 0,27 87,6 KI59 1 m o1 ~rim 1 - 40,67 - 0,06 0,05 48,10 0,24 0,16 10,62 0,35 100,25 1,76 0,22 90,0 KI59 1 m o2 ~core 1 - 40,41 - 0,06 0,11 47,88 0,26 0,14 10,40 0,36 99,61 1,77 0,22 90,1 KI59 1 m o3 ~core 2 - 40,65 - 0,05 0,09 47,77 0,25 0,18 10,39 0,35 99,74 1,76 0,21 90,1 KI59 1 n o1 core - 39,61 - 0,05 0,05 45,41 0,29 0,15 13,36 0,28 99,26 1,70 0,28 87,1 KI59 1 n o2 rim 1a - 39,71 - 0,03 0,04 44,99 0,28 0,26 13,38 0,30 99,01 1,69 0,28 87,0 KI59 1 n o3 rim 1b - 39,80 - 0,05 0,08 45,13 0,28 0,21 13,08 0,33 98,98 1,70 0,28 87,2 KI59 1 o o1 core - 40,49 - 0,07 0,03 47,80 0,26 0,13 10,99 0,36 100,14 1,76 0,23 89,6 KI59 1 o o2 rim 1a - 40,45 - 0,07 0,04 46,94 0,25 0,14 10,89 0,38 99,38 1,74 0,23 89,5 KI59 1 o o3 rim 1b - 40,16 - 0,07 0,06 47,19 0,24 0,17 10,91 0,38 99,33 1,75 0,23 89,5 KI59 1 q o1 core - 39,93 - 0,04 0,10 46,04 0,28 0,18 12,68 0,27 99,51 1,72 0,27 87,8 KI59 1 q o2 rim 1a - 39,93 - 0,06 0,02 44,63 0,30 0,14 13,95 0,30 99,34 1,68 0,29 86,4 KI59 1 q o3 rim 1b - 39,99 - 0,03 0,07 46,13 0,26 0,11 12,70 0,34 99,73 1,72 0,27 87,8 KI59 1 r o1 core 1 - 40,10 - 0,05 0,11 46,80 0,24 0,19 11,75 0,33 99,57 1,74 0,25 88,7 KI59 1 r o2 ~core 2 - 39,93 - 0,05 0,11 46,66 0,25 0,18 11,59 0,29 99,05 1,74 0,24 88,9 KI59 1 r o3 rim 2a - 39,78 - 0,05 0,08 46,34 0,27 0,11 12,07 0,32 99,06 1,73 0,25 88,4 KI59 1 r o4 rim 2b - 40,28 - 0,07 0,07 46,90 0,25 0,14 11,48 0,37 99,69 1,74 0,24 89,0 KI59 1 r o5 rim 1 - 40,34 - 0,06 0,10 46,77 0,26 0,14 11,60 0,35 99,64 1,73 0,24 88,9
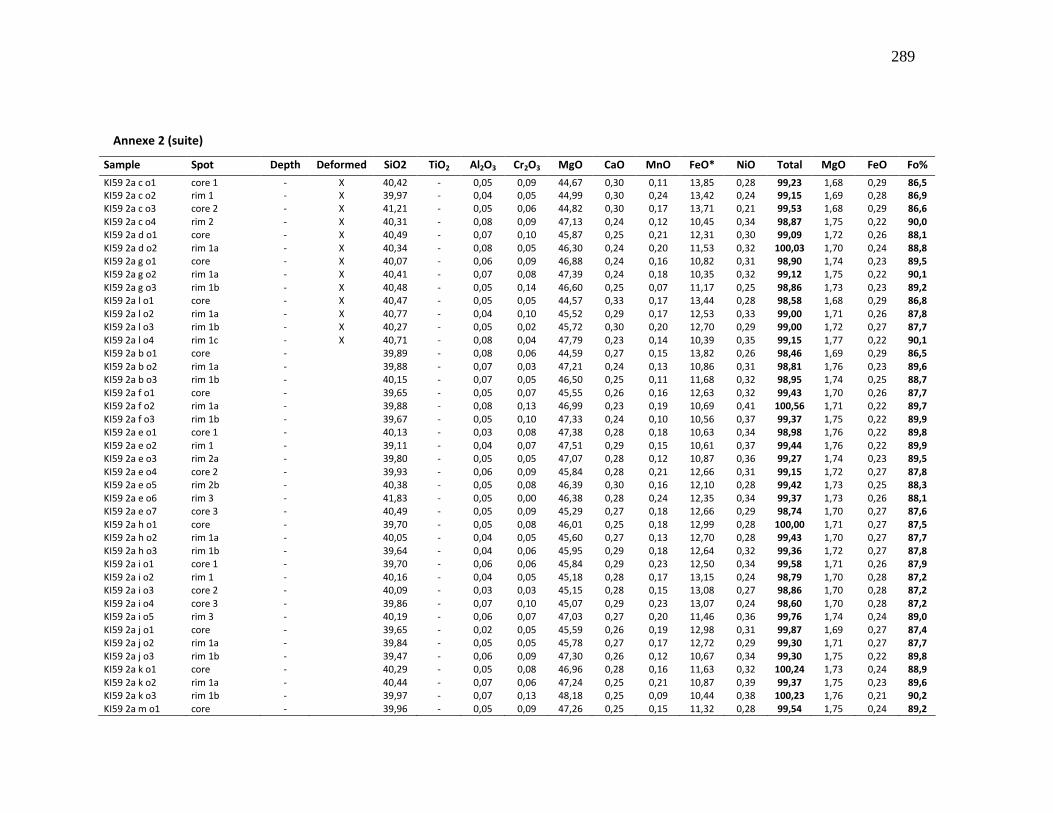
289
Annexe 2 (suite)
Sample Spot Depth Deformed SiO2 TiO2 Al2O3 Cr2O3 MgO CaO MnO FeO* NiO Total MgO FeO Fo%
KI59 2a c o1 core 1 - X 40,42 - 0,05 0,09 44,67 0,30 0,11 13,85 0,28 99,23 1,68 0,29 86,5 KI59 2a c o2 rim 1 - X 39,97 - 0,04 0,05 44,99 0,30 0,24 13,42 0,24 99,15 1,69 0,28 86,9 KI59 2a c o3 core 2 - X 41,21 - 0,05 0,06 44,82 0,30 0,17 13,71 0,21 99,53 1,68 0,29 86,6 KI59 2a c o4 rim 2 - X 40,31 - 0,08 0,09 47,13 0,24 0,12 10,45 0,34 98,87 1,75 0,22 90,0 KI59 2a d o1 core - X 40,49 - 0,07 0,10 45,87 0,25 0,21 12,31 0,30 99,09 1,72 0,26 88,1 KI59 2a d o2 rim 1a - X 40,34 - 0,08 0,05 46,30 0,24 0,20 11,53 0,32 100,03 1,70 0,24 88,8 KI59 2a g o1 core - X 40,07 - 0,06 0,09 46,88 0,24 0,16 10,82 0,31 98,90 1,74 0,23 89,5 KI59 2a g o2 rim 1a - X 40,41 - 0,07 0,08 47,39 0,24 0,18 10,35 0,32 99,12 1,75 0,22 90,1 KI59 2a g o3 rim 1b - X 40,48 - 0,05 0,14 46,60 0,25 0,07 11,17 0,25 98,86 1,73 0,23 89,2 KI59 2a l o1 core - X 40,47 - 0,05 0,05 44,57 0,33 0,17 13,44 0,28 98,58 1,68 0,29 86,8 KI59 2a l o2 rim 1a - X 40,77 - 0,04 0,10 45,52 0,29 0,17 12,53 0,33 99,00 1,71 0,26 87,8 KI59 2a l o3 rim 1b - X 40,27 - 0,05 0,02 45,72 0,30 0,20 12,70 0,29 99,00 1,72 0,27 87,7 KI59 2a l o4 rim 1c - X 40,71 - 0,08 0,04 47,79 0,23 0,14 10,39 0,35 99,15 1,77 0,22 90,1 KI59 2a b o1 core - 39,89 - 0,08 0,06 44,59 0,27 0,15 13,82 0,26 98,46 1,69 0,29 86,5 KI59 2a b o2 rim 1a - 39,88 - 0,07 0,03 47,21 0,24 0,13 10,86 0,31 98,81 1,76 0,23 89,6 KI59 2a b o3 rim 1b - 40,15 - 0,07 0,05 46,50 0,25 0,11 11,68 0,32 98,95 1,74 0,25 88,7 KI59 2a f o1 core - 39,65 - 0,05 0,07 45,55 0,26 0,16 12,63 0,32 99,43 1,70 0,26 87,7 KI59 2a f o2 rim 1a - 39,88 - 0,08 0,13 46,99 0,23 0,19 10,69 0,41 100,56 1,71 0,22 89,7 KI59 2a f o3 rim 1b - 39,67 - 0,05 0,10 47,33 0,24 0,10 10,56 0,37 99,37 1,75 0,22 89,9 KI59 2a e o1 core 1 - 40,13 - 0,03 0,08 47,38 0,28 0,18 10,63 0,34 98,98 1,76 0,22 89,8 KI59 2a e o2 rim 1 - 39,11 - 0,04 0,07 47,51 0,29 0,15 10,61 0,37 99,44 1,76 0,22 89,9 KI59 2a e o3 rim 2a - 39,80 - 0,05 0,05 47,07 0,28 0,12 10,87 0,36 99,27 1,74 0,23 89,5 KI59 2a e o4 core 2 - 39,93 - 0,06 0,09 45,84 0,28 0,21 12,66 0,31 99,15 1,72 0,27 87,8 KI59 2a e o5 rim 2b - 40,38 - 0,05 0,08 46,39 0,30 0,16 12,10 0,28 99,42 1,73 0,25 88,3 KI59 2a e o6 rim 3 - 41,83 - 0,05 0,00 46,38 0,28 0,24 12,35 0,34 99,37 1,73 0,26 88,1 KI59 2a e o7 core 3 - 40,49 - 0,05 0,09 45,29 0,27 0,18 12,66 0,29 98,74 1,70 0,27 87,6 KI59 2a h o1 core - 39,70 - 0,05 0,08 46,01 0,25 0,18 12,99 0,28 100,00 1,71 0,27 87,5 KI59 2a h o2 rim 1a - 40,05 - 0,04 0,05 45,60 0,27 0,13 12,70 0,28 99,43 1,70 0,27 87,7 KI59 2a h o3 rim 1b - 39,64 - 0,04 0,06 45,95 0,29 0,18 12,64 0,32 99,36 1,72 0,27 87,8 KI59 2a i o1 core 1 - 39,70 - 0,06 0,06 45,84 0,29 0,23 12,50 0,34 99,58 1,71 0,26 87,9 KI59 2a i o2 rim 1 - 40,16 - 0,04 0,05 45,18 0,28 0,17 13,15 0,24 98,79 1,70 0,28 87,2 KI59 2a i o3 core 2 - 40,09 - 0,03 0,03 45,15 0,28 0,15 13,08 0,27 98,86 1,70 0,28 87,2 KI59 2a i o4 core 3 - 39,86 - 0,07 0,10 45,07 0,29 0,23 13,07 0,24 98,60 1,70 0,28 87,2 KI59 2a i o5 rim 3 - 40,19 - 0,06 0,07 47,03 0,27 0,20 11,46 0,36 99,76 1,74 0,24 89,0 KI59 2a j o1 core - 39,65 - 0,02 0,05 45,59 0,26 0,19 12,98 0,31 99,87 1,69 0,27 87,4 KI59 2a j o2 rim 1a - 39,84 - 0,05 0,05 45,78 0,27 0,17 12,72 0,29 99,30 1,71 0,27 87,7 KI59 2a j o3 rim 1b - 39,47 - 0,06 0,09 47,30 0,26 0,12 10,67 0,34 99,30 1,75 0,22 89,8 KI59 2a k o1 core - 40,29 - 0,05 0,08 46,96 0,28 0,16 11,63 0,32 100,24 1,73 0,24 88,9 KI59 2a k o2 rim 1a - 40,44 - 0,07 0,06 47,24 0,25 0,21 10,87 0,39 99,37 1,75 0,23 89,6 KI59 2a k o3 rim 1b - 39,97 - 0,07 0,13 48,18 0,25 0,09 10,44 0,38 100,23 1,76 0,21 90,2 KI59 2a m o1 core - 39,96 - 0,05 0,09 47,26 0,25 0,15 11,32 0,28 99,54 1,75 0,24 89,2
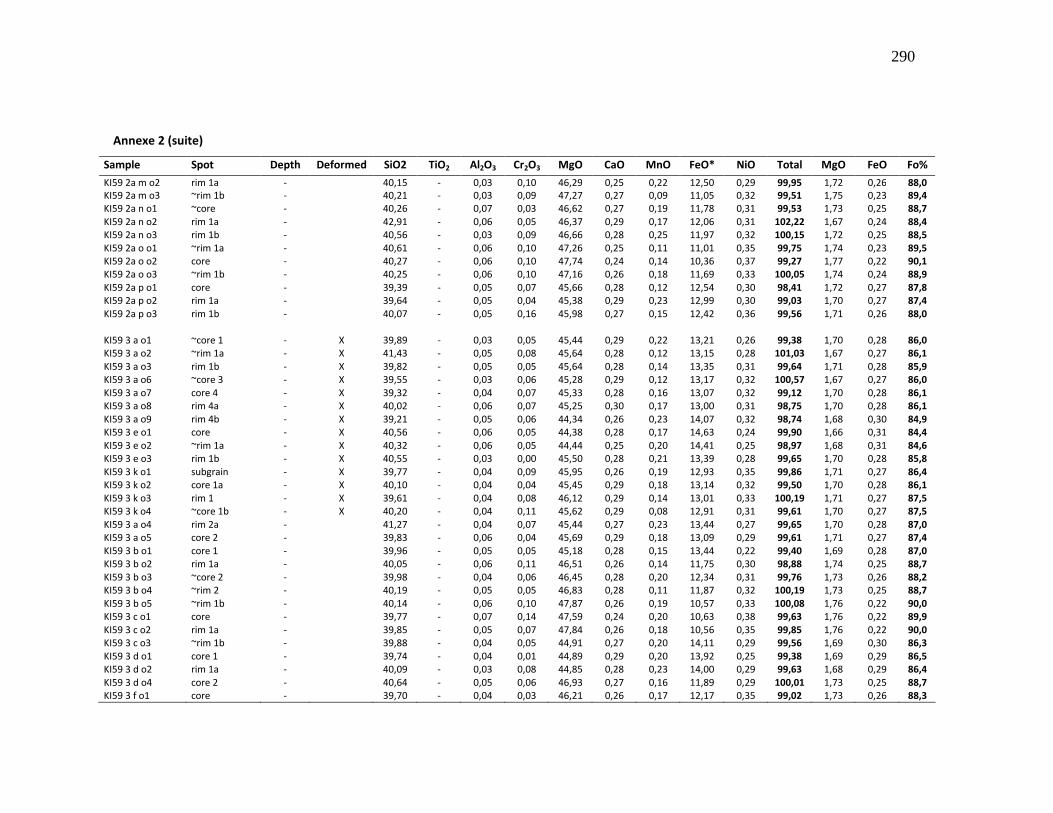
290
Annexe 2 (suite)
Sample Spot Depth Deformed SiO2 TiO2 Al2O3 Cr2O3 MgO CaO MnO FeO* NiO Total MgO FeO Fo%
KI59 2a m o2 rim 1a - 40,15 - 0,03 0,10 46,29 0,25 0,22 12,50 0,29 99,95 1,72 0,26 88,0 KI59 2a m o3 ~rim 1b - 40,21 - 0,03 0,09 47,27 0,27 0,09 11,05 0,32 99,51 1,75 0,23 89,4 KI59 2a n o1 ~core - 40,26 - 0,07 0,03 46,62 0,27 0,19 11,78 0,31 99,53 1,73 0,25 88,7 KI59 2a n o2 rim 1a - 42,91 - 0,06 0,05 46,37 0,29 0,17 12,06 0,31 102,22 1,67 0,24 88,4 KI59 2a n o3 rim 1b - 40,56 - 0,03 0,09 46,66 0,28 0,25 11,97 0,32 100,15 1,72 0,25 88,5 KI59 2a o o1 ~rim 1a - 40,61 - 0,06 0,10 47,26 0,25 0,11 11,01 0,35 99,75 1,74 0,23 89,5 KI59 2a o o2 core - 40,27 - 0,06 0,10 47,74 0,24 0,14 10,36 0,37 99,27 1,77 0,22 90,1 KI59 2a o o3 ~rim 1b - 40,25 - 0,06 0,10 47,16 0,26 0,18 11,69 0,33 100,05 1,74 0,24 88,9 KI59 2a p o1 core - 39,39 - 0,05 0,07 45,66 0,28 0,12 12,54 0,30 98,41 1,72 0,27 87,8 KI59 2a p o2 rim 1a - 39,64 - 0,05 0,04 45,38 0,29 0,23 12,99 0,30 99,03 1,70 0,27 87,4 KI59 2a p o3 rim 1b - 40,07 - 0,05 0,16 45,98 0,27 0,15 12,42 0,36 99,56 1,71 0,26 88,0 KI59 3 a o1 ~core 1 - X 39,89 - 0,03 0,05 45,44 0,29 0,22 13,21 0,26 99,38 1,70 0,28 86,0 KI59 3 a o2 ~rim 1a - X 41,43 - 0,05 0,08 45,64 0,28 0,12 13,15 0,28 101,03 1,67 0,27 86,1 KI59 3 a o3 rim 1b - X 39,82 - 0,05 0,05 45,64 0,28 0,14 13,35 0,31 99,64 1,71 0,28 85,9 KI59 3 a o6 ~core 3 - X 39,55 - 0,03 0,06 45,28 0,29 0,12 13,17 0,32 100,57 1,67 0,27 86,0 KI59 3 a o7 core 4 - X 39,32 - 0,04 0,07 45,33 0,28 0,16 13,07 0,32 99,12 1,70 0,28 86,1 KI59 3 a o8 rim 4a - X 40,02 - 0,06 0,07 45,25 0,30 0,17 13,00 0,31 98,75 1,70 0,28 86,1 KI59 3 a o9 rim 4b - X 39,21 - 0,05 0,06 44,34 0,26 0,23 14,07 0,32 98,74 1,68 0,30 84,9 KI59 3 e o1 core - X 40,56 - 0,06 0,05 44,38 0,28 0,17 14,63 0,24 99,90 1,66 0,31 84,4 KI59 3 e o2 ~rim 1a - X 40,32 - 0,06 0,05 44,44 0,25 0,20 14,41 0,25 98,97 1,68 0,31 84,6 KI59 3 e o3 rim 1b - X 40,55 - 0,03 0,00 45,50 0,28 0,21 13,39 0,28 99,65 1,70 0,28 85,8 KI59 3 k o1 subgrain - X 39,77 - 0,04 0,09 45,95 0,26 0,19 12,93 0,35 99,86 1,71 0,27 86,4 KI59 3 k o2 core 1a - X 40,10 - 0,04 0,04 45,45 0,29 0,18 13,14 0,32 99,50 1,70 0,28 86,1 KI59 3 k o3 rim 1 - X 39,61 - 0,04 0,08 46,12 0,29 0,14 13,01 0,33 100,19 1,71 0,27 87,5 KI59 3 k o4 ~core 1b - X 40,20 - 0,04 0,11 45,62 0,29 0,08 12,91 0,31 99,61 1,70 0,27 87,5 KI59 3 a o4 rim 2a - 41,27 - 0,04 0,07 45,44 0,27 0,23 13,44 0,27 99,65 1,70 0,28 87,0 KI59 3 a o5 core 2 - 39,83 - 0,06 0,04 45,69 0,29 0,18 13,09 0,29 99,61 1,71 0,27 87,4 KI59 3 b o1 core 1 - 39,96 - 0,05 0,05 45,18 0,28 0,15 13,44 0,22 99,40 1,69 0,28 87,0 KI59 3 b o2 rim 1a - 40,05 - 0,06 0,11 46,51 0,26 0,14 11,75 0,30 98,88 1,74 0,25 88,7 KI59 3 b o3 ~core 2 - 39,98 - 0,04 0,06 46,45 0,28 0,20 12,34 0,31 99,76 1,73 0,26 88,2 KI59 3 b o4 ~rim 2 - 40,19 - 0,05 0,05 46,83 0,28 0,11 11,87 0,32 100,19 1,73 0,25 88,7 KI59 3 b o5 ~rim 1b - 40,14 - 0,06 0,10 47,87 0,26 0,19 10,57 0,33 100,08 1,76 0,22 90,0 KI59 3 c o1 core - 39,77 - 0,07 0,14 47,59 0,24 0,20 10,63 0,38 99,63 1,76 0,22 89,9 KI59 3 c o2 rim 1a - 39,85 - 0,05 0,07 47,84 0,26 0,18 10,56 0,35 99,85 1,76 0,22 90,0 KI59 3 c o3 ~rim 1b - 39,88 - 0,04 0,05 44,91 0,27 0,20 14,11 0,29 99,56 1,69 0,30 86,3 KI59 3 d o1 core 1 - 39,74 - 0,04 0,01 44,89 0,29 0,20 13,92 0,25 99,38 1,69 0,29 86,5 KI59 3 d o2 rim 1a - 40,09 - 0,03 0,08 44,85 0,28 0,23 14,00 0,29 99,63 1,68 0,29 86,4 KI59 3 d o4 core 2 - 40,64 - 0,05 0,06 46,93 0,27 0,16 11,89 0,29 100,01 1,73 0,25 88,7 KI59 3 f o1 core - 39,70 - 0,04 0,03 46,21 0,26 0,17 12,17 0,35 99,02 1,73 0,26 88,3
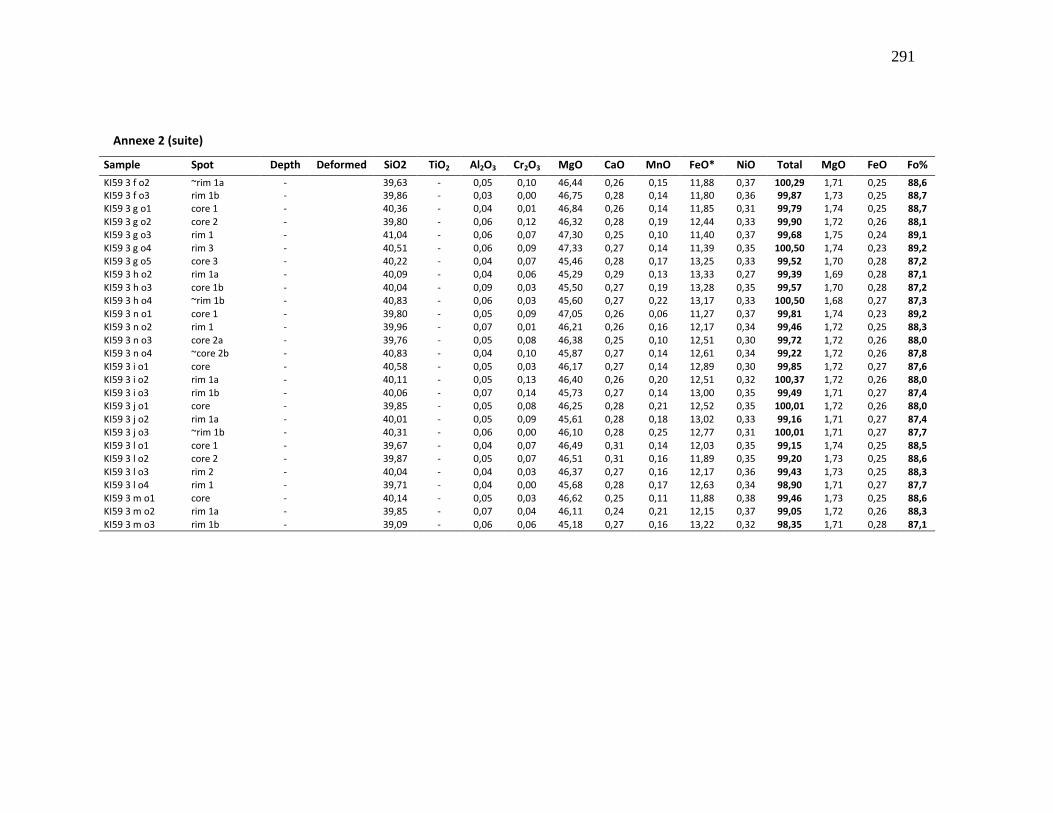
291
Annexe 2 (suite)
Sample Spot Depth Deformed SiO2 TiO2 Al2O3 Cr2O3 MgO CaO MnO FeO* NiO Total MgO FeO Fo%
KI59 3 f o2 ~rim 1a - 39,63 - 0,05 0,10 46,44 0,26 0,15 11,88 0,37 100,29 1,71 0,25 88,6 KI59 3 f o3 rim 1b - 39,86 - 0,03 0,00 46,75 0,28 0,14 11,80 0,36 99,87 1,73 0,25 88,7 KI59 3 g o1 core 1 - 40,36 - 0,04 0,01 46,84 0,26 0,14 11,85 0,31 99,79 1,74 0,25 88,7 KI59 3 g o2 core 2 - 39,80 - 0,06 0,12 46,32 0,28 0,19 12,44 0,33 99,90 1,72 0,26 88,1 KI59 3 g o3 rim 1 - 41,04 - 0,06 0,07 47,30 0,25 0,10 11,40 0,37 99,68 1,75 0,24 89,1 KI59 3 g o4 rim 3 - 40,51 - 0,06 0,09 47,33 0,27 0,14 11,39 0,35 100,50 1,74 0,23 89,2 KI59 3 g o5 core 3 - 40,22 - 0,04 0,07 45,46 0,28 0,17 13,25 0,33 99,52 1,70 0,28 87,2 KI59 3 h o2 rim 1a - 40,09 - 0,04 0,06 45,29 0,29 0,13 13,33 0,27 99,39 1,69 0,28 87,1 KI59 3 h o3 core 1b - 40,04 - 0,09 0,03 45,50 0,27 0,19 13,28 0,35 99,57 1,70 0,28 87,2 KI59 3 h o4 ~rim 1b - 40,83 - 0,06 0,03 45,60 0,27 0,22 13,17 0,33 100,50 1,68 0,27 87,3 KI59 3 n o1 core 1 - 39,80 - 0,05 0,09 47,05 0,26 0,06 11,27 0,37 99,81 1,74 0,23 89,2 KI59 3 n o2 rim 1 - 39,96 - 0,07 0,01 46,21 0,26 0,16 12,17 0,34 99,46 1,72 0,25 88,3 KI59 3 n o3 core 2a - 39,76 - 0,05 0,08 46,38 0,25 0,10 12,51 0,30 99,72 1,72 0,26 88,0 KI59 3 n o4 ~core 2b - 40,83 - 0,04 0,10 45,87 0,27 0,14 12,61 0,34 99,22 1,72 0,26 87,8 KI59 3 i o1 core - 40,58 - 0,05 0,03 46,17 0,27 0,14 12,89 0,30 99,85 1,72 0,27 87,6 KI59 3 i o2 rim 1a - 40,11 - 0,05 0,13 46,40 0,26 0,20 12,51 0,32 100,37 1,72 0,26 88,0 KI59 3 i o3 rim 1b - 40,06 - 0,07 0,14 45,73 0,27 0,14 13,00 0,35 99,49 1,71 0,27 87,4 KI59 3 j o1 core - 39,85 - 0,05 0,08 46,25 0,28 0,21 12,52 0,35 100,01 1,72 0,26 88,0 KI59 3 j o2 rim 1a - 40,01 - 0,05 0,09 45,61 0,28 0,18 13,02 0,33 99,16 1,71 0,27 87,4 KI59 3 j o3 ~rim 1b - 40,31 - 0,06 0,00 46,10 0,28 0,25 12,77 0,31 100,01 1,71 0,27 87,7 KI59 3 l o1 core 1 - 39,67 - 0,04 0,07 46,49 0,31 0,14 12,03 0,35 99,15 1,74 0,25 88,5 KI59 3 l o2 core 2 - 39,87 - 0,05 0,07 46,51 0,31 0,16 11,89 0,35 99,20 1,73 0,25 88,6 KI59 3 l o3 rim 2 - 40,04 - 0,04 0,03 46,37 0,27 0,16 12,17 0,36 99,43 1,73 0,25 88,3 KI59 3 l o4 rim 1 - 39,71 - 0,04 0,00 45,68 0,28 0,17 12,63 0,34 98,90 1,71 0,27 87,7 KI59 3 m o1 core - 40,14 - 0,05 0,03 46,62 0,25 0,11 11,88 0,38 99,46 1,73 0,25 88,6 KI59 3 m o2 rim 1a - 39,85 - 0,07 0,04 46,11 0,24 0,21 12,15 0,37 99,05 1,72 0,26 88,3 KI59 3 m o3 rim 1b - 39,09 - 0,06 0,06 45,18 0,27 0,16 13,22 0,32 98,35 1,71 0,28 87,1

292
Annexe 2 (suite)
Sample Spot Depth Deformed SiO2 TiO2 Al2O3 Cr2O3 MgO CaO MnO FeO* NiO Total MgO FeO Fo%
Margin of lake KI67-1-5-b1 core 1,5 X 39,22 0,01 0,10 0,14 47,65 0,26 0,22 10,98 0,46 99,07 1,78 0,23 89,6 KI67-1-5-b2 rim 1,5 X 38,43 0,01 0,09 0,08 43,27 0,25 0,25 16,62 0,39 99,45 1,65 0,36 83,7 KI67-1-5-d1 core 1,5 X 39,06 0,00 0,03 0,08 45,90 0,24 0,14 13,34 0,38 99,18 1,73 0,28 87,2 KI67-1-5-d2 rim 1,5 X 39,11 0,03 0,27 0,03 44,13 0,28 0,22 15,94 0,38 100,42 1,66 0,34 84,6 KI67-1-5-f1-1 core 1 1,5 X 39,43 0,01 0,00 0,07 47,17 0,26 0,14 12,08 0,37 99,54 1,76 0,25 88,5 KI67-1-5-f1-2 rim 1 1,5 X 39,53 0,00 0,03 0,04 47,17 0,25 0,21 11,85 0,35 99,46 1,76 0,25 88,8 KI67-1-5-a1 core 1,5 38,64 0,03 0,29 0,09 43,51 0,34 0,19 16,23 0,26 99,59 1,65 0,35 84,1 KI67-1-5-a2 rim 1,5 37,87 0,02 0,39 0,04 39,33 0,29 0,30 21,29 0,17 99,73 1,53 0,46 78,5 KI67-1-5-c1 core 1,5 39,52 0,00 0,00 0,08 45,93 0,33 0,11 13,12 0,41 99,52 1,72 0,28 87,4 KI67-1-5-c2 rim 1,5 37,67 0,00 0,09 0,00 38,10 0,29 0,27 22,91 0,24 99,59 1,49 0,50 76,7 KI67-1-5-e1 core 1,5 39,30 0,01 0,43 0,02 45,83 0,27 0,27 13,50 0,33 99,99 1,71 0,28 87,0 KI67-1-5-e2 rim 1,5 38,36 0,02 0,05 0,05 42,22 0,28 0,21 18,53 0,27 100,01 1,61 0,40 81,9 KI67-1-5-f2-1 core 2 1,5 39,84 0,00 0,08 0,09 47,38 0,26 0,19 11,86 0,41 100,14 1,75 0,25 88,8 KI67-1-5-f2-2 rim 2 1,5 38,92 0,02 0,03 0,04 45,23 0,26 0,23 14,97 0,35 100,06 1,70 0,32 85,7 KI67-1-5-g1-1 core 1 1,5 39,52 0,00 0,52 0,04 47,20 0,26 0,08 11,67 0,35 99,69 1,75 0,24 88,9 KI67-1-5-g1-2 rim 1 1,5 39,52 0,00 0,20 0,01 46,69 0,27 0,12 12,63 0,39 99,84 1,74 0,26 88,0 KI67-1-5-g2-1 core 2 1,5 39,93 0,00 0,26 0,11 47,19 0,27 0,13 11,92 0,38 100,20 1,74 0,25 88,7 KI67-1-5-g2-2 rim 2 1,5 39,85 0,00 0,00 0,07 46,83 0,26 0,11 12,35 0,41 99,90 1,74 0,26 88,3 KI67-1-5-h1 core 1,5 39,26 0,01 0,00 0,07 46,58 0,27 0,16 12,41 0,38 99,15 1,75 0,26 88,1 KI67-1-5-h2 rim 1,5 38,09 0,01 0,18 0,02 40,30 0,29 0,30 20,75 0,26 100,24 1,55 0,45 79,4 KI67-1-5-i1 core 1,5 39,36 0,03 0,40 0,09 44,70 0,28 0,21 14,77 0,30 100,16 1,67 0,31 85,7 KI67-1-5-i2 rim 1,5 38,54 0,00 0,30 0,07 41,27 0,27 0,16 18,87 0,34 99,87 1,58 0,41 81,3 KI67-1-5-j1 core 1,5 39,88 0,01 0,13 0,09 46,64 0,29 0,14 12,34 0,34 99,87 1,73 0,26 88,2 KI67-1-5-j2 rim 1,5 37,80 0,01 0,23 0,00 39,66 0,27 0,32 21,38 0,25 99,92 1,54 0,47 78,6 KI67-1-5-k1 core 1,5 39,47 0,00 0,06 0,06 46,63 0,27 0,22 12,13 0,40 99,25 1,74 0,25 88,4 KI67-1-5-k2 rim 1,5 37,61 0,01 0,08 0,03 38,48 0,27 0,40 22,57 0,30 99,74 1,51 0,50 77,2 KI67-1-20-a1 core 6,1 X 39,17 0,00 0,09 0,05 47,02 0,28 0,19 12,40 0,33 99,53 1,76 0,26 88,2 KI67-1-20-a2 rim 6,1 X 37,29 0,01 0,00 0,05 37,65 0,24 0,31 24,41 0,26 100,24 1,48 0,54 75,4 KI67-1-20-c1 core 6,1 X 40,01 0,02 0,05 0,18 47,21 0,27 0,16 12,23 0,36 100,49 1,74 0,25 88,4 KI67-1-20-c2 rim 6,1 X 38,15 0,00 0,18 0,03 39,62 0,22 0,31 21,42 0,32 100,27 1,53 0,46 78,6 KI67-1-20-e1 core 6,1 X 39,24 0,03 0,09 0,06 46,42 0,28 0,19 12,83 0,30 99,47 1,74 0,27 87,8 KI67-1-20-e2 rim 6,1 X 37,39 0,00 0,06 0,00 37,68 0,22 0,22 24,27 0,20 100,09 1,48 0,53 75,5 KI67-1-20-i1 core 6,1 X 39,71 0,00 0,04 0,04 47,38 0,23 0,17 12,20 0,41 100,18 1,75 0,25 88,5 KI67-1-20-i2 rim 6,1 X 37,73 0,02 0,09 0,02 39,81 0,22 0,34 21,15 0,31 99,73 1,55 0,46 78,8 KI67-1-20-j2-1 core 6,1 X 38,85 0,01 0,04 0,00 43,49 0,25 0,19 16,63 0,37 99,85 1,65 0,35 83,8 KI67-1-20-j2-2 rim 6,1 X 37,30 0,00 0,07 0,07 38,12 0,23 0,37 23,24 0,31 99,72 1,50 0,51 76,5 KI67-1-20-m1 core 6,1 X 39,60 0,01 0,13 0,02 45,66 0,29 0,23 13,73 0,39 100,09 1,70 0,29 86,8 KI67-1-20-m2 rim 6,1 X 37,73 0,01 0,56 0,10 38,89 0,24 0,36 21,85 0,24 99,98 1,51 0,48 77,9 KI67-1-20-n1 core 6,1 X 39,36 0,00 0,00 0,04 46,48 0,26 0,23 12,64 0,38 99,40 1,74 0,27 87,9
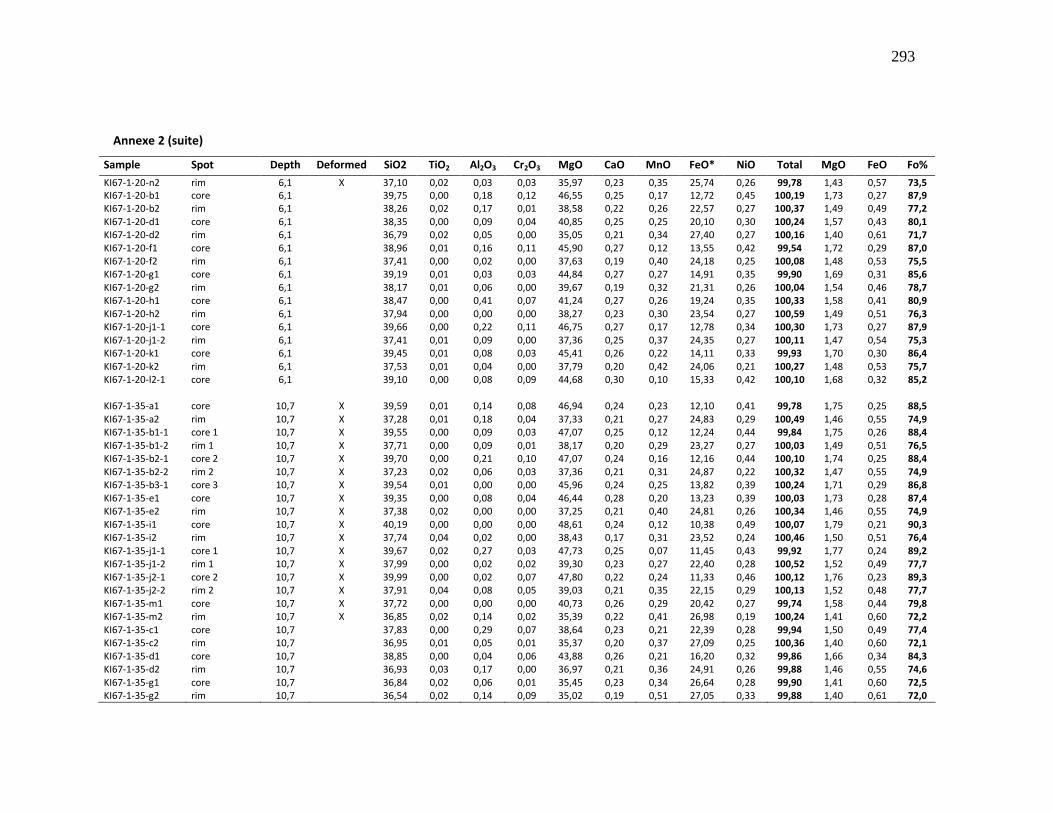
293
Annexe 2 (suite)
Sample Spot Depth Deformed SiO2 TiO2 Al2O3 Cr2O3 MgO CaO MnO FeO* NiO Total MgO FeO Fo%
KI67-1-20-n2 rim 6,1 X 37,10 0,02 0,03 0,03 35,97 0,23 0,35 25,74 0,26 99,78 1,43 0,57 73,5 KI67-1-20-b1 core 6,1 39,75 0,00 0,18 0,12 46,55 0,25 0,17 12,72 0,45 100,19 1,73 0,27 87,9 KI67-1-20-b2 rim 6,1 38,26 0,02 0,17 0,01 38,58 0,22 0,26 22,57 0,27 100,37 1,49 0,49 77,2 KI67-1-20-d1 core 6,1 38,35 0,00 0,09 0,04 40,85 0,25 0,25 20,10 0,30 100,24 1,57 0,43 80,1 KI67-1-20-d2 rim 6,1 36,79 0,02 0,05 0,00 35,05 0,21 0,34 27,40 0,27 100,16 1,40 0,61 71,7 KI67-1-20-f1 core 6,1 38,96 0,01 0,16 0,11 45,90 0,27 0,12 13,55 0,42 99,54 1,72 0,29 87,0 KI67-1-20-f2 rim 6,1 37,41 0,00 0,02 0,00 37,63 0,19 0,40 24,18 0,25 100,08 1,48 0,53 75,5 KI67-1-20-g1 core 6,1 39,19 0,01 0,03 0,03 44,84 0,27 0,27 14,91 0,35 99,90 1,69 0,31 85,6 KI67-1-20-g2 rim 6,1 38,17 0,01 0,06 0,00 39,67 0,19 0,32 21,31 0,26 100,04 1,54 0,46 78,7 KI67-1-20-h1 core 6,1 38,47 0,00 0,41 0,07 41,24 0,27 0,26 19,24 0,35 100,33 1,58 0,41 80,9 KI67-1-20-h2 rim 6,1 37,94 0,00 0,00 0,00 38,27 0,23 0,30 23,54 0,27 100,59 1,49 0,51 76,3 KI67-1-20-j1-1 core 6,1 39,66 0,00 0,22 0,11 46,75 0,27 0,17 12,78 0,34 100,30 1,73 0,27 87,9 KI67-1-20-j1-2 rim 6,1 37,41 0,01 0,09 0,00 37,36 0,25 0,37 24,35 0,27 100,11 1,47 0,54 75,3 KI67-1-20-k1 core 6,1 39,45 0,01 0,08 0,03 45,41 0,26 0,22 14,11 0,33 99,93 1,70 0,30 86,4 KI67-1-20-k2 rim 6,1 37,53 0,01 0,04 0,00 37,79 0,20 0,42 24,06 0,21 100,27 1,48 0,53 75,7 KI67-1-20-l2-1 core 6,1 39,10 0,00 0,08 0,09 44,68 0,30 0,10 15,33 0,42 100,10 1,68 0,32 85,2 KI67-1-35-a1 core 10,7 X 39,59 0,01 0,14 0,08 46,94 0,24 0,23 12,10 0,41 99,78 1,75 0,25 88,5 KI67-1-35-a2 rim 10,7 X 37,28 0,01 0,18 0,04 37,33 0,21 0,27 24,83 0,29 100,49 1,46 0,55 74,9 KI67-1-35-b1-1 core 1 10,7 X 39,55 0,00 0,09 0,03 47,07 0,25 0,12 12,24 0,44 99,84 1,75 0,26 88,4 KI67-1-35-b1-2 rim 1 10,7 X 37,71 0,00 0,09 0,01 38,17 0,20 0,29 23,27 0,27 100,03 1,49 0,51 76,5 KI67-1-35-b2-1 core 2 10,7 X 39,70 0,00 0,21 0,10 47,07 0,24 0,16 12,16 0,44 100,10 1,74 0,25 88,4 KI67-1-35-b2-2 rim 2 10,7 X 37,23 0,02 0,06 0,03 37,36 0,21 0,31 24,87 0,22 100,32 1,47 0,55 74,9 KI67-1-35-b3-1 core 3 10,7 X 39,54 0,01 0,00 0,00 45,96 0,24 0,25 13,82 0,39 100,24 1,71 0,29 86,8 KI67-1-35-e1 core 10,7 X 39,35 0,00 0,08 0,04 46,44 0,28 0,20 13,23 0,39 100,03 1,73 0,28 87,4 KI67-1-35-e2 rim 10,7 X 37,38 0,02 0,00 0,00 37,25 0,21 0,40 24,81 0,26 100,34 1,46 0,55 74,9 KI67-1-35-i1 core 10,7 X 40,19 0,00 0,00 0,00 48,61 0,24 0,12 10,38 0,49 100,07 1,79 0,21 90,3 KI67-1-35-i2 rim 10,7 X 37,74 0,04 0,02 0,00 38,43 0,17 0,31 23,52 0,24 100,46 1,50 0,51 76,4 KI67-1-35-j1-1 core 1 10,7 X 39,67 0,02 0,27 0,03 47,73 0,25 0,07 11,45 0,43 99,92 1,77 0,24 89,2 KI67-1-35-j1-2 rim 1 10,7 X 37,99 0,00 0,02 0,02 39,30 0,23 0,27 22,40 0,28 100,52 1,52 0,49 77,7 KI67-1-35-j2-1 core 2 10,7 X 39,99 0,00 0,02 0,07 47,80 0,22 0,24 11,33 0,46 100,12 1,76 0,23 89,3 KI67-1-35-j2-2 rim 2 10,7 X 37,91 0,04 0,08 0,05 39,03 0,21 0,35 22,15 0,29 100,13 1,52 0,48 77,7 KI67-1-35-m1 core 10,7 X 37,72 0,00 0,00 0,00 40,73 0,26 0,29 20,42 0,27 99,74 1,58 0,44 79,8 KI67-1-35-m2 rim 10,7 X 36,85 0,02 0,14 0,02 35,39 0,22 0,41 26,98 0,19 100,24 1,41 0,60 72,2 KI67-1-35-c1 core 10,7 37,83 0,00 0,29 0,07 38,64 0,23 0,21 22,39 0,28 99,94 1,50 0,49 77,4 KI67-1-35-c2 rim 10,7 36,95 0,01 0,05 0,01 35,37 0,20 0,37 27,09 0,25 100,36 1,40 0,60 72,1 KI67-1-35-d1 core 10,7 38,85 0,00 0,04 0,06 43,88 0,26 0,21 16,20 0,32 99,86 1,66 0,34 84,3 KI67-1-35-d2 rim 10,7 36,93 0,03 0,17 0,00 36,97 0,21 0,36 24,91 0,26 99,88 1,46 0,55 74,6 KI67-1-35-g1 core 10,7 36,84 0,02 0,06 0,01 35,45 0,23 0,34 26,64 0,28 99,90 1,41 0,60 72,5 KI67-1-35-g2 rim 10,7 36,54 0,02 0,14 0,09 35,02 0,19 0,51 27,05 0,33 99,88 1,40 0,61 72,0
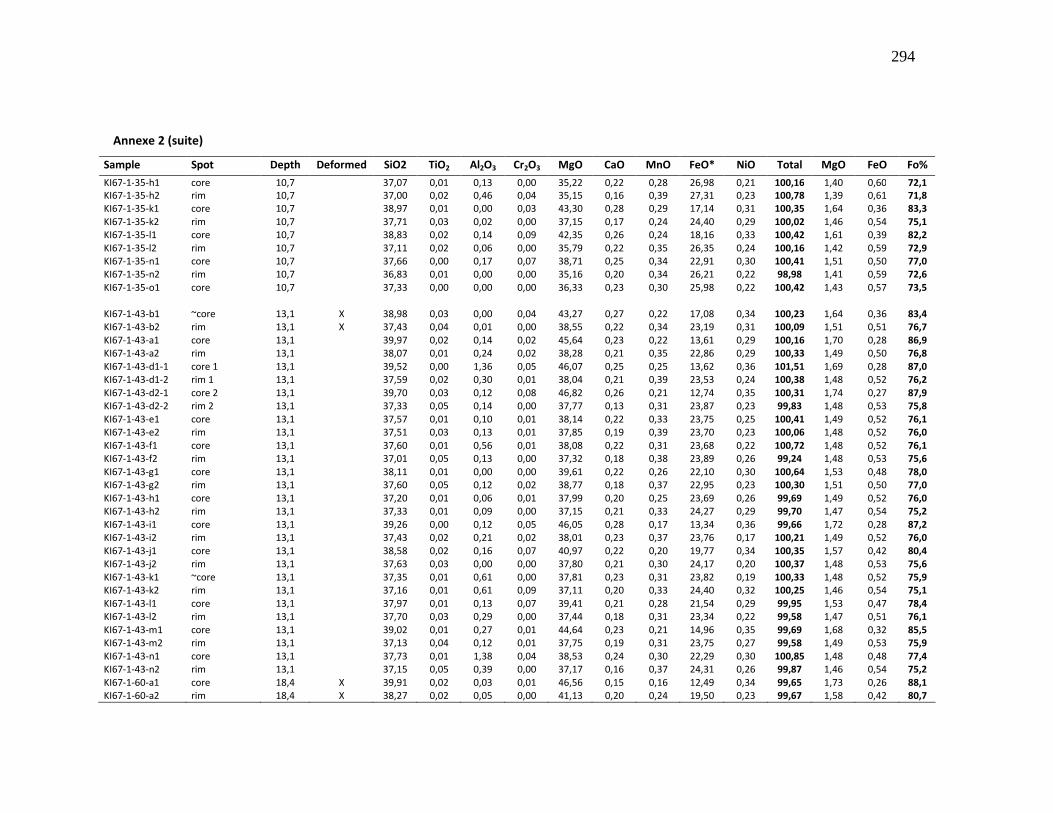
294
Annexe 2 (suite)
Sample Spot Depth Deformed SiO2 TiO2 Al2O3 Cr2O3 MgO CaO MnO FeO* NiO Total MgO FeO Fo%
KI67-1-35-h1 core 10,7 37,07 0,01 0,13 0,00 35,22 0,22 0,28 26,98 0,21 100,16 1,40 0,60 72,1 KI67-1-35-h2 rim 10,7 37,00 0,02 0,46 0,04 35,15 0,16 0,39 27,31 0,23 100,78 1,39 0,61 71,8 KI67-1-35-k1 core 10,7 38,97 0,01 0,00 0,03 43,30 0,28 0,29 17,14 0,31 100,35 1,64 0,36 83,3 KI67-1-35-k2 rim 10,7 37,71 0,03 0,02 0,00 37,15 0,17 0,24 24,40 0,29 100,02 1,46 0,54 75,1 KI67-1-35-l1 core 10,7 38,83 0,02 0,14 0,09 42,35 0,26 0,24 18,16 0,33 100,42 1,61 0,39 82,2 KI67-1-35-l2 rim 10,7 37,11 0,02 0,06 0,00 35,79 0,22 0,35 26,35 0,24 100,16 1,42 0,59 72,9 KI67-1-35-n1 core 10,7 37,66 0,00 0,17 0,07 38,71 0,25 0,34 22,91 0,30 100,41 1,51 0,50 77,0 KI67-1-35-n2 rim 10,7 36,83 0,01 0,00 0,00 35,16 0,20 0,34 26,21 0,22 98,98 1,41 0,59 72,6 KI67-1-35-o1 core 10,7 37,33 0,00 0,00 0,00 36,33 0,23 0,30 25,98 0,22 100,42 1,43 0,57 73,5 KI67-1-43-b1 ~core 13,1 X 38,98 0,03 0,00 0,04 43,27 0,27 0,22 17,08 0,34 100,23 1,64 0,36 83,4 KI67-1-43-b2 rim 13,1 X 37,43 0,04 0,01 0,00 38,55 0,22 0,34 23,19 0,31 100,09 1,51 0,51 76,7 KI67-1-43-a1 core 13,1 39,97 0,02 0,14 0,02 45,64 0,23 0,22 13,61 0,29 100,16 1,70 0,28 86,9 KI67-1-43-a2 rim 13,1 38,07 0,01 0,24 0,02 38,28 0,21 0,35 22,86 0,29 100,33 1,49 0,50 76,8 KI67-1-43-d1-1 core 1 13,1 39,52 0,00 1,36 0,05 46,07 0,25 0,25 13,62 0,36 101,51 1,69 0,28 87,0 KI67-1-43-d1-2 rim 1 13,1 37,59 0,02 0,30 0,01 38,04 0,21 0,39 23,53 0,24 100,38 1,48 0,52 76,2 KI67-1-43-d2-1 core 2 13,1 39,70 0,03 0,12 0,08 46,82 0,26 0,21 12,74 0,35 100,31 1,74 0,27 87,9 KI67-1-43-d2-2 rim 2 13,1 37,33 0,05 0,14 0,00 37,77 0,13 0,31 23,87 0,23 99,83 1,48 0,53 75,8 KI67-1-43-e1 core 13,1 37,57 0,01 0,10 0,01 38,14 0,22 0,33 23,75 0,25 100,41 1,49 0,52 76,1 KI67-1-43-e2 rim 13,1 37,51 0,03 0,13 0,01 37,85 0,19 0,39 23,70 0,23 100,06 1,48 0,52 76,0 KI67-1-43-f1 core 13,1 37,60 0,01 0,56 0,01 38,08 0,22 0,31 23,68 0,22 100,72 1,48 0,52 76,1 KI67-1-43-f2 rim 13,1 37,01 0,05 0,13 0,00 37,32 0,18 0,38 23,89 0,26 99,24 1,48 0,53 75,6 KI67-1-43-g1 core 13,1 38,11 0,01 0,00 0,00 39,61 0,22 0,26 22,10 0,30 100,64 1,53 0,48 78,0 KI67-1-43-g2 rim 13,1 37,60 0,05 0,12 0,02 38,77 0,18 0,37 22,95 0,23 100,30 1,51 0,50 77,0 KI67-1-43-h1 core 13,1 37,20 0,01 0,06 0,01 37,99 0,20 0,25 23,69 0,26 99,69 1,49 0,52 76,0 KI67-1-43-h2 rim 13,1 37,33 0,01 0,09 0,00 37,15 0,21 0,33 24,27 0,29 99,70 1,47 0,54 75,2 KI67-1-43-i1 core 13,1 39,26 0,00 0,12 0,05 46,05 0,28 0,17 13,34 0,36 99,66 1,72 0,28 87,2 KI67-1-43-i2 rim 13,1 37,43 0,02 0,21 0,02 38,01 0,23 0,37 23,76 0,17 100,21 1,49 0,52 76,0 KI67-1-43-j1 core 13,1 38,58 0,02 0,16 0,07 40,97 0,22 0,20 19,77 0,34 100,35 1,57 0,42 80,4 KI67-1-43-j2 rim 13,1 37,63 0,03 0,00 0,00 37,80 0,21 0,30 24,17 0,20 100,37 1,48 0,53 75,6 KI67-1-43-k1 ~core 13,1 37,35 0,01 0,61 0,00 37,81 0,23 0,31 23,82 0,19 100,33 1,48 0,52 75,9 KI67-1-43-k2 rim 13,1 37,16 0,01 0,61 0,09 37,11 0,20 0,33 24,40 0,32 100,25 1,46 0,54 75,1 KI67-1-43-l1 core 13,1 37,97 0,01 0,13 0,07 39,41 0,21 0,28 21,54 0,29 99,95 1,53 0,47 78,4 KI67-1-43-l2 rim 13,1 37,70 0,03 0,29 0,00 37,44 0,18 0,31 23,34 0,22 99,58 1,47 0,51 76,1 KI67-1-43-m1 core 13,1 39,02 0,01 0,27 0,01 44,64 0,23 0,21 14,96 0,35 99,69 1,68 0,32 85,5 KI67-1-43-m2 rim 13,1 37,13 0,04 0,12 0,01 37,75 0,19 0,31 23,75 0,27 99,58 1,49 0,53 75,9 KI67-1-43-n1 core 13,1 37,73 0,01 1,38 0,04 38,53 0,24 0,30 22,29 0,30 100,85 1,48 0,48 77,4 KI67-1-43-n2 rim 13,1 37,15 0,05 0,39 0,00 37,17 0,16 0,37 24,31 0,26 99,87 1,46 0,54 75,2 KI67-1-60-a1 core 18,4 X 39,91 0,02 0,03 0,01 46,56 0,15 0,16 12,49 0,34 99,65 1,73 0,26 88,1 KI67-1-60-a2 rim 18,4 X 38,27 0,02 0,05 0,00 41,13 0,20 0,24 19,50 0,23 99,67 1,58 0,42 80,7
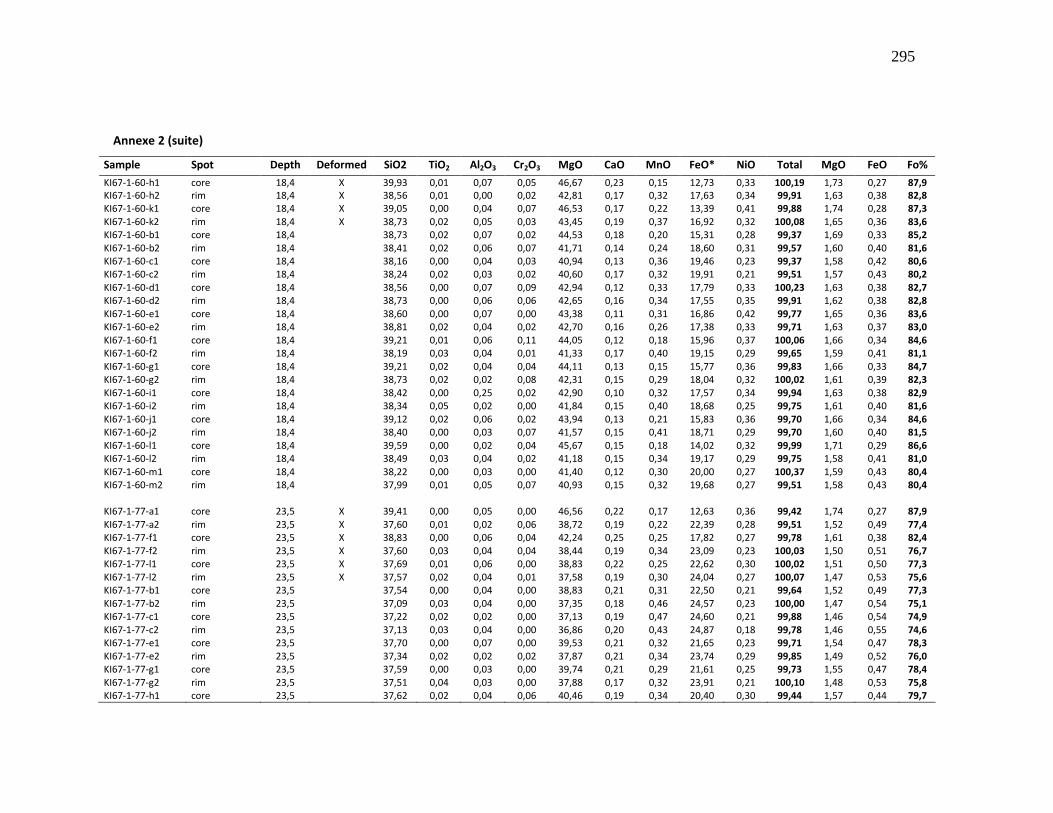
295
Annexe 2 (suite)
Sample Spot Depth Deformed SiO2 TiO2 Al2O3 Cr2O3 MgO CaO MnO FeO* NiO Total MgO FeO Fo%
KI67-1-60-h1 core 18,4 X 39,93 0,01 0,07 0,05 46,67 0,23 0,15 12,73 0,33 100,19 1,73 0,27 87,9 KI67-1-60-h2 rim 18,4 X 38,56 0,01 0,00 0,02 42,81 0,17 0,32 17,63 0,34 99,91 1,63 0,38 82,8 KI67-1-60-k1 core 18,4 X 39,05 0,00 0,04 0,07 46,53 0,17 0,22 13,39 0,41 99,88 1,74 0,28 87,3 KI67-1-60-k2 rim 18,4 X 38,73 0,02 0,05 0,03 43,45 0,19 0,37 16,92 0,32 100,08 1,65 0,36 83,6 KI67-1-60-b1 core 18,4 38,73 0,02 0,07 0,02 44,53 0,18 0,20 15,31 0,28 99,37 1,69 0,33 85,2 KI67-1-60-b2 rim 18,4 38,41 0,02 0,06 0,07 41,71 0,14 0,24 18,60 0,31 99,57 1,60 0,40 81,6 KI67-1-60-c1 core 18,4 38,16 0,00 0,04 0,03 40,94 0,13 0,36 19,46 0,23 99,37 1,58 0,42 80,6 KI67-1-60-c2 rim 18,4 38,24 0,02 0,03 0,02 40,60 0,17 0,32 19,91 0,21 99,51 1,57 0,43 80,2 KI67-1-60-d1 core 18,4 38,56 0,00 0,07 0,09 42,94 0,12 0,33 17,79 0,33 100,23 1,63 0,38 82,7 KI67-1-60-d2 rim 18,4 38,73 0,00 0,06 0,06 42,65 0,16 0,34 17,55 0,35 99,91 1,62 0,38 82,8 KI67-1-60-e1 core 18,4 38,60 0,00 0,07 0,00 43,38 0,11 0,31 16,86 0,42 99,77 1,65 0,36 83,6 KI67-1-60-e2 rim 18,4 38,81 0,02 0,04 0,02 42,70 0,16 0,26 17,38 0,33 99,71 1,63 0,37 83,0 KI67-1-60-f1 core 18,4 39,21 0,01 0,06 0,11 44,05 0,12 0,18 15,96 0,37 100,06 1,66 0,34 84,6 KI67-1-60-f2 rim 18,4 38,19 0,03 0,04 0,01 41,33 0,17 0,40 19,15 0,29 99,65 1,59 0,41 81,1 KI67-1-60-g1 core 18,4 39,21 0,02 0,04 0,04 44,11 0,13 0,15 15,77 0,36 99,83 1,66 0,33 84,7 KI67-1-60-g2 rim 18,4 38,73 0,02 0,02 0,08 42,31 0,15 0,29 18,04 0,32 100,02 1,61 0,39 82,3 KI67-1-60-i1 core 18,4 38,42 0,00 0,25 0,02 42,90 0,10 0,32 17,57 0,34 99,94 1,63 0,38 82,9 KI67-1-60-i2 rim 18,4 38,34 0,05 0,02 0,00 41,84 0,15 0,40 18,68 0,25 99,75 1,61 0,40 81,6 KI67-1-60-j1 core 18,4 39,12 0,02 0,06 0,02 43,94 0,13 0,21 15,83 0,36 99,70 1,66 0,34 84,6 KI67-1-60-j2 rim 18,4 38,40 0,00 0,03 0,07 41,57 0,15 0,41 18,71 0,29 99,70 1,60 0,40 81,5 KI67-1-60-l1 core 18,4 39,59 0,00 0,02 0,04 45,67 0,15 0,18 14,02 0,32 99,99 1,71 0,29 86,6 KI67-1-60-l2 rim 18,4 38,49 0,03 0,04 0,02 41,18 0,15 0,34 19,17 0,29 99,75 1,58 0,41 81,0 KI67-1-60-m1 core 18,4 38,22 0,00 0,03 0,00 41,40 0,12 0,30 20,00 0,27 100,37 1,59 0,43 80,4 KI67-1-60-m2 rim 18,4 37,99 0,01 0,05 0,07 40,93 0,15 0,32 19,68 0,27 99,51 1,58 0,43 80,4 KI67-1-77-a1 core 23,5 X 39,41 0,00 0,05 0,00 46,56 0,22 0,17 12,63 0,36 99,42 1,74 0,27 87,9 KI67-1-77-a2 rim 23,5 X 37,60 0,01 0,02 0,06 38,72 0,19 0,22 22,39 0,28 99,51 1,52 0,49 77,4 KI67-1-77-f1 core 23,5 X 38,83 0,00 0,06 0,04 42,24 0,25 0,25 17,82 0,27 99,78 1,61 0,38 82,4 KI67-1-77-f2 rim 23,5 X 37,60 0,03 0,04 0,04 38,44 0,19 0,34 23,09 0,23 100,03 1,50 0,51 76,7 KI67-1-77-l1 core 23,5 X 37,69 0,01 0,06 0,00 38,83 0,22 0,25 22,62 0,30 100,02 1,51 0,50 77,3 KI67-1-77-l2 rim 23,5 X 37,57 0,02 0,04 0,01 37,58 0,19 0,30 24,04 0,27 100,07 1,47 0,53 75,6 KI67-1-77-b1 core 23,5 37,54 0,00 0,04 0,00 38,83 0,21 0,31 22,50 0,21 99,64 1,52 0,49 77,3 KI67-1-77-b2 rim 23,5 37,09 0,03 0,04 0,00 37,35 0,18 0,46 24,57 0,23 100,00 1,47 0,54 75,1 KI67-1-77-c1 core 23,5 37,22 0,02 0,02 0,00 37,13 0,19 0,47 24,60 0,21 99,88 1,46 0,54 74,9 KI67-1-77-c2 rim 23,5 37,13 0,03 0,04 0,00 36,86 0,20 0,43 24,87 0,18 99,78 1,46 0,55 74,6 KI67-1-77-e1 core 23,5 37,70 0,00 0,07 0,00 39,53 0,21 0,32 21,65 0,23 99,71 1,54 0,47 78,3 KI67-1-77-e2 rim 23,5 37,34 0,02 0,02 0,02 37,87 0,21 0,34 23,74 0,29 99,85 1,49 0,52 76,0 KI67-1-77-g1 core 23,5 37,59 0,00 0,03 0,00 39,74 0,21 0,29 21,61 0,25 99,73 1,55 0,47 78,4 KI67-1-77-g2 rim 23,5 37,51 0,04 0,03 0,00 37,88 0,17 0,32 23,91 0,21 100,10 1,48 0,53 75,8 KI67-1-77-h1 core 23,5 37,62 0,02 0,04 0,06 40,46 0,19 0,34 20,40 0,30 99,44 1,57 0,44 79,7

296
Annexe 2 (suite)
Sample Spot Depth Deformed SiO2 TiO2 Al2O3 Cr2O3 MgO CaO MnO FeO* NiO Total MgO FeO Fo%
KI67-1-77-h2 rim 23,5 36,77 0,03 0,07 0,07 37,65 0,19 0,39 24,17 0,22 99,56 1,49 0,54 75,5 KI67-1-77-i1 core 23,5 37,27 0,00 0,05 0,02 37,74 0,22 0,34 23,90 0,23 99,79 1,48 0,53 75,8 KI67-1-77-i2 rim 23,5 37,22 0,03 0,05 0,00 37,14 0,17 0,37 24,60 0,23 99,85 1,47 0,54 75,0 KI67-1-77-j1 core 23,5 37,24 0,00 0,08 0,02 38,09 0,22 0,32 23,75 0,26 99,98 1,49 0,52 76,0 KI67-1-77-j2 rim 23,5 37,38 0,02 0,02 0,00 37,75 0,19 0,22 24,05 0,26 99,89 1,48 0,53 75,7 KI67-1-77-k1 core 23,5 37,47 0,00 0,04 0,02 38,93 0,20 0,33 22,87 0,27 100,12 1,52 0,50 77,1 KI67-1-77-k2 rim 23,5 37,55 0,02 0,03 0,05 38,20 0,18 0,32 23,45 0,24 100,07 1,49 0,51 76,4 KI67-1-77-m1 core 23,5 37,63 0,02 0,06 0,00 39,96 0,22 0,31 21,03 0,25 99,51 1,56 0,46 79,0 KI67-1-77-m2 rim 23,5 37,15 0,03 0,06 0,00 37,95 0,19 0,32 23,93 0,26 99,91 1,49 0,53 75,8 KI67-1-77-n1 core 23,5 37,62 0,00 0,04 0,00 38,91 0,21 0,31 22,69 0,24 100,03 1,52 0,50 77,3 KI67-1-77-n2 rim 23,5 37,04 0,03 0,06 0,03 37,89 0,20 0,39 24,26 0,25 100,16 1,49 0,54 75,6 KI75-3-5-b1 core 1,5 X 39,75 0,02 0,04 0,03 44,23 0,29 0,23 15,38 0,33 100,38 1,66 0,32 85,1 KI75-3-5-b2 rim 1,5 X 36,46 0,07 0,02 0,03 31,18 0,30 0,34 31,15 0,14 99,77 1,27 0,71 66,5 KI75-3-5-a1 core 1,5 39,67 0,00 0,03 0,02 44,70 0,28 0,20 14,77 0,33 100,00 1,68 0,31 85,7 KI75-3-5-a2 rim 1,5 38,44 0,01 0,03 0,01 38,95 0,30 0,34 21,35 0,19 99,69 1,51 0,47 78,3 KI75-3-5-c1 core 1,5 39,77 0,00 0,03 0,06 45,77 0,27 0,21 12,68 0,37 99,19 1,71 0,27 87,7 KI75-3-5-c2 rim 1,5 37,46 0,01 0,02 0,01 37,36 0,30 0,31 23,79 0,21 99,60 1,47 0,53 75,7 KI75-3-5-d1 core 1,5 39,71 0,00 0,03 0,10 44,72 0,27 0,22 13,19 0,33 98,61 1,69 0,28 87,0 KI75-3-5-d2 rim 1,5 36,60 0,01 0,02 0,00 32,51 0,27 0,32 28,92 0,24 98,96 1,32 0,66 69,0 KI75-3-5-e1 core 1,5 39,78 0,00 0,02 0,04 44,95 0,28 0,24 13,91 0,33 99,57 1,69 0,29 86,5 KI75-3-5-e2 rim 1,5 35,79 0,09 0,01 0,00 27,15 0,22 0,51 36,15 0,18 100,21 1,13 0,84 59,8 KI75-3-5-f1 core 1,5 39,58 0,02 0,05 0,08 45,71 0,25 0,03 12,79 0,40 98,93 1,72 0,27 87,6 KI75-3-5-f2 rim 1,5 37,36 0,02 0,04 0,03 36,21 0,32 0,35 24,96 0,19 99,57 1,43 0,56 74,2 KI75-3-5-g1 core 1,5 39,78 0,00 0,04 0,06 44,72 0,29 0,15 13,59 0,38 99,09 1,68 0,29 86,7 KI75-3-5-g2 rim 1,5 37,71 0,02 0,03 0,00 37,38 0,30 0,41 22,79 0,22 98,87 1,48 0,50 76,5 KI75-3-5-h1-1c core a 1,5 39,44 0,00 0,04 0,09 43,43 0,30 0,17 15,79 0,37 99,64 1,64 0,34 84,5 KI75-3-5-h1-2c core b 1,5 39,62 0,00 0,04 0,00 43,70 0,32 0,21 15,57 0,29 99,76 1,65 0,33 84,8 KI75-3-5-h1-3b rim 1,5 37,44 0,09 0,03 0,00 33,89 0,30 0,35 27,88 0,24 100,25 1,35 0,62 70,7 KI75-3-5-h2-1c core 1,5 39,19 0,01 0,02 0,07 43,69 0,30 0,21 14,95 0,29 98,80 1,66 0,32 85,3 KI75-3-5-i1 core 1,5 40,02 0,00 0,04 0,00 45,33 0,25 0,18 12,41 0,36 98,61 1,70 0,26 87,9 KI75-3-5-i2 rim 1,5 36,11 0,09 0,01 0,00 29,93 0,29 0,46 32,58 0,18 99,68 1,23 0,75 64,5 KI75-3-5-j1 core 1,5 39,85 0,00 0,02 0,10 46,28 0,25 0,11 11,38 0,46 98,50 1,73 0,24 89,0 KI75-3-5-j2 rim 1,5 36,80 0,03 0,02 0,08 33,15 0,31 0,45 28,35 0,22 99,50 1,34 0,64 69,9 KI75-3-5-k1 core 1,5 39,86 0,00 0,02 0,00 45,56 0,29 0,26 13,62 0,28 99,97 1,70 0,29 86,9 KI75-3-5-k2 rim 1,5 37,30 0,04 0,02 0,00 34,68 0,30 0,35 26,83 0,25 99,81 1,38 0,60 71,9 KI75-3-5-l1-1 core 1,5 39,73 0,00 0,02 0,05 45,60 0,29 0,24 13,50 0,36 99,82 1,70 0,28 87,0 KI75-3-5-l1-2 rim 1,5 36,17 0,04 0,01 0,00 27,63 0,27 0,46 33,95 0,11 98,69 1,15 0,80 61,7 KI75-3-5-l2-1 core 1,5 40,03 0,00 0,04 0,08 45,47 0,28 0,13 12,85 0,37 99,26 1,70 0,27 87,5 KI75-3-5-m1 core 1,5 39,88 0,00 0,02 0,07 45,95 0,29 0,16 12,47 0,38 99,29 1,72 0,26 88,0 KI75-3-5-m2 rim 1,5 38,06 0,02 0,03 0,01 37,97 0,28 0,26 22,17 0,26 99,08 1,49 0,49 77,2

297
Annexe 2 (suite)
Sample Spot Depth Deformed SiO2 TiO2 Al2O3 Cr2O3 MgO CaO MnO FeO* NiO Total MgO FeO Fo%
KI75-3-18-a1 core 5,5 X 39,33 0,01 0,03 0,00 43,83 0,25 0,23 15,13 0,36 99,22 1,66 0,32 85,2 KI75-3-18-a2 rim 5,5 X 37,22 0,00 0,00 0,00 35,35 0,25 0,43 26,37 0,16 99,83 1,41 0,59 72,6 KI75-3-18-b1 core 5,5 X 39,74 0,01 0,03 0,13 45,54 0,24 0,14 12,88 0,37 99,11 1,71 0,27 87,5 KI75-3-18-b2 rim 5,5 X 37,28 0,00 0,04 0,06 35,60 0,25 0,24 25,07 0,22 98,79 1,42 0,56 73,8 KI75-3-18-c1 core 5,5 X 39,80 0,00 0,04 0,04 45,32 0,30 0,23 12,82 0,38 98,96 1,70 0,27 87,5 KI75-3-18-c2 rim 5,5 X 37,44 0,06 0,00 0,00 34,95 0,22 0,30 25,95 0,23 99,21 1,39 0,58 72,7 KI75-3-18-d1 core 5,5 X 39,99 0,01 0,03 0,09 45,88 0,28 0,19 12,65 0,34 99,54 1,71 0,27 87,8 KI75-3-18-d2 rim 5,5 X 37,59 0,02 0,00 0,00 36,08 0,23 0,42 25,49 0,26 100,13 1,42 0,56 73,7 KI75-3-18-g1-1 core 1 5,5 X 40,02 0,00 0,03 0,03 45,58 0,26 0,17 12,75 0,41 99,25 1,70 0,27 87,6 KI75-3-18-g1-2 rim 1 5,5 X 36,41 0,02 0,02 0,02 32,56 0,25 0,28 30,07 0,19 99,92 1,32 0,68 68,2 KI75-3-18-g2-1 core 2 5,5 X 39,85 0,00 0,05 0,10 45,96 0,27 0,12 12,20 0,40 98,94 1,72 0,26 88,2 KI75-3-18-g2-2 rim 2 5,5 X 37,95 0,02 0,03 0,04 37,07 0,25 0,30 23,50 0,26 99,47 1,46 0,52 75,8 KI75-3-18-i1 core 5,5 X 40,03 0,00 0,05 0,13 46,27 0,29 0,17 12,80 0,39 100,14 1,72 0,27 87,8 KI75-3-18-i2 rim 5,5 X 37,97 0,02 0,03 0,02 37,78 0,21 0,36 23,77 0,22 100,42 1,47 0,52 75,9 KI75-3-18-k1 core 5,5 X 39,55 0,01 0,04 0,05 43,85 0,27 0,17 14,66 0,32 98,98 1,66 0,31 85,6 KI75-3-18-k2 rim 5,5 X 37,10 0,00 0,00 0,02 33,98 0,23 0,30 27,97 0,19 99,80 1,36 0,63 70,6 KI75-3-18-e1 core 5,5 39,92 0,00 0,03 0,05 44,55 0,25 0,17 14,07 0,44 99,48 1,67 0,30 86,3 KI75-3-18-e2 rim 5,5 37,85 0,02 0,00 0,00 37,25 0,21 0,29 23,89 0,27 99,80 1,46 0,53 75,5 KI75-3-18-f1 core 5,5 39,68 0,00 0,04 0,10 45,02 0,29 0,20 13,24 0,36 98,98 1,69 0,28 87,1 KI75-3-18-f2 rim 5,5 36,91 0,02 0,01 0,03 33,31 0,22 0,32 28,02 0,22 99,09 1,35 0,64 70,2 KI75-3-18-h1 core 5,5 40,38 0,00 0,04 0,09 47,57 0,24 0,09 10,18 0,47 99,16 1,76 0,21 90,3 KI75-3-18-h2 rim 5,5 37,41 0,00 0,02 0,00 35,00 0,24 0,25 26,85 0,20 100,00 1,39 0,60 72,1 KI75-3-18-j1 core 5,5 39,17 0,00 0,03 0,01 42,66 0,29 0,24 16,96 0,30 99,77 1,62 0,36 83,3 KI75-3-18-j2 rim 5,5 36,71 0,02 0,02 0,00 32,90 0,22 0,37 28,76 0,21 99,24 1,33 0,65 69,4 KI75-3-18-l1 core 5,5 39,28 0,02 0,03 0,05 43,49 0,29 0,19 15,97 0,29 99,64 1,65 0,34 84,4 KI75-3-18-l2 rim 5,5 36,82 0,02 0,00 0,04 31,58 0,19 0,28 31,23 0,20 100,38 1,28 0,71 66,7 KI75-3-18-m1 core 5,5 39,43 0,00 0,05 0,03 43,09 0,24 0,10 16,25 0,29 99,51 1,63 0,35 84,0 KI75-3-18-m2 rim 5,5 37,58 0,01 0,02 0,03 37,42 0,17 0,32 23,83 0,28 99,68 1,47 0,53 75,7 KI75-3-18-n1 core 5,5 38,36 0,02 0,04 0,16 41,42 0,28 0,17 17,91 0,30 98,71 1,60 0,39 82,1 KI75-3-18-n2 rim 5,5 37,26 0,00 0,01 0,00 35,56 0,24 0,41 25,52 0,21 99,22 1,42 0,57 73,4 KI75-3-18-o1 core 5,5 38,52 0,02 0,04 0,01 40,57 0,26 0,27 19,46 0,23 99,43 1,56 0,42 80,5 KI75-3-18-o2 rim 5,5 36,43 0,10 0,02 0,04 31,61 0,17 0,39 30,08 0,16 99,01 1,29 0,69 67,6 KI75-3-35-e1c core 10,7 X 39,61 0,00 0,05 0,05 45,34 0,28 0,16 13,80 0,32 99,60 1,70 0,29 86,7 KI75-3-35-e2c core 10,7 X 39,61 0,02 0,05 0,00 45,39 0,29 0,16 14,06 0,32 99,91 1,70 0,30 86,5 KI75-3-35-e3b rim 10,7 X 37,15 0,03 0,04 0,00 34,68 0,23 0,39 27,14 0,26 99,94 1,38 0,61 71,7 KI75-3-35-f1 core 10,7 X 39,29 0,02 0,04 0,03 43,75 0,27 0,13 15,88 0,39 99,80 1,65 0,34 84,5 KI75-3-35-f2 rim 10,7 X 37,08 0,03 0,03 0,00 33,90 0,20 0,40 28,07 0,22 99,95 1,36 0,63 70,5 KI75-3-35-k1 core 10,7 X 40,18 0,00 0,06 0,08 47,41 0,24 0,20 11,69 0,39 100,26 1,75 0,24 88,9 KI75-3-35-a1 core 10,7 37,55 0,01 0,04 0,01 35,66 0,26 0,40 26,15 0,20 100,29 1,41 0,58 73,0
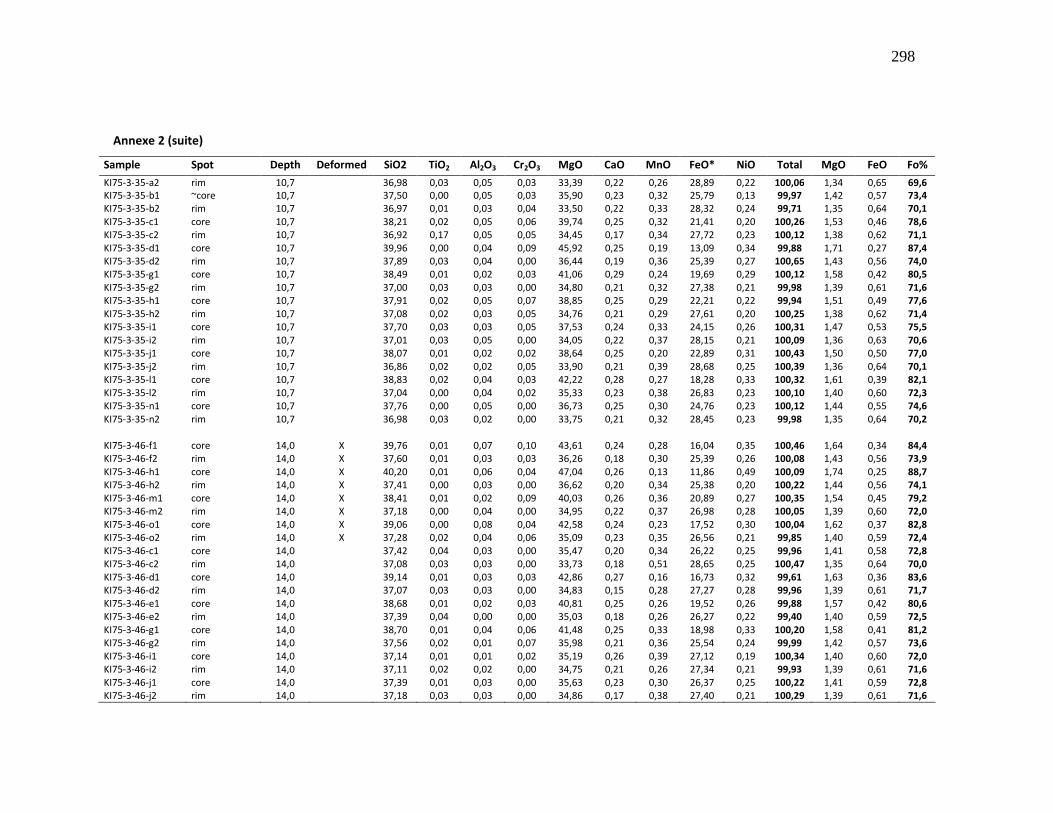
298
Annexe 2 (suite)
Sample Spot Depth Deformed SiO2 TiO2 Al2O3 Cr2O3 MgO CaO MnO FeO* NiO Total MgO FeO Fo%
KI75-3-35-a2 rim 10,7 36,98 0,03 0,05 0,03 33,39 0,22 0,26 28,89 0,22 100,06 1,34 0,65 69,6 KI75-3-35-b1 ~core 10,7 37,50 0,00 0,05 0,03 35,90 0,23 0,32 25,79 0,13 99,97 1,42 0,57 73,4 KI75-3-35-b2 rim 10,7 36,97 0,01 0,03 0,04 33,50 0,22 0,33 28,32 0,24 99,71 1,35 0,64 70,1 KI75-3-35-c1 core 10,7 38,21 0,02 0,05 0,06 39,74 0,25 0,32 21,41 0,20 100,26 1,53 0,46 78,6 KI75-3-35-c2 rim 10,7 36,92 0,17 0,05 0,05 34,45 0,17 0,34 27,72 0,23 100,12 1,38 0,62 71,1 KI75-3-35-d1 core 10,7 39,96 0,00 0,04 0,09 45,92 0,25 0,19 13,09 0,34 99,88 1,71 0,27 87,4 KI75-3-35-d2 rim 10,7 37,89 0,03 0,04 0,00 36,44 0,19 0,36 25,39 0,27 100,65 1,43 0,56 74,0 KI75-3-35-g1 core 10,7 38,49 0,01 0,02 0,03 41,06 0,29 0,24 19,69 0,29 100,12 1,58 0,42 80,5 KI75-3-35-g2 rim 10,7 37,00 0,03 0,03 0,00 34,80 0,21 0,32 27,38 0,21 99,98 1,39 0,61 71,6 KI75-3-35-h1 core 10,7 37,91 0,02 0,05 0,07 38,85 0,25 0,29 22,21 0,22 99,94 1,51 0,49 77,6 KI75-3-35-h2 rim 10,7 37,08 0,02 0,03 0,05 34,76 0,21 0,29 27,61 0,20 100,25 1,38 0,62 71,4 KI75-3-35-i1 core 10,7 37,70 0,03 0,03 0,05 37,53 0,24 0,33 24,15 0,26 100,31 1,47 0,53 75,5 KI75-3-35-i2 rim 10,7 37,01 0,03 0,05 0,00 34,05 0,22 0,37 28,15 0,21 100,09 1,36 0,63 70,6 KI75-3-35-j1 core 10,7 38,07 0,01 0,02 0,02 38,64 0,25 0,20 22,89 0,31 100,43 1,50 0,50 77,0 KI75-3-35-j2 rim 10,7 36,86 0,02 0,02 0,05 33,90 0,21 0,39 28,68 0,25 100,39 1,36 0,64 70,1 KI75-3-35-l1 core 10,7 38,83 0,02 0,04 0,03 42,22 0,28 0,27 18,28 0,33 100,32 1,61 0,39 82,1 KI75-3-35-l2 rim 10,7 37,04 0,00 0,04 0,02 35,33 0,23 0,38 26,83 0,23 100,10 1,40 0,60 72,3 KI75-3-35-n1 core 10,7 37,76 0,00 0,05 0,00 36,73 0,25 0,30 24,76 0,23 100,12 1,44 0,55 74,6 KI75-3-35-n2 rim 10,7 36,98 0,03 0,02 0,00 33,75 0,21 0,32 28,45 0,23 99,98 1,35 0,64 70,2 KI75-3-46-f1 core 14,0 X 39,76 0,01 0,07 0,10 43,61 0,24 0,28 16,04 0,35 100,46 1,64 0,34 84,4 KI75-3-46-f2 rim 14,0 X 37,60 0,01 0,03 0,03 36,26 0,18 0,30 25,39 0,26 100,08 1,43 0,56 73,9 KI75-3-46-h1 core 14,0 X 40,20 0,01 0,06 0,04 47,04 0,26 0,13 11,86 0,49 100,09 1,74 0,25 88,7 KI75-3-46-h2 rim 14,0 X 37,41 0,00 0,03 0,00 36,62 0,20 0,34 25,38 0,20 100,22 1,44 0,56 74,1 KI75-3-46-m1 core 14,0 X 38,41 0,01 0,02 0,09 40,03 0,26 0,36 20,89 0,27 100,35 1,54 0,45 79,2 KI75-3-46-m2 rim 14,0 X 37,18 0,00 0,04 0,00 34,95 0,22 0,37 26,98 0,28 100,05 1,39 0,60 72,0 KI75-3-46-o1 core 14,0 X 39,06 0,00 0,08 0,04 42,58 0,24 0,23 17,52 0,30 100,04 1,62 0,37 82,8 KI75-3-46-o2 rim 14,0 X 37,28 0,02 0,04 0,06 35,09 0,23 0,35 26,56 0,21 99,85 1,40 0,59 72,4 KI75-3-46-c1 core 14,0 37,42 0,04 0,03 0,00 35,47 0,20 0,34 26,22 0,25 99,96 1,41 0,58 72,8 KI75-3-46-c2 rim 14,0 37,08 0,03 0,03 0,00 33,73 0,18 0,51 28,65 0,25 100,47 1,35 0,64 70,0 KI75-3-46-d1 core 14,0 39,14 0,01 0,03 0,03 42,86 0,27 0,16 16,73 0,32 99,61 1,63 0,36 83,6 KI75-3-46-d2 rim 14,0 37,07 0,03 0,03 0,00 34,83 0,15 0,28 27,27 0,28 99,96 1,39 0,61 71,7 KI75-3-46-e1 core 14,0 38,68 0,01 0,02 0,03 40,81 0,25 0,26 19,52 0,26 99,88 1,57 0,42 80,6 KI75-3-46-e2 rim 14,0 37,39 0,04 0,00 0,00 35,03 0,18 0,26 26,27 0,22 99,40 1,40 0,59 72,5 KI75-3-46-g1 core 14,0 38,70 0,01 0,04 0,06 41,48 0,25 0,33 18,98 0,33 100,20 1,58 0,41 81,2 KI75-3-46-g2 rim 14,0 37,56 0,02 0,01 0,07 35,98 0,21 0,36 25,54 0,24 99,99 1,42 0,57 73,6 KI75-3-46-i1 core 14,0 37,14 0,01 0,01 0,02 35,19 0,26 0,39 27,12 0,19 100,34 1,40 0,60 72,0 KI75-3-46-i2 rim 14,0 37,11 0,02 0,02 0,00 34,75 0,21 0,26 27,34 0,21 99,93 1,39 0,61 71,6 KI75-3-46-j1 core 14,0 37,39 0,01 0,03 0,00 35,63 0,23 0,30 26,37 0,25 100,22 1,41 0,59 72,8 KI75-3-46-j2 rim 14,0 37,18 0,03 0,03 0,00 34,86 0,17 0,38 27,40 0,21 100,29 1,39 0,61 71,6
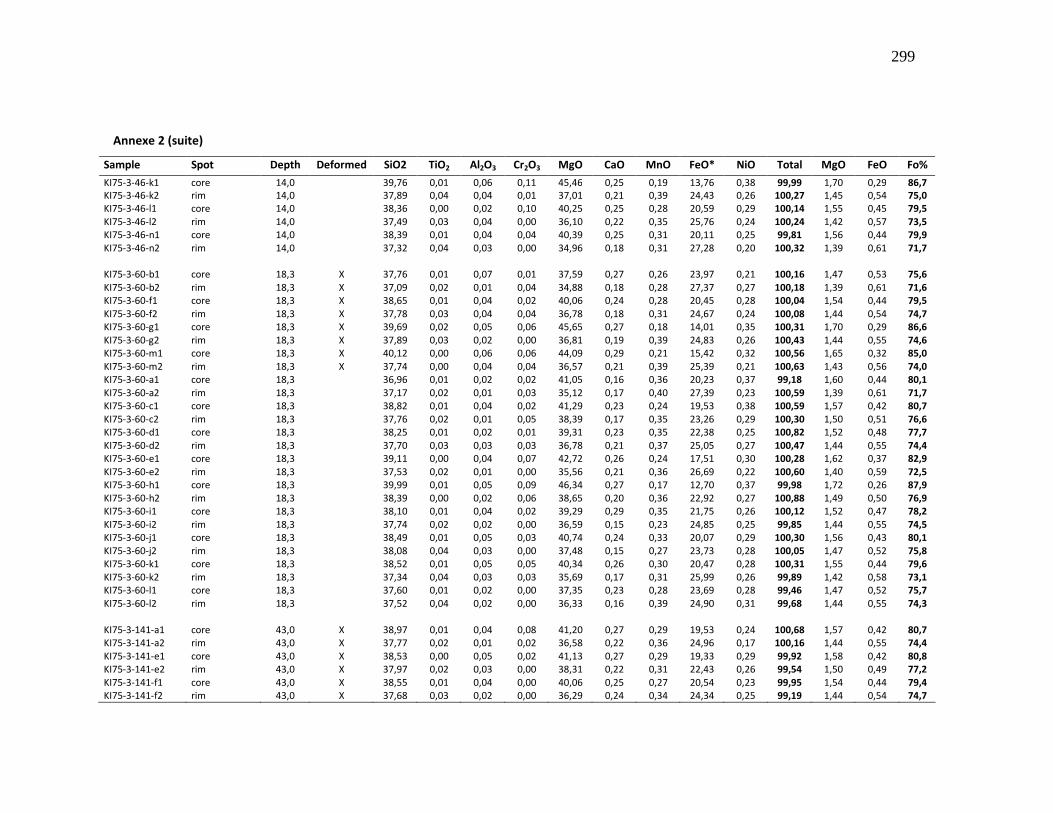
299
Annexe 2 (suite)
Sample Spot Depth Deformed SiO2 TiO2 Al2O3 Cr2O3 MgO CaO MnO FeO* NiO Total MgO FeO Fo%
KI75-3-46-k1 core 14,0 39,76 0,01 0,06 0,11 45,46 0,25 0,19 13,76 0,38 99,99 1,70 0,29 86,7 KI75-3-46-k2 rim 14,0 37,89 0,04 0,04 0,01 37,01 0,21 0,39 24,43 0,26 100,27 1,45 0,54 75,0 KI75-3-46-l1 core 14,0 38,36 0,00 0,02 0,10 40,25 0,25 0,28 20,59 0,29 100,14 1,55 0,45 79,5 KI75-3-46-l2 rim 14,0 37,49 0,03 0,04 0,00 36,10 0,22 0,35 25,76 0,24 100,24 1,42 0,57 73,5 KI75-3-46-n1 core 14,0 38,39 0,01 0,04 0,04 40,39 0,25 0,31 20,11 0,25 99,81 1,56 0,44 79,9 KI75-3-46-n2 rim 14,0 37,32 0,04 0,03 0,00 34,96 0,18 0,31 27,28 0,20 100,32 1,39 0,61 71,7
KI75-3-60-b1 core 18,3 X 37,76 0,01 0,07 0,01 37,59 0,27 0,26 23,97 0,21 100,16 1,47 0,53 75,6 KI75-3-60-b2 rim 18,3 X 37,09 0,02 0,01 0,04 34,88 0,18 0,28 27,37 0,27 100,18 1,39 0,61 71,6 KI75-3-60-f1 core 18,3 X 38,65 0,01 0,04 0,02 40,06 0,24 0,28 20,45 0,28 100,04 1,54 0,44 79,5 KI75-3-60-f2 rim 18,3 X 37,78 0,03 0,04 0,04 36,78 0,18 0,31 24,67 0,24 100,08 1,44 0,54 74,7 KI75-3-60-g1 core 18,3 X 39,69 0,02 0,05 0,06 45,65 0,27 0,18 14,01 0,35 100,31 1,70 0,29 86,6 KI75-3-60-g2 rim 18,3 X 37,89 0,03 0,02 0,00 36,81 0,19 0,39 24,83 0,26 100,43 1,44 0,55 74,6 KI75-3-60-m1 core 18,3 X 40,12 0,00 0,06 0,06 44,09 0,29 0,21 15,42 0,32 100,56 1,65 0,32 85,0 KI75-3-60-m2 rim 18,3 X 37,74 0,00 0,04 0,04 36,57 0,21 0,39 25,39 0,21 100,63 1,43 0,56 74,0 KI75-3-60-a1 core 18,3 36,96 0,01 0,02 0,02 41,05 0,16 0,36 20,23 0,37 99,18 1,60 0,44 80,1 KI75-3-60-a2 rim 18,3 37,17 0,02 0,01 0,03 35,12 0,17 0,40 27,39 0,23 100,59 1,39 0,61 71,7 KI75-3-60-c1 core 18,3 38,82 0,01 0,04 0,02 41,29 0,23 0,24 19,53 0,38 100,59 1,57 0,42 80,7 KI75-3-60-c2 rim 18,3 37,76 0,02 0,01 0,05 38,39 0,17 0,35 23,26 0,29 100,30 1,50 0,51 76,6 KI75-3-60-d1 core 18,3 38,25 0,01 0,02 0,01 39,31 0,23 0,35 22,38 0,25 100,82 1,52 0,48 77,7 KI75-3-60-d2 rim 18,3 37,70 0,03 0,03 0,03 36,78 0,21 0,37 25,05 0,27 100,47 1,44 0,55 74,4 KI75-3-60-e1 core 18,3 39,11 0,00 0,04 0,07 42,72 0,26 0,24 17,51 0,30 100,28 1,62 0,37 82,9 KI75-3-60-e2 rim 18,3 37,53 0,02 0,01 0,00 35,56 0,21 0,36 26,69 0,22 100,60 1,40 0,59 72,5 KI75-3-60-h1 core 18,3 39,99 0,01 0,05 0,09 46,34 0,27 0,17 12,70 0,37 99,98 1,72 0,26 87,9 KI75-3-60-h2 rim 18,3 38,39 0,00 0,02 0,06 38,65 0,20 0,36 22,92 0,27 100,88 1,49 0,50 76,9 KI75-3-60-i1 core 18,3 38,10 0,01 0,04 0,02 39,29 0,29 0,35 21,75 0,26 100,12 1,52 0,47 78,2 KI75-3-60-i2 rim 18,3 37,74 0,02 0,02 0,00 36,59 0,15 0,23 24,85 0,25 99,85 1,44 0,55 74,5 KI75-3-60-j1 core 18,3 38,49 0,01 0,05 0,03 40,74 0,24 0,33 20,07 0,29 100,30 1,56 0,43 80,1 KI75-3-60-j2 rim 18,3 38,08 0,04 0,03 0,00 37,48 0,15 0,27 23,73 0,28 100,05 1,47 0,52 75,8 KI75-3-60-k1 core 18,3 38,52 0,01 0,05 0,05 40,34 0,26 0,30 20,47 0,28 100,31 1,55 0,44 79,6 KI75-3-60-k2 rim 18,3 37,34 0,04 0,03 0,03 35,69 0,17 0,31 25,99 0,26 99,89 1,42 0,58 73,1 KI75-3-60-l1 core 18,3 37,60 0,01 0,02 0,00 37,35 0,23 0,28 23,69 0,28 99,46 1,47 0,52 75,7 KI75-3-60-l2 rim 18,3 37,52 0,04 0,02 0,00 36,33 0,16 0,39 24,90 0,31 99,68 1,44 0,55 74,3 KI75-3-141-a1 core 43,0 X 38,97 0,01 0,04 0,08 41,20 0,27 0,29 19,53 0,24 100,68 1,57 0,42 80,7 KI75-3-141-a2 rim 43,0 X 37,77 0,02 0,01 0,02 36,58 0,22 0,36 24,96 0,17 100,16 1,44 0,55 74,4 KI75-3-141-e1 core 43,0 X 38,53 0,00 0,05 0,02 41,13 0,27 0,29 19,33 0,29 99,92 1,58 0,42 80,8 KI75-3-141-e2 rim 43,0 X 37,97 0,02 0,03 0,00 38,31 0,22 0,31 22,43 0,26 99,54 1,50 0,49 77,2 KI75-3-141-f1 core 43,0 X 38,55 0,01 0,04 0,00 40,06 0,25 0,27 20,54 0,23 99,95 1,54 0,44 79,4 KI75-3-141-f2 rim 43,0 X 37,68 0,03 0,02 0,00 36,29 0,24 0,34 24,34 0,25 99,19 1,44 0,54 74,7
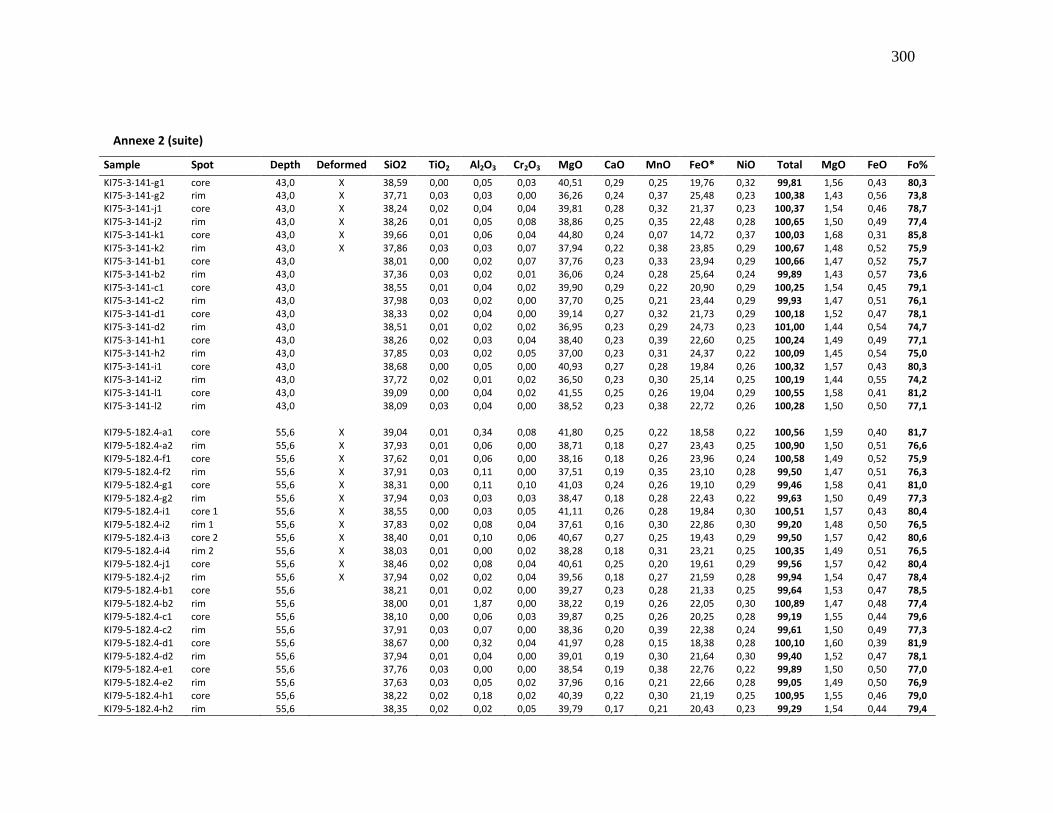
300
Annexe 2 (suite)
Sample Spot Depth Deformed SiO2 TiO2 Al2O3 Cr2O3 MgO CaO MnO FeO* NiO Total MgO FeO Fo%
KI75-3-141-g1 core 43,0 X 38,59 0,00 0,05 0,03 40,51 0,29 0,25 19,76 0,32 99,81 1,56 0,43 80,3 KI75-3-141-g2 rim 43,0 X 37,71 0,03 0,03 0,00 36,26 0,24 0,37 25,48 0,23 100,38 1,43 0,56 73,8 KI75-3-141-j1 core 43,0 X 38,24 0,02 0,04 0,04 39,81 0,28 0,32 21,37 0,23 100,37 1,54 0,46 78,7 KI75-3-141-j2 rim 43,0 X 38,26 0,01 0,05 0,08 38,86 0,25 0,35 22,48 0,28 100,65 1,50 0,49 77,4 KI75-3-141-k1 core 43,0 X 39,66 0,01 0,06 0,04 44,80 0,24 0,07 14,72 0,37 100,03 1,68 0,31 85,8 KI75-3-141-k2 rim 43,0 X 37,86 0,03 0,03 0,07 37,94 0,22 0,38 23,85 0,29 100,67 1,48 0,52 75,9 KI75-3-141-b1 core 43,0 38,01 0,00 0,02 0,07 37,76 0,23 0,33 23,94 0,29 100,66 1,47 0,52 75,7 KI75-3-141-b2 rim 43,0 37,36 0,03 0,02 0,01 36,06 0,24 0,28 25,64 0,24 99,89 1,43 0,57 73,6 KI75-3-141-c1 core 43,0 38,55 0,01 0,04 0,02 39,90 0,29 0,22 20,90 0,29 100,25 1,54 0,45 79,1 KI75-3-141-c2 rim 43,0 37,98 0,03 0,02 0,00 37,70 0,25 0,21 23,44 0,29 99,93 1,47 0,51 76,1 KI75-3-141-d1 core 43,0 38,33 0,02 0,04 0,00 39,14 0,27 0,32 21,73 0,29 100,18 1,52 0,47 78,1 KI75-3-141-d2 rim 43,0 38,51 0,01 0,02 0,02 36,95 0,23 0,29 24,73 0,23 101,00 1,44 0,54 74,7 KI75-3-141-h1 core 43,0 38,26 0,02 0,03 0,04 38,40 0,23 0,39 22,60 0,25 100,24 1,49 0,49 77,1 KI75-3-141-h2 rim 43,0 37,85 0,03 0,02 0,05 37,00 0,23 0,31 24,37 0,22 100,09 1,45 0,54 75,0 KI75-3-141-i1 core 43,0 38,68 0,00 0,05 0,00 40,93 0,27 0,28 19,84 0,26 100,32 1,57 0,43 80,3 KI75-3-141-i2 rim 43,0 37,72 0,02 0,01 0,02 36,50 0,23 0,30 25,14 0,25 100,19 1,44 0,55 74,2 KI75-3-141-l1 core 43,0 39,09 0,00 0,04 0,02 41,55 0,25 0,26 19,04 0,29 100,55 1,58 0,41 81,2 KI75-3-141-l2 rim 43,0 38,09 0,03 0,04 0,00 38,52 0,23 0,38 22,72 0,26 100,28 1,50 0,50 77,1 KI79-5-182.4-a1 core 55,6 X 39,04 0,01 0,34 0,08 41,80 0,25 0,22 18,58 0,22 100,56 1,59 0,40 81,7 KI79-5-182.4-a2 rim 55,6 X 37,93 0,01 0,06 0,00 38,71 0,18 0,27 23,43 0,25 100,90 1,50 0,51 76,6 KI79-5-182.4-f1 core 55,6 X 37,62 0,01 0,06 0,00 38,16 0,18 0,26 23,96 0,24 100,58 1,49 0,52 75,9 KI79-5-182.4-f2 rim 55,6 X 37,91 0,03 0,11 0,00 37,51 0,19 0,35 23,10 0,28 99,50 1,47 0,51 76,3 KI79-5-182.4-g1 core 55,6 X 38,31 0,00 0,11 0,10 41,03 0,24 0,26 19,10 0,29 99,46 1,58 0,41 81,0 KI79-5-182.4-g2 rim 55,6 X 37,94 0,03 0,03 0,03 38,47 0,18 0,28 22,43 0,22 99,63 1,50 0,49 77,3 KI79-5-182.4-i1 core 1 55,6 X 38,55 0,00 0,03 0,05 41,11 0,26 0,28 19,84 0,30 100,51 1,57 0,43 80,4 KI79-5-182.4-i2 rim 1 55,6 X 37,83 0,02 0,08 0,04 37,61 0,16 0,30 22,86 0,30 99,20 1,48 0,50 76,5 KI79-5-182.4-i3 core 2 55,6 X 38,40 0,01 0,10 0,06 40,67 0,27 0,25 19,43 0,29 99,50 1,57 0,42 80,6 KI79-5-182.4-i4 rim 2 55,6 X 38,03 0,01 0,00 0,02 38,28 0,18 0,31 23,21 0,25 100,35 1,49 0,51 76,5 KI79-5-182.4-j1 core 55,6 X 38,46 0,02 0,08 0,04 40,61 0,25 0,20 19,61 0,29 99,56 1,57 0,42 80,4 KI79-5-182.4-j2 rim 55,6 X 37,94 0,02 0,02 0,04 39,56 0,18 0,27 21,59 0,28 99,94 1,54 0,47 78,4 KI79-5-182.4-b1 core 55,6 38,21 0,01 0,02 0,00 39,27 0,23 0,28 21,33 0,25 99,64 1,53 0,47 78,5 KI79-5-182.4-b2 rim 55,6 38,00 0,01 1,87 0,00 38,22 0,19 0,26 22,05 0,30 100,89 1,47 0,48 77,4 KI79-5-182.4-c1 core 55,6 38,10 0,00 0,06 0,03 39,87 0,25 0,26 20,25 0,28 99,19 1,55 0,44 79,6 KI79-5-182.4-c2 rim 55,6 37,91 0,03 0,07 0,00 38,36 0,20 0,39 22,38 0,24 99,61 1,50 0,49 77,3 KI79-5-182.4-d1 core 55,6 38,67 0,00 0,32 0,04 41,97 0,28 0,15 18,38 0,28 100,10 1,60 0,39 81,9 KI79-5-182.4-d2 rim 55,6 37,94 0,01 0,04 0,00 39,01 0,19 0,30 21,64 0,30 99,40 1,52 0,47 78,1 KI79-5-182.4-e1 core 55,6 37,76 0,03 0,00 0,00 38,54 0,19 0,38 22,76 0,22 99,89 1,50 0,50 77,0 KI79-5-182.4-e2 rim 55,6 37,63 0,03 0,05 0,02 37,96 0,16 0,21 22,66 0,28 99,05 1,49 0,50 76,9 KI79-5-182.4-h1 core 55,6 38,22 0,02 0,18 0,02 40,39 0,22 0,30 21,19 0,25 100,95 1,55 0,46 79,0 KI79-5-182.4-h2 rim 55,6 38,35 0,02 0,02 0,05 39,79 0,17 0,21 20,43 0,23 99,29 1,54 0,44 79,4
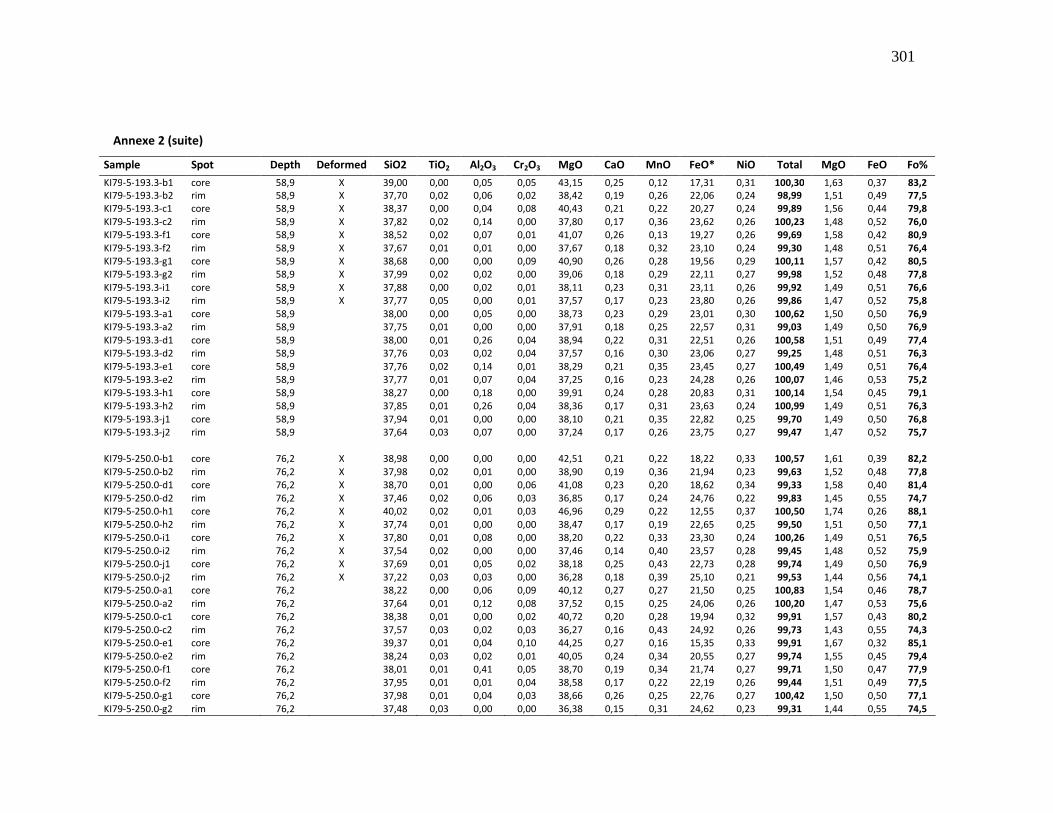
301
Annexe 2 (suite)
Sample Spot Depth Deformed SiO2 TiO2 Al2O3 Cr2O3 MgO CaO MnO FeO* NiO Total MgO FeO Fo%
KI79-5-193.3-b1 core 58,9 X 39,00 0,00 0,05 0,05 43,15 0,25 0,12 17,31 0,31 100,30 1,63 0,37 83,2 KI79-5-193.3-b2 rim 58,9 X 37,70 0,02 0,06 0,02 38,42 0,19 0,26 22,06 0,24 98,99 1,51 0,49 77,5 KI79-5-193.3-c1 core 58,9 X 38,37 0,00 0,04 0,08 40,43 0,21 0,22 20,27 0,24 99,89 1,56 0,44 79,8 KI79-5-193.3-c2 rim 58,9 X 37,82 0,02 0,14 0,00 37,80 0,17 0,36 23,62 0,26 100,23 1,48 0,52 76,0 KI79-5-193.3-f1 core 58,9 X 38,52 0,02 0,07 0,01 41,07 0,26 0,13 19,27 0,26 99,69 1,58 0,42 80,9 KI79-5-193.3-f2 rim 58,9 X 37,67 0,01 0,01 0,00 37,67 0,18 0,32 23,10 0,24 99,30 1,48 0,51 76,4 KI79-5-193.3-g1 core 58,9 X 38,68 0,00 0,00 0,09 40,90 0,26 0,28 19,56 0,29 100,11 1,57 0,42 80,5 KI79-5-193.3-g2 rim 58,9 X 37,99 0,02 0,02 0,00 39,06 0,18 0,29 22,11 0,27 99,98 1,52 0,48 77,8 KI79-5-193.3-i1 core 58,9 X 37,88 0,00 0,02 0,01 38,11 0,23 0,31 23,11 0,26 99,92 1,49 0,51 76,6 KI79-5-193.3-i2 rim 58,9 X 37,77 0,05 0,00 0,01 37,57 0,17 0,23 23,80 0,26 99,86 1,47 0,52 75,8 KI79-5-193.3-a1 core 58,9 38,00 0,00 0,05 0,00 38,73 0,23 0,29 23,01 0,30 100,62 1,50 0,50 76,9 KI79-5-193.3-a2 rim 58,9 37,75 0,01 0,00 0,00 37,91 0,18 0,25 22,57 0,31 99,03 1,49 0,50 76,9 KI79-5-193.3-d1 core 58,9 38,00 0,01 0,26 0,04 38,94 0,22 0,31 22,51 0,26 100,58 1,51 0,49 77,4 KI79-5-193.3-d2 rim 58,9 37,76 0,03 0,02 0,04 37,57 0,16 0,30 23,06 0,27 99,25 1,48 0,51 76,3 KI79-5-193.3-e1 core 58,9 37,76 0,02 0,14 0,01 38,29 0,21 0,35 23,45 0,27 100,49 1,49 0,51 76,4 KI79-5-193.3-e2 rim 58,9 37,77 0,01 0,07 0,04 37,25 0,16 0,23 24,28 0,26 100,07 1,46 0,53 75,2 KI79-5-193.3-h1 core 58,9 38,27 0,00 0,18 0,00 39,91 0,24 0,28 20,83 0,31 100,14 1,54 0,45 79,1 KI79-5-193.3-h2 rim 58,9 37,85 0,01 0,26 0,04 38,36 0,17 0,31 23,63 0,24 100,99 1,49 0,51 76,3 KI79-5-193.3-j1 core 58,9 37,94 0,01 0,00 0,00 38,10 0,21 0,35 22,82 0,25 99,70 1,49 0,50 76,8 KI79-5-193.3-j2 rim 58,9 37,64 0,03 0,07 0,00 37,24 0,17 0,26 23,75 0,27 99,47 1,47 0,52 75,7 KI79-5-250.0-b1 core 76,2 X 38,98 0,00 0,00 0,00 42,51 0,21 0,22 18,22 0,33 100,57 1,61 0,39 82,2 KI79-5-250.0-b2 rim 76,2 X 37,98 0,02 0,01 0,00 38,90 0,19 0,36 21,94 0,23 99,63 1,52 0,48 77,8 KI79-5-250.0-d1 core 76,2 X 38,70 0,01 0,00 0,06 41,08 0,23 0,20 18,62 0,34 99,33 1,58 0,40 81,4 KI79-5-250.0-d2 rim 76,2 X 37,46 0,02 0,06 0,03 36,85 0,17 0,24 24,76 0,22 99,83 1,45 0,55 74,7 KI79-5-250.0-h1 core 76,2 X 40,02 0,02 0,01 0,03 46,96 0,29 0,22 12,55 0,37 100,50 1,74 0,26 88,1 KI79-5-250.0-h2 rim 76,2 X 37,74 0,01 0,00 0,00 38,47 0,17 0,19 22,65 0,25 99,50 1,51 0,50 77,1 KI79-5-250.0-i1 core 76,2 X 37,80 0,01 0,08 0,00 38,20 0,22 0,33 23,30 0,24 100,26 1,49 0,51 76,5 KI79-5-250.0-i2 rim 76,2 X 37,54 0,02 0,00 0,00 37,46 0,14 0,40 23,57 0,28 99,45 1,48 0,52 75,9 KI79-5-250.0-j1 core 76,2 X 37,69 0,01 0,05 0,02 38,18 0,25 0,43 22,73 0,28 99,74 1,49 0,50 76,9 KI79-5-250.0-j2 rim 76,2 X 37,22 0,03 0,03 0,00 36,28 0,18 0,39 25,10 0,21 99,53 1,44 0,56 74,1 KI79-5-250.0-a1 core 76,2 38,22 0,00 0,06 0,09 40,12 0,27 0,27 21,50 0,25 100,83 1,54 0,46 78,7 KI79-5-250.0-a2 rim 76,2 37,64 0,01 0,12 0,08 37,52 0,15 0,25 24,06 0,26 100,20 1,47 0,53 75,6 KI79-5-250.0-c1 core 76,2 38,38 0,01 0,00 0,02 40,72 0,20 0,28 19,94 0,32 99,91 1,57 0,43 80,2 KI79-5-250.0-c2 rim 76,2 37,57 0,03 0,02 0,03 36,27 0,16 0,43 24,92 0,26 99,73 1,43 0,55 74,3 KI79-5-250.0-e1 core 76,2 39,37 0,01 0,04 0,10 44,25 0,27 0,16 15,35 0,33 99,91 1,67 0,32 85,1 KI79-5-250.0-e2 rim 76,2 38,24 0,03 0,02 0,01 40,05 0,24 0,34 20,55 0,27 99,74 1,55 0,45 79,4 KI79-5-250.0-f1 core 76,2 38,01 0,01 0,41 0,05 38,70 0,19 0,34 21,74 0,27 99,71 1,50 0,47 77,9 KI79-5-250.0-f2 rim 76,2 37,95 0,01 0,01 0,04 38,58 0,17 0,22 22,19 0,26 99,44 1,51 0,49 77,5 KI79-5-250.0-g1 core 76,2 37,98 0,01 0,04 0,03 38,66 0,26 0,25 22,76 0,27 100,42 1,50 0,50 77,1 KI79-5-250.0-g2 rim 76,2 37,48 0,03 0,00 0,00 36,38 0,15 0,31 24,62 0,23 99,31 1,44 0,55 74,5
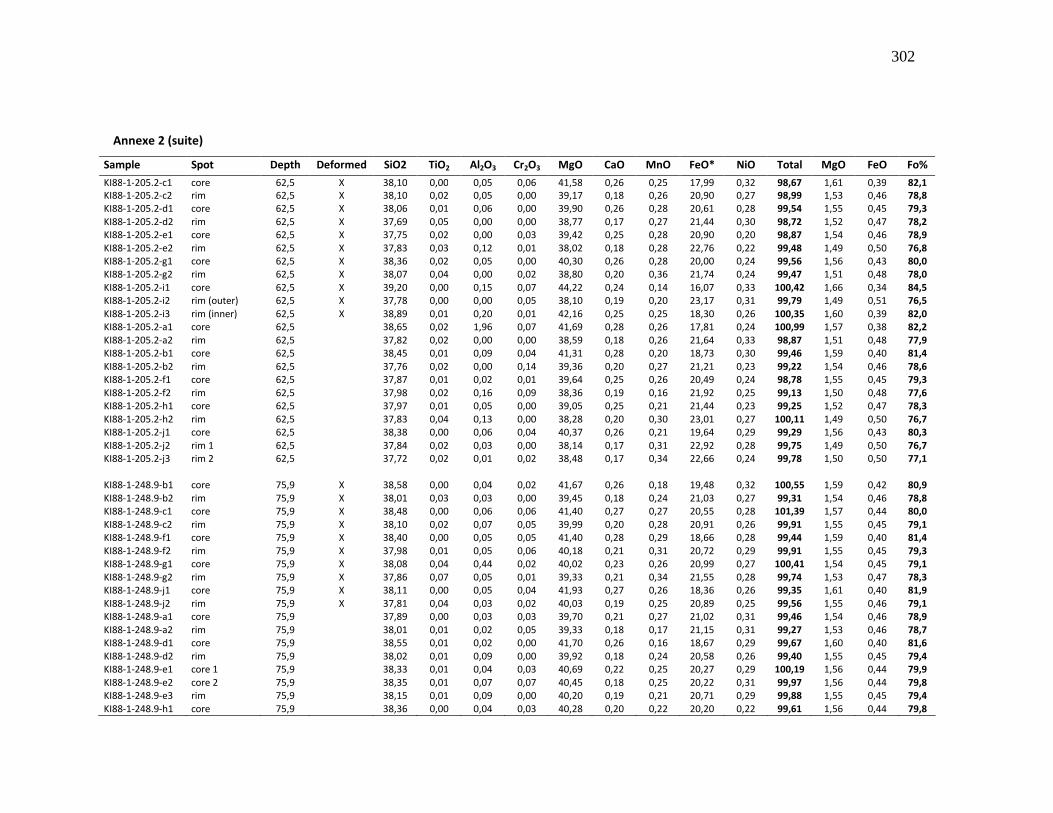
302
Annexe 2 (suite)
Sample Spot Depth Deformed SiO2 TiO2 Al2O3 Cr2O3 MgO CaO MnO FeO* NiO Total MgO FeO Fo%
KI88-1-205.2-c1 core 62,5 X 38,10 0,00 0,05 0,06 41,58 0,26 0,25 17,99 0,32 98,67 1,61 0,39 82,1 KI88-1-205.2-c2 rim 62,5 X 38,10 0,02 0,05 0,00 39,17 0,18 0,26 20,90 0,27 98,99 1,53 0,46 78,8 KI88-1-205.2-d1 core 62,5 X 38,06 0,01 0,06 0,00 39,90 0,26 0,28 20,61 0,28 99,54 1,55 0,45 79,3 KI88-1-205.2-d2 rim 62,5 X 37,69 0,05 0,00 0,00 38,77 0,17 0,27 21,44 0,30 98,72 1,52 0,47 78,2 KI88-1-205.2-e1 core 62,5 X 37,75 0,02 0,00 0,03 39,42 0,25 0,28 20,90 0,20 98,87 1,54 0,46 78,9 KI88-1-205.2-e2 rim 62,5 X 37,83 0,03 0,12 0,01 38,02 0,18 0,28 22,76 0,22 99,48 1,49 0,50 76,8 KI88-1-205.2-g1 core 62,5 X 38,36 0,02 0,05 0,00 40,30 0,26 0,28 20,00 0,24 99,56 1,56 0,43 80,0 KI88-1-205.2-g2 rim 62,5 X 38,07 0,04 0,00 0,02 38,80 0,20 0,36 21,74 0,24 99,47 1,51 0,48 78,0 KI88-1-205.2-i1 core 62,5 X 39,20 0,00 0,15 0,07 44,22 0,24 0,14 16,07 0,33 100,42 1,66 0,34 84,5 KI88-1-205.2-i2 rim (outer) 62,5 X 37,78 0,00 0,00 0,05 38,10 0,19 0,20 23,17 0,31 99,79 1,49 0,51 76,5 KI88-1-205.2-i3 rim (inner) 62,5 X 38,89 0,01 0,20 0,01 42,16 0,25 0,25 18,30 0,26 100,35 1,60 0,39 82,0 KI88-1-205.2-a1 core 62,5 38,65 0,02 1,96 0,07 41,69 0,28 0,26 17,81 0,24 100,99 1,57 0,38 82,2 KI88-1-205.2-a2 rim 62,5 37,82 0,02 0,00 0,00 38,59 0,18 0,26 21,64 0,33 98,87 1,51 0,48 77,9 KI88-1-205.2-b1 core 62,5 38,45 0,01 0,09 0,04 41,31 0,28 0,20 18,73 0,30 99,46 1,59 0,40 81,4 KI88-1-205.2-b2 rim 62,5 37,76 0,02 0,00 0,14 39,36 0,20 0,27 21,21 0,23 99,22 1,54 0,46 78,6 KI88-1-205.2-f1 core 62,5 37,87 0,01 0,02 0,01 39,64 0,25 0,26 20,49 0,24 98,78 1,55 0,45 79,3 KI88-1-205.2-f2 rim 62,5 37,98 0,02 0,16 0,09 38,36 0,19 0,16 21,92 0,25 99,13 1,50 0,48 77,6 KI88-1-205.2-h1 core 62,5 37,97 0,01 0,05 0,00 39,05 0,25 0,21 21,44 0,23 99,25 1,52 0,47 78,3 KI88-1-205.2-h2 rim 62,5 37,83 0,04 0,13 0,00 38,28 0,20 0,30 23,01 0,27 100,11 1,49 0,50 76,7 KI88-1-205.2-j1 core 62,5 38,38 0,00 0,06 0,04 40,37 0,26 0,21 19,64 0,29 99,29 1,56 0,43 80,3 KI88-1-205.2-j2 rim 1 62,5 37,84 0,02 0,03 0,00 38,14 0,17 0,31 22,92 0,28 99,75 1,49 0,50 76,7 KI88-1-205.2-j3 rim 2 62,5 37,72 0,02 0,01 0,02 38,48 0,17 0,34 22,66 0,24 99,78 1,50 0,50 77,1 KI88-1-248.9-b1 core 75,9 X 38,58 0,00 0,04 0,02 41,67 0,26 0,18 19,48 0,32 100,55 1,59 0,42 80,9 KI88-1-248.9-b2 rim 75,9 X 38,01 0,03 0,03 0,00 39,45 0,18 0,24 21,03 0,27 99,31 1,54 0,46 78,8 KI88-1-248.9-c1 core 75,9 X 38,48 0,00 0,06 0,06 41,40 0,27 0,27 20,55 0,28 101,39 1,57 0,44 80,0 KI88-1-248.9-c2 rim 75,9 X 38,10 0,02 0,07 0,05 39,99 0,20 0,28 20,91 0,26 99,91 1,55 0,45 79,1 KI88-1-248.9-f1 core 75,9 X 38,40 0,00 0,05 0,05 41,40 0,28 0,29 18,66 0,28 99,44 1,59 0,40 81,4 KI88-1-248.9-f2 rim 75,9 X 37,98 0,01 0,05 0,06 40,18 0,21 0,31 20,72 0,29 99,91 1,55 0,45 79,3 KI88-1-248.9-g1 core 75,9 X 38,08 0,04 0,44 0,02 40,02 0,23 0,26 20,99 0,27 100,41 1,54 0,45 79,1 KI88-1-248.9-g2 rim 75,9 X 37,86 0,07 0,05 0,01 39,33 0,21 0,34 21,55 0,28 99,74 1,53 0,47 78,3 KI88-1-248.9-j1 core 75,9 X 38,11 0,00 0,05 0,04 41,93 0,27 0,26 18,36 0,26 99,35 1,61 0,40 81,9 KI88-1-248.9-j2 rim 75,9 X 37,81 0,04 0,03 0,02 40,03 0,19 0,25 20,89 0,25 99,56 1,55 0,46 79,1 KI88-1-248.9-a1 core 75,9 37,89 0,00 0,03 0,03 39,70 0,21 0,27 21,02 0,31 99,46 1,54 0,46 78,9 KI88-1-248.9-a2 rim 75,9 38,01 0,01 0,02 0,05 39,33 0,18 0,17 21,15 0,31 99,27 1,53 0,46 78,7 KI88-1-248.9-d1 core 75,9 38,55 0,01 0,02 0,00 41,70 0,26 0,16 18,67 0,29 99,67 1,60 0,40 81,6 KI88-1-248.9-d2 rim 75,9 38,02 0,01 0,09 0,00 39,92 0,18 0,24 20,58 0,26 99,40 1,55 0,45 79,4 KI88-1-248.9-e1 core 1 75,9 38,33 0,01 0,04 0,03 40,69 0,22 0,25 20,27 0,29 100,19 1,56 0,44 79,9 KI88-1-248.9-e2 core 2 75,9 38,35 0,01 0,07 0,07 40,45 0,18 0,25 20,22 0,31 99,97 1,56 0,44 79,8 KI88-1-248.9-e3 rim 75,9 38,15 0,01 0,09 0,00 40,20 0,19 0,21 20,71 0,29 99,88 1,55 0,45 79,4 KI88-1-248.9-h1 core 75,9 38,36 0,00 0,04 0,03 40,28 0,20 0,22 20,20 0,22 99,61 1,56 0,44 79,8
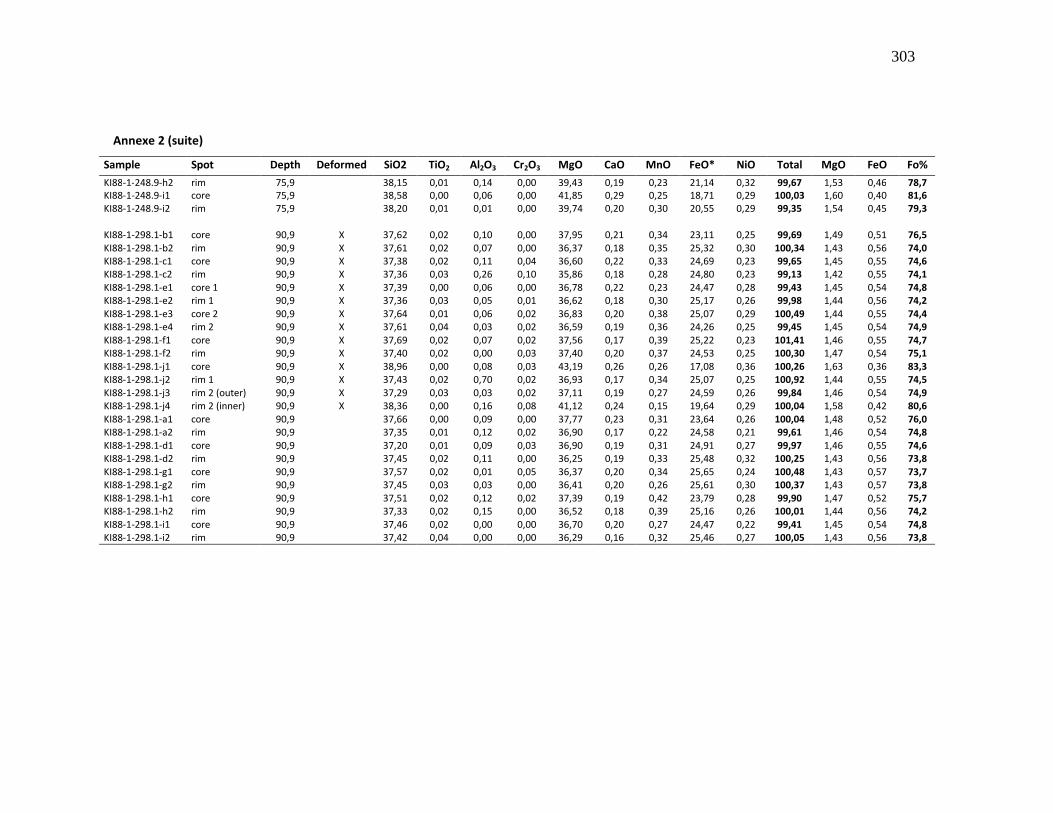
303
Annexe 2 (suite)
Sample Spot Depth Deformed SiO2 TiO2 Al2O3 Cr2O3 MgO CaO MnO FeO* NiO Total MgO FeO Fo%
KI88-1-248.9-h2 rim 75,9 38,15 0,01 0,14 0,00 39,43 0,19 0,23 21,14 0,32 99,67 1,53 0,46 78,7 KI88-1-248.9-i1 core 75,9 38,58 0,00 0,06 0,00 41,85 0,29 0,25 18,71 0,29 100,03 1,60 0,40 81,6 KI88-1-248.9-i2 rim 75,9 38,20 0,01 0,01 0,00 39,74 0,20 0,30 20,55 0,29 99,35 1,54 0,45 79,3 KI88-1-298.1-b1 core 90,9 X 37,62 0,02 0,10 0,00 37,95 0,21 0,34 23,11 0,25 99,69 1,49 0,51 76,5 KI88-1-298.1-b2 rim 90,9 X 37,61 0,02 0,07 0,00 36,37 0,18 0,35 25,32 0,30 100,34 1,43 0,56 74,0 KI88-1-298.1-c1 core 90,9 X 37,38 0,02 0,11 0,04 36,60 0,22 0,33 24,69 0,23 99,65 1,45 0,55 74,6 KI88-1-298.1-c2 rim 90,9 X 37,36 0,03 0,26 0,10 35,86 0,18 0,28 24,80 0,23 99,13 1,42 0,55 74,1 KI88-1-298.1-e1 core 1 90,9 X 37,39 0,00 0,06 0,00 36,78 0,22 0,23 24,47 0,28 99,43 1,45 0,54 74,8 KI88-1-298.1-e2 rim 1 90,9 X 37,36 0,03 0,05 0,01 36,62 0,18 0,30 25,17 0,26 99,98 1,44 0,56 74,2 KI88-1-298.1-e3 core 2 90,9 X 37,64 0,01 0,06 0,02 36,83 0,20 0,38 25,07 0,29 100,49 1,44 0,55 74,4 KI88-1-298.1-e4 rim 2 90,9 X 37,61 0,04 0,03 0,02 36,59 0,19 0,36 24,26 0,25 99,45 1,45 0,54 74,9 KI88-1-298.1-f1 core 90,9 X 37,69 0,02 0,07 0,02 37,56 0,17 0,39 25,22 0,23 101,41 1,46 0,55 74,7 KI88-1-298.1-f2 rim 90,9 X 37,40 0,02 0,00 0,03 37,40 0,20 0,37 24,53 0,25 100,30 1,47 0,54 75,1 KI88-1-298.1-j1 core 90,9 X 38,96 0,00 0,08 0,03 43,19 0,26 0,26 17,08 0,36 100,26 1,63 0,36 83,3 KI88-1-298.1-j2 rim 1 90,9 X 37,43 0,02 0,70 0,02 36,93 0,17 0,34 25,07 0,25 100,92 1,44 0,55 74,5 KI88-1-298.1-j3 rim 2 (outer) 90,9 X 37,29 0,03 0,03 0,02 37,11 0,19 0,27 24,59 0,26 99,84 1,46 0,54 74,9 KI88-1-298.1-j4 rim 2 (inner) 90,9 X 38,36 0,00 0,16 0,08 41,12 0,24 0,15 19,64 0,29 100,04 1,58 0,42 80,6 KI88-1-298.1-a1 core 90,9 37,66 0,00 0,09 0,00 37,77 0,23 0,31 23,64 0,26 100,04 1,48 0,52 76,0 KI88-1-298.1-a2 rim 90,9 37,35 0,01 0,12 0,02 36,90 0,17 0,22 24,58 0,21 99,61 1,46 0,54 74,8 KI88-1-298.1-d1 core 90,9 37,20 0,01 0,09 0,03 36,90 0,19 0,31 24,91 0,27 99,97 1,46 0,55 74,6 KI88-1-298.1-d2 rim 90,9 37,45 0,02 0,11 0,00 36,25 0,19 0,33 25,48 0,32 100,25 1,43 0,56 73,8 KI88-1-298.1-g1 core 90,9 37,57 0,02 0,01 0,05 36,37 0,20 0,34 25,65 0,24 100,48 1,43 0,57 73,7 KI88-1-298.1-g2 rim 90,9 37,45 0,03 0,03 0,00 36,41 0,20 0,26 25,61 0,30 100,37 1,43 0,57 73,8 KI88-1-298.1-h1 core 90,9 37,51 0,02 0,12 0,02 37,39 0,19 0,42 23,79 0,28 99,90 1,47 0,52 75,7 KI88-1-298.1-h2 rim 90,9 37,33 0,02 0,15 0,00 36,52 0,18 0,39 25,16 0,26 100,01 1,44 0,56 74,2 KI88-1-298.1-i1 core 90,9 37,46 0,02 0,00 0,00 36,70 0,20 0,27 24,47 0,22 99,41 1,45 0,54 74,8 KI88-1-298.1-i2 rim 90,9 37,42 0,04 0,00 0,00 36,29 0,16 0,32 25,46 0,27 100,05 1,43 0,56 73,8
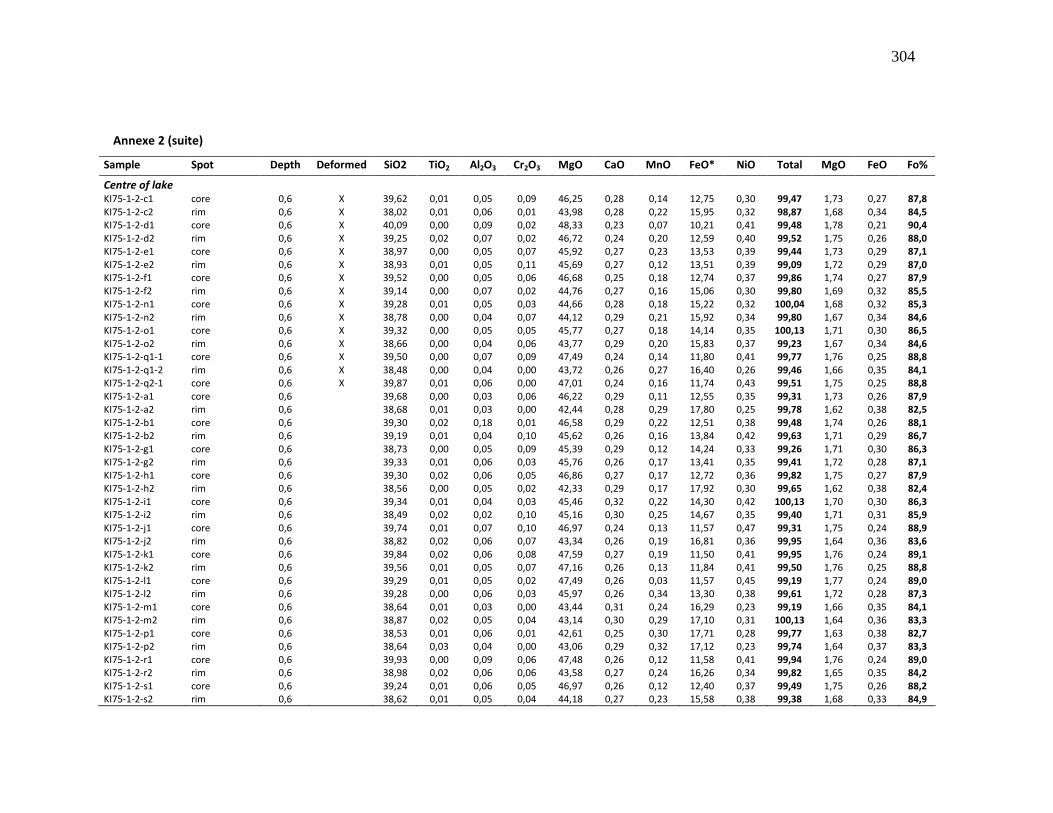
304
Annexe 2 (suite)
Sample Spot Depth Deformed SiO2 TiO2 Al2O3 Cr2O3 MgO CaO MnO FeO* NiO Total MgO FeO Fo%
Centre of lake KI75-1-2-c1 core 0,6 X 39,62 0,01 0,05 0,09 46,25 0,28 0,14 12,75 0,30 99,47 1,73 0,27 87,8 KI75-1-2-c2 rim 0,6 X 38,02 0,01 0,06 0,01 43,98 0,28 0,22 15,95 0,32 98,87 1,68 0,34 84,5 KI75-1-2-d1 core 0,6 X 40,09 0,00 0,09 0,02 48,33 0,23 0,07 10,21 0,41 99,48 1,78 0,21 90,4 KI75-1-2-d2 rim 0,6 X 39,25 0,02 0,07 0,02 46,72 0,24 0,20 12,59 0,40 99,52 1,75 0,26 88,0 KI75-1-2-e1 core 0,6 X 38,97 0,00 0,05 0,07 45,92 0,27 0,23 13,53 0,39 99,44 1,73 0,29 87,1 KI75-1-2-e2 rim 0,6 X 38,93 0,01 0,05 0,11 45,69 0,27 0,12 13,51 0,39 99,09 1,72 0,29 87,0 KI75-1-2-f1 core 0,6 X 39,52 0,00 0,05 0,06 46,68 0,25 0,18 12,74 0,37 99,86 1,74 0,27 87,9 KI75-1-2-f2 rim 0,6 X 39,14 0,00 0,07 0,02 44,76 0,27 0,16 15,06 0,30 99,80 1,69 0,32 85,5 KI75-1-2-n1 core 0,6 X 39,28 0,01 0,05 0,03 44,66 0,28 0,18 15,22 0,32 100,04 1,68 0,32 85,3 KI75-1-2-n2 rim 0,6 X 38,78 0,00 0,04 0,07 44,12 0,29 0,21 15,92 0,34 99,80 1,67 0,34 84,6 KI75-1-2-o1 core 0,6 X 39,32 0,00 0,05 0,05 45,77 0,27 0,18 14,14 0,35 100,13 1,71 0,30 86,5 KI75-1-2-o2 rim 0,6 X 38,66 0,00 0,04 0,06 43,77 0,29 0,20 15,83 0,37 99,23 1,67 0,34 84,6 KI75-1-2-q1-1 core 0,6 X 39,50 0,00 0,07 0,09 47,49 0,24 0,14 11,80 0,41 99,77 1,76 0,25 88,8 KI75-1-2-q1-2 rim 0,6 X 38,48 0,00 0,04 0,00 43,72 0,26 0,27 16,40 0,26 99,46 1,66 0,35 84,1 KI75-1-2-q2-1 core 0,6 X 39,87 0,01 0,06 0,00 47,01 0,24 0,16 11,74 0,43 99,51 1,75 0,25 88,8 KI75-1-2-a1 core 0,6 39,68 0,00 0,03 0,06 46,22 0,29 0,11 12,55 0,35 99,31 1,73 0,26 87,9 KI75-1-2-a2 rim 0,6 38,68 0,01 0,03 0,00 42,44 0,28 0,29 17,80 0,25 99,78 1,62 0,38 82,5 KI75-1-2-b1 core 0,6 39,30 0,02 0,18 0,01 46,58 0,29 0,22 12,51 0,38 99,48 1,74 0,26 88,1 KI75-1-2-b2 rim 0,6 39,19 0,01 0,04 0,10 45,62 0,26 0,16 13,84 0,42 99,63 1,71 0,29 86,7 KI75-1-2-g1 core 0,6 38,73 0,00 0,05 0,09 45,39 0,29 0,12 14,24 0,33 99,26 1,71 0,30 86,3 KI75-1-2-g2 rim 0,6 39,33 0,01 0,06 0,03 45,76 0,26 0,17 13,41 0,35 99,41 1,72 0,28 87,1 KI75-1-2-h1 core 0,6 39,30 0,02 0,06 0,05 46,86 0,27 0,17 12,72 0,36 99,82 1,75 0,27 87,9 KI75-1-2-h2 rim 0,6 38,56 0,00 0,05 0,02 42,33 0,29 0,17 17,92 0,30 99,65 1,62 0,38 82,4 KI75-1-2-i1 core 0,6 39,34 0,01 0,04 0,03 45,46 0,32 0,22 14,30 0,42 100,13 1,70 0,30 86,3 KI75-1-2-i2 rim 0,6 38,49 0,02 0,02 0,10 45,16 0,30 0,25 14,67 0,35 99,40 1,71 0,31 85,9 KI75-1-2-j1 core 0,6 39,74 0,01 0,07 0,10 46,97 0,24 0,13 11,57 0,47 99,31 1,75 0,24 88,9 KI75-1-2-j2 rim 0,6 38,82 0,02 0,06 0,07 43,34 0,26 0,19 16,81 0,36 99,95 1,64 0,36 83,6 KI75-1-2-k1 core 0,6 39,84 0,02 0,06 0,08 47,59 0,27 0,19 11,50 0,41 99,95 1,76 0,24 89,1 KI75-1-2-k2 rim 0,6 39,56 0,01 0,05 0,07 47,16 0,26 0,13 11,84 0,41 99,50 1,76 0,25 88,8 KI75-1-2-l1 core 0,6 39,29 0,01 0,05 0,02 47,49 0,26 0,03 11,57 0,45 99,19 1,77 0,24 89,0 KI75-1-2-l2 rim 0,6 39,28 0,00 0,06 0,03 45,97 0,26 0,34 13,30 0,38 99,61 1,72 0,28 87,3 KI75-1-2-m1 core 0,6 38,64 0,01 0,03 0,00 43,44 0,31 0,24 16,29 0,23 99,19 1,66 0,35 84,1 KI75-1-2-m2 rim 0,6 38,87 0,02 0,05 0,04 43,14 0,30 0,29 17,10 0,31 100,13 1,64 0,36 83,3 KI75-1-2-p1 core 0,6 38,53 0,01 0,06 0,01 42,61 0,25 0,30 17,71 0,28 99,77 1,63 0,38 82,7 KI75-1-2-p2 rim 0,6 38,64 0,03 0,04 0,00 43,06 0,29 0,32 17,12 0,23 99,74 1,64 0,37 83,3 KI75-1-2-r1 core 0,6 39,93 0,00 0,09 0,06 47,48 0,26 0,12 11,58 0,41 99,94 1,76 0,24 89,0 KI75-1-2-r2 rim 0,6 38,98 0,02 0,06 0,06 43,58 0,27 0,24 16,26 0,34 99,82 1,65 0,35 84,2 KI75-1-2-s1 core 0,6 39,24 0,01 0,06 0,05 46,97 0,26 0,12 12,40 0,37 99,49 1,75 0,26 88,2 KI75-1-2-s2 rim 0,6 38,62 0,01 0,05 0,04 44,18 0,27 0,23 15,58 0,38 99,38 1,68 0,33 84,9
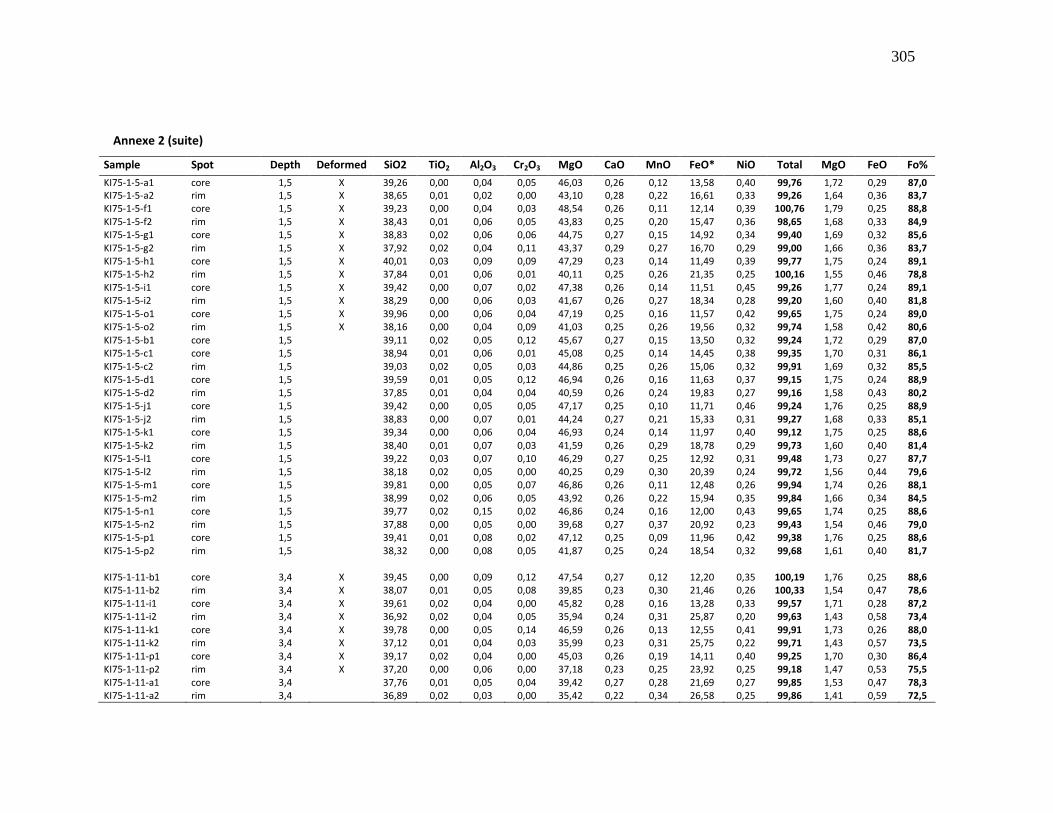
305
Annexe 2 (suite)
Sample Spot Depth Deformed SiO2 TiO2 Al2O3 Cr2O3 MgO CaO MnO FeO* NiO Total MgO FeO Fo%
KI75-1-5-a1 core 1,5 X 39,26 0,00 0,04 0,05 46,03 0,26 0,12 13,58 0,40 99,76 1,72 0,29 87,0 KI75-1-5-a2 rim 1,5 X 38,65 0,01 0,02 0,00 43,10 0,28 0,22 16,61 0,33 99,26 1,64 0,36 83,7 KI75-1-5-f1 core 1,5 X 39,23 0,00 0,04 0,03 48,54 0,26 0,11 12,14 0,39 100,76 1,79 0,25 88,8 KI75-1-5-f2 rim 1,5 X 38,43 0,01 0,06 0,05 43,83 0,25 0,20 15,47 0,36 98,65 1,68 0,33 84,9 KI75-1-5-g1 core 1,5 X 38,83 0,02 0,06 0,06 44,75 0,27 0,15 14,92 0,34 99,40 1,69 0,32 85,6 KI75-1-5-g2 rim 1,5 X 37,92 0,02 0,04 0,11 43,37 0,29 0,27 16,70 0,29 99,00 1,66 0,36 83,7 KI75-1-5-h1 core 1,5 X 40,01 0,03 0,09 0,09 47,29 0,23 0,14 11,49 0,39 99,77 1,75 0,24 89,1 KI75-1-5-h2 rim 1,5 X 37,84 0,01 0,06 0,01 40,11 0,25 0,26 21,35 0,25 100,16 1,55 0,46 78,8 KI75-1-5-i1 core 1,5 X 39,42 0,00 0,07 0,02 47,38 0,26 0,14 11,51 0,45 99,26 1,77 0,24 89,1 KI75-1-5-i2 rim 1,5 X 38,29 0,00 0,06 0,03 41,67 0,26 0,27 18,34 0,28 99,20 1,60 0,40 81,8 KI75-1-5-o1 core 1,5 X 39,96 0,00 0,06 0,04 47,19 0,25 0,16 11,57 0,42 99,65 1,75 0,24 89,0 KI75-1-5-o2 rim 1,5 X 38,16 0,00 0,04 0,09 41,03 0,25 0,26 19,56 0,32 99,74 1,58 0,42 80,6 KI75-1-5-b1 core 1,5 39,11 0,02 0,05 0,12 45,67 0,27 0,15 13,50 0,32 99,24 1,72 0,29 87,0 KI75-1-5-c1 core 1,5 38,94 0,01 0,06 0,01 45,08 0,25 0,14 14,45 0,38 99,35 1,70 0,31 86,1 KI75-1-5-c2 rim 1,5 39,03 0,02 0,05 0,03 44,86 0,25 0,26 15,06 0,32 99,91 1,69 0,32 85,5 KI75-1-5-d1 core 1,5 39,59 0,01 0,05 0,12 46,94 0,26 0,16 11,63 0,37 99,15 1,75 0,24 88,9 KI75-1-5-d2 rim 1,5 37,85 0,01 0,04 0,04 40,59 0,26 0,24 19,83 0,27 99,16 1,58 0,43 80,2 KI75-1-5-j1 core 1,5 39,42 0,00 0,05 0,05 47,17 0,25 0,10 11,71 0,46 99,24 1,76 0,25 88,9 KI75-1-5-j2 rim 1,5 38,83 0,00 0,07 0,01 44,24 0,27 0,21 15,33 0,31 99,27 1,68 0,33 85,1 KI75-1-5-k1 core 1,5 39,34 0,00 0,06 0,04 46,93 0,24 0,14 11,97 0,40 99,12 1,75 0,25 88,6 KI75-1-5-k2 rim 1,5 38,40 0,01 0,07 0,03 41,59 0,26 0,29 18,78 0,29 99,73 1,60 0,40 81,4 KI75-1-5-l1 core 1,5 39,22 0,03 0,07 0,10 46,29 0,27 0,25 12,92 0,31 99,48 1,73 0,27 87,7 KI75-1-5-l2 rim 1,5 38,18 0,02 0,05 0,00 40,25 0,29 0,30 20,39 0,24 99,72 1,56 0,44 79,6 KI75-1-5-m1 core 1,5 39,81 0,00 0,05 0,07 46,86 0,26 0,11 12,48 0,26 99,94 1,74 0,26 88,1 KI75-1-5-m2 rim 1,5 38,99 0,02 0,06 0,05 43,92 0,26 0,22 15,94 0,35 99,84 1,66 0,34 84,5 KI75-1-5-n1 core 1,5 39,77 0,02 0,15 0,02 46,86 0,24 0,16 12,00 0,43 99,65 1,74 0,25 88,6 KI75-1-5-n2 rim 1,5 37,88 0,00 0,05 0,00 39,68 0,27 0,37 20,92 0,23 99,43 1,54 0,46 79,0 KI75-1-5-p1 core 1,5 39,41 0,01 0,08 0,02 47,12 0,25 0,09 11,96 0,42 99,38 1,76 0,25 88,6 KI75-1-5-p2 rim 1,5 38,32 0,00 0,08 0,05 41,87 0,25 0,24 18,54 0,32 99,68 1,61 0,40 81,7 KI75-1-11-b1 core 3,4 X 39,45 0,00 0,09 0,12 47,54 0,27 0,12 12,20 0,35 100,19 1,76 0,25 88,6 KI75-1-11-b2 rim 3,4 X 38,07 0,01 0,05 0,08 39,85 0,23 0,30 21,46 0,26 100,33 1,54 0,47 78,6 KI75-1-11-i1 core 3,4 X 39,61 0,02 0,04 0,00 45,82 0,28 0,16 13,28 0,33 99,57 1,71 0,28 87,2 KI75-1-11-i2 rim 3,4 X 36,92 0,02 0,04 0,05 35,94 0,24 0,31 25,87 0,20 99,63 1,43 0,58 73,4 KI75-1-11-k1 core 3,4 X 39,78 0,00 0,05 0,14 46,59 0,26 0,13 12,55 0,41 99,91 1,73 0,26 88,0 KI75-1-11-k2 rim 3,4 X 37,12 0,01 0,04 0,03 35,99 0,23 0,31 25,75 0,22 99,71 1,43 0,57 73,5 KI75-1-11-p1 core 3,4 X 39,17 0,02 0,04 0,00 45,03 0,26 0,19 14,11 0,40 99,25 1,70 0,30 86,4 KI75-1-11-p2 rim 3,4 X 37,20 0,00 0,06 0,00 37,18 0,23 0,25 23,92 0,25 99,18 1,47 0,53 75,5 KI75-1-11-a1 core 3,4 37,76 0,01 0,05 0,04 39,42 0,27 0,28 21,69 0,27 99,85 1,53 0,47 78,3 KI75-1-11-a2 rim 3,4 36,89 0,02 0,03 0,00 35,42 0,22 0,34 26,58 0,25 99,86 1,41 0,59 72,5

306
Annexe 2 (suite)
Sample Spot Depth Deformed SiO2 TiO2 Al2O3 Cr2O3 MgO CaO MnO FeO* NiO Total MgO FeO Fo%
KI75-1-11-c1 core 3,4 38,47 0,01 0,03 0,05 40,48 0,29 0,25 20,80 0,28 100,68 1,55 0,45 79,4 KI75-1-11-c2 rim 3,4 37,48 0,01 0,00 0,07 36,26 0,24 0,25 25,67 0,24 100,29 1,43 0,57 73,7 KI75-1-11-d1 core 3,4 38,72 0,00 0,04 0,02 44,51 0,27 0,18 15,59 0,31 99,66 1,68 0,33 85,0 KI75-1-11-d2 rim 3,4 37,26 0,01 0,00 0,00 36,26 0,24 0,36 24,94 0,22 99,45 1,44 0,56 74,2 KI75-1-11-e1 core 3,4 39,54 0,00 0,04 0,08 46,84 0,29 0,16 13,02 0,35 100,45 1,74 0,27 87,7 KI75-1-11-e2 rim 3,4 37,08 0,01 0,03 0,01 36,77 0,22 0,46 24,85 0,21 99,64 1,46 0,55 74,6 KI75-1-11-f1 core 3,4 39,49 0,01 0,06 0,06 47,02 0,27 0,19 11,21 0,34 98,64 1,76 0,24 89,3 KI75-1-11-f2 rim 3,4 37,32 0,02 0,01 0,01 36,79 0,26 0,29 24,80 0,20 99,80 1,45 0,55 74,6 KI75-1-11-g1 core 3,4 39,43 0,01 0,00 0,13 46,85 0,28 0,23 12,59 0,38 99,90 1,74 0,26 88,0 KI75-1-11-g2 rim 3,4 37,57 0,04 0,00 0,00 37,56 0,28 0,22 23,55 0,26 99,52 1,48 0,52 75,9 KI75-1-11-h1 core 3,4 39,86 0,01 0,05 0,04 46,77 0,29 0,17 12,13 0,37 99,71 1,74 0,25 88,4 KI75-1-11-h2 rim 3,4 37,96 0,02 0,01 0,00 38,78 0,24 0,25 22,15 0,24 99,67 1,51 0,48 77,6 KI75-1-11-j1 core 3,4 39,36 0,01 0,01 0,11 45,12 0,26 0,21 14,29 0,37 99,79 1,69 0,30 86,2 KI75-1-11-j2 rim 3,4 37,37 0,01 0,04 0,06 38,04 0,25 0,24 23,10 0,28 99,43 1,50 0,51 76,5 KI75-1-11-x1 core 3,4 39,31 0,00 0,15 0,10 45,12 0,27 0,22 14,28 0,31 99,80 1,69 0,30 86,2 KI75-1-11-x2 rim 3,4 37,52 0,02 0,00 0,03 37,44 0,23 0,28 23,84 0,26 99,75 1,47 0,53 75,7 KI75-1-11-l1 core 3,4 39,54 0,01 0,09 0,11 45,07 0,26 0,20 13,73 0,33 99,42 1,69 0,29 86,7 KI75-1-11-l2 rim 3,4 37,61 0,00 0,03 0,03 36,82 0,25 0,35 23,47 0,25 98,86 1,46 0,52 75,7 KI75-1-11-n1 core 3,4 39,61 0,01 0,02 0,09 45,94 0,28 0,17 12,89 0,33 99,36 1,72 0,27 87,6 KI75-1-11-n2 rim 3,4 37,10 0,01 0,10 0,01 36,69 0,23 0,29 23,92 0,19 98,57 1,46 0,53 75,2 KI75-1-11-o1 core 3,4 39,59 0,00 0,23 0,02 45,62 0,29 0,11 12,99 0,38 99,22 1,71 0,27 87,4 KI75-1-11-o2 rim 3,4 37,12 0,01 0,00 0,03 38,48 0,23 0,28 22,31 0,18 98,66 1,52 0,49 77,4 KI75-1-25-a1 core 7,6 X 39,83 0,01 0,05 0,14 47,28 0,19 0,14 11,16 0,39 99,21 1,76 0,23 89,3 KI75-1-25-a2 rim 7,6 X 39,96 0,00 0,04 0,04 47,42 0,25 0,12 11,68 0,37 99,91 1,75 0,24 89,0 KI75-1-25-c1 core 7,6 X 39,57 0,00 0,03 0,10 46,49 0,23 0,09 12,48 0,42 99,42 1,74 0,26 88,1 KI75-1-25-c2 rim 7,6 X 38,08 0,01 0,04 0,03 39,52 0,24 0,30 20,51 0,26 99,06 1,54 0,45 79,2 KI75-1-25-j1 core 7,6 X 39,51 0,01 0,03 0,17 44,96 0,23 0,21 14,42 0,33 99,86 1,69 0,30 86,1 KI75-1-25-j2 rim 7,6 X 37,22 0,03 0,03 0,00 36,00 0,16 0,34 25,74 0,28 99,84 1,43 0,57 73,5 KI75-1-25-b1 core 7,6 38,80 0,00 0,03 0,07 44,04 0,28 0,10 15,26 0,33 98,99 1,67 0,33 85,1 KI75-1-25-b2 rim 7,6 37,89 0,00 0,02 0,01 38,16 0,24 0,41 22,62 0,27 99,62 1,49 0,50 77,0 KI75-1-25-d1 core 7,6 39,05 0,00 0,03 0,00 43,34 0,21 0,24 15,88 0,31 99,12 1,65 0,34 84,4 KI75-1-25-d2 rim 7,6 37,48 0,02 0,02 0,02 37,46 0,19 0,17 22,82 0,30 98,56 1,48 0,51 76,5 KI75-1-25-e1 core 7,6 40,05 0,00 0,09 0,12 47,03 0,35 0,13 11,13 0,43 99,33 1,75 0,23 89,3 KI75-1-25-e2 rim 7,6 38,25 0,03 0,03 0,03 39,89 0,24 0,33 19,78 0,29 98,88 1,55 0,43 80,0 KI75-1-25-f1 core 7,6 38,67 0,01 0,05 0,12 41,51 0,26 0,26 18,79 0,30 99,95 1,59 0,40 81,4 KI75-1-25-f2 rim 7,6 38,14 0,02 0,01 0,04 39,29 0,21 0,34 21,25 0,27 99,62 1,53 0,46 78,6 KI75-1-25-g1 core 7,6 37,99 0,00 0,01 0,00 40,99 0,24 0,19 19,73 0,35 99,50 1,58 0,43 80,4 KI75-1-25-g2 rim 7,6 38,62 0,01 0,03 0,04 39,40 0,21 0,19 20,35 0,35 99,27 1,53 0,44 79,3 KI75-1-25-h1 core 7,6 39,31 0,00 0,03 0,09 44,37 0,26 0,26 14,01 0,34 98,68 1,68 0,30 86,2
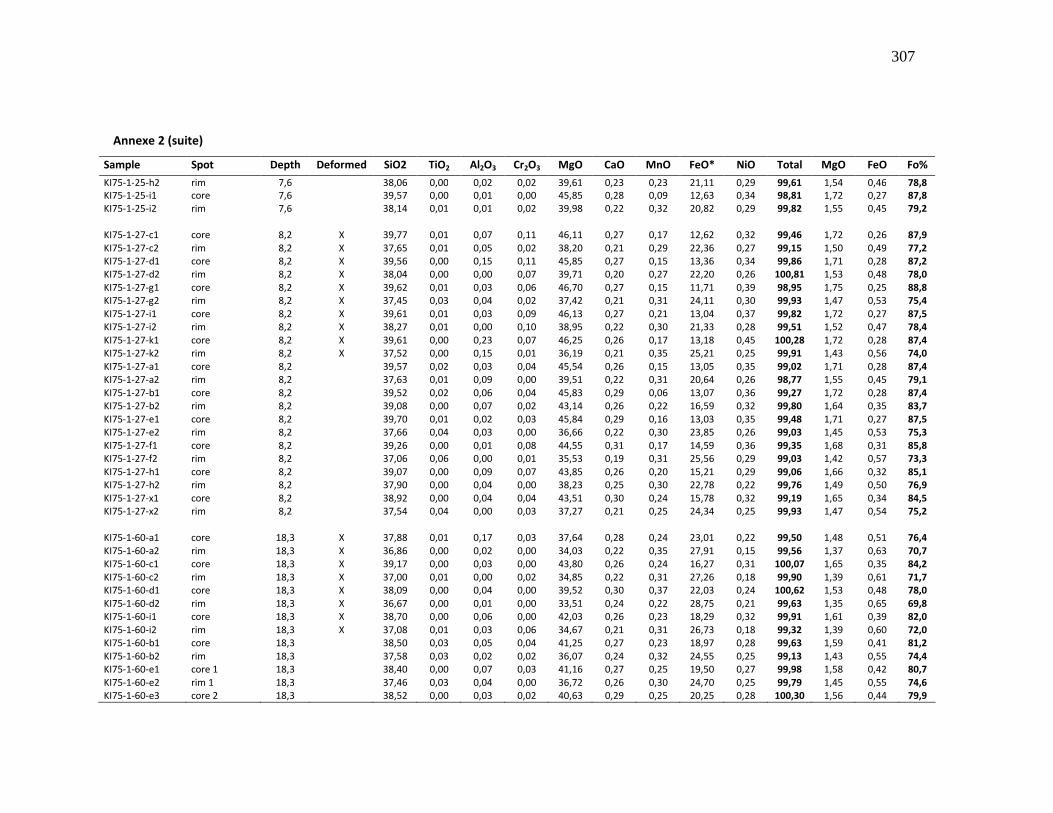
307
Annexe 2 (suite)
Sample Spot Depth Deformed SiO2 TiO2 Al2O3 Cr2O3 MgO CaO MnO FeO* NiO Total MgO FeO Fo%
KI75-1-25-h2 rim 7,6 38,06 0,00 0,02 0,02 39,61 0,23 0,23 21,11 0,29 99,61 1,54 0,46 78,8 KI75-1-25-i1 core 7,6 39,57 0,00 0,01 0,00 45,85 0,28 0,09 12,63 0,34 98,81 1,72 0,27 87,8 KI75-1-25-i2 rim 7,6 38,14 0,01 0,01 0,02 39,98 0,22 0,32 20,82 0,29 99,82 1,55 0,45 79,2 KI75-1-27-c1 core 8,2 X 39,77 0,01 0,07 0,11 46,11 0,27 0,17 12,62 0,32 99,46 1,72 0,26 87,9 KI75-1-27-c2 rim 8,2 X 37,65 0,01 0,05 0,02 38,20 0,21 0,29 22,36 0,27 99,15 1,50 0,49 77,2 KI75-1-27-d1 core 8,2 X 39,56 0,00 0,15 0,11 45,85 0,27 0,15 13,36 0,34 99,86 1,71 0,28 87,2 KI75-1-27-d2 rim 8,2 X 38,04 0,00 0,00 0,07 39,71 0,20 0,27 22,20 0,26 100,81 1,53 0,48 78,0 KI75-1-27-g1 core 8,2 X 39,62 0,01 0,03 0,06 46,70 0,27 0,15 11,71 0,39 98,95 1,75 0,25 88,8 KI75-1-27-g2 rim 8,2 X 37,45 0,03 0,04 0,02 37,42 0,21 0,31 24,11 0,30 99,93 1,47 0,53 75,4 KI75-1-27-i1 core 8,2 X 39,61 0,01 0,03 0,09 46,13 0,27 0,21 13,04 0,37 99,82 1,72 0,27 87,5 KI75-1-27-i2 rim 8,2 X 38,27 0,01 0,00 0,10 38,95 0,22 0,30 21,33 0,28 99,51 1,52 0,47 78,4 KI75-1-27-k1 core 8,2 X 39,61 0,00 0,23 0,07 46,25 0,26 0,17 13,18 0,45 100,28 1,72 0,28 87,4 KI75-1-27-k2 rim 8,2 X 37,52 0,00 0,15 0,01 36,19 0,21 0,35 25,21 0,25 99,91 1,43 0,56 74,0 KI75-1-27-a1 core 8,2 39,57 0,02 0,03 0,04 45,54 0,26 0,15 13,05 0,35 99,02 1,71 0,28 87,4 KI75-1-27-a2 rim 8,2 37,63 0,01 0,09 0,00 39,51 0,22 0,31 20,64 0,26 98,77 1,55 0,45 79,1 KI75-1-27-b1 core 8,2 39,52 0,02 0,06 0,04 45,83 0,29 0,06 13,07 0,36 99,27 1,72 0,28 87,4 KI75-1-27-b2 rim 8,2 39,08 0,00 0,07 0,02 43,14 0,26 0,22 16,59 0,32 99,80 1,64 0,35 83,7 KI75-1-27-e1 core 8,2 39,70 0,01 0,02 0,03 45,84 0,29 0,16 13,03 0,35 99,48 1,71 0,27 87,5 KI75-1-27-e2 rim 8,2 37,66 0,04 0,03 0,00 36,66 0,22 0,30 23,85 0,26 99,03 1,45 0,53 75,3 KI75-1-27-f1 core 8,2 39,26 0,00 0,01 0,08 44,55 0,31 0,17 14,59 0,36 99,35 1,68 0,31 85,8 KI75-1-27-f2 rim 8,2 37,06 0,06 0,00 0,01 35,53 0,19 0,31 25,56 0,29 99,03 1,42 0,57 73,3 KI75-1-27-h1 core 8,2 39,07 0,00 0,09 0,07 43,85 0,26 0,20 15,21 0,29 99,06 1,66 0,32 85,1 KI75-1-27-h2 rim 8,2 37,90 0,00 0,04 0,00 38,23 0,25 0,30 22,78 0,22 99,76 1,49 0,50 76,9 KI75-1-27-x1 core 8,2 38,92 0,00 0,04 0,04 43,51 0,30 0,24 15,78 0,32 99,19 1,65 0,34 84,5 KI75-1-27-x2 rim 8,2 37,54 0,04 0,00 0,03 37,27 0,21 0,25 24,34 0,25 99,93 1,47 0,54 75,2 KI75-1-60-a1 core 18,3 X 37,88 0,01 0,17 0,03 37,64 0,28 0,24 23,01 0,22 99,50 1,48 0,51 76,4 KI75-1-60-a2 rim 18,3 X 36,86 0,00 0,02 0,00 34,03 0,22 0,35 27,91 0,15 99,56 1,37 0,63 70,7 KI75-1-60-c1 core 18,3 X 39,17 0,00 0,03 0,00 43,80 0,26 0,24 16,27 0,31 100,07 1,65 0,35 84,2 KI75-1-60-c2 rim 18,3 X 37,00 0,01 0,00 0,02 34,85 0,22 0,31 27,26 0,18 99,90 1,39 0,61 71,7 KI75-1-60-d1 core 18,3 X 38,09 0,00 0,04 0,00 39,52 0,30 0,37 22,03 0,24 100,62 1,53 0,48 78,0 KI75-1-60-d2 rim 18,3 X 36,67 0,00 0,01 0,00 33,51 0,24 0,22 28,75 0,21 99,63 1,35 0,65 69,8 KI75-1-60-i1 core 18,3 X 38,70 0,00 0,06 0,00 42,03 0,26 0,23 18,29 0,32 99,91 1,61 0,39 82,0 KI75-1-60-i2 rim 18,3 X 37,08 0,01 0,03 0,06 34,67 0,21 0,31 26,73 0,18 99,32 1,39 0,60 72,0 KI75-1-60-b1 core 18,3 38,50 0,03 0,05 0,04 41,25 0,27 0,23 18,97 0,28 99,63 1,59 0,41 81,2 KI75-1-60-b2 rim 18,3 37,58 0,03 0,02 0,02 36,07 0,24 0,32 24,55 0,25 99,13 1,43 0,55 74,4 KI75-1-60-e1 core 1 18,3 38,40 0,00 0,07 0,03 41,16 0,27 0,25 19,50 0,27 99,98 1,58 0,42 80,7 KI75-1-60-e2 rim 1 18,3 37,46 0,03 0,04 0,00 36,72 0,26 0,30 24,70 0,25 99,79 1,45 0,55 74,6 KI75-1-60-e3 core 2 18,3 38,52 0,00 0,03 0,02 40,63 0,29 0,25 20,25 0,28 100,30 1,56 0,44 79,9
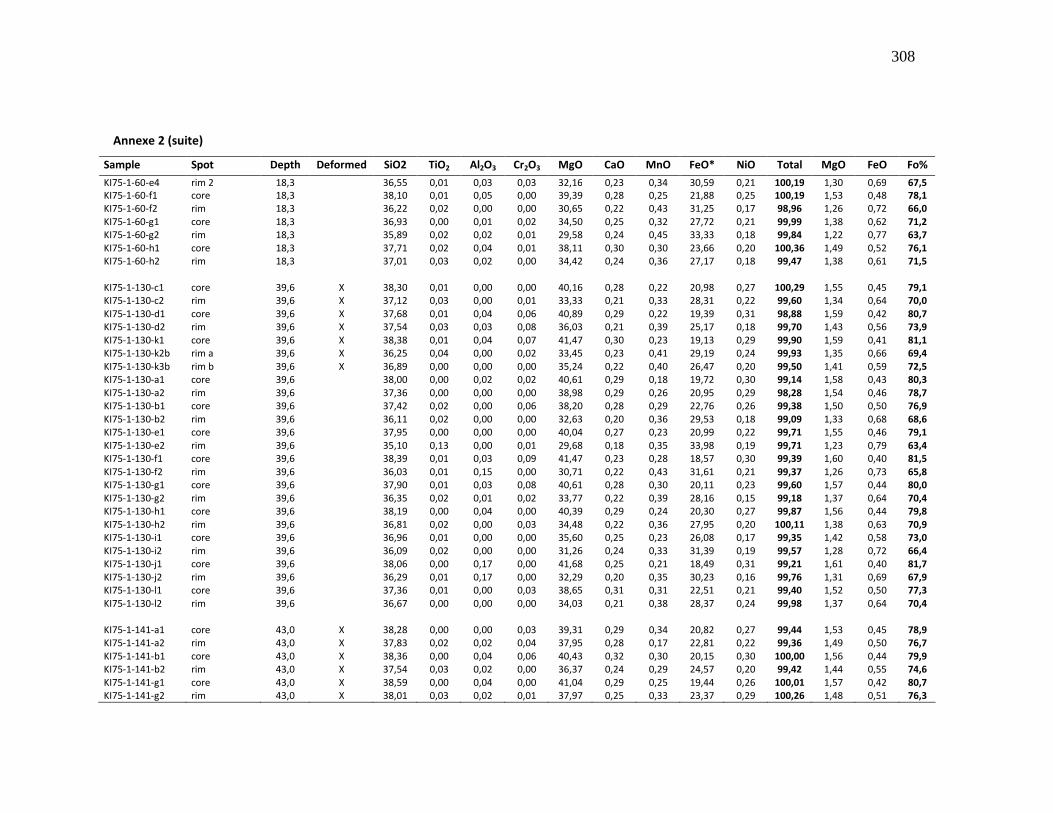
308
Annexe 2 (suite)
Sample Spot Depth Deformed SiO2 TiO2 Al2O3 Cr2O3 MgO CaO MnO FeO* NiO Total MgO FeO Fo%
KI75-1-60-e4 rim 2 18,3 36,55 0,01 0,03 0,03 32,16 0,23 0,34 30,59 0,21 100,19 1,30 0,69 67,5 KI75-1-60-f1 core 18,3 38,10 0,01 0,05 0,00 39,39 0,28 0,25 21,88 0,25 100,19 1,53 0,48 78,1 KI75-1-60-f2 rim 18,3 36,22 0,02 0,00 0,00 30,65 0,22 0,43 31,25 0,17 98,96 1,26 0,72 66,0 KI75-1-60-g1 core 18,3 36,93 0,00 0,01 0,02 34,50 0,25 0,32 27,72 0,21 99,99 1,38 0,62 71,2 KI75-1-60-g2 rim 18,3 35,89 0,02 0,02 0,01 29,58 0,24 0,45 33,33 0,18 99,84 1,22 0,77 63,7 KI75-1-60-h1 core 18,3 37,71 0,02 0,04 0,01 38,11 0,30 0,30 23,66 0,20 100,36 1,49 0,52 76,1 KI75-1-60-h2 rim 18,3 37,01 0,03 0,02 0,00 34,42 0,24 0,36 27,17 0,18 99,47 1,38 0,61 71,5 KI75-1-130-c1 core 39,6 X 38,30 0,01 0,00 0,00 40,16 0,28 0,22 20,98 0,27 100,29 1,55 0,45 79,1 KI75-1-130-c2 rim 39,6 X 37,12 0,03 0,00 0,01 33,33 0,21 0,33 28,31 0,22 99,60 1,34 0,64 70,0 KI75-1-130-d1 core 39,6 X 37,68 0,01 0,04 0,06 40,89 0,29 0,22 19,39 0,31 98,88 1,59 0,42 80,7 KI75-1-130-d2 rim 39,6 X 37,54 0,03 0,03 0,08 36,03 0,21 0,39 25,17 0,18 99,70 1,43 0,56 73,9 KI75-1-130-k1 core 39,6 X 38,38 0,01 0,04 0,07 41,47 0,30 0,23 19,13 0,29 99,90 1,59 0,41 81,1 KI75-1-130-k2b rim a 39,6 X 36,25 0,04 0,00 0,02 33,45 0,23 0,41 29,19 0,24 99,93 1,35 0,66 69,4 KI75-1-130-k3b rim b 39,6 X 36,89 0,00 0,00 0,00 35,24 0,22 0,40 26,47 0,20 99,50 1,41 0,59 72,5 KI75-1-130-a1 core 39,6 38,00 0,00 0,02 0,02 40,61 0,29 0,18 19,72 0,30 99,14 1,58 0,43 80,3 KI75-1-130-a2 rim 39,6 37,36 0,00 0,00 0,00 38,98 0,29 0,26 20,95 0,29 98,28 1,54 0,46 78,7 KI75-1-130-b1 core 39,6 37,42 0,02 0,00 0,06 38,20 0,28 0,29 22,76 0,26 99,38 1,50 0,50 76,9 KI75-1-130-b2 rim 39,6 36,11 0,02 0,00 0,00 32,63 0,20 0,36 29,53 0,18 99,09 1,33 0,68 68,6 KI75-1-130-e1 core 39,6 37,95 0,00 0,00 0,00 40,04 0,27 0,23 20,99 0,22 99,71 1,55 0,46 79,1 KI75-1-130-e2 rim 39,6 35,10 0,13 0,00 0,01 29,68 0,18 0,35 33,98 0,19 99,71 1,23 0,79 63,4 KI75-1-130-f1 core 39,6 38,39 0,01 0,03 0,09 41,47 0,23 0,28 18,57 0,30 99,39 1,60 0,40 81,5 KI75-1-130-f2 rim 39,6 36,03 0,01 0,15 0,00 30,71 0,22 0,43 31,61 0,21 99,37 1,26 0,73 65,8 KI75-1-130-g1 core 39,6 37,90 0,01 0,03 0,08 40,61 0,28 0,30 20,11 0,23 99,60 1,57 0,44 80,0 KI75-1-130-g2 rim 39,6 36,35 0,02 0,01 0,02 33,77 0,22 0,39 28,16 0,15 99,18 1,37 0,64 70,4 KI75-1-130-h1 core 39,6 38,19 0,00 0,04 0,00 40,39 0,29 0,24 20,30 0,27 99,87 1,56 0,44 79,8 KI75-1-130-h2 rim 39,6 36,81 0,02 0,00 0,03 34,48 0,22 0,36 27,95 0,20 100,11 1,38 0,63 70,9 KI75-1-130-i1 core 39,6 36,96 0,01 0,00 0,00 35,60 0,25 0,23 26,08 0,17 99,35 1,42 0,58 73,0 KI75-1-130-i2 rim 39,6 36,09 0,02 0,00 0,00 31,26 0,24 0,33 31,39 0,19 99,57 1,28 0,72 66,4 KI75-1-130-j1 core 39,6 38,06 0,00 0,17 0,00 41,68 0,25 0,21 18,49 0,31 99,21 1,61 0,40 81,7 KI75-1-130-j2 rim 39,6 36,29 0,01 0,17 0,00 32,29 0,20 0,35 30,23 0,16 99,76 1,31 0,69 67,9 KI75-1-130-l1 core 39,6 37,36 0,01 0,00 0,03 38,65 0,31 0,31 22,51 0,21 99,40 1,52 0,50 77,3 KI75-1-130-l2 rim 39,6 36,67 0,00 0,00 0,00 34,03 0,21 0,38 28,37 0,24 99,98 1,37 0,64 70,4 KI75-1-141-a1 core 43,0 X 38,28 0,00 0,00 0,03 39,31 0,29 0,34 20,82 0,27 99,44 1,53 0,45 78,9 KI75-1-141-a2 rim 43,0 X 37,83 0,02 0,02 0,04 37,95 0,28 0,17 22,81 0,22 99,36 1,49 0,50 76,7 KI75-1-141-b1 core 43,0 X 38,36 0,00 0,04 0,06 40,43 0,32 0,30 20,15 0,30 100,00 1,56 0,44 79,9 KI75-1-141-b2 rim 43,0 X 37,54 0,03 0,02 0,00 36,37 0,24 0,29 24,57 0,20 99,42 1,44 0,55 74,6 KI75-1-141-g1 core 43,0 X 38,59 0,00 0,04 0,00 41,04 0,29 0,25 19,44 0,26 100,01 1,57 0,42 80,7 KI75-1-141-g2 rim 43,0 X 38,01 0,03 0,02 0,01 37,97 0,25 0,33 23,37 0,29 100,26 1,48 0,51 76,3
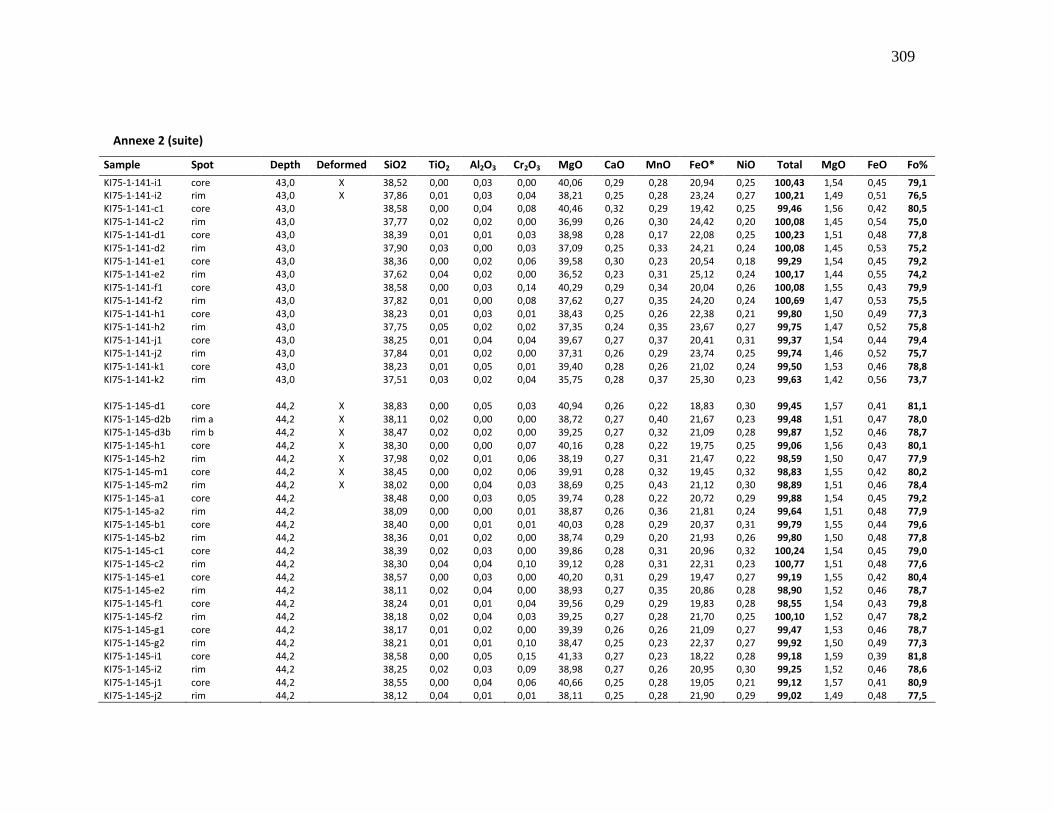
309
Annexe 2 (suite)
Sample Spot Depth Deformed SiO2 TiO2 Al2O3 Cr2O3 MgO CaO MnO FeO* NiO Total MgO FeO Fo%
KI75-1-141-i1 core 43,0 X 38,52 0,00 0,03 0,00 40,06 0,29 0,28 20,94 0,25 100,43 1,54 0,45 79,1 KI75-1-141-i2 rim 43,0 X 37,86 0,01 0,03 0,04 38,21 0,25 0,28 23,24 0,27 100,21 1,49 0,51 76,5 KI75-1-141-c1 core 43,0 38,58 0,00 0,04 0,08 40,46 0,32 0,29 19,42 0,25 99,46 1,56 0,42 80,5 KI75-1-141-c2 rim 43,0 37,77 0,02 0,02 0,00 36,99 0,26 0,30 24,42 0,20 100,08 1,45 0,54 75,0 KI75-1-141-d1 core 43,0 38,39 0,01 0,01 0,03 38,98 0,28 0,17 22,08 0,25 100,23 1,51 0,48 77,8 KI75-1-141-d2 rim 43,0 37,90 0,03 0,00 0,03 37,09 0,25 0,33 24,21 0,24 100,08 1,45 0,53 75,2 KI75-1-141-e1 core 43,0 38,36 0,00 0,02 0,06 39,58 0,30 0,23 20,54 0,18 99,29 1,54 0,45 79,2 KI75-1-141-e2 rim 43,0 37,62 0,04 0,02 0,00 36,52 0,23 0,31 25,12 0,24 100,17 1,44 0,55 74,2 KI75-1-141-f1 core 43,0 38,58 0,00 0,03 0,14 40,29 0,29 0,34 20,04 0,26 100,08 1,55 0,43 79,9 KI75-1-141-f2 rim 43,0 37,82 0,01 0,00 0,08 37,62 0,27 0,35 24,20 0,24 100,69 1,47 0,53 75,5 KI75-1-141-h1 core 43,0 38,23 0,01 0,03 0,01 38,43 0,25 0,26 22,38 0,21 99,80 1,50 0,49 77,3 KI75-1-141-h2 rim 43,0 37,75 0,05 0,02 0,02 37,35 0,24 0,35 23,67 0,27 99,75 1,47 0,52 75,8 KI75-1-141-j1 core 43,0 38,25 0,01 0,04 0,04 39,67 0,27 0,37 20,41 0,31 99,37 1,54 0,44 79,4 KI75-1-141-j2 rim 43,0 37,84 0,01 0,02 0,00 37,31 0,26 0,29 23,74 0,25 99,74 1,46 0,52 75,7 KI75-1-141-k1 core 43,0 38,23 0,01 0,05 0,01 39,40 0,28 0,26 21,02 0,24 99,50 1,53 0,46 78,8 KI75-1-141-k2 rim 43,0 37,51 0,03 0,02 0,04 35,75 0,28 0,37 25,30 0,23 99,63 1,42 0,56 73,7 KI75-1-145-d1 core 44,2 X 38,83 0,00 0,05 0,03 40,94 0,26 0,22 18,83 0,30 99,45 1,57 0,41 81,1 KI75-1-145-d2b rim a 44,2 X 38,11 0,02 0,00 0,00 38,72 0,27 0,40 21,67 0,23 99,48 1,51 0,47 78,0 KI75-1-145-d3b rim b 44,2 X 38,47 0,02 0,02 0,00 39,25 0,27 0,32 21,09 0,28 99,87 1,52 0,46 78,7 KI75-1-145-h1 core 44,2 X 38,30 0,00 0,00 0,07 40,16 0,28 0,22 19,75 0,25 99,06 1,56 0,43 80,1 KI75-1-145-h2 rim 44,2 X 37,98 0,02 0,01 0,06 38,19 0,27 0,31 21,47 0,22 98,59 1,50 0,47 77,9 KI75-1-145-m1 core 44,2 X 38,45 0,00 0,02 0,06 39,91 0,28 0,32 19,45 0,32 98,83 1,55 0,42 80,2 KI75-1-145-m2 rim 44,2 X 38,02 0,00 0,04 0,03 38,69 0,25 0,43 21,12 0,30 98,89 1,51 0,46 78,4 KI75-1-145-a1 core 44,2 38,48 0,00 0,03 0,05 39,74 0,28 0,22 20,72 0,29 99,88 1,54 0,45 79,2 KI75-1-145-a2 rim 44,2 38,09 0,00 0,00 0,01 38,87 0,26 0,36 21,81 0,24 99,64 1,51 0,48 77,9 KI75-1-145-b1 core 44,2 38,40 0,00 0,01 0,01 40,03 0,28 0,29 20,37 0,31 99,79 1,55 0,44 79,6 KI75-1-145-b2 rim 44,2 38,36 0,01 0,02 0,00 38,74 0,29 0,20 21,93 0,26 99,80 1,50 0,48 77,8 KI75-1-145-c1 core 44,2 38,39 0,02 0,03 0,00 39,86 0,28 0,31 20,96 0,32 100,24 1,54 0,45 79,0 KI75-1-145-c2 rim 44,2 38,30 0,04 0,04 0,10 39,12 0,28 0,31 22,31 0,23 100,77 1,51 0,48 77,6 KI75-1-145-e1 core 44,2 38,57 0,00 0,03 0,00 40,20 0,31 0,29 19,47 0,27 99,19 1,55 0,42 80,4 KI75-1-145-e2 rim 44,2 38,11 0,02 0,04 0,00 38,93 0,27 0,35 20,86 0,28 98,90 1,52 0,46 78,7 KI75-1-145-f1 core 44,2 38,24 0,01 0,01 0,04 39,56 0,29 0,29 19,83 0,28 98,55 1,54 0,43 79,8 KI75-1-145-f2 rim 44,2 38,18 0,02 0,04 0,03 39,25 0,27 0,28 21,70 0,25 100,10 1,52 0,47 78,2 KI75-1-145-g1 core 44,2 38,17 0,01 0,02 0,00 39,39 0,26 0,26 21,09 0,27 99,47 1,53 0,46 78,7 KI75-1-145-g2 rim 44,2 38,21 0,01 0,01 0,10 38,47 0,25 0,23 22,37 0,27 99,92 1,50 0,49 77,3 KI75-1-145-i1 core 44,2 38,58 0,00 0,05 0,15 41,33 0,27 0,23 18,22 0,28 99,18 1,59 0,39 81,8 KI75-1-145-i2 rim 44,2 38,25 0,02 0,03 0,09 38,98 0,27 0,26 20,95 0,30 99,25 1,52 0,46 78,6 KI75-1-145-j1 core 44,2 38,55 0,00 0,04 0,06 40,66 0,25 0,28 19,05 0,21 99,12 1,57 0,41 80,9 KI75-1-145-j2 rim 44,2 38,12 0,04 0,01 0,01 38,11 0,25 0,28 21,90 0,29 99,02 1,49 0,48 77,5
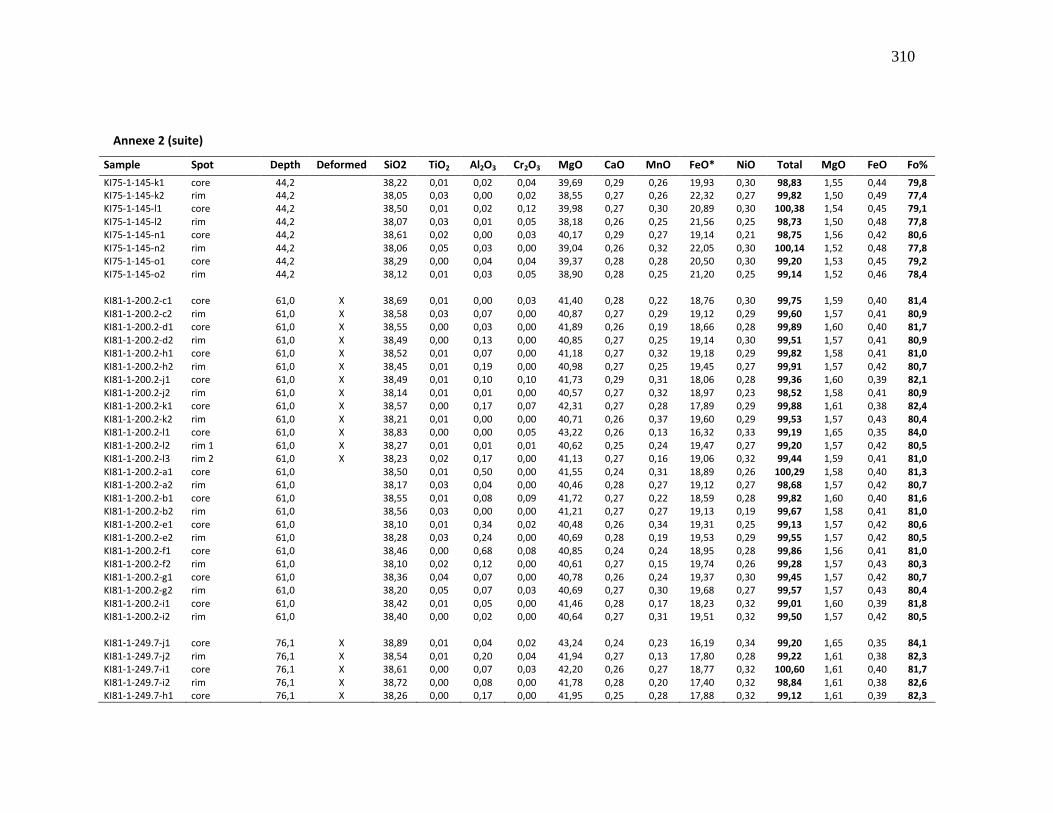
310
Annexe 2 (suite)
Sample Spot Depth Deformed SiO2 TiO2 Al2O3 Cr2O3 MgO CaO MnO FeO* NiO Total MgO FeO Fo%
KI75-1-145-k1 core 44,2 38,22 0,01 0,02 0,04 39,69 0,29 0,26 19,93 0,30 98,83 1,55 0,44 79,8 KI75-1-145-k2 rim 44,2 38,05 0,03 0,00 0,02 38,55 0,27 0,26 22,32 0,27 99,82 1,50 0,49 77,4 KI75-1-145-l1 core 44,2 38,50 0,01 0,02 0,12 39,98 0,27 0,30 20,89 0,30 100,38 1,54 0,45 79,1 KI75-1-145-l2 rim 44,2 38,07 0,03 0,01 0,05 38,18 0,26 0,25 21,56 0,25 98,73 1,50 0,48 77,8 KI75-1-145-n1 core 44,2 38,61 0,02 0,00 0,03 40,17 0,29 0,27 19,14 0,21 98,75 1,56 0,42 80,6 KI75-1-145-n2 rim 44,2 38,06 0,05 0,03 0,00 39,04 0,26 0,32 22,05 0,30 100,14 1,52 0,48 77,8 KI75-1-145-o1 core 44,2 38,29 0,00 0,04 0,04 39,37 0,28 0,28 20,50 0,30 99,20 1,53 0,45 79,2 KI75-1-145-o2 rim 44,2 38,12 0,01 0,03 0,05 38,90 0,28 0,25 21,20 0,25 99,14 1,52 0,46 78,4
KI81-1-200.2-c1 core 61,0 X 38,69 0,01 0,00 0,03 41,40 0,28 0,22 18,76 0,30 99,75 1,59 0,40 81,4 KI81-1-200.2-c2 rim 61,0 X 38,58 0,03 0,07 0,00 40,87 0,27 0,29 19,12 0,29 99,60 1,57 0,41 80,9 KI81-1-200.2-d1 core 61,0 X 38,55 0,00 0,03 0,00 41,89 0,26 0,19 18,66 0,28 99,89 1,60 0,40 81,7 KI81-1-200.2-d2 rim 61,0 X 38,49 0,00 0,13 0,00 40,85 0,27 0,25 19,14 0,30 99,51 1,57 0,41 80,9 KI81-1-200.2-h1 core 61,0 X 38,52 0,01 0,07 0,00 41,18 0,27 0,32 19,18 0,29 99,82 1,58 0,41 81,0 KI81-1-200.2-h2 rim 61,0 X 38,45 0,01 0,19 0,00 40,98 0,27 0,25 19,45 0,27 99,91 1,57 0,42 80,7 KI81-1-200.2-j1 core 61,0 X 38,49 0,01 0,10 0,10 41,73 0,29 0,31 18,06 0,28 99,36 1,60 0,39 82,1 KI81-1-200.2-j2 rim 61,0 X 38,14 0,01 0,01 0,00 40,57 0,27 0,32 18,97 0,23 98,52 1,58 0,41 80,9 KI81-1-200.2-k1 core 61,0 X 38,57 0,00 0,17 0,07 42,31 0,27 0,28 17,89 0,29 99,88 1,61 0,38 82,4 KI81-1-200.2-k2 rim 61,0 X 38,21 0,01 0,00 0,00 40,71 0,26 0,37 19,60 0,29 99,53 1,57 0,43 80,4 KI81-1-200.2-l1 core 61,0 X 38,83 0,00 0,00 0,05 43,22 0,26 0,13 16,32 0,33 99,19 1,65 0,35 84,0 KI81-1-200.2-l2 rim 1 61,0 X 38,27 0,01 0,01 0,01 40,62 0,25 0,24 19,47 0,27 99,20 1,57 0,42 80,5 KI81-1-200.2-l3 rim 2 61,0 X 38,23 0,02 0,17 0,00 41,13 0,27 0,16 19,06 0,32 99,44 1,59 0,41 81,0 KI81-1-200.2-a1 core 61,0 38,50 0,01 0,50 0,00 41,55 0,24 0,31 18,89 0,26 100,29 1,58 0,40 81,3 KI81-1-200.2-a2 rim 61,0 38,17 0,03 0,04 0,00 40,46 0,28 0,27 19,12 0,27 98,68 1,57 0,42 80,7 KI81-1-200.2-b1 core 61,0 38,55 0,01 0,08 0,09 41,72 0,27 0,22 18,59 0,28 99,82 1,60 0,40 81,6 KI81-1-200.2-b2 rim 61,0 38,56 0,03 0,00 0,00 41,21 0,27 0,27 19,13 0,19 99,67 1,58 0,41 81,0 KI81-1-200.2-e1 core 61,0 38,10 0,01 0,34 0,02 40,48 0,26 0,34 19,31 0,25 99,13 1,57 0,42 80,6 KI81-1-200.2-e2 rim 61,0 38,28 0,03 0,24 0,00 40,69 0,28 0,19 19,53 0,29 99,55 1,57 0,42 80,5 KI81-1-200.2-f1 core 61,0 38,46 0,00 0,68 0,08 40,85 0,24 0,24 18,95 0,28 99,86 1,56 0,41 81,0 KI81-1-200.2-f2 rim 61,0 38,10 0,02 0,12 0,00 40,61 0,27 0,15 19,74 0,26 99,28 1,57 0,43 80,3 KI81-1-200.2-g1 core 61,0 38,36 0,04 0,07 0,00 40,78 0,26 0,24 19,37 0,30 99,45 1,57 0,42 80,7 KI81-1-200.2-g2 rim 61,0 38,20 0,05 0,07 0,03 40,69 0,27 0,30 19,68 0,27 99,57 1,57 0,43 80,4 KI81-1-200.2-i1 core 61,0 38,42 0,01 0,05 0,00 41,46 0,28 0,17 18,23 0,32 99,01 1,60 0,39 81,8 KI81-1-200.2-i2 rim 61,0 38,40 0,00 0,02 0,00 40,64 0,27 0,31 19,51 0,32 99,50 1,57 0,42 80,5 KI81-1-249.7-j1 core 76,1 X 38,89 0,01 0,04 0,02 43,24 0,24 0,23 16,19 0,34 99,20 1,65 0,35 84,1 KI81-1-249.7-j2 rim 76,1 X 38,54 0,01 0,20 0,04 41,94 0,27 0,13 17,80 0,28 99,22 1,61 0,38 82,3 KI81-1-249.7-i1 core 76,1 X 38,61 0,00 0,07 0,03 42,20 0,26 0,27 18,77 0,32 100,60 1,61 0,40 81,7 KI81-1-249.7-i2 rim 76,1 X 38,72 0,00 0,08 0,00 41,78 0,28 0,20 17,40 0,32 98,84 1,61 0,38 82,6 KI81-1-249.7-h1 core 76,1 X 38,26 0,00 0,17 0,00 41,95 0,25 0,28 17,88 0,32 99,12 1,61 0,39 82,3
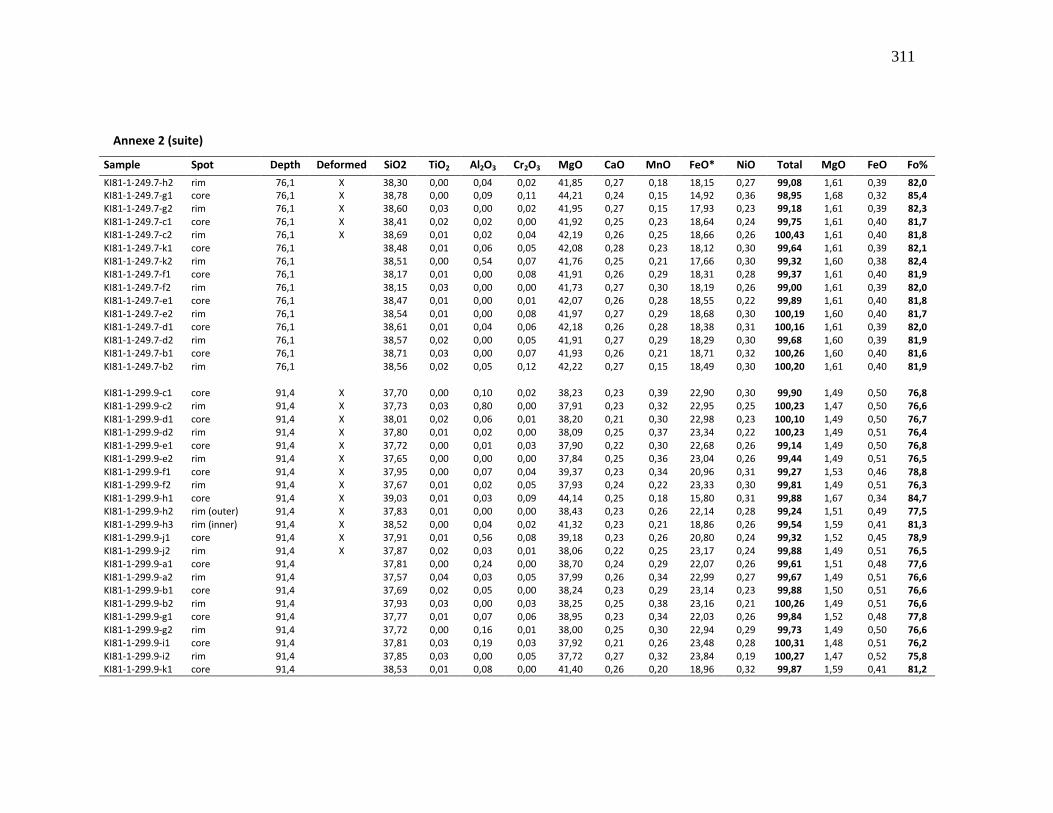
311
Annexe 2 (suite)
Sample Spot Depth Deformed SiO2 TiO2 Al2O3 Cr2O3 MgO CaO MnO FeO* NiO Total MgO FeO Fo%
KI81-1-249.7-h2 rim 76,1 X 38,30 0,00 0,04 0,02 41,85 0,27 0,18 18,15 0,27 99,08 1,61 0,39 82,0 KI81-1-249.7-g1 core 76,1 X 38,78 0,00 0,09 0,11 44,21 0,24 0,15 14,92 0,36 98,95 1,68 0,32 85,4 KI81-1-249.7-g2 rim 76,1 X 38,60 0,03 0,00 0,02 41,95 0,27 0,15 17,93 0,23 99,18 1,61 0,39 82,3 KI81-1-249.7-c1 core 76,1 X 38,41 0,02 0,02 0,00 41,92 0,25 0,23 18,64 0,24 99,75 1,61 0,40 81,7 KI81-1-249.7-c2 rim 76,1 X 38,69 0,01 0,02 0,04 42,19 0,26 0,25 18,66 0,26 100,43 1,61 0,40 81,8 KI81-1-249.7-k1 core 76,1 38,48 0,01 0,06 0,05 42,08 0,28 0,23 18,12 0,30 99,64 1,61 0,39 82,1 KI81-1-249.7-k2 rim 76,1 38,51 0,00 0,54 0,07 41,76 0,25 0,21 17,66 0,30 99,32 1,60 0,38 82,4 KI81-1-249.7-f1 core 76,1 38,17 0,01 0,00 0,08 41,91 0,26 0,29 18,31 0,28 99,37 1,61 0,40 81,9 KI81-1-249.7-f2 rim 76,1 38,15 0,03 0,00 0,00 41,73 0,27 0,30 18,19 0,26 99,00 1,61 0,39 82,0 KI81-1-249.7-e1 core 76,1 38,47 0,01 0,00 0,01 42,07 0,26 0,28 18,55 0,22 99,89 1,61 0,40 81,8 KI81-1-249.7-e2 rim 76,1 38,54 0,01 0,00 0,08 41,97 0,27 0,29 18,68 0,30 100,19 1,60 0,40 81,7 KI81-1-249.7-d1 core 76,1 38,61 0,01 0,04 0,06 42,18 0,26 0,28 18,38 0,31 100,16 1,61 0,39 82,0 KI81-1-249.7-d2 rim 76,1 38,57 0,02 0,00 0,05 41,91 0,27 0,29 18,29 0,30 99,68 1,60 0,39 81,9 KI81-1-249.7-b1 core 76,1 38,71 0,03 0,00 0,07 41,93 0,26 0,21 18,71 0,32 100,26 1,60 0,40 81,6 KI81-1-249.7-b2 rim 76,1 38,56 0,02 0,05 0,12 42,22 0,27 0,15 18,49 0,30 100,20 1,61 0,40 81,9 KI81-1-299.9-c1 core 91,4 X 37,70 0,00 0,10 0,02 38,23 0,23 0,39 22,90 0,30 99,90 1,49 0,50 76,8 KI81-1-299.9-c2 rim 91,4 X 37,73 0,03 0,80 0,00 37,91 0,23 0,32 22,95 0,25 100,23 1,47 0,50 76,6 KI81-1-299.9-d1 core 91,4 X 38,01 0,02 0,06 0,01 38,20 0,21 0,30 22,98 0,23 100,10 1,49 0,50 76,7 KI81-1-299.9-d2 rim 91,4 X 37,80 0,01 0,02 0,00 38,09 0,25 0,37 23,34 0,22 100,23 1,49 0,51 76,4 KI81-1-299.9-e1 core 91,4 X 37,72 0,00 0,01 0,03 37,90 0,22 0,30 22,68 0,26 99,14 1,49 0,50 76,8 KI81-1-299.9-e2 rim 91,4 X 37,65 0,00 0,00 0,00 37,84 0,25 0,36 23,04 0,26 99,44 1,49 0,51 76,5 KI81-1-299.9-f1 core 91,4 X 37,95 0,00 0,07 0,04 39,37 0,23 0,34 20,96 0,31 99,27 1,53 0,46 78,8 KI81-1-299.9-f2 rim 91,4 X 37,67 0,01 0,02 0,05 37,93 0,24 0,22 23,33 0,30 99,81 1,49 0,51 76,3 KI81-1-299.9-h1 core 91,4 X 39,03 0,01 0,03 0,09 44,14 0,25 0,18 15,80 0,31 99,88 1,67 0,34 84,7 KI81-1-299.9-h2 rim (outer) 91,4 X 37,83 0,01 0,00 0,00 38,43 0,23 0,26 22,14 0,28 99,24 1,51 0,49 77,5 KI81-1-299.9-h3 rim (inner) 91,4 X 38,52 0,00 0,04 0,02 41,32 0,23 0,21 18,86 0,26 99,54 1,59 0,41 81,3 KI81-1-299.9-j1 core 91,4 X 37,91 0,01 0,56 0,08 39,18 0,23 0,26 20,80 0,24 99,32 1,52 0,45 78,9 KI81-1-299.9-j2 rim 91,4 X 37,87 0,02 0,03 0,01 38,06 0,22 0,25 23,17 0,24 99,88 1,49 0,51 76,5 KI81-1-299.9-a1 core 91,4 37,81 0,00 0,24 0,00 38,70 0,24 0,29 22,07 0,26 99,61 1,51 0,48 77,6 KI81-1-299.9-a2 rim 91,4 37,57 0,04 0,03 0,05 37,99 0,26 0,34 22,99 0,27 99,67 1,49 0,51 76,6 KI81-1-299.9-b1 core 91,4 37,69 0,02 0,05 0,00 38,24 0,23 0,29 23,14 0,23 99,88 1,50 0,51 76,6 KI81-1-299.9-b2 rim 91,4 37,93 0,03 0,00 0,03 38,25 0,25 0,38 23,16 0,21 100,26 1,49 0,51 76,6 KI81-1-299.9-g1 core 91,4 37,77 0,01 0,07 0,06 38,95 0,23 0,34 22,03 0,26 99,84 1,52 0,48 77,8 KI81-1-299.9-g2 rim 91,4 37,72 0,00 0,16 0,01 38,00 0,25 0,30 22,94 0,29 99,73 1,49 0,50 76,6 KI81-1-299.9-i1 core 91,4 37,81 0,03 0,19 0,03 37,92 0,21 0,26 23,48 0,28 100,31 1,48 0,51 76,2 KI81-1-299.9-i2 rim 91,4 37,85 0,03 0,00 0,05 37,72 0,27 0,32 23,84 0,19 100,27 1,47 0,52 75,8 KI81-1-299.9-k1 core 91,4 38,53 0,01 0,08 0,00 41,40 0,26 0,20 18,96 0,32 99,87 1,59 0,41 81,2

312
Annexe 2 (suite)
Sample Spot Depth Deformed SiO2 TiO2 Al2O3 Cr2O3 MgO CaO MnO FeO* NiO Total MgO FeO Fo%
KI81-2-185.7-b1 core 56,6 X 38,58 0,01 0,05 0,00 40,77 0,29 0,16 20,01 0,30 100,22 1,56 0,43 80,2 KI81-2-185.7-b2 rim 56,6 X 37,58 0,03 0,05 0,05 37,77 0,22 0,32 23,96 0,27 100,28 1,48 0,53 75,7 KI81-2-185.7-c1 core 56,6 X 38,51 0,00 0,12 0,04 41,23 0,27 0,27 19,55 0,28 100,30 1,58 0,42 80,7 KI81-2-185.7-c2 rim 56,6 X 37,71 0,02 0,04 0,03 37,89 0,23 0,33 23,36 0,25 99,87 1,48 0,51 76,3 KI81-2-185.7-e1 core 56,6 X 38,20 0,00 0,10 0,07 38,82 0,25 0,45 22,26 0,19 100,40 1,50 0,48 77,5 KI81-2-185.7-e2 rim 56,6 X 37,80 0,02 0,04 0,00 37,45 0,25 0,31 24,09 0,21 100,23 1,47 0,53 75,5 KI81-2-185.7-f1 core 56,6 X 38,92 0,01 0,07 0,00 42,63 0,27 0,19 16,83 0,31 99,27 1,63 0,36 83,4 KI81-2-185.7-f2 rim 1 56,6 X 37,89 0,00 0,15 0,10 38,89 0,24 0,21 22,59 0,26 100,36 1,51 0,49 77,3 KI81-2-185.7-f3 rim 2 (outer) 56,6 X 37,61 0,02 0,03 0,03 37,72 0,23 0,29 24,03 0,26 100,21 1,48 0,53 75,6 KI81-2-185.7-f4 rim 2 (inner) 56,6 X 38,57 0,00 0,09 0,09 41,67 0,29 0,32 18,60 0,30 99,97 1,59 0,40 81,6 KI81-2-185.7-i1 core 56,6 X 39,09 0,00 0,11 0,00 43,17 0,23 0,16 16,32 0,34 99,46 1,64 0,35 84,0 KI81-2-185.7-i2 rim 56,6 X 38,09 0,02 0,39 0,00 39,57 0,21 0,27 21,00 0,31 99,86 1,53 0,46 78,9 KI81-2-185.7-j1 core 56,6 X 38,51 0,00 0,05 0,01 41,30 0,27 0,27 18,96 0,31 99,76 1,59 0,41 81,2 KI81-2-185.7-j2 rim 56,6 X 37,85 0,02 0,12 0,06 38,65 0,24 0,33 22,32 0,22 99,82 1,51 0,49 77,4 KI81-2-185.7-a1 core 56,6 38,29 0,00 0,13 0,12 41,08 0,29 0,27 19,87 0,30 100,37 1,57 0,43 80,4 KI81-2-185.7-a2 rim 56,6 38,22 0,00 0,03 0,00 39,47 0,24 0,23 21,27 0,28 99,77 1,53 0,46 78,6 KI81-2-185.7-d1 core 56,6 38,29 0,00 0,02 0,00 41,58 0,26 0,23 19,18 0,31 99,89 1,60 0,41 81,1 KI81-2-185.7-d2 rim 56,6 38,00 0,01 0,05 0,00 39,57 0,24 0,31 21,41 0,23 99,84 1,54 0,47 78,5 KI81-2-185.7-g1 core 56,6 37,88 0,02 0,62 0,00 40,07 0,24 0,38 20,24 0,30 99,79 1,55 0,44 79,7 KI81-2-185.7-g2 rim 56,6 37,97 0,02 0,01 0,00 39,35 0,22 0,26 21,62 0,29 99,74 1,53 0,47 78,3 KI81-2-185.7-h1 core 56,6 38,17 0,00 0,46 0,03 41,14 0,28 0,21 19,31 0,25 99,93 1,58 0,42 80,8 KI81-2-185.7-h2 rim 56,6 37,66 0,00 0,00 0,00 38,15 0,23 0,34 22,80 0,19 99,40 1,50 0,50 76,8 KI81-2-185.7-k1 core 56,6 37,94 0,01 0,02 0,00 40,19 0,27 0,24 20,97 0,30 99,99 1,56 0,46 79,2 KI81-2-185.7-k2 rim 56,6 37,72 0,02 0,01 0,10 38,44 0,23 0,37 23,19 0,23 100,38 1,50 0,51 76,6 KI88-2-197.7-c1 core 60,3 X 38,63 0,00 0,02 0,03 41,76 0,27 0,20 18,53 0,28 99,83 1,60 0,40 81,7 KI88-2-197.7-c2 rim 60,3 X 37,73 0,02 0,13 0,00 38,53 0,22 0,37 21,99 0,25 99,26 1,51 0,48 77,6 KI88-2-197.7-d1 core 60,3 X 38,79 0,00 0,02 0,09 42,10 0,26 0,26 17,83 0,30 99,72 1,61 0,38 82,4 KI88-2-197.7-d2 rim 60,3 X 37,74 0,02 0,01 0,00 37,77 0,18 0,28 23,29 0,25 99,56 1,48 0,51 76,2 KI88-2-197.7-e1 core 60,3 X 38,06 0,00 0,07 0,04 40,05 0,28 0,27 20,42 0,20 99,40 1,55 0,44 79,5 KI88-2-197.7-e2 rim 60,3 X 37,43 0,02 0,00 0,00 37,27 0,18 0,16 23,86 0,28 99,25 1,47 0,53 75,6 KI88-2-197.7-i1 core 60,3 X 38,69 0,00 0,20 0,04 41,18 0,26 0,25 18,78 0,31 99,74 1,58 0,40 81,3 KI88-2-197.7-i2 rim 60,3 X 37,63 0,00 1,47 0,01 37,51 0,20 0,28 22,80 0,29 100,23 1,46 0,50 76,5 KI88-2-197.7-j1 core 60,3 X 39,37 0,02 0,08 0,07 43,70 0,23 0,15 15,96 0,31 99,91 1,65 0,34 84,4 KI88-2-197.7-j2 rim 1 60,3 X 38,16 0,00 0,02 0,00 40,10 0,24 0,18 19,99 0,27 98,96 1,56 0,44 79,9 KI88-2-197.7-j3 rim 2 60,3 X 37,80 0,02 0,05 0,03 38,81 0,21 0,34 21,46 0,23 99,03 1,52 0,47 78,2 KI88-2-197.7-a1 core 60,3 38,16 0,01 0,07 0,02 39,55 0,26 0,26 20,58 0,27 99,18 1,54 0,45 79,2 KI88-2-197.7-a2 rim 60,3 37,62 0,00 0,00 0,02 38,04 0,20 0,38 23,32 0,23 99,83 1,49 0,51 76,3 KI88-2-197.7-b1 core 60,3 38,28 0,00 0,07 0,00 40,91 0,27 0,21 19,04 0,32 99,14 1,58 0,41 81,0 KI88-2-197.7-b2 rim 60,3 38,05 0,02 0,05 0,01 38,88 0,21 0,26 21,89 0,27 99,70 1,51 0,48 77,9
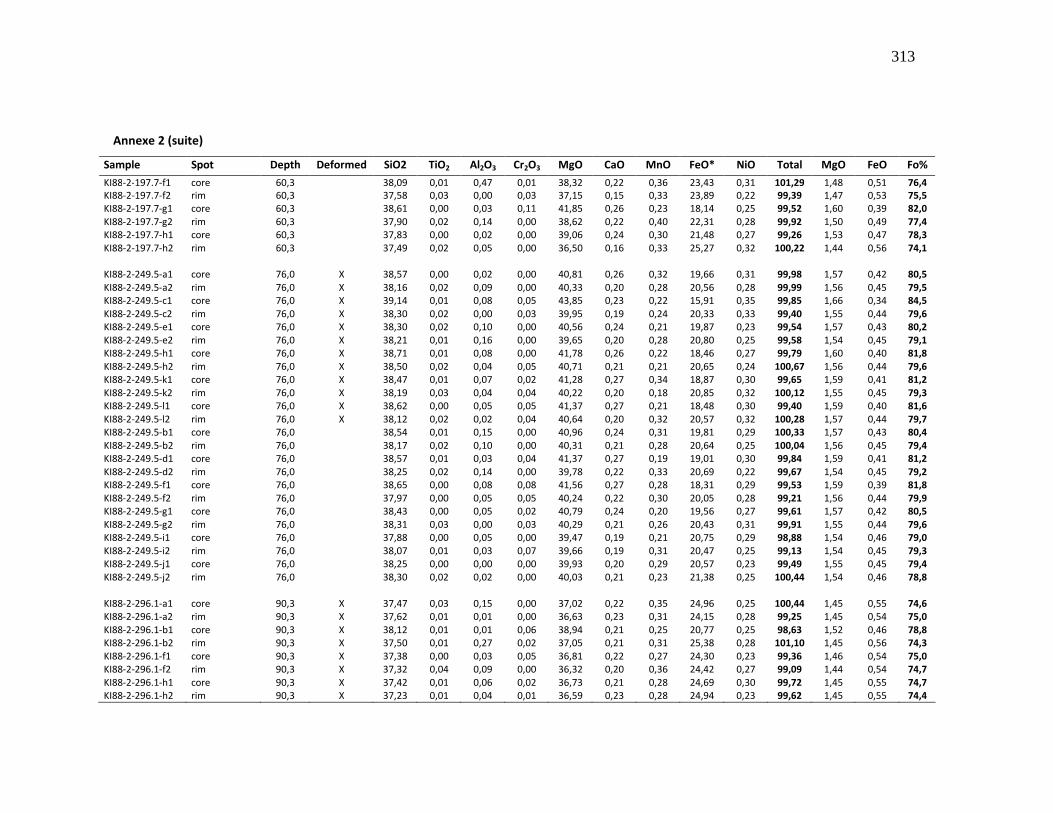
313
Annexe 2 (suite)
Sample Spot Depth Deformed SiO2 TiO2 Al2O3 Cr2O3 MgO CaO MnO FeO* NiO Total MgO FeO Fo%
KI88-2-197.7-f1 core 60,3 38,09 0,01 0,47 0,01 38,32 0,22 0,36 23,43 0,31 101,29 1,48 0,51 76,4 KI88-2-197.7-f2 rim 60,3 37,58 0,03 0,00 0,03 37,15 0,15 0,33 23,89 0,22 99,39 1,47 0,53 75,5 KI88-2-197.7-g1 core 60,3 38,61 0,00 0,03 0,11 41,85 0,26 0,23 18,14 0,25 99,52 1,60 0,39 82,0 KI88-2-197.7-g2 rim 60,3 37,90 0,02 0,14 0,00 38,62 0,22 0,40 22,31 0,28 99,92 1,50 0,49 77,4 KI88-2-197.7-h1 core 60,3 37,83 0,00 0,02 0,00 39,06 0,24 0,30 21,48 0,27 99,26 1,53 0,47 78,3 KI88-2-197.7-h2 rim 60,3 37,49 0,02 0,05 0,00 36,50 0,16 0,33 25,27 0,32 100,22 1,44 0,56 74,1 KI88-2-249.5-a1 core 76,0 X 38,57 0,00 0,02 0,00 40,81 0,26 0,32 19,66 0,31 99,98 1,57 0,42 80,5 KI88-2-249.5-a2 rim 76,0 X 38,16 0,02 0,09 0,00 40,33 0,20 0,28 20,56 0,28 99,99 1,56 0,45 79,5 KI88-2-249.5-c1 core 76,0 X 39,14 0,01 0,08 0,05 43,85 0,23 0,22 15,91 0,35 99,85 1,66 0,34 84,5 KI88-2-249.5-c2 rim 76,0 X 38,30 0,02 0,00 0,03 39,95 0,19 0,24 20,33 0,33 99,40 1,55 0,44 79,6 KI88-2-249.5-e1 core 76,0 X 38,30 0,02 0,10 0,00 40,56 0,24 0,21 19,87 0,23 99,54 1,57 0,43 80,2 KI88-2-249.5-e2 rim 76,0 X 38,21 0,01 0,16 0,00 39,65 0,20 0,28 20,80 0,25 99,58 1,54 0,45 79,1 KI88-2-249.5-h1 core 76,0 X 38,71 0,01 0,08 0,00 41,78 0,26 0,22 18,46 0,27 99,79 1,60 0,40 81,8 KI88-2-249.5-h2 rim 76,0 X 38,50 0,02 0,04 0,05 40,71 0,21 0,21 20,65 0,24 100,67 1,56 0,44 79,6 KI88-2-249.5-k1 core 76,0 X 38,47 0,01 0,07 0,02 41,28 0,27 0,34 18,87 0,30 99,65 1,59 0,41 81,2 KI88-2-249.5-k2 rim 76,0 X 38,19 0,03 0,04 0,04 40,22 0,20 0,18 20,85 0,32 100,12 1,55 0,45 79,3 KI88-2-249.5-l1 core 76,0 X 38,62 0,00 0,05 0,05 41,37 0,27 0,21 18,48 0,30 99,40 1,59 0,40 81,6 KI88-2-249.5-l2 rim 76,0 X 38,12 0,02 0,02 0,04 40,64 0,20 0,32 20,57 0,32 100,28 1,57 0,44 79,7 KI88-2-249.5-b1 core 76,0 38,54 0,01 0,15 0,00 40,96 0,24 0,31 19,81 0,29 100,33 1,57 0,43 80,4 KI88-2-249.5-b2 rim 76,0 38,17 0,02 0,10 0,00 40,31 0,21 0,28 20,64 0,25 100,04 1,56 0,45 79,4 KI88-2-249.5-d1 core 76,0 38,57 0,01 0,03 0,04 41,37 0,27 0,19 19,01 0,30 99,84 1,59 0,41 81,2 KI88-2-249.5-d2 rim 76,0 38,25 0,02 0,14 0,00 39,78 0,22 0,33 20,69 0,22 99,67 1,54 0,45 79,2 KI88-2-249.5-f1 core 76,0 38,65 0,00 0,08 0,08 41,56 0,27 0,28 18,31 0,29 99,53 1,59 0,39 81,8 KI88-2-249.5-f2 rim 76,0 37,97 0,00 0,05 0,05 40,24 0,22 0,30 20,05 0,28 99,21 1,56 0,44 79,9 KI88-2-249.5-g1 core 76,0 38,43 0,00 0,05 0,02 40,79 0,24 0,20 19,56 0,27 99,61 1,57 0,42 80,5 KI88-2-249.5-g2 rim 76,0 38,31 0,03 0,00 0,03 40,29 0,21 0,26 20,43 0,31 99,91 1,55 0,44 79,6 KI88-2-249.5-i1 core 76,0 37,88 0,00 0,05 0,00 39,47 0,19 0,21 20,75 0,29 98,88 1,54 0,46 79,0 KI88-2-249.5-i2 rim 76,0 38,07 0,01 0,03 0,07 39,66 0,19 0,31 20,47 0,25 99,13 1,54 0,45 79,3 KI88-2-249.5-j1 core 76,0 38,25 0,00 0,00 0,00 39,93 0,20 0,29 20,57 0,23 99,49 1,55 0,45 79,4 KI88-2-249.5-j2 rim 76,0 38,30 0,02 0,02 0,00 40,03 0,21 0,23 21,38 0,25 100,44 1,54 0,46 78,8 KI88-2-296.1-a1 core 90,3 X 37,47 0,03 0,15 0,00 37,02 0,22 0,35 24,96 0,25 100,44 1,45 0,55 74,6 KI88-2-296.1-a2 rim 90,3 X 37,62 0,01 0,01 0,00 36,63 0,23 0,31 24,15 0,28 99,25 1,45 0,54 75,0 KI88-2-296.1-b1 core 90,3 X 38,12 0,01 0,01 0,06 38,94 0,21 0,25 20,77 0,25 98,63 1,52 0,46 78,8 KI88-2-296.1-b2 rim 90,3 X 37,50 0,01 0,27 0,02 37,05 0,21 0,31 25,38 0,28 101,10 1,45 0,56 74,3 KI88-2-296.1-f1 core 90,3 X 37,38 0,00 0,03 0,05 36,81 0,22 0,27 24,30 0,23 99,36 1,46 0,54 75,0 KI88-2-296.1-f2 rim 90,3 X 37,32 0,04 0,09 0,00 36,32 0,20 0,36 24,42 0,27 99,09 1,44 0,54 74,7 KI88-2-296.1-h1 core 90,3 X 37,42 0,01 0,06 0,02 36,73 0,21 0,28 24,69 0,30 99,72 1,45 0,55 74,7 KI88-2-296.1-h2 rim 90,3 X 37,23 0,01 0,04 0,01 36,59 0,23 0,28 24,94 0,23 99,62 1,45 0,55 74,4
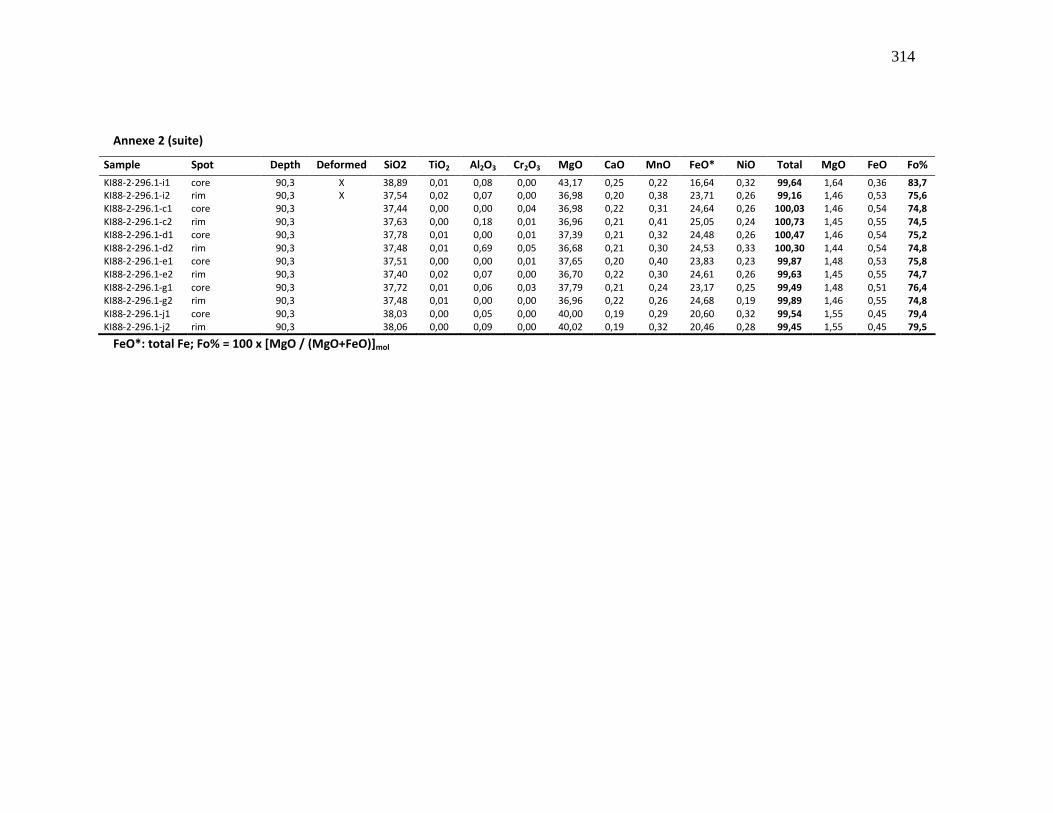
314
Annexe 2 (suite)
Sample Spot Depth Deformed SiO2 TiO2 Al2O3 Cr2O3 MgO CaO MnO FeO* NiO Total MgO FeO Fo%
KI88-2-296.1-i1 core 90,3 X 38,89 0,01 0,08 0,00 43,17 0,25 0,22 16,64 0,32 99,64 1,64 0,36 83,7 KI88-2-296.1-i2 rim 90,3 X 37,54 0,02 0,07 0,00 36,98 0,20 0,38 23,71 0,26 99,16 1,46 0,53 75,6 KI88-2-296.1-c1 core 90,3 37,44 0,00 0,00 0,04 36,98 0,22 0,31 24,64 0,26 100,03 1,46 0,54 74,8 KI88-2-296.1-c2 rim 90,3 37,63 0,00 0,18 0,01 36,96 0,21 0,41 25,05 0,24 100,73 1,45 0,55 74,5 KI88-2-296.1-d1 core 90,3 37,78 0,01 0,00 0,01 37,39 0,21 0,32 24,48 0,26 100,47 1,46 0,54 75,2 KI88-2-296.1-d2 rim 90,3 37,48 0,01 0,69 0,05 36,68 0,21 0,30 24,53 0,33 100,30 1,44 0,54 74,8 KI88-2-296.1-e1 core 90,3 37,51 0,00 0,00 0,01 37,65 0,20 0,40 23,83 0,23 99,87 1,48 0,53 75,8 KI88-2-296.1-e2 rim 90,3 37,40 0,02 0,07 0,00 36,70 0,22 0,30 24,61 0,26 99,63 1,45 0,55 74,7 KI88-2-296.1-g1 core 90,3 37,72 0,01 0,06 0,03 37,79 0,21 0,24 23,17 0,25 99,49 1,48 0,51 76,4 KI88-2-296.1-g2 rim 90,3 37,48 0,01 0,00 0,00 36,96 0,22 0,26 24,68 0,19 99,89 1,46 0,55 74,8 KI88-2-296.1-j1 core 90,3 38,03 0,00 0,05 0,00 40,00 0,19 0,29 20,60 0,32 99,54 1,55 0,45 79,4 KI88-2-296.1-j2 rim 90,3 38,06 0,00 0,09 0,00 40,02 0,19 0,32 20,46 0,28 99,45 1,55 0,45 79,5
FeO*: total Fe; Fo% = 100 x [MgO / (MgO+FeO)]mol
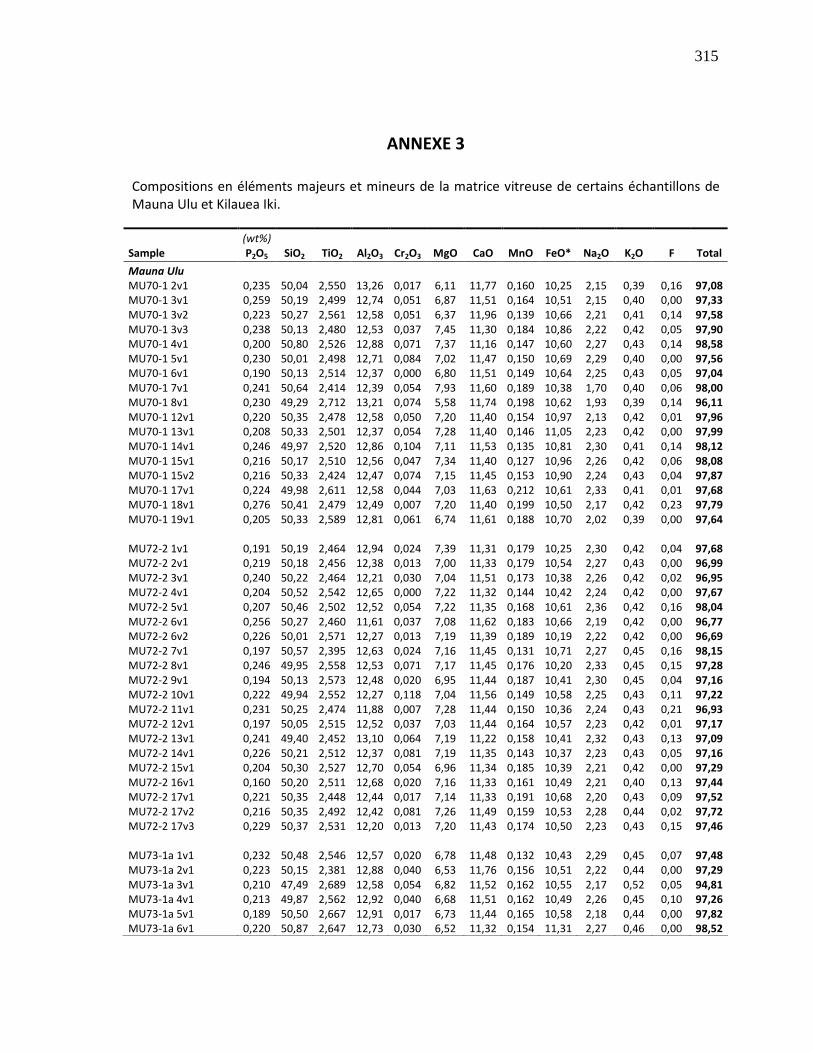
315
ANNEXE 3
Compositions en éléments majeurs et mineurs de la matrice vitreuse de certains échantillons de Mauna Ulu et Kilauea Iki.
(wt%) Sample P2O5 SiO2 TiO2 Al2O3 Cr2O3 MgO CaO MnO FeO* Na2O K2O F Total
Mauna Ulu MU70-1 2v1 0,235 50,04 2,550 13,26 0,017 6,11 11,77 0,160 10,25 2,15 0,39 0,16 97,08 MU70-1 3v1 0,259 50,19 2,499 12,74 0,051 6,87 11,51 0,164 10,51 2,15 0,40 0,00 97,33 MU70-1 3v2 0,223 50,27 2,561 12,58 0,051 6,37 11,96 0,139 10,66 2,21 0,41 0,14 97,58 MU70-1 3v3 0,238 50,13 2,480 12,53 0,037 7,45 11,30 0,184 10,86 2,22 0,42 0,05 97,90 MU70-1 4v1 0,200 50,80 2,526 12,88 0,071 7,37 11,16 0,147 10,60 2,27 0,43 0,14 98,58 MU70-1 5v1 0,230 50,01 2,498 12,71 0,084 7,02 11,47 0,150 10,69 2,29 0,40 0,00 97,56 MU70-1 6v1 0,190 50,13 2,514 12,37 0,000 6,80 11,51 0,149 10,64 2,25 0,43 0,05 97,04 MU70-1 7v1 0,241 50,64 2,414 12,39 0,054 7,93 11,60 0,189 10,38 1,70 0,40 0,06 98,00 MU70-1 8v1 0,230 49,29 2,712 13,21 0,074 5,58 11,74 0,198 10,62 1,93 0,39 0,14 96,11 MU70-1 12v1 0,220 50,35 2,478 12,58 0,050 7,20 11,40 0,154 10,97 2,13 0,42 0,01 97,96 MU70-1 13v1 0,208 50,33 2,501 12,37 0,054 7,28 11,40 0,146 11,05 2,23 0,42 0,00 97,99 MU70-1 14v1 0,246 49,97 2,520 12,86 0,104 7,11 11,53 0,135 10,81 2,30 0,41 0,14 98,12 MU70-1 15v1 0,216 50,17 2,510 12,56 0,047 7,34 11,40 0,127 10,96 2,26 0,42 0,06 98,08 MU70-1 15v2 0,216 50,33 2,424 12,47 0,074 7,15 11,45 0,153 10,90 2,24 0,43 0,04 97,87 MU70-1 17v1 0,224 49,98 2,611 12,58 0,044 7,03 11,63 0,212 10,61 2,33 0,41 0,01 97,68 MU70-1 18v1 0,276 50,41 2,479 12,49 0,007 7,20 11,40 0,199 10,50 2,17 0,42 0,23 97,79 MU70-1 19v1 0,205 50,33 2,589 12,81 0,061 6,74 11,61 0,188 10,70 2,02 0,39 0,00 97,64
MU72-2 1v1 0,191 50,19 2,464 12,94 0,024 7,39 11,31 0,179 10,25 2,30 0,42 0,04 97,68 MU72-2 2v1 0,219 50,18 2,456 12,38 0,013 7,00 11,33 0,179 10,54 2,27 0,43 0,00 96,99 MU72-2 3v1 0,240 50,22 2,464 12,21 0,030 7,04 11,51 0,173 10,38 2,26 0,42 0,02 96,95 MU72-2 4v1 0,204 50,52 2,542 12,65 0,000 7,22 11,32 0,144 10,42 2,24 0,42 0,00 97,67 MU72-2 5v1 0,207 50,46 2,502 12,52 0,054 7,22 11,35 0,168 10,61 2,36 0,42 0,16 98,04 MU72-2 6v1 0,256 50,27 2,460 11,61 0,037 7,08 11,62 0,183 10,66 2,19 0,42 0,00 96,77 MU72-2 6v2 0,226 50,01 2,571 12,27 0,013 7,19 11,39 0,189 10,19 2,22 0,42 0,00 96,69 MU72-2 7v1 0,197 50,57 2,395 12,63 0,024 7,16 11,45 0,131 10,71 2,27 0,45 0,16 98,15 MU72-2 8v1 0,246 49,95 2,558 12,53 0,071 7,17 11,45 0,176 10,20 2,33 0,45 0,15 97,28 MU72-2 9v1 0,194 50,13 2,573 12,48 0,020 6,95 11,44 0,187 10,41 2,30 0,45 0,04 97,16 MU72-2 10v1 0,222 49,94 2,552 12,27 0,118 7,04 11,56 0,149 10,58 2,25 0,43 0,11 97,22 MU72-2 11v1 0,231 50,25 2,474 11,88 0,007 7,28 11,44 0,150 10,36 2,24 0,43 0,21 96,93 MU72-2 12v1 0,197 50,05 2,515 12,52 0,037 7,03 11,44 0,164 10,57 2,23 0,42 0,01 97,17 MU72-2 13v1 0,241 49,40 2,452 13,10 0,064 7,19 11,22 0,158 10,41 2,32 0,43 0,13 97,09 MU72-2 14v1 0,226 50,21 2,512 12,37 0,081 7,19 11,35 0,143 10,37 2,23 0,43 0,05 97,16 MU72-2 15v1 0,204 50,30 2,527 12,70 0,054 6,96 11,34 0,185 10,39 2,21 0,42 0,00 97,29 MU72-2 16v1 0,160 50,20 2,511 12,68 0,020 7,16 11,33 0,161 10,49 2,21 0,40 0,13 97,44 MU72-2 17v1 0,221 50,35 2,448 12,44 0,017 7,14 11,33 0,191 10,68 2,20 0,43 0,09 97,52 MU72-2 17v2 0,216 50,35 2,492 12,42 0,081 7,26 11,49 0,159 10,53 2,28 0,44 0,02 97,72 MU72-2 17v3 0,229 50,37 2,531 12,20 0,013 7,20 11,43 0,174 10,50 2,23 0,43 0,15 97,46
MU73-1a 1v1 0,232 50,48 2,546 12,57 0,020 6,78 11,48 0,132 10,43 2,29 0,45 0,07 97,48 MU73-1a 2v1 0,223 50,15 2,381 12,88 0,040 6,53 11,76 0,156 10,51 2,22 0,44 0,00 97,29 MU73-1a 3v1 0,210 47,49 2,689 12,58 0,054 6,82 11,52 0,162 10,55 2,17 0,52 0,05 94,81 MU73-1a 4v1 0,213 49,87 2,562 12,92 0,040 6,68 11,51 0,162 10,49 2,26 0,45 0,10 97,26 MU73-1a 5v1 0,189 50,50 2,667 12,91 0,017 6,73 11,44 0,165 10,58 2,18 0,44 0,00 97,82 MU73-1a 6v1 0,220 50,87 2,647 12,73 0,030 6,52 11,32 0,154 11,31 2,27 0,46 0,00 98,52
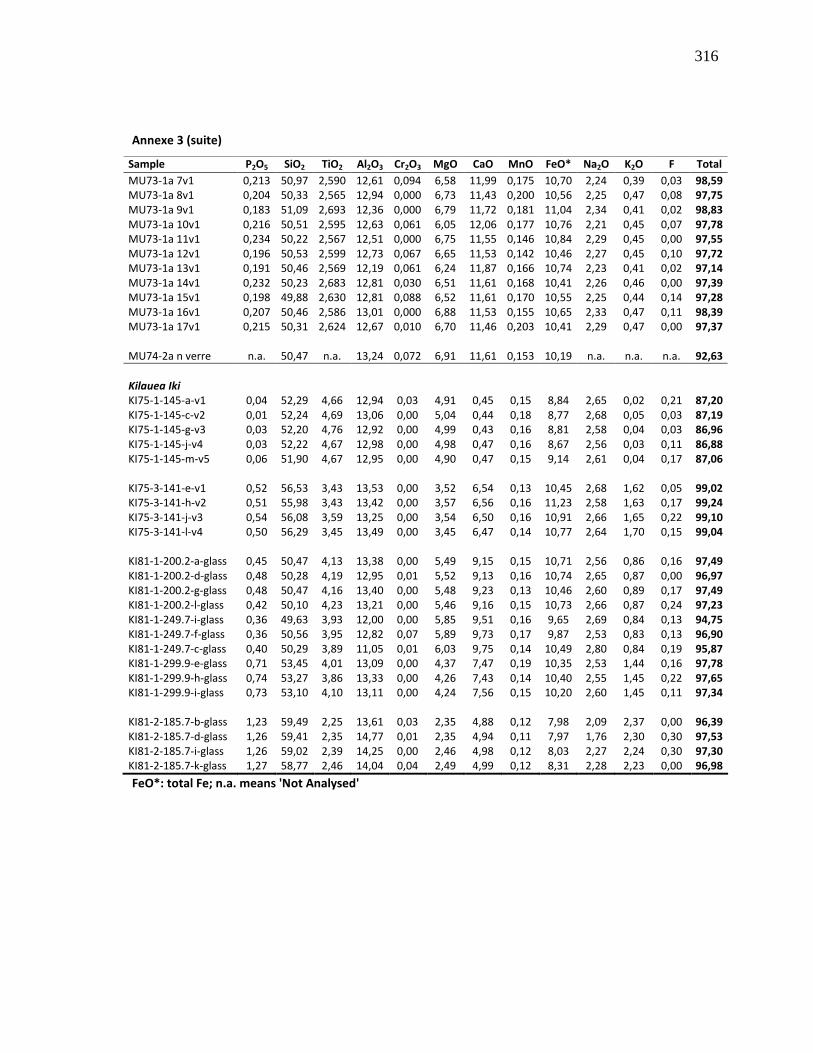
316
Annexe 3 (suite)
Sample P2O5 SiO2 TiO2 Al2O3 Cr2O3 MgO CaO MnO FeO* Na2O K2O F Total
MU73-1a 7v1 0,213 50,97 2,590 12,61 0,094 6,58 11,99 0,175 10,70 2,24 0,39 0,03 98,59 MU73-1a 8v1 0,204 50,33 2,565 12,94 0,000 6,73 11,43 0,200 10,56 2,25 0,47 0,08 97,75 MU73-1a 9v1 0,183 51,09 2,693 12,36 0,000 6,79 11,72 0,181 11,04 2,34 0,41 0,02 98,83 MU73-1a 10v1 0,216 50,51 2,595 12,63 0,061 6,05 12,06 0,177 10,76 2,21 0,45 0,07 97,78 MU73-1a 11v1 0,234 50,22 2,567 12,51 0,000 6,75 11,55 0,146 10,84 2,29 0,45 0,00 97,55 MU73-1a 12v1 0,196 50,53 2,599 12,73 0,067 6,65 11,53 0,142 10,46 2,27 0,45 0,10 97,72 MU73-1a 13v1 0,191 50,46 2,569 12,19 0,061 6,24 11,87 0,166 10,74 2,23 0,41 0,02 97,14 MU73-1a 14v1 0,232 50,23 2,683 12,81 0,030 6,51 11,61 0,168 10,41 2,26 0,46 0,00 97,39 MU73-1a 15v1 0,198 49,88 2,630 12,81 0,088 6,52 11,61 0,170 10,55 2,25 0,44 0,14 97,28 MU73-1a 16v1 0,207 50,46 2,586 13,01 0,000 6,88 11,53 0,155 10,65 2,33 0,47 0,11 98,39 MU73-1a 17v1 0,215 50,31 2,624 12,67 0,010 6,70 11,46 0,203 10,41 2,29 0,47 0,00 97,37
MU74-2a n verre n.a. 50,47 n.a. 13,24 0,072 6,91 11,61 0,153 10,19 n.a. n.a. n.a. 92,63
Kilauea Iki KI75-1-145-a-v1 0,04 52,29 4,66 12,94 0,03 4,91 0,45 0,15 8,84 2,65 0,02 0,21 87,20 KI75-1-145-c-v2 0,01 52,24 4,69 13,06 0,00 5,04 0,44 0,18 8,77 2,68 0,05 0,03 87,19 KI75-1-145-g-v3 0,03 52,20 4,76 12,92 0,00 4,99 0,43 0,16 8,81 2,58 0,04 0,03 86,96 KI75-1-145-j-v4 0,03 52,22 4,67 12,98 0,00 4,98 0,47 0,16 8,67 2,56 0,03 0,11 86,88 KI75-1-145-m-v5 0,06 51,90 4,67 12,95 0,00 4,90 0,47 0,15 9,14 2,61 0,04 0,17 87,06 KI75-3-141-e-v1 0,52 56,53 3,43 13,53 0,00 3,52 6,54 0,13 10,45 2,68 1,62 0,05 99,02 KI75-3-141-h-v2 0,51 55,98 3,43 13,42 0,00 3,57 6,56 0,16 11,23 2,58 1,63 0,17 99,24 KI75-3-141-j-v3 0,54 56,08 3,59 13,25 0,00 3,54 6,50 0,16 10,91 2,66 1,65 0,22 99,10 KI75-3-141-l-v4 0,50 56,29 3,45 13,49 0,00 3,45 6,47 0,14 10,77 2,64 1,70 0,15 99,04 KI81-1-200.2-a-glass 0,45 50,47 4,13 13,38 0,00 5,49 9,15 0,15 10,71 2,56 0,86 0,16 97,49 KI81-1-200.2-d-glass 0,48 50,28 4,19 12,95 0,01 5,52 9,13 0,16 10,74 2,65 0,87 0,00 96,97 KI81-1-200.2-g-glass 0,48 50,47 4,16 13,40 0,00 5,48 9,23 0,13 10,46 2,60 0,89 0,17 97,49 KI81-1-200.2-l-glass 0,42 50,10 4,23 13,21 0,00 5,46 9,16 0,15 10,73 2,66 0,87 0,24 97,23 KI81-1-249.7-i-glass 0,36 49,63 3,93 12,00 0,00 5,85 9,51 0,16 9,65 2,69 0,84 0,13 94,75 KI81-1-249.7-f-glass 0,36 50,56 3,95 12,82 0,07 5,89 9,73 0,17 9,87 2,53 0,83 0,13 96,90 KI81-1-249.7-c-glass 0,40 50,29 3,89 11,05 0,01 6,03 9,75 0,14 10,49 2,80 0,84 0,19 95,87 KI81-1-299.9-e-glass 0,71 53,45 4,01 13,09 0,00 4,37 7,47 0,19 10,35 2,53 1,44 0,16 97,78 KI81-1-299.9-h-glass 0,74 53,27 3,86 13,33 0,00 4,26 7,43 0,14 10,40 2,55 1,45 0,22 97,65 KI81-1-299.9-i-glass 0,73 53,10 4,10 13,11 0,00 4,24 7,56 0,15 10,20 2,60 1,45 0,11 97,34 KI81-2-185.7-b-glass 1,23 59,49 2,25 13,61 0,03 2,35 4,88 0,12 7,98 2,09 2,37 0,00 96,39 KI81-2-185.7-d-glass 1,26 59,41 2,35 14,77 0,01 2,35 4,94 0,11 7,97 1,76 2,30 0,30 97,53 KI81-2-185.7-i-glass 1,26 59,02 2,39 14,25 0,00 2,46 4,98 0,12 8,03 2,27 2,24 0,30 97,30 KI81-2-185.7-k-glass 1,27 58,77 2,46 14,04 0,04 2,49 4,99 0,12 8,31 2,28 2,23 0,00 96,98
FeO*: total Fe; n.a. means 'Not Analysed'
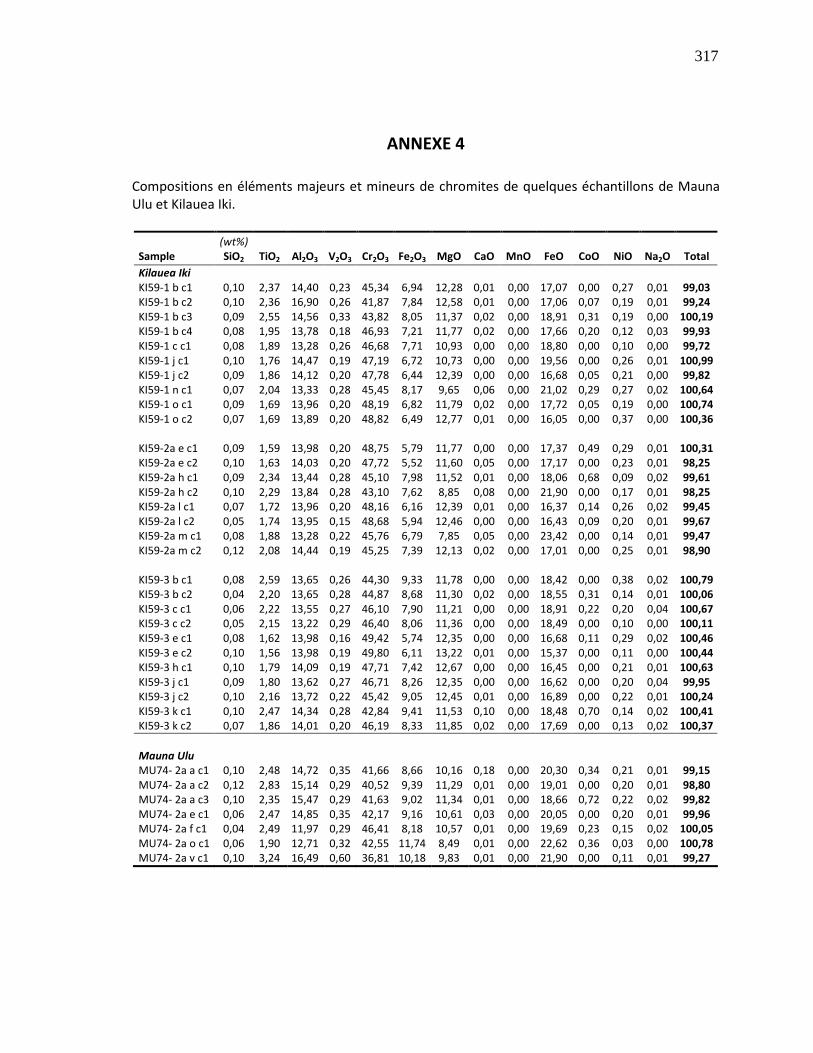
317
ANNEXE 4
Compositions en éléments majeurs et mineurs de chromites de quelques échantillons de Mauna Ulu et Kilauea Iki.
(wt%) Sample SiO2 TiO2 Al2O3 V2O3 Cr2O3 Fe2O3 MgO CaO MnO FeO CoO NiO Na2O Total
Kilauea Iki KI59-1 b c1 0,10 2,37 14,40 0,23 45,34 6,94 12,28 0,01 0,00 17,07 0,00 0,27 0,01 99,03 KI59-1 b c2 0,10 2,36 16,90 0,26 41,87 7,84 12,58 0,01 0,00 17,06 0,07 0,19 0,01 99,24 KI59-1 b c3 0,09 2,55 14,56 0,33 43,82 8,05 11,37 0,02 0,00 18,91 0,31 0,19 0,00 100,19 KI59-1 b c4 0,08 1,95 13,78 0,18 46,93 7,21 11,77 0,02 0,00 17,66 0,20 0,12 0,03 99,93 KI59-1 c c1 0,08 1,89 13,28 0,26 46,68 7,71 10,93 0,00 0,00 18,80 0,00 0,10 0,00 99,72 KI59-1 j c1 0,10 1,76 14,47 0,19 47,19 6,72 10,73 0,00 0,00 19,56 0,00 0,26 0,01 100,99 KI59-1 j c2 0,09 1,86 14,12 0,20 47,78 6,44 12,39 0,00 0,00 16,68 0,05 0,21 0,00 99,82 KI59-1 n c1 0,07 2,04 13,33 0,28 45,45 8,17 9,65 0,06 0,00 21,02 0,29 0,27 0,02 100,64 KI59-1 o c1 0,09 1,69 13,96 0,20 48,19 6,82 11,79 0,02 0,00 17,72 0,05 0,19 0,00 100,74 KI59-1 o c2 0,07 1,69 13,89 0,20 48,82 6,49 12,77 0,01 0,00 16,05 0,00 0,37 0,00 100,36 KI59-2a e c1 0,09 1,59 13,98 0,20 48,75 5,79 11,77 0,00 0,00 17,37 0,49 0,29 0,01 100,31 KI59-2a e c2 0,10 1,63 14,03 0,20 47,72 5,52 11,60 0,05 0,00 17,17 0,00 0,23 0,01 98,25 KI59-2a h c1 0,09 2,34 13,44 0,28 45,10 7,98 11,52 0,01 0,00 18,06 0,68 0,09 0,02 99,61 KI59-2a h c2 0,10 2,29 13,84 0,28 43,10 7,62 8,85 0,08 0,00 21,90 0,00 0,17 0,01 98,25 KI59-2a l c1 0,07 1,72 13,96 0,20 48,16 6,16 12,39 0,01 0,00 16,37 0,14 0,26 0,02 99,45 KI59-2a l c2 0,05 1,74 13,95 0,15 48,68 5,94 12,46 0,00 0,00 16,43 0,09 0,20 0,01 99,67 KI59-2a m c1 0,08 1,88 13,28 0,22 45,76 6,79 7,85 0,05 0,00 23,42 0,00 0,14 0,01 99,47 KI59-2a m c2 0,12 2,08 14,44 0,19 45,25 7,39 12,13 0,02 0,00 17,01 0,00 0,25 0,01 98,90 KI59-3 b c1 0,08 2,59 13,65 0,26 44,30 9,33 11,78 0,00 0,00 18,42 0,00 0,38 0,02 100,79 KI59-3 b c2 0,04 2,20 13,65 0,28 44,87 8,68 11,30 0,02 0,00 18,55 0,31 0,14 0,01 100,06 KI59-3 c c1 0,06 2,22 13,55 0,27 46,10 7,90 11,21 0,00 0,00 18,91 0,22 0,20 0,04 100,67 KI59-3 c c2 0,05 2,15 13,22 0,29 46,40 8,06 11,36 0,00 0,00 18,49 0,00 0,10 0,00 100,11 KI59-3 e c1 0,08 1,62 13,98 0,16 49,42 5,74 12,35 0,00 0,00 16,68 0,11 0,29 0,02 100,46 KI59-3 e c2 0,10 1,56 13,98 0,19 49,80 6,11 13,22 0,01 0,00 15,37 0,00 0,11 0,00 100,44 KI59-3 h c1 0,10 1,79 14,09 0,19 47,71 7,42 12,67 0,00 0,00 16,45 0,00 0,21 0,01 100,63 KI59-3 j c1 0,09 1,80 13,62 0,27 46,71 8,26 12,35 0,00 0,00 16,62 0,00 0,20 0,04 99,95 KI59-3 j c2 0,10 2,16 13,72 0,22 45,42 9,05 12,45 0,01 0,00 16,89 0,00 0,22 0,01 100,24 KI59-3 k c1 0,10 2,47 14,34 0,28 42,84 9,41 11,53 0,10 0,00 18,48 0,70 0,14 0,02 100,41 KI59-3 k c2 0,07 1,86 14,01 0,20 46,19 8,33 11,85 0,02 0,00 17,69 0,00 0,13 0,02 100,37
Mauna Ulu MU74- 2a a c1 0,10 2,48 14,72 0,35 41,66 8,66 10,16 0,18 0,00 20,30 0,34 0,21 0,01 99,15 MU74- 2a a c2 0,12 2,83 15,14 0,29 40,52 9,39 11,29 0,01 0,00 19,01 0,00 0,20 0,01 98,80 MU74- 2a a c3 0,10 2,35 15,47 0,29 41,63 9,02 11,34 0,01 0,00 18,66 0,72 0,22 0,02 99,82 MU74- 2a e c1 0,06 2,47 14,85 0,35 42,17 9,16 10,61 0,03 0,00 20,05 0,00 0,20 0,01 99,96 MU74- 2a f c1 0,04 2,49 11,97 0,29 46,41 8,18 10,57 0,01 0,00 19,69 0,23 0,15 0,02 100,05 MU74- 2a o c1 0,06 1,90 12,71 0,32 42,55 11,74 8,49 0,01 0,00 22,62 0,36 0,03 0,00 100,78 MU74- 2a v c1 0,10 3,24 16,49 0,60 36,81 10,18 9,83 0,01 0,00 21,90 0,00 0,11 0,01 99,27
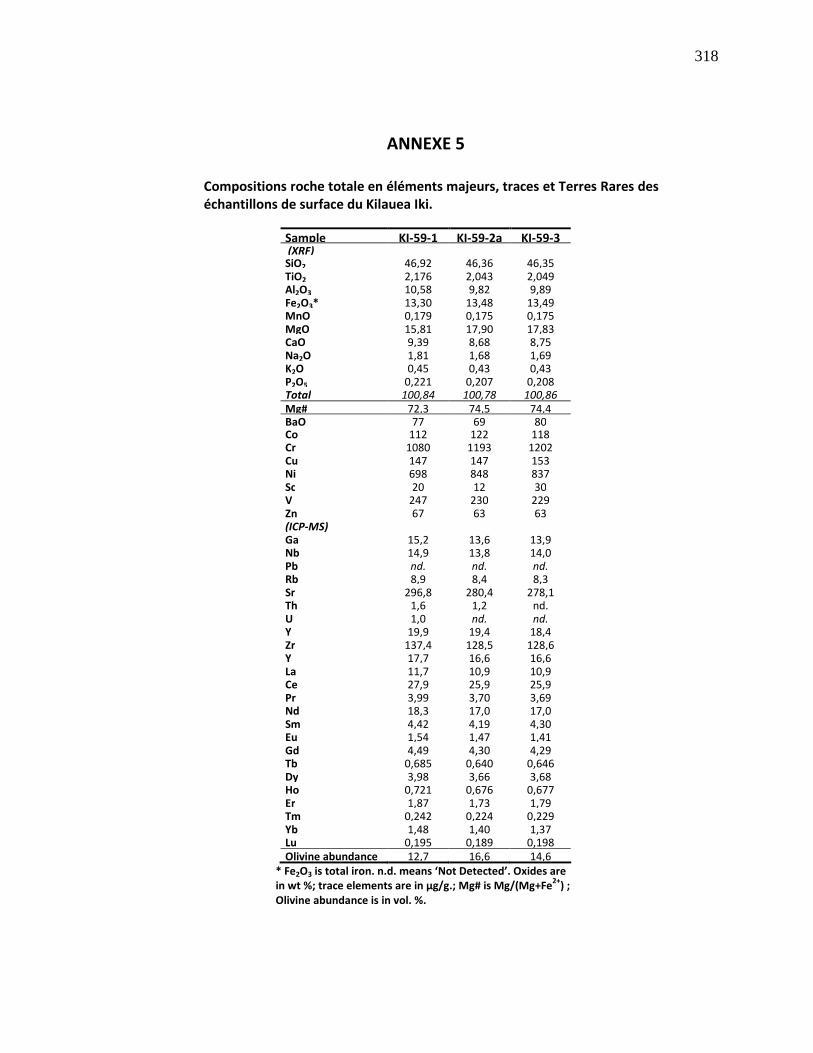
318
ANNEXE 5
Compositions roche totale en éléments majeurs, traces et Terres Rares des échantillons de surface du Kilauea Iki.
Sample KI-59-1 KI-59-2a KI-59-3 (XRF) SiO2 46,92 46,36 46,35 TiO2 2,176 2,043 2,049 Al2O3 10,58 9,82 9,89 Fe2O3* 13,30 13,48 13,49 MnO 0,179 0,175 0,175 MgO 15,81 17,90 17,83 CaO 9,39 8,68 8,75 Na2O 1,81 1,68 1,69 K2O 0,45 0,43 0,43 P2O5 0,221 0,207 0,208 Total 100,84 100,78 100,86
Mg# 72,3 74,5 74,4 BaO 77 69 80 Co 112 122 118 Cr 1080 1193 1202 Cu 147 147 153 Ni 698 848 837 Sc 20 12 30 V 247 230 229 Zn 67 63 63 (ICP-MS) Ga 15,2 13,6 13,9 Nb 14,9 13,8 14,0 Pb nd. nd. nd.
Rb 8,9 8,4 8,3 Sr 296,8 280,4 278,1 Th 1,6 1,2 nd. U 1,0 nd. nd.
Y 19,9 19,4 18,4 Zr 137,4 128,5 128,6 Y 17,7 16,6 16,6 La 11,7 10,9 10,9 Ce 27,9 25,9 25,9 Pr 3,99 3,70 3,69 Nd 18,3 17,0 17,0 Sm 4,42 4,19 4,30 Eu 1,54 1,47 1,41 Gd 4,49 4,30 4,29 Tb 0,685 0,640 0,646 Dy 3,98 3,66 3,68 Ho 0,721 0,676 0,677 Er 1,87 1,73 1,79 Tm 0,242 0,224 0,229 Yb 1,48 1,40 1,37 Lu 0,195 0,189 0,198 Olivine abundance 12,7 16,6 14,6
* Fe2O3 is total iron. n.d. means ‘Not Detected’. Oxides are in wt %; trace elements are in µg/g.; Mg# is Mg/(Mg+Fe
2+) ;
Olivine abundance is in vol. %.